")
Back to Journals » Journal of Inflammation Research » Volume 17
The Critical Role of Pyroptosis in Peri-Implantitis
Authors Chen L, Tang Z , Fu L, Xie Y, Xu J , Xia H, Xia T, Wang M
Received 9 December 2023
Accepted for publication 5 March 2024
Published 12 March 2024 Volume 2024:17 Pages 1621—1642
DOI https://doi.org/10.2147/JIR.S450706
Checked for plagiarism Yes
Review by Single anonymous peer review
Peer reviewer comments 2
Editor who approved publication: Dr Tara Strutt
Liangwen Chen,1,2,* Ziqiao Tang,1,* Liangliang Fu,1 Yang Xie,1 Junyi Xu,1 Haibin Xia,1,3 Ting Xia,3 Min Wang1,3
1State Key Laboratory of Oral & Maxillofacial Reconstruction and Regeneration, Key Laboratory of Oral Biomedicine Ministry of Education, Hubei Key Laboratory of Stomatology, School & Hospital of Stomatology, Wuhan University, Wuhan, People’s Republic of China; 2Center for Prosthodontics and Implant Dentistry, Optics Valley Branch, School and Hospital of Stomatology, Wuhan University, Wuhan, People’s Republic of China; 3Department of Oral Implantology, School & Hospital of Stomatology, Wuhan University, Wuhan, People’s Republic of China
*These authors contributed equally to this work
Correspondence: Ting Xia; Min Wang, Department of Dental Implantology, School & Hospital of Stomatology, Wuhan University, 237 Luoyu Road, Wuhan, Hubei Province, 430079, People’s Republic of China, Email [email protected]; [email protected]
Background: Peri-implantitis (PI) is a prevalent complication of implant treatment. Pyroptosis, a distinctive inflammatory programmed cell death, is crucial to the pathophysiology of PI. Despite its importance, the pyroptosis-related genes (PRGs) influencing PI’s progression remain largely unexplored.
Methods: This study conducted histological staining and transcriptome analyze from three datasets. The intersection of differentially expressed genes (DEGs) and PRGs was identified as pyroptosis-related differentially expressed genes (PRDEGs). Functional enrichment analyses were conducted to shed light on potential underlying mechanisms. Weighted Gene Co-expression Network Analysis (WGCNA) and a pyroptotic macrophage model were utilized to identify and validate hub PRDEGs. Immune cell infiltration in PI and its relationship with hub PRDEGs were also examined. Furthermore, consensus clustering was performed to identify new PI subtypes. Protein-protein interaction (PPI) network, competing endogenous RNA (ceRNA) network, mRNA-mRNA binding protein regulatory (RBP) network, and mRNA-drugs regulatory network of hub PRDEGs were also analyzed.
Results: Eight hub PRDEGs were identified: PGF, DPEP1, IL36B, IFIH1, TCEA3, RIPK3, NET7, and TLR3, which are instrumental in the PI’s progression. Two PI subtypes were distinguished, with Cluster 1 exhibiting higher immune cell activation. The exploration of regulatory networks provided novel mechanisms and therapeutic targets in PI.
Conclusion: Our research highlights the critical role of pyroptosis and identifies eight hub PRDEGs in PI’s progression, offering insights into novel immunotherapy targets and laying the foundation for advanced diagnostic and treatment strategies. This contributes to our understanding of PI and underscores the potential for personalized clinical management.
Keywords: peri-implantitis, pyroptosis, consensus clustering, immune cell infiltration, regulatory network
Introduction
Peri-implantitis (PI), an inflammatory disease mainly induced by bacterial infection, has been recognized as a primary culprit for implant treatment failure.1 The prevalence of this disease in the population receiving implant treatment is alarming. Investigations indicate that among those who have undergone such treatment, 60% suffer from peri-implant mucositis, and 15% are afflicted with PI.2 The early symptoms of inflammation around dental implant present as mucosal inflammation, with red and swollen gums and bleeding on probing. As the disease progresses, it could lead to alveolar bone resorption, loss of bone-implant osseointegration, ultimately resulting in the loosening and detachment of the implant.3 Recent studies have highlighted the potential roles of biomarkers and mediators in the pathogenesis and progression of periodontitis and peri-implantitis, notably NT-PRO-BNP and TGF-β1. NT-PRO-BNP, traditionally associated with cardiac function assessment, has been observed to reflect systemic inflammatory responses that may influence periodontal disease progression.4 Similarly, TGF-beta1, known for its critical functions in tissue repair and immune regulation, has been implicated in the pathogenesis of periodontitis and peri-implantitis, suggesting its involvement in the inflammatory response in periodontal diseases.5
Pyroptosis, also known as inflammatory cell death, is a form of programmed cell death characterized by cell swelling, rupture of the cytoplasmic membrane, and release of cellular contents, which could lead to the generation of inflammatory response.6 The classical pyroptosis mechanism involves the formation of inflammasomes, whereby activated Caspase-1 cleaves the gasdermin D (GSDMD) protein. This results in the formation of an active GSDMD-N fragment. GSDMD-N then induces the formation of pores on the cell surface, subsequently leading to pyroptosis.7
Cell pyroptosis is an important pathological process involved in many diseases, such as infectious diseases,8 autoimmune diseases,9,10 and cardiovascular diseases.11 Therefore, analyzing its mechanism could facilitate a deeper understanding of the pathological process of these diseases and the research for new treatment methods. In infectious diseases, many pathogens, such as bacteria and viruses, can trigger host cell pyroptosis by activating NLRP3 inflammasome.12 This not only eliminates the pathogens, but also stimulates the release of inflammatory cytokines such as IL1B, which further mobilizes immune cells and amplifies the host’s immune response. Nevertheless, this process also exacerbates cell death and tissue destruction.
Currently, increasing attention is being directed towards understanding the role of cell pyroptosis in PI. Chen et al reported elevated expression of pyroptosis-related markers, Caspase-3 and GSDMD-E, in the soft tissue affected by PI.13 Furthermore, Yang et al noted the presence of activated inflammasomes and occurrences of cell pyroptosis in cases of alveolar bone loss caused by inflammation.14 Additional cellular studies have demonstrated that pyroptosis occurs when gingival fibroblast15 and macrophages16 are subjected to inflammatory stimuli. However, to date, no studies have elucidated the expression of key genes related to pyroptosis, the regulation of signaling pathways, and immune cell infiltration during the progression of PI.
The role of cell pyroptosis in PI remains largely unexplored, necessitating further research to clarify its implications. As PI significantly impacts patients’ oral health and quality of life, understanding its pathogenesis is crucial for enhancing clinical treatments. Investigating the alterations in pyroptosis-related genes with PI could lead to the identification of novel diagnostic markers and therapeutic avenues, ultimately improving clinical management and patient outcomes. In this study, we employ a comprehensive methodology to clarify the key genes involved in cell pyroptosis, the regulation of signaling pathways, disease subtypes and immune cell infiltration in PI. Our primary hypothesis is that cell pyroptosis plays an important role in the progression of PI, enhancing immune cell infiltration and promoting the onset and development of inflammation. The aim of this study is to elucidate the role of cell pyroptosis-related genes in the progression of PI, with the ultimate goal of enhancing the diagnostic process and informing the development of personalized clinical management strategies for PI and its subtypes.
Materials and Methods
Tissue Acquisition
We collected clinically diagnosed PI and healthy peri-implant soft tissue samples. For PI samples, the inclusion criteria were clinical signs of inflammation, bleeding on probing or suppuration, and radiographic crestal bone loss > 3 mm;17 the exclusion criteria was radiographic crestal bone loss < 3mm. We obtained PI soft tissues using an inverse bevel incision technique that extended to the base of peri-implant pocket. For healthy samples, the inclusion criteria were absence of erythema, bleeding on probing, swelling and suppuration, and no radiographic bone loss; the exclusion criteria were signs of erythema, bleeding on probing, swelling and suppuration, or radiographic bone loss. We collected healthy samples during the second-stage implant surgery. The soft tissue located above the implant was harvested using a trephine drill upon exposure of the implant platform.13,18 This study was approved by the Ethics Committee of School & Hospital of Wuhan University, approval number: 2023(A25). Informed consents were obtained from all patients prior to the collection of clinical samples.
Immunohistochemical and Immunofluorescence Analysis
Both immunohistochemical (IHC) and immunofluorescence (IF) analyses were performed on PI and healthy soft tissue samples to investigate the expression of pyroptosis markers GSDMD, Caspase-1, and IL1B proteins. For both analyses, tissue sections were prepared and subjected to antigen retrieval. Sections were then incubated overnight at 4°C with primary antibodies specific to the respective proteins. After rinsing, secondary antibodies were applied.
In the IHC analysis, secondary antibodies conjugated with a chromogen were used to detect GSDMD protein expression. Staining intensity was measured using image analysis software with a standardized scoring system, and statistical analysis was performed to assess significant differences in GSDMD expression between inflamed and healthy tissues. In the IF analysis, fluorescent secondary antibodies were applied to visualize Caspase-1 (red fluorescence) and IL1B (green fluorescence). Cell nuclei were stained with DAPI (blue). The stained sections were observed under a fluorescence microscope.
Dataset Acquisition and Preprocessing
The PI-related datasets GSE33774,19 GSE 106090,20 GSE 5763121 were downloaded from the GEO database using the R package GEOquery.22 These datasets are derived from Homo sapiens. Specifically, GSE33774 comprises 7 PI samples and 8 healthy control samples, GSE 107090 consists of 6 PI samples and 6 control samples, and GSE57631 contains 6 PI samples and 2 control samples. All PI and control samples from these datasets were included in this study. To address batch effects, the R package sva was utilized to perform batch correction on the GSE33774, GSE106090, and GSE57631 datasets.23 This process resulted in the generation of an integrated dataset containing 19 PI samples and 16 control samples. Finally, the integrated dataset was processed using the R package limma, applying probe annotation and standardization techniques for normalization.
Pyroptosis-related genes were collected from the GeneCards24 and GSEA databases.25 Using “Pyroptosis” as the keyword, “Protein Coding” genes were retained from GeneCards, yielding 338 genes. The GSEA database search with the same keyword resulted in 27 genes from the REACTOME_PYROPTOSIS dataset. After merging and removing duplicates, a final set of 338 pyroptosis-related genes was obtained. See Table S1 for details.
Differentially Expressed Genes (DEGs) Associated with PI
Using the previously defined groups (PI and control) within the integrated dataset, differential gene expression analysis was conducted using the R package DESeq2.26 The threshold for differentially expressed genes (DEGs) was set as |logFC| > 0.5 and p-value < 0.05. To identify PI-associated pyroptosis-related differentially expressed genes (PRDEGs), we intersected all DEGs from the integrated dataset with pyroptosis-related genes, visualized in a Venn diagram. Differential expression results were further depicted with a volcano plot and heatmap using the R package ggplot2 and pheatmap, respectively, and a chromosome location was plotted with RCircos.27
Gene Ontology and Kyoto Encyclopedia of Genes and Genomes Enrichment Analysis
The functional enrichment of PRDEGs was investigated using Gene Ontology (GO) and Kyoto Encyclopedia of Genes and Genomes (KEGG) analyses. GO analysis, which includes Biological Process (BP), Molecular Function (MF), and Cell Component (CC), is an established method for genome function studies.28 KEGG is a comprehensive database covering genomic information, biological pathways, diseases, and more.29 We used the R package clusterProfiler for both GO and KEGG analyses,30 selecting enriched entries with a p-value and false discovery rate (FDR) of less than 0.05, corrected using the Benjamini-Hochberg method. The resulting enriched KEGG pathways were visualized with the R package Pathview.31
Gene Set Enrichment and Variation Analysis of the Integrated Dataset
We performed both Gene Set Enrichment Analysis (GSEA)25 and Gene Set Variation Analysis (GSVA)32 on the integrated dataset to assess the contribution and variation of pre-defined gene sets across samples. GSEA was performed using the R package clusterProfiler and p-value adjustment method = Benjamini-Hochberg. The gene sets were based on the c2.cp.v7.2.symbols.gmt collection from the Molecular Signatures Database (MsigDB).33 Significantly enriched gene sets were identified with adjust p-value < 0.05 and FDR < 0.25. Subsequently, GSVA was performed using the h.all.v7.4.symbols.gmt gene set from the MsigDB to evaluate differences in pathway enrichment between PI and control groups. Significant enrichment was determined by p-value < 0.05.
Weighted Gene Association Network Analysis
Weighted correlation network analysis (WGCNA) identifies gene sets displaying coordinated changes and potential biomarker genes based on their connectivity within gene sets and association with phenotypes. Using the R package WGCNA,34 we performed WGCNA on the integrated dataset, first calculating pairwise correlation coefficients between any two genes and adjusting the connectivity between genes to form a scale-free network. We then constructed a hierarchical clustering tree, with different branches representing different gene modules. Module significance was calculated. The minimum module size was set to 25, the optimal soft threshold was 15, and the module merge cut height was set to 0.2, and the minimum distance was set to 0.2. The correlation between the PI group, the control group and different modules was measured, and the genes within each module were considered module eigengenes. We selected the top two modules with the largest |cor value|, and visualized the intersection of all genes within each module and the PRDEGs using Venn diagrams. Intersection genes were considered hub PRDEGs.
Pyroptotic Macrophage Model Construction and Verification
The THP-1 cells were cultured in RPMI-1640 medium at 37°C, 5% CO2, and macrophages differentiation was induced with 100 ng/mL phorbol 12-myristate 13-acetate for 24h. Afterwards, cells were divided into two groups: inflammation-induced group treated with 1 μg/mL LPS (Sigma-Aldrich) for 5.5 h and 5 mM ATP (PeproTech) for 0.5 h, and a control group refreshed with culture medium.
For verification, both groups underwent a CCK-8 assay at 2h, 4h, and 12h post-treatment to evaluate cell viability and proliferation. Additionally, a Western blot analysis was conducted on pyroptosis marker proteins. Cells were harvested and lysed, protein concentration was measured, and equal amounts of protein underwent SDS-PAGE and transferred to a PVDF membrane. The membrane was incubated with primary antibodies against NLRP3 (1:1000, Abclonal) and ASC (1:1000, Abclonal), followed by HRP-conjugated secondary antibodies. Protein bands were visualized and quantified, with relative protein expression levels of NLRP3 and ASC normalized to GAPDH. Statistical analysis was employed to determine significant differences between the groups.
Quantitative Reverse Transcription Polymerase Chain Reaction (qRT-PCR) Analysis
Macrophage RNA was extracted using the HP Total RNA Kit (Omega Bio-Tek, Norcross, GA, USA) and reverse transcribed into cDNA with the HiScript II qRT SuperMix II (Vazyme, Nanjing, China). The cDNA was amplified on the QuantStudio 6 Flex System (Thermo Fisher Scientific, USA) using the ChamQ Universal SYBR qPCR Master Mix (Vazyme). GAPDH- normalized relative expression levels were determined using the 2-ΔΔCT method. Primer sequences are listed in Table S2. Data is represented as mean ± standard deviation, and statistical comparisons were made using Student’s t-test, with a significance threshold of P < 0.05.
Consensus Clustering and ROC Curve Validation of PI Subtypes
We employed a resampling-based algorithm, consensus clustering,35 to identify and validate robust subgroups within PI samples using the R package ConsensusClusterPlus.36 By leveraging sampling-induced variability, we performed multiple iterations on a subset of the dataset to measure clustering stability and inform parameter decisions, then identified distinct disease subtypes of PI based on hub PRDEGs. Furthermore, we validated these findings by plotting Receiver Operating Characteristic (ROC) curves for each hub PRDEG against the subtypes using the R package pROC.37 This graphical analysis tool allowed us to comprehensively assess the relationship between sensitivity and specificity of the hub genes in differentiating the PI subtypes.
Immunocytes Infiltration Analysis
We used the R package IOBR to compute the ESTIMATE immune and stromal scores for the integrated dataset.38 ESTIMATE algorithm quantifies the immune and stromal components by calculating the immune score, stromal score, and ESTIMATE score based on the expression matrix.
Following this, we employed Single-Sample Gene-Set Enrichment Analysis (ssGSEA) to quantify the relative abundance of immune cell infiltration. Firstly, we identified and labeled various immune cell types.39 Then, leveraging the ssGSEA analysis, we calculated the enrichment scores to represent the relative abundance of immunocyte infiltration in each sample. Finally, the R package ggplot2 was employed to generate separate group comparison plots for these immune infiltration analyses, demonstrating the expression differences in the subgroups of PI samples in the integrated dataset.
Consolidated Analysis of Regulatory Networks of Hub PRDEGs
The regulatory networks involving hub PRDEGs were explored using various resources. First, a Protein-Protein Interaction (PPI) network was built utilizing the STRING database, representing interactions among proteins with a minimum required interaction score above 0.150.40 Next, we analyzed the Competing Endogenous RNA (ceRNA) network, which encapsulates the interactions between miRNAs, lncRNAs, and hub PRDEGs. We obtained miRNAs related to hub PRDEGs and lncRNAs associated with these miRNAs from the StarBase database,41 leading to the construction of the ceRNA network.
Further, we constructed mRNA-RNA-Binding Protein (RBP) and mRNA-drug networks. RBPs are crucial regulators in gene regulation,42 and we predicted the target RBPs for hub PRDEGs using the StarBase database. Lastly, by leveraging the Comparative Toxicogenomics Database (CTD), we predicted direct and indirect drug targets of hub PRDEGs to understand the interactions between hub PRDEGs and potential therapeutic agents.43 All these PPI, ceRNA, mRNA-RBP, and mRNA-drug networks, were visualized using Cytoscape software.44
Statistical Analysis
All data processing and analyses in this article were performed using R software (version 4.2.0). Continuous variables are presented as mean ± standard deviation. The comparisons between two groups of continuous variables were conducted using Wilcoxon Rank Sum Test. Comparisons between two groups of categorical variables were conducted using Chi-square test or Fisher’s exact test. Unless otherwise specified, the results were calculated by Spearman correlation analysis for correlation coefficients between different molecules expression. All results were determined by p value < 0.05 as the criterion for significant difference.
Results
Subsection Histological Staining
The flow chart for the comprehensive analysis is illustrated in Figure 1. Histological staining was performed on the collected peri-implant soft tissues. Figure 2A presents a schematic diagram of the method used to obtain soft tissue from around the implant. Hematoxylin and eosin (H&E) staining results revealed extensive immune cell infiltration in the PI group. IHC staining demonstrated that the expression of the pyroptosis marker gene GSDMD was significantly elevated in the soft tissues of the PI group compared to the control group (Figure 2B). Quantitative analysis of the IHC GSDMD staining results at 20x magnification revealed its significant overexpression in the PI group (Figure 2C).
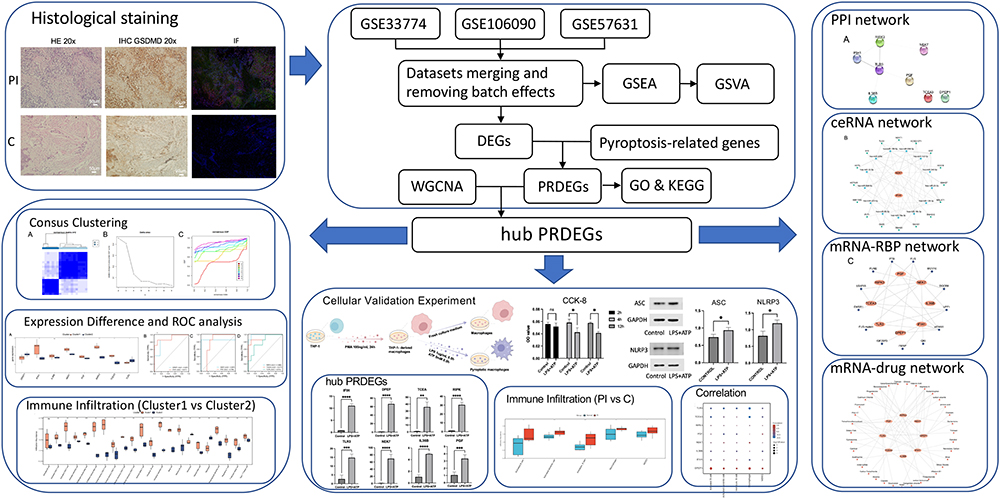 |
Figure 1 Flow Chart for the Comprehensive Analysis of PRDEGs of PI. “*” denotes p-value < 0.05, “**” denotes p-value < 0.01, “***” denotes p-value < 0.001, “****” denotes p-value < 0.0001. Abbreviations: PI, peri-implantitis; HE, Hematoxylin and eosin; IHC, Immunohistochemistry; IF, Immunofluorescence; DEGs, Differentially expressed genes; GSEA, Gene set enrichment analysis; GSVA, Gene set variation analysis; WGCNA, Weighted gene co-expression network analysis; PRDEGs, pyroptosis-related differentially expressed genes; GO, Gene ontology; KEGG, Kyoto encyclopedia of genes and genomes; CCK-8, Cell counting kit-8; ROC, Receiver operating characteristic; PPI network, Protein-protein interaction network; ceRNA network, Competing endogenous RNA network; RBP, RNA-binding protein. |
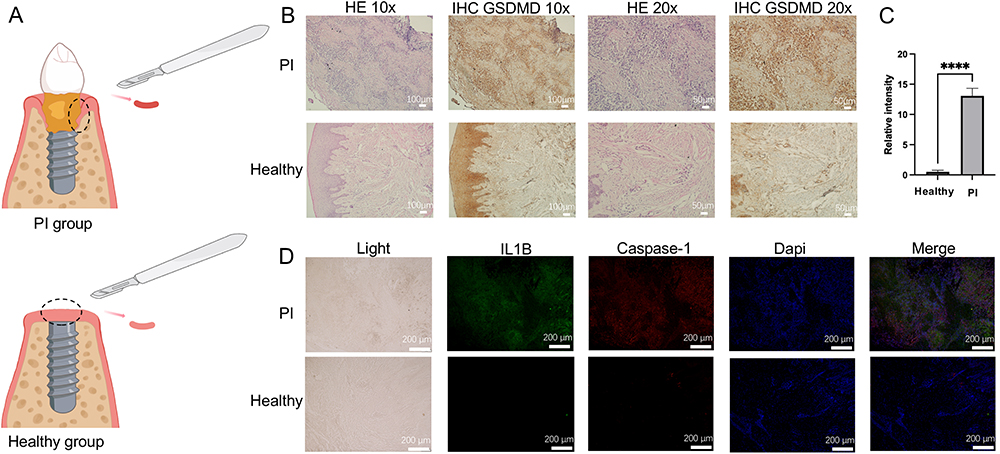 |
Figure 2 Clinical sample collection and histological staining analysis. (A) Diagram illustrating the collection of inflamed tissue and healthy tissue. (B) HE and GSDMD IHC staining results. Scale bars represent 100 μm and 50 μm for images at 10x and 20x magnification, respectively. (C) Quantitative comparison of GSDMD IHC staining areas at 20x magnification. (D) IF staining of IL1B (green), Caspase-1 (red), and cell nuclei (blue) in samples. Scale bar = 200 μm. “****” denotes p-value < 0.0001. Abbreviations: PI, peri-implantitis; GSDMD, Gasdermin D; HE, Hematoxylin and eosin; IHC, Immunohistochemistry; IF, Immunofluorescence. |
In the immunofluorescence staining, the pyroptosis-related genes IL1B and Caspase-1 were notably brighter in the PI group, indicating their higher expression in PI tissue (Figure 2D). These results demonstrated that the pyroptosis marker proteins GSDMD, IL1B, and Caspase-1 are overexpressed in PI tissue.
Data Integration of PI Datasets
After integrating PI datasets GSE33774, GSE106090, and GSE57631, we evaluate the effectiveness of batch effect removal. Both the distribution boxplots (Figure S1A and B) and the 3D Principal Component Analysis (PCA) plots (Figure S1C and D) indicated that the batch effects in the integrated dataset were largely eliminated after the removal process. Following this, we conducted a differential gene expression analysis between PI and control groups, which revealed 1483 DEGs, including 753 upregulated and 730 downregulated genes (Figure 3A). Further intersection with pyroptosis-related genes identified 23 PRDEGs (Figure 3B). The expression differences between different groups within the integrated dataset were visualized using a heatmap (Figure 3C). The genomic locations of these PRDEGs were also examined, revealing specific associations with multiple chromosomes (Figure 3D).
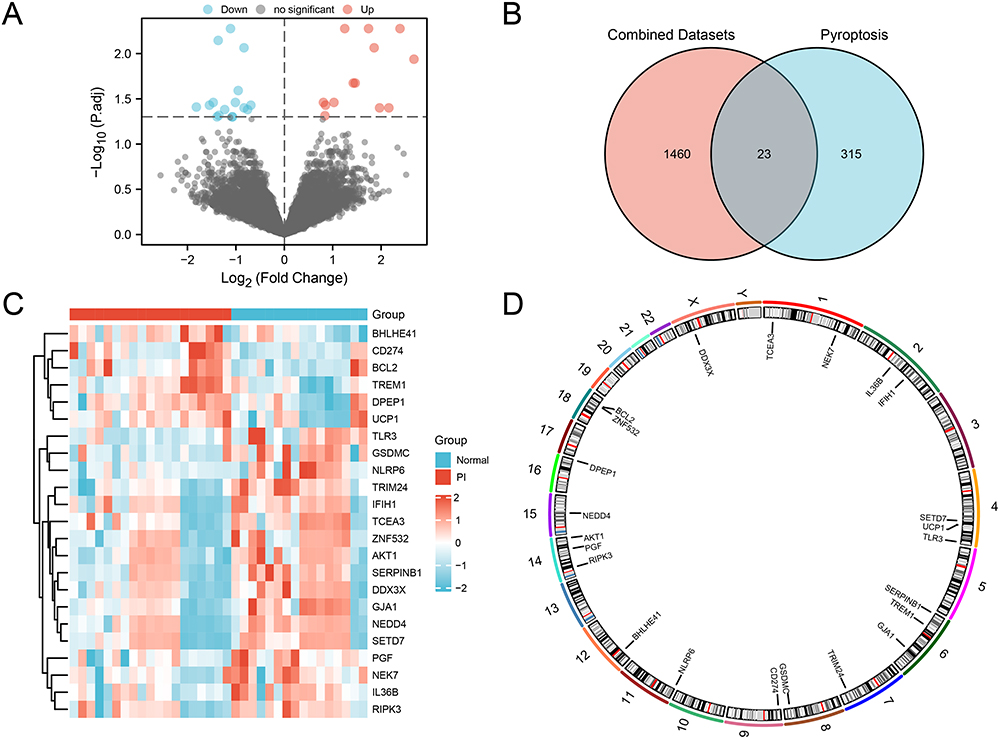 |
Figure 3 Differential Gene Expression Analysis in the integrated dataset. (A) Volcano plot of DEG analysis between PI and control groups. (B) Venn diagram of DEGs and PRGs in the integrated dataset. (C) Heatmap of correlation among PRDEGs in the integrated GEO dataset. (D) Chromosomal localization of PRDEGs. Blue represents the Normal control group, and red represents the PI group. Abbreviations: DEGs: Differentially expressed genes; PRG: Pyroptosis-related genes. |
GO and KEGG Functional Enrichment Analysis of PRDEGs
Functional enrichment analysis of the 23 PRDEGs revealed significant association with several BP, MF, CC, and pathways, and the specific results were shown in Table S3. The PRDEGs were primarily enriched in BP such as I-kappaB kinase/NF-kappaB signaling, positive regulation of interferon-beta production, response to reactive oxygen species, regulation of I-kappaB kinase/NF-kappaB signaling, and T cell homeostasis. Enrichment in CC was observed in the mitochondrial outer membrane, organelle outer membrane, and outer membrane. MF showed enrichment in scaffold protein binding, phospholipid binding, channel inhibitor activity, protein phosphatase 2A binding, and double-stranded RNA binding. Additionally, the PRDEGs were found to be highly associated with Hepatitis B, NOD-like receptor signaling pathway, and Measles pathways.
The results of GO and KEGG enrichment analysis were visualized through bar graphs (Figure 4A). Additionally, network diagram for GO (Figure 4B) and KEGG (Figure 4C) were constructed based on the enrichment analysis results. Larger nodes in the network diagrams denote more molecules associated with the entry. Additionally, the results of KEGG enrichment analysis for Hepatitis B, NOD-like receptor signaling pathway, and Measles were visualized in pathway maps (Figure S2).
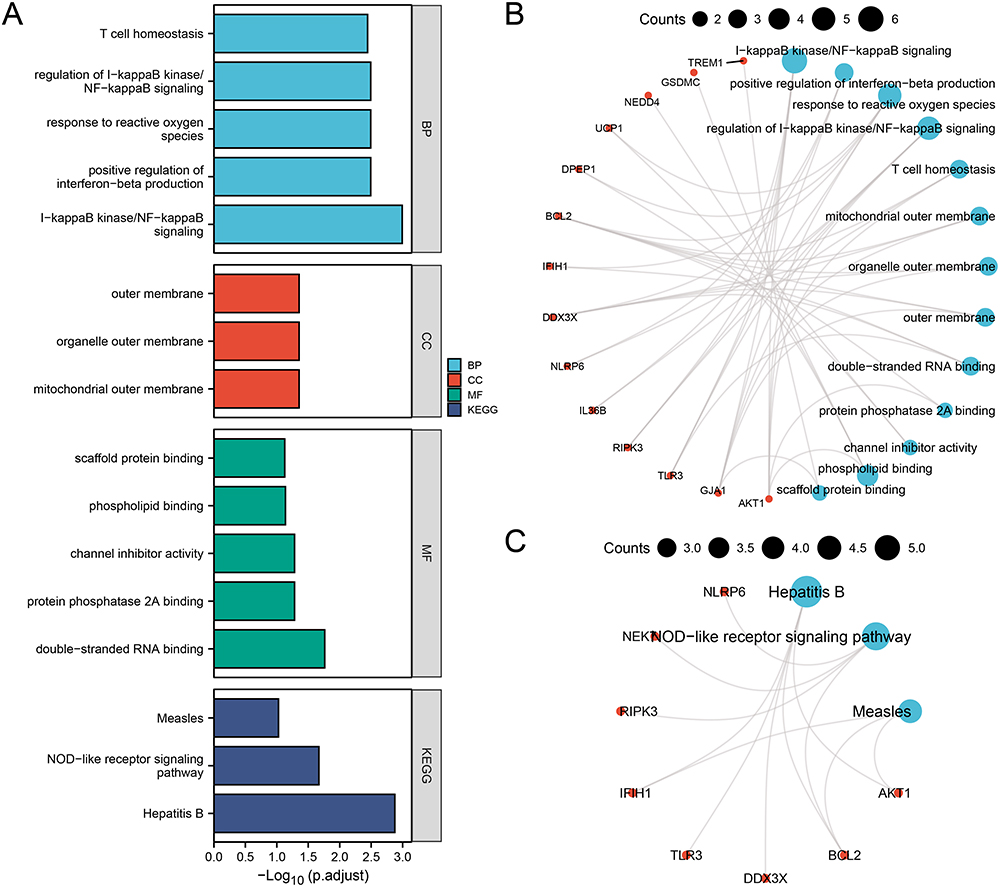 |
Figure 4 GO and KEGG Enrichment Analysis of PRDEGs. (A) Bar chart of the GO and KEGG enrichment analysis results for PRDEGs: BP, CC, MF, and signaling pathways. (B-C) Network diagram of the GO (B) and KEGG (C) enrichment analysis results of PRDEGs. Blue notes represent entries, red nodes represent molecules, and lines represent relationships between entries and molecules. Abbreviations: GO: Gene ontology; KEGG: Kyoto encyclopedia of genes and genomes; BP: Biological process; CC: Cellular component; MF: Molecular function. |
GSEA of PRDEGs
To determine the impact of gene expression levels on PI in the integrated dataset, GSEA was performed to explore the relationship between gene expression and the involved biological process, cellular component, and molecular function (Figure 5A). The specific results were shown in Table S4. The results revealed that all genes in the integrated dataset significantly influenced biological functions and signaling pathways such as the NO2IL12 Pathway (Figure 5B), IL12 2Pathway (Figure 5C), Signaling by Wnt (Figure 5D), and Autophagy (Figure 5E).
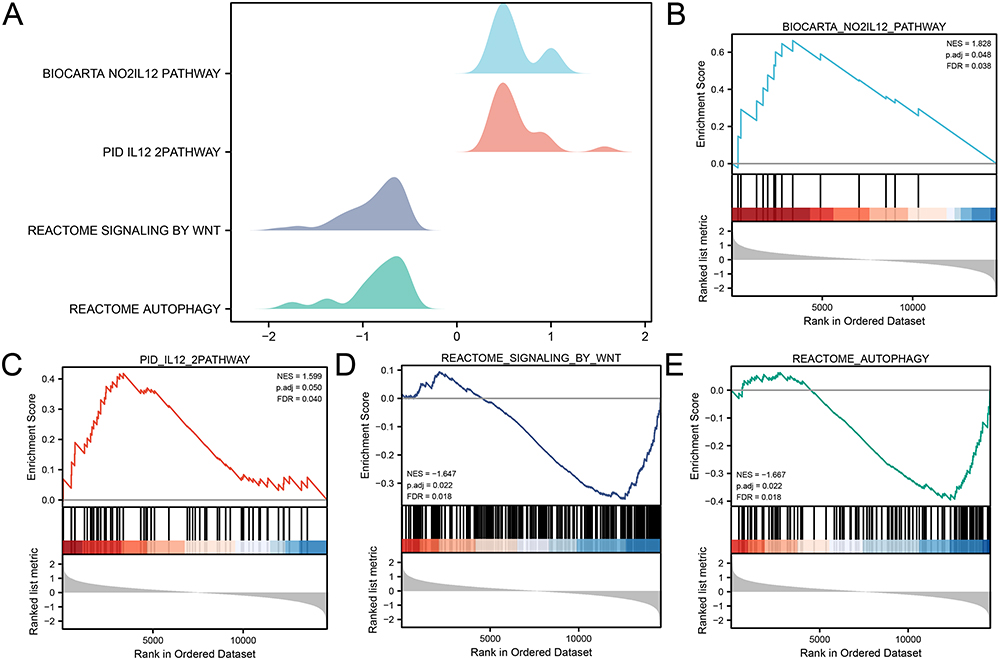 |
Figure 5 GSEA for the Integrated dataset. (A) Ridge plot of four biological functions from the GSEA of the integrated dataset. (B-E) The GSEA shows that PI significantly impacts the NO2IL12 Pathway (B), IL12 2Pathway (C), Signaling by Wnt (D), and Autophagy (E). Abbreviation: GSEA, Gene set enrichment analysis. |
GSVA of PRDEGs
To investigate the differences in the HALLMARK gene set between the PI and control groups in the integrated dataset, GSVA was performed on all genes in the integrated dataset. The top 11 enriched HALLMARK pathways were selected, and the results were presented using grouped comparison boxplots (Figure 6A). The GSVA revealed that eight HALLMARK pathways showed statistically significant differences (p-value < 0.05) between different groups in the integrated dataset: ALLOGRAFT REJECTION and PANCREAS BETA CELLS pathways exhibited highly significant expression difference (p-value < 0.01) between PI and control groups, while G2M CHECKPOINT, GLYCOLYSIS, HEDGEHOG SIGNALING, IL2 STAT5 SIGNALING, NOTCH SIGNALING, and TGF BETA SIGNALING pathways showed statistically significant expression differences (p-value < 0.05) between the groups. The specific results were shown in Table S5. Finally, based on the GSVA results, the differential expression of the top 11 enriched HALLMARK pathways was analyzed and visualized using a heatmap (Figure 6B).
 |
Figure 6 GSVA for the Integrated Dataset. (A) Comparison boxplot of the GSVA results between the PI and control groups. (B) Complex numerical heatmap of the GSVA results in the integrated dataset. The blue color represents the control group, and the red color represents the PI group. “ns” signifies no statistically significant; “*” signifies p-value < 0.05; “**” signifies p-value < 0.01. Abbreviation: GSVA, Gene set variation analysis. |
WGCNA of the Integrated Dataset
To identify co-expression modules within the integrated dataset, WGCNA was performed on DEGs between the PI and control groups. Firstly, various soft threshold values were calculated and the scale-free fit index was plotted to determine the optimal soft threshold for constructing a scale-free network. The results showed that a soft threshold of 15 achieved the best scale-free fit when the scale-free fit index reached 0.85 (Figure 7A). This enabled the construction of a co-expression network, with DEGs clustered into eight modules based on their expression patterns using a clustering tree (Figure 7B). After applying a cut-off of 0.2 and merging certain modules, the relationship between DEGs and the merged modules was visualized (Figure 7C), and their correlation with the PI and Normal groups were assessed (Figure 7D). The top two modules with the highest |cor value|, MEblack (|cor value|=0.51) and MEyellow (|cor value|=0.49), were selected for subsequent analysis. The DEGs within these two modules were intersected with the PRDEGs and visualized using Veen diagrams (Figure 7E and F). These intersections yielded eight hub PRDEGs, namely PGF, DPEP1, IL36B, IFIH1, TCEA3, RIPK3, NEK7, and TLR3.
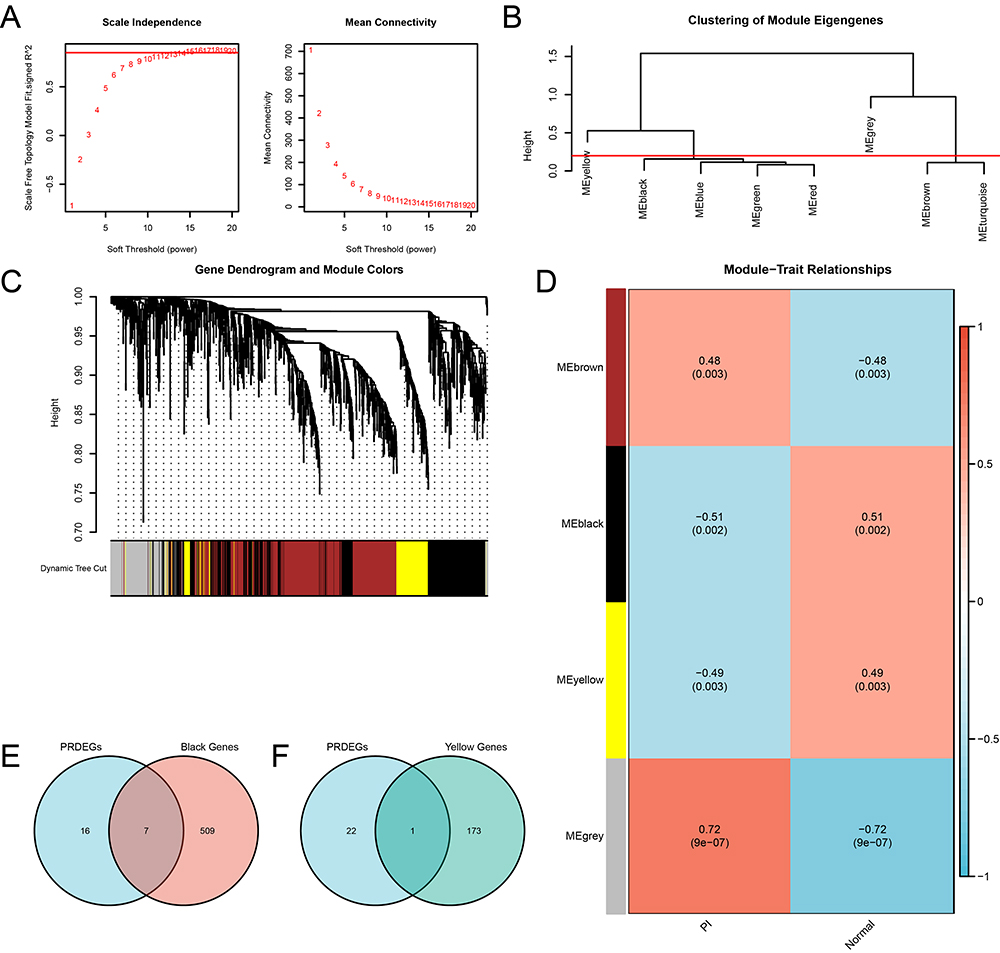 |
Figure 7 WGCNA for the Integrated dataset. (A) Scale-free network visualization of the optimal soft-thresholding power (left) and network connectivity under different soft-thresholding powers (right). (B) The module clustering results of the DEGs. (C) Clustering results of DEGs, with the upper part as a dendrogram of hierarchical clustering and the lower part showing gene modules. (D) Correlation between the DEGs clustering modules and different groups. (E-F) Venn diagrams of the PRDEGs with the MEblack module (E) and MEyellow module (F). Abbreviations: WGCNA, Weighted gene co-expression network analysis. |
Cellular Experiment Validation
We constructed a model of pyroptotic macrophages by treating THP-1 cells (ATCC TIB-202) with PMA for 48h and stimulating them with LPS and ATP, as illustrated in Figure 8A. The CCK-8 assay results revealed cell death in the macrophages at the 4h post-stimulation, highlight the rapid response of these cells to the inflammatory stimuli (Figure 8B). In addition, WB analysis showed a significant upregulation in the expression of the NLRP3 and ASC proteins, which are established markers of pyroptosis (Figure 8C).
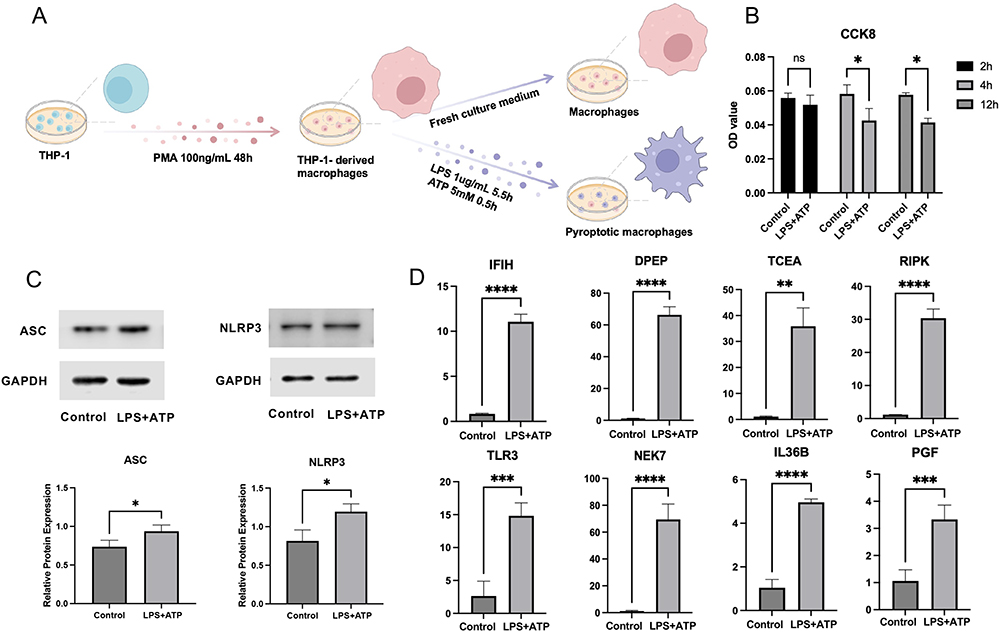 |
Figure 8 Verification of hub PRDEGs expression in pyroptotic macrophage model. (A) Diagram of the pyroptotic macrophage model construction. (B) Cell viability as indicated by CCK-8 assay. (C) WB analysis displaying ASC and NLRP3 expression. (D) qRT-PCR analysis demonstrating mRNA expression of hub PRDEGs. Data are presented as means ± standard deviation. “*” denotes p-value < 0.05, “**” denotes p-value < 0.01, “***” denotes p-value < 0.001, “****” denotes p-value < 0.0001. Abbreviations: CCK-8, Cell counting kit-8; WB, Western blot; qRT-PCR, Quantitative reverse transcription polymerase chain reaction. |
Further molecular investigation using qRT-PCR revealed significant transcriptional alterations in the pyroptotic macrophages. Specifically, we observed elevated mRNA expression levels of eight hub PRDEGs, namely PGF, DPEP1, IL36B, IFIH1, TCEA3, RIPK3, NEK7, and TLR3, suggesting their potential involvement in the regulation of pyroptosis in PI (Figure 8D).
Immune Cell Infiltration Analysis and Correlation with Hub PRDEGs
Using the ssGSEA algorithm, we analyzed immune infiltration in the PI and Normal groups, selecting immune cells with p-value < 0.05 (Figure 9A). Statistical analysis revealed significant differences in the presence of five types of immune cells. Specifically, activated dendritic cells and immature B cells were highly significant (p-value < 0.001), followed by activated B cells and macrophages (p-value < 0.01). MDSC also showed significant differences (p-value < 0.05). We also assembled a heatmap showcasing correlations between significant immune cells (Figure 9B). All indicated positive associations, with the strongest being between immature B cells and activated dendritic cells (correlation value = 0.76). A subsequent heatmap illustrated the relationships between the five significant immunocytes and eight hub PRDEGs (Figure 9C). Notably, DPEP1 and TLR3 showed significant positive and negative correlations with immune cells, respectively. Lollipop plots further highlighted these correlations: DPEP1 with activated B cells (correlation value > 0.6, p-value = 1×10⁻⁵, Figure 9D), and TLR3 with macrophages (correlation value < −0.6, p-value = 0.00013, Figure 9E).
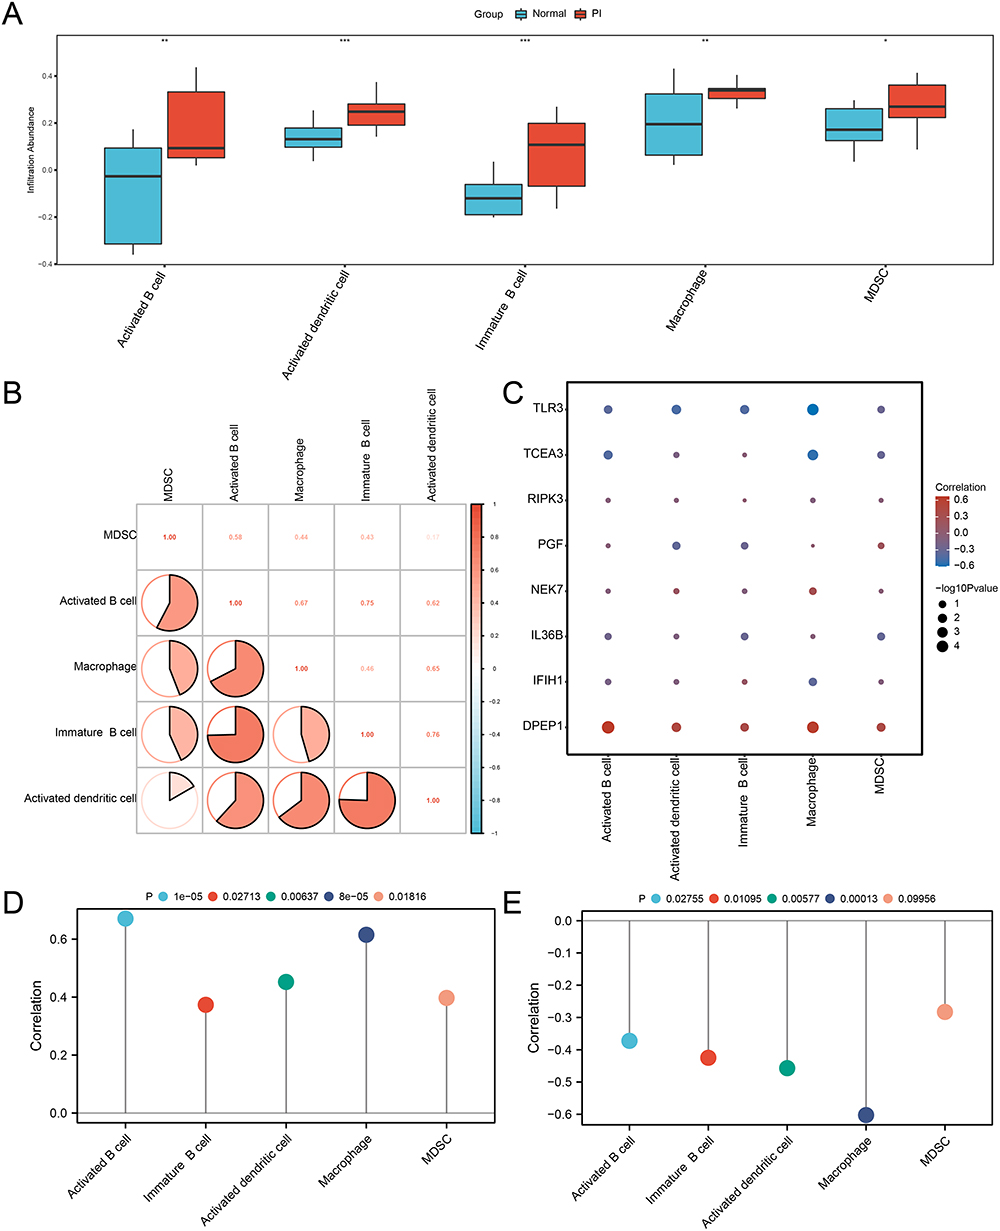 |
Figure 9 Immune infiltration analysis by ssGSEA in the integrated dataset. (A) Comparison boxplot of hub PRDEGs. (B) Correlation analysis of five immunocyte tpyes’ infiltration. (C) Heatmap illustrating the correlation between the infiltration of five immunocyte types and hub PRDEGs. (D-E) Lollipop plots of correlation between DPEP1 (D) and TLR3 (E) and the infiltration of five immunocyte types. ssGSEA: Single-sample gene-set enrichment analysis. “*” denotes p-value < 0.05, “**” denotes p-value < 0.01, “***” denotes p-value < 0.001. |
Consensus Clustering Analysis of Subtypes in PI
Consensus clustering analysis identified two PI subtypes, Cluster 1 and Cluster 2, based on the eight hub PRDEGs (Figure 10A-C). Cluster 1 contained 12 samples, while Cluster 2 comprised 7 samples. The PCA plot demonstrated significant differences between the two subtypes (Figure 10D). The expression differences of these hub PRDEGs across PI subtypes were visualized using a heatmap (Figure 10E).
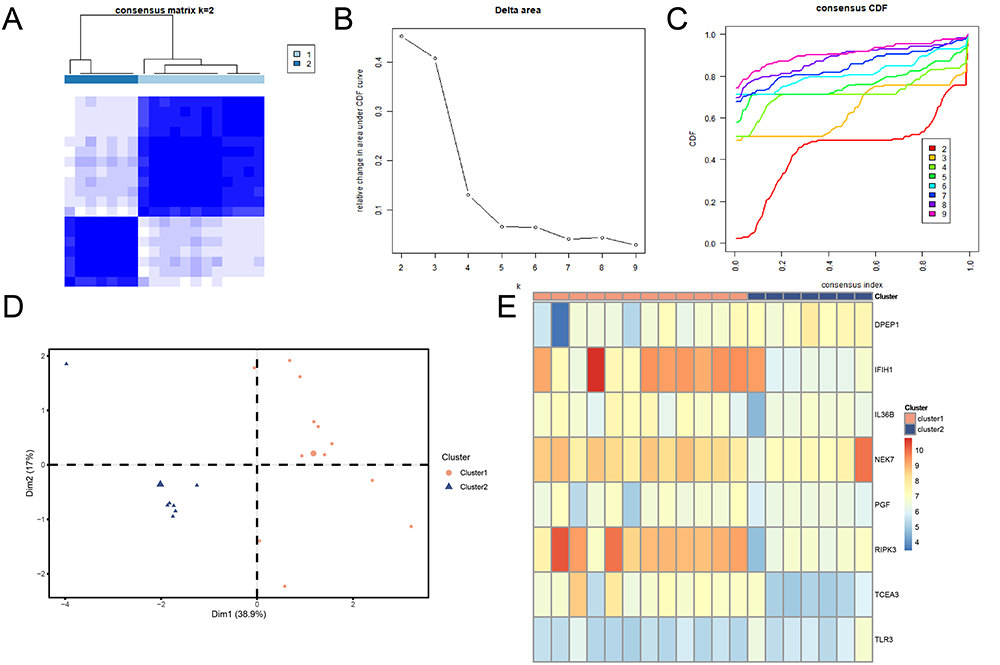 |
Figure 10 Consensus clustering analysis of PI samples based on hub PRDEGs. (A) Consensus clustering result for PI samples. (B) Delta plot for different subtypes from consensus clustering. (C) CDF plot from consensus clustering analysis. (D) PCA plot for two PI subtypes. Orange circles represent Cluster 1, blue triangles represent Cluster 2. (E) Complex numerical heatmap of hub PRDEGs expression in PI subtypes. Orange represents Cluster 1; blue represents Cluster 2. Abbreviations: CDF, Empirical cumulative distribution function; PCA, Principal component analysis. |
We further examined the expression differences of eight hub genes across PI subtypes, using boxplots to display expression levels (Figure 11A). Seven of these genes showed significant differences (p-value < 0.05): RIPK3 was highly significant (p-value < 0.001), IFIH1 and TCEA3 also showed high significance (p-value < 0.01), and DPEP1, PGF, NEK7, and TLR3 had significant expression differences (p-value < 0.05). Finally, ROC curves were generated to assess the discriminatory ability of the seven hub genes between the PI subtypes (Figure 11B-D). The ROC curves indicated that IFIH1, RIPK3, and TCEA3 exhibited high accuracy (AUC > 0.9) in distinguishing between PI subtypes, while DPEP1, NEK7, PGF, and TLR3 demonstrated moderate accuracy (0.7 < AUC < 0.9).
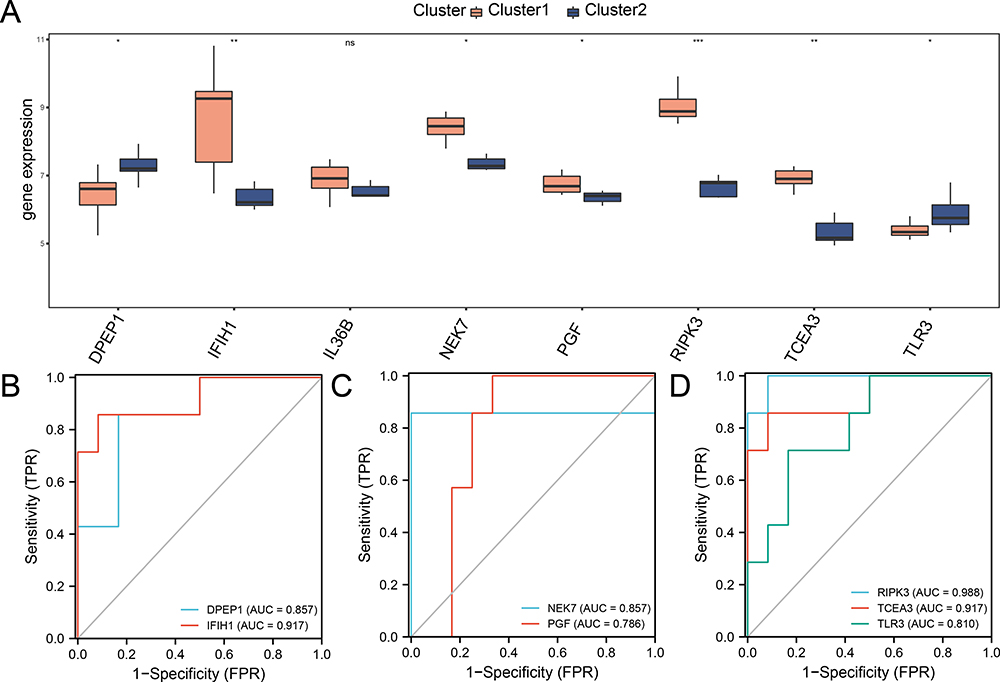 |
Figure 11 Expression difference of hub PRDEGs and ROC Curve analysis for two PI subtypes. (A) Comparison boxplot of hub PRDEGs expression levels in the two PI subtypes. (B-D) ROC curves for seven hub PRDEGs in the two PI subtypes. Orange represents Cluster 1, and blue represents Cluster 2. “*” denotes p-value < 0.05, “**” denotes p-value < 0.01, “***” denotes p-value < 0.001. Abbreviations: ROC, Receiver operating characteristic. |
Immune Infiltration Analysis of PI Subtypes
To examine the differences in immune cell infiltration between different PI subtypes, the ESTIMATE and ssGSEA algorithms were used to analyze the immune cell composition in PI samples. Immune cell abundances or scores were assessed in the two subtypes, and immune cells with a p-value < 0.05 were selected.
The infiltration differences of immune cells between PI subtypes were visualized using box plots. The ESTIMATE algorithm results (Figure 12A) revealed a statistically significant difference (p-value < 0.05) in the Immune Score between different subtypes, with Cluster1 notably exhibiting a higher immune score than Cluster 2.
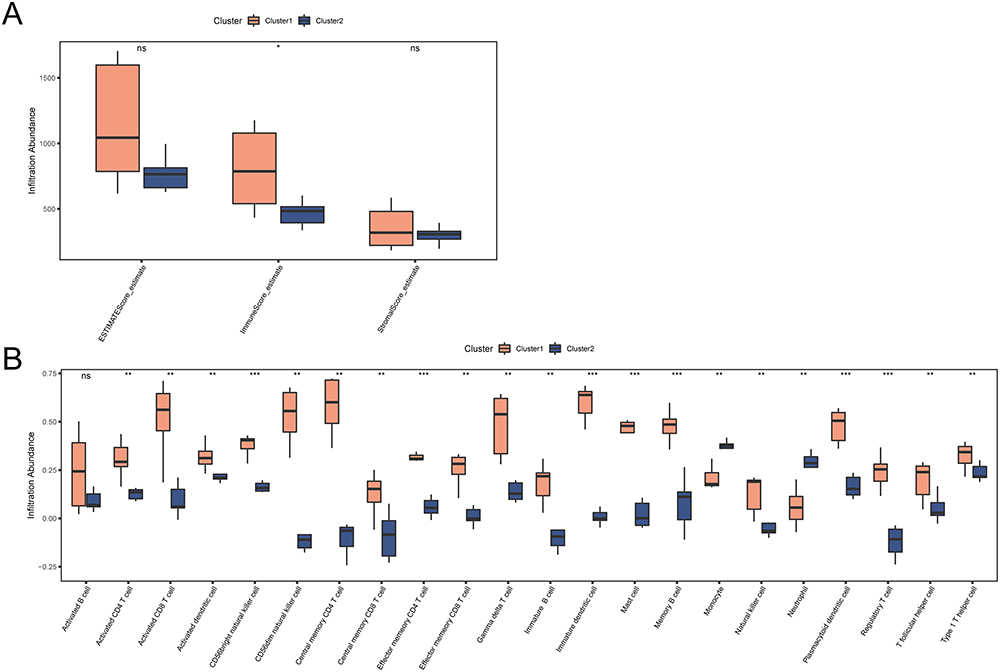 |
Figure 12 Immune infiltration analysis for two PI subtypes. (A) Comparison boxplot of ESTIMATE immune scores in two PI subtypes. (B) Comparison boxplot of ssGSEA immune cell infiltration across two PI subtypes. Orange represents Cluster 1, and blue represents Cluster 2. “*” denotes p-value < 0.05, “**” denotes p-value < 0.01, “***” denotes p-value < 0.001. |
According to the ssGSEA algorithm results (Figure 12B), 21 immune cell types showed statistically significant differences (p-value < 0.05), with Cluster1 consistently exhibiting higher levels of immune cell infiltration than Cluster 2. Notably, CD56bright natural killer cell, Effector memory CD4 T cell, Immature dendritic cell, Mast cell, Memory B cell, Plasmacytoid dendritic cell, and Regulatory T cell showed highly significant expression differences (p-value < 0.001) between different subtypes. Activated CD4 T cell, Activated CD8 T cell, Activated dendritic cell, CD56dim natural killer cell, Central memory CD4 T cell, Central memory CD8 T cell, Effector memory CD8 T cell, Gamma delta T cell, Immature B cell, Monocyte, Natural killer cell, Neutrophil, T follicular helper cell, and Type 1 T helper cell exhibited significantly different expression levels (p-value < 0.01) between different subtypes.
Construction of PPI Network, ceRNA Network and Regulatory Network
Firstly, a PPI analysis was performed with the eight pyroptosis-related hub genes using the STRING database (Figure 13A). Among them, six hub PRDEGs, namely: PGF, IL36B, IFIH1, RIPK3, NEK7 and TLR3, were interconnected.
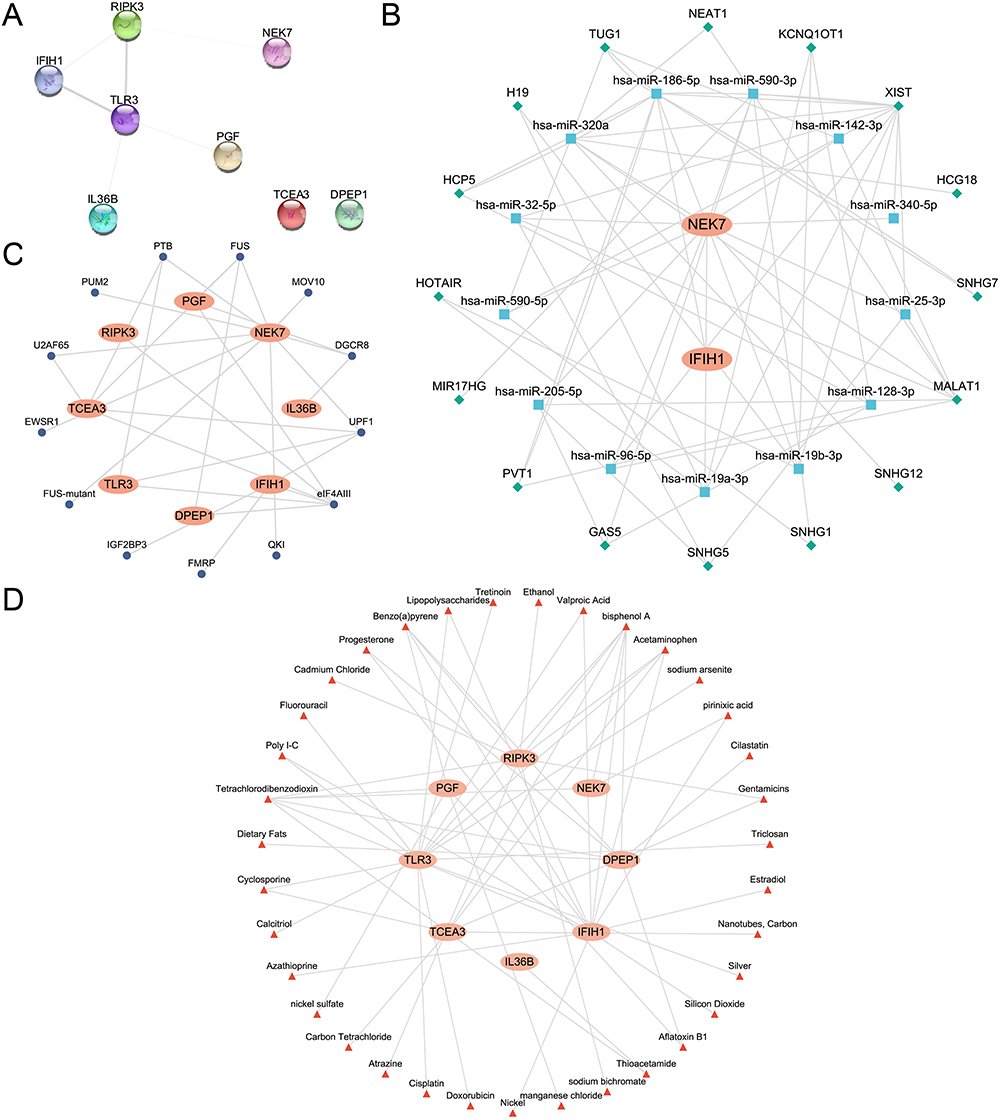 |
Figure 13 The PPI, ceRNA, mRNA-RBP and mRNA-drug networks based on hub PRDEGs. (A) The PPI network of hub PRDEGs. (B) The ceRNA network based on hub PRDEGs. Orange ellipses represent mRNAs, blue squares represent miRNAs, and green diamonds represent lncRNAs. (C) The mRNA- RBP regulatory network of hub PRDEGs. Dark blue circles represent RBPs. (D) The mRNA-drugs regulatory network of hub PRDEGs. Red triangles represent Drugs. Abbreviations: PPI network, Protein-protein interaction network; ceRNA network, Competing endogenous RNA network; RBP, RNA-binding protein. |
Next, the ceRNA network related to all hub PRDEGs was explored. Firstly, miRNAs related to the hub PRDEGs were obtained from the StarBase database. Then, lncRNAs related to these miRNAs were retrieved from the StarBase database. In total, the ceRNA network comprised two hub PRDEGs, 14 miRNAs, and 16 lncRNAs, as detailed in Table S6. Finally, the ceRNA network was constructed and visualized using Cytoscape software (Figure 13B).
Subsequently, RBPs associated with all hub PRDEGs were predicted using the StarBase database. This allowed the construction of an mRNA-RBP regulatory network, which was visualized using Cytoscape software (Figure 13C). This network encompassed eight hub PRDEGs and 13 RBPs, as specified in Table S7.
Finally, the potential target drugs or molecular compounds associated with hub PRDEGs were identified using the CTD database. And the mRNA-drug regulatory network was constructed and visualized using Cytoscape software (Figure 13D). This network included eight hub PRDEGs and 35 drugs or small molecular compounds, as specified in Table S8.
Discussion
Our study conclusively demonstrates that cellular pyroptosis plays a crucial role in the progression of peri-implantitis (PI), identifying eight hub PRDEGs (PGF, DPEP1, IL36B, IFIH1, TCEA3, RIPK3, NET7, and TLR3) and revealing distinct immune infiltration patterns that suggest two novel PI subtypes. This study presents a comprehensive investigation into the role of pyroptosis in PI progression, uncovering key signaling pathways in PI and identifying pivotal hub PRDEGs. In addition, we established a pyroptotic macrophage model to validate the hub PRDEGs through qRT-PCR analysis. Additionally, we analyzed immune cell infiltration patterns and investigated the relationship between the hub PRDEGs and infiltrating immunocytes. The PI samples were classified into two subtypes, allowing for an immune cell infiltration analysis between the two. Moreover, we constructed PPI networks, ceRNA networks, mRNA-RBP networks, and mRNA-drug networks based on the hub PRDEGs, providing valuable insights into the underlying mechanisms of PI.
Based on the GO and KEGG enrichment analyses, GSEA and GSVA enrichment analyses results, several key points can be addressed. Firstly, the biological processes enrichment of PRDEGs in T cell homeostasis and the regulation of the I-kappaB kinase/NF-kappaB signaling pathway suggests the critical role of the immune system in the pathogenesis of peri-implant inflammation. Secondly, the enrichment of genes involved in the response to reactive oxygen species indicates the potential importance of oxidative stress in PI, possibly linked to inflammatory responses and tissue damage. Additionally, the enrichment of PRDEGs in cellular components such as the plasma membrane, extracellular organelle membrane, and mitochondrial outer membrane suggests structural and functional changes in these compartments during PI. Furthermore, the enrichment of PRDEGs in pathways related to measles and hepatitis B implies possible interactions or shared pathological mechanisms between these diseases and PI. Lastly, the molecular function enrichment analysis results provided clues for potential therapeutic targets and biomarkers, such as protein binding to cytoskeleton, lipid binding, and channel inhibitor activity, which may guide the development of novel intervention strategies and treatment approaches.
We identified eight hub PRDEGs in PI. The PGF regulates inflammatory responses and mediates the accumulation and migration of inflammatory cells, its production stimulated by trauma, infection, and mechanical stimulation.45 The DPEP1, an enzyme involved in dipeptide metabolism, potentially influences the severity and duration of inflammatory disease by degrading peptide substances produced during inflammation.46 The IL36B, a pro-inflammatory cytokine, and IFIH1, a protein involved in immune and antiviral responses, both activate immune cells and induce inflammatory responses.47,48 Although their direct relationship with PI is not yet studied, their role in various inflammatory diseases suggests potential relevance.49 The TCEA3, a transcription factor, may potentially influence the progression of disease through its regulation of cellular pyroptosis and apoptosis.50 The RIPK3, associated with cell death and inflammation, has been found to be upregulated in inflamed periodontal tissue,51 linking it to exacerbated inflammatory response and tissue destruction.52 The NEK7, a cell cycle regulatory protein,53 may contribute to PI development through cell cycle disruptions and processes like apoptosis or pyroptosis. The TLR3, a Toll-like receptor recognizing pathogenic microorganisms, can trigger an inflammatory reaction, leading to prolonged inflammation by recognizing nucleic acid molecules from periodontal pathogens.54 The identification of these hub PRDEGs is crucial for enhancing our understanding of the PI mechanism in relation to pyroptosis. It not only sheds light on the molecular pathways and interactions but also uncovers potential therapeutic targets. While our study marks an initial step towards understanding the genetic underpinnings of PI, the clinical utility of these genes as biomarker for early diagnosis or targets for therapeutic intervention remains to be fully explored. We underscore the necessity for future research to delve into the roles of hub PRDEGs in clinical setting, aiming to bridge the gap between molecular insights and practical applications in PI management. This exploration is crucial for developing targeted, evidence-based strategies for the diagnosis and treatment of PI, potentially leading to improved patient outcomes.
No previous studies have classified PI subtypes based on gene expression characteristics. Our consensus clustering analysis identified two distinct subtypes. In cluster 1, we found elevated expression of five hub PRDEGs and higher immune scores, and immune cell infiltration compared to cluster 2. These differences suggest varying immune conditions and distinct inflammation level between PI subtypes. In the immune analysis of the PI versus control group, we observed increased infiltration of activated dendritic cells, immature B cells, activated B cells, macrophages, and MDSCs. However, the cell types exhibiting increased infiltration differed when comparing cluster 1 to cluster 2, indicating that different immune cells play key regulatory roles at different stages of PI onset and progression. Notably, in both stages, we observed increased infiltration levels of activated dendritic cells and immature B cells, suggesting these two cell types play significant roles throughout the PI process. Activated dendritic cells typically participate in antigen presentation and initiation of immune responses,55 while Immature B cells primarily function to produce antibodies, playing a crucial role in antibody-mediated immune responses.56 These findings underscore the importance of research on these specific immune cell types for understanding the pathogenesis of PI and identifying potential treatments.
In this study, we delved into the PPI network, ceRNA network, mRNA-RBP network, and mRNA-drug regulatory network of hub PRDEGs. Firstly, the PPI network shed light on the interactions and functional associations between PRDEGs. Secondly, through the ceRNA network, we discovered that mRNA molecules regulate the expression of lincRNAs by competing for microRNA binding sites, which could play a key role in gene expression regulation and disease onset.57 In addition, the mRNA-RBP network illustrated how RNA-binding proteins control the stability, translation, and location of mRNA, which might be crucial for understanding the molecular mechanisms of diseases.58 Finally, the mRNA-drug regulatory network revealed potential drug targets and how these drugs exert their effects by influencing specific mRNAs.59 Within the mRNA-drug network of hub PRDEGs, literatures have shown that dietary fat60 and calcitriol61 are associated with the onset of periodontitis. Hence, we speculated that these drug targets may also be closely related to peri-implantitis.
Oxidative stress is a risk factor that exacerbates peri-implantitis. Zhang et al have suggested that excessive oxidative stress may trigger poor peri-implant soft tissue sealing, thereby exacerbating peri-implantitis, which may be more severe in Type 2 diabetes mellitus patients.62 Moreover, Buranasin et al have identified oxidative stress as a link between diabetes mellitus and periodontitis, highlighting increased reactive oxygen species in periodontal tissues of diabetic patients. This elevation in reactive oxygen species contributes to impaired wound healing and tissue repair in periodontal tissues.63 Therefore, by managing or reducing oxidative stress, we can mitigate the risk of tissue damage in periodontitis or peri-implantitis, thereby improving the quality of life for patients.
Despite the finding presented in our study, we must acknowledge its limitations. Specifically, our study did not conduct in vivo or in vitro experiments to validate the roles of eight hub PRDEGs in PI. However, future studies are planned to focus on experimental validation, such as gene knockdown or overexpression studies, to assess the impact of these genes on PI progression. Such efforts are expected to yield a more comprehensive understanding of the functions and mechanisms of these hub PRDEGs and immune cells in PI. Moreover, a longitudinal study would offer a more dynamic and comprehensive insight of the hub PRDEGs’ roles in the disease progression. Currently, we are collecting sequential data from peri-implantitis patients pre- and post-treatment to further investigate the significance of these hub PRDEGs. Additionally, expanding our study to include a broader demographic would indeed strengthen the applicability of our results. In our current research context, we were limited by the available sample size but recognized the need of expanding our cohort in future studies. Importantly, the datasets (GSE33774, GSE106090, GSE57631) from the GEO database used in our study do not include some potential confounding factors such as patients’ oral hygiene, smoking status, systemic health conditions, and medication use. These omissions limit our ability to account for these factors in the current analysis, but we intend to integrate these key considerations into our future work to enhance the robustness of our findings.
Although our study identified hub PRDEGs and pathways, it did not delve into detailed mechanistic insights of how these genes contribute to pyroptosis in PI. Consequently, we are planning follow-up studies to elucidate the deeper molecular mechanisms and pathways by which these genes influence PI. Furthermore, despite the valuable insights provided into the hub PRDEGs associated with PI, there is a critical need for future research to explore the interactions between these genes and the microbial pathogens implicated in the disease. Such understanding of the molecular dialogue between hub PRDEGs and specific bacteria may unveil new dimensions of pathogenesis and reveal potential targets for therapeutic intervention. In this context, the current absence of proteomics and metabolomics data in PI research highlights a significant gap. Anticipating future investigations that incorporate these data could dramatically deepen our understanding of PI, revealing novel biomarkers and therapeutic targets. We are committed to exploring these dimensions in our subsequent research.
Conclusion
In conclusion, our research substantiates the pivotal role of cellular pyroptosis in PI’s progression, identifying eight key pyroptosis-related hub genes: PGF, DPEP1, IL36B, IFIH1, TCEA3, RIPK3, NEK7, and TLR3. Our findings not only distinguish two PI subtypes through consensus clustering based on gene expression but also highlight the intricate immune infiltration patterns associated with these genes. By delving into mRNA regulation networks linked to the hub PRDEGs, we provide a groundwork for the future discovery of novel mechanisms and therapeutic targets in PI. This research provides critical clues for developing targeted treatment and personalized clinical management strategies for PI.
Data Sharing Statement
The transcriptome sequencing data analyzed for this study were obtained from the GEO (Gene Expression Omnibus, http://www.ncbi.nlm.nih.gov/geo) database.
Institutional Review Board Statement
This study was performed in line with the principles of the Declaration of Helsinki. Approval was granted by the Ethics Committee of School & Hospital of Wuhan University, approval number: 2023(A25). Informed consents were obtained from all patients prior to the collection of clinical samples.
Informed Consent Statement
Written informed consents were obtained from all individual participants included in the study.
Funding
This research was funded by the Science and Technology Foundation of Hubei Province (Grant No. 2021CFB147); The College Students’ Innovation and Entrepreneurship Training Program of Wuhan University, Grant Number: 2024(760).
Disclosure
The authors declare no conflicts of interest in this work.
References
1. Roccuzzo A, Imber JC, Salvi GE, Roccuzzo M. Peri-implantitis as the consequence of errors in implant therapy. Periodontol. 2023;92(1):350–361. doi:10.1111/prd.12482
2. Krebs M, Kesar N, Begic A, von Krockow N, Nentwig GH, Weigl P. Incidence and prevalence of peri-implantitis and peri-implant mucositis 17 to 23 (18.9) years postimplant placement. Clin Implant Dent Relat Res. 2019;21(6):1116–1123. doi:10.1111/cid.12848
3. Vagia P, Papalou I, Burgy A, Tenenbaum H, Huck O, Davideau JL. Association between periodontitis treatment outcomes and peri-implantitis: a long-term retrospective cohort study. Clin Oral Implants Res. 2021;32(6):721–731. doi:10.1111/clr.13741
4. Isola G, Tartaglia GM, Santonocito S, Polizzi A, Williams RC, Iorio-Siciliano V. Impact of N-terminal pro-B-type natriuretic peptide and related inflammatory biomarkers on periodontal treatment outcomes in patients with periodontitis: an explorative human randomized-controlled clinical trial. J Periodontol. 2023;94(12):1414–1424. doi:10.1002/JPER.23-0063
5. Matarese G, Isola G, Anastasi GP, et al. TRANSFORMING GROWTH FACTOR BETA 1 AND VASCULAR ENDOTHELIAL GROWTH FACTOR LEVELS IN THE PATHOGENESIS OF PERIODONTAL DISEASE. Eur J Inflammation. 2013;11(2):479–488. doi:10.1177/1721727x1301100217
6. Tong X, Tang R, Xiao M, et al. Targeting cell death pathways for cancer therapy: recent developments in necroptosis, pyroptosis, ferroptosis, and cuproptosis research. J Hematol Oncol. 2022;15(1):174. doi:10.1186/s13045-022-01392-3
7. Liu X, Zhang Z, Ruan J, et al. Inflammasome-activated gasdermin D causes pyroptosis by forming membrane pores. Nature. 2016;535(7610):153–158. doi:10.1038/nature18629
8. Wang S, Lin F, Zhang C, et al. Xuanbai Chengqi Decoction alleviates acute lung injury by inhibiting NLRP3 inflammasome. J Ethnopharmacol. 2023;319(Pt 2):117227. doi:10.1016/j.jep.2023.117227
9. Chen J, Che Q, Kou Y, et al. A novel drug combination of Tofacitinib and Iguratimod alleviates rheumatoid arthritis and secondary osteoporosis. Int Immunopharmacol. 2023;124(Pt B):110913. doi:10.1016/j.intimp.2023.110913
10. You R, He X, Zeng Z, Zhan Y, Xiao Y, Xiao R. Pyroptosis and Its Role in Autoimmune Disease: a Potential Therapeutic Target. Front Immunol. 2022;13:841732. doi:10.3389/fimmu.2022.841732
11. Luan F, Lei Z, Peng X, et al. Cardioprotective effect of cinnamaldehyde pretreatment on ischemia/ reperfusion injury via inhibiting NLRP3 inflammasome activation and gasdermin D mediated cardiomyocyte pyroptosis. Chem Biol Interact. 2022;368:110245. doi:10.1016/j.cbi.2022.110245
12. Sefik E, Qu R, Junqueira C, et al. Inflammasome activation in infected macrophages drives COVID-19 pathology. Nature. 2022;606(7914):585–593. doi:10.1038/s41586-022-04802-1
13. Chen C, Jiang Z, Jiang Q, et al. Caspase-3 and gasdermin E detection in peri-implantitis. Biochim Biophys Acta Mol Basis Dis. 2021;1867(11):166217. doi:10.1016/j.bbadis.2021.166217
14. Li Y, Ling J, Jiang Q. Inflammasomes in Alveolar Bone Loss. Front Immunol. 2021;12:691013. doi:10.3389/fimmu.2021.691013
15. Lv X, Fan C, Jiang Z, Wang W, Qiu X, Ji Q. Isoliquiritigenin alleviates P. gingivalis-LPS/ATP-induced pyroptosis by inhibiting NF-kappaB/ NLRP3/GSDMD signals in human gingival fibroblasts. Int Immunopharmacol. 2021;101(Pt B):108338. doi:10.1016/j.intimp.2021.108338
16. Qiu H, Wang W, Hu K, et al. EuHD1 protects against inflammatory injury driven by NLRP3 inflammasome. Int Immunopharmacol. 2023;115:109712. doi:10.1016/j.intimp.2023.109712
17. Berglundh T, Armitage G, Araujo MG, et al. Peri-implant diseases and conditions: consensus report of workgroup 4 of the 2017 World Workshop on the Classification of Periodontal and Peri-Implant Diseases and Conditions. J Periodontol. 2018;89 Suppl 1:S313-S318. doi:10.1002/JPER.17-0739
18. Chen LW, Jin SH, Lu Q, et al. Identification of immunological bioprocesses involved in peri-implantitis using weighted gene co-expression network analysis. J Periodontol. 2023;94(9):1078–1089. doi:10.1002/JPER.22-0405
19. Becker ST, Beck-Broichsitter BE, Graetz C, Dorfer CE, Wiltfang J, Hasler R. Peri-implantitis versus periodontitis: functional differences indicated by transcriptome profiling. Clin Implant Dent Relat Res. 2014;16(3):401–411. doi:10.1111/cid.12001
20. Liu Y, Liu Q, Li Z, et al. Long non-coding RNA and mRNA expression profiles in peri-implantitis vs periodontitis. J Periodontal Res. 2020;55(3):342–353. doi:10.1111/jre.12718
21. Schminke B, Vom Orde F, Gruber R, Schliephake H, Burgers R, Miosge N. The pathology of bone tissue during peri-implantitis. J Dent Res. 2015;94(2):354–361. doi:10.1177/0022034514559128
22. Davis S, Meltzer PS. GEOquery: a bridge between the Gene Expression Omnibus (GEO) and BioConductor. Bioinformatics. 2007;23(14):1846–1847. doi:10.1093/bioinformatics/btm254
23. Leek JT, Johnson WE, Parker HS, Jaffe AE, Storey JD. The sva package for removing batch effects and other unwanted variation in high-throughput experiments. Bioinformatics. 2012;28(6):882–883. doi:10.1093/bioinformatics/bts034
24. Stelzer G, Rosen N, Plaschkes I, et al. The GeneCards Suite: from Gene Data Mining to Disease Genome Sequence Analyses. Curr Protoc Bioinformatics. 2016;54(1):30 1–1 30 33. doi:10.1002/cpbi.5
25. Subramanian A, Tamayo P, Mootha VK, et al. Gene set enrichment analysis: a knowledge-based approach for interpreting genome-wide expression profiles. Proc Natl Acad Sci U S A. 2005;102(43):15545–15550. doi:10.1073/pnas.0506580102
26. Love MI, Huber W, Anders S. Moderated estimation of fold change and dispersion for RNA-seq data with DESeq2. Genome Biol. 2014;15(12):550. doi:10.1186/s13059-014-0550-8
27. Zhang H, Meltzer P, Davis S. RCircos: an R package for Circos 2D track plots. BMC Bioinf. 2013;14:244. doi:10.1186/1471-2105-14-244
28. Mi H, Muruganujan A, Ebert D, Huang X, Thomas PD. PANTHER version 14: more genomes, a new PANTHER GO-slim and improvements in enrichment analysis tools. Nucleic Acids Res. 2019;47(D1):D419–D426. doi:10.1093/nar/gky1038
29. Kanehisa M. KEGG: Kyoto encyclopedia of genes and genomes. Nucleic Acids Res. 2000;28(1):27–30. doi:10.1093/nar/28.1.27
30. Yu G, Wang LG, Han Y, He QY. clusterProfiler: an R package for comparing biological themes among gene clusters. OMICS. 2012;16(5):284–287. doi:10.1089/omi.2011.0118
31. Luo W. Pathview: an R/Bioconductor package for pathway-based data integration and visualization. Bioinformatics. 2013;29(14):1830–1831. doi:10.1093/bioinformatics/btt285
32. Hanzelmann S, Castelo R, Guinney J. GSVA: gene set variation analysis for microarray and RNA-seq data. BMC Bioinf. 2013;14:7. doi:10.1186/1471-2105-14-7
33. Liberzon A, Subramanian A, Pinchback R, Thorvaldsdottir H, Tamayo P, Mesirov JP. Molecular signatures database (MSigDB) 3.0. Bioinformatics. 2011;27(12):1739–1740. doi:10.1093/bioinformatics/btr260
34. Langfelder P, Horvath S. WGCNA: an R package for weighted correlation network analysis. BMC Bioinf. 2008;9:559. doi:10.1186/1471-2105-9-559
35. Lock EF, Dunson DB. Bayesian consensus clustering. Bioinformatics. 2013;29(20):2610–2616. doi:10.1093/bioinformatics/btt425
36. Wilkerson MD, Hayes DN. ConsensusClusterPlus: a class discovery tool with confidence assessments and item tracking. Bioinformatics. 2010;26(12):1572–1573. doi:10.1093/bioinformatics/btq170
37. Park SH, Goo JM, Jo CH. Receiver operating characteristic (ROC) curve: practical review for radiologists. Korean J Radiol. 2004;5(1):11–18. doi:10.3348/kjr.2004.5.1.11
38. Zeng D, Ye Z, Shen R, et al. IOBR: multi-Omics Immuno-Oncology Biological Research to Decode Tumor Microenvironment and Signatures. Front Immunol. 2021;12:687975. doi:10.3389/fimmu.2021.687975
39. Xiao B, Liu L, Li A, et al. Identification and Verification of Immune-Related Gene Prognostic Signature Based on ssGSEA for Osteosarcoma. Front Oncol. 2020;10:607622. doi:10.3389/fonc.2020.607622
40. Szklarczyk D, Gable AL, Lyon D, et al. STRING v11: protein-protein association networks with increased coverage, supporting functional discovery in genome-wide experimental datasets. Nucleic Acids Res. 2019;47(D1):D607–D613. doi:10.1093/nar/gky1131
41. Li JH, Liu S, Zhou H, Qu LH, Yang JH. starBase v2.0: decoding miRNA-ceRNA, miRNA-ncRNA and protein-RNA interaction networks from large-scale CLIP-Seq data. Nucleic Acids Res. 2014;42(Database issue):D92–7. doi:10.1093/nar/gkt1248
42. Singh A. RNA-binding protein kinetics. Nat Methods. 2021;18(4):335. doi:10.1038/s41592-021-01122-6
43. Davis AP, Wiegers TC, Johnson RJ, Sciaky D, Wiegers J, Mattingly CJ. Comparative Toxicogenomics Database (CTD): update 2023. Nucleic Acids Res. 2023;51(D1):D1257–D1262. doi:10.1093/nar/gkac833
44. Shannon P, Markiel A, Ozier O, et al. Cytoscape: a software environment for integrated models of biomolecular interaction networks. Genome Res. 2003;13(11):2498–2504. doi:10.1101/gr.1239303
45. Tseng HY, Chen YW, Lee BS, et al. The neutrophil elastase-upregulated placenta growth factor promotes the pathogenesis and progression of periodontal disease. J Periodontol. 2022;93(9):1401–1410. doi:10.1002/JPER.21-0587
46. Choudhury SR, Babes L, Rahn JJ, et al. Dipeptidase-1 Is an Adhesion Receptor for Neutrophil Recruitment in Lungs and Liver. Cell. 2019;178(5):1205–1221 e17. doi:10.1016/j.cell.2019.07.017
47. Swindell WR, Beamer MA, Sarkar MK, et al. RNA-Seq Analysis of IL-1B and IL-36 Responses in Epidermal Keratinocytes Identifies a Shared MyD88-Dependent Gene Signature. Front Immunol. 2018;9:80. doi:10.3389/fimmu.2018.00080
48. Chen Y, Jiang Q, Qing F, et al. MDA5 Enhances Invasive Candida albicans Infection by Regulating Macrophage Apoptosis and Phagocytosis/Killing Functions. Inflammation. 2023. doi:10.1007/s10753-023-01903-5
49. Wang A, Kang X, Wang J, Zhang S. IFIH1/IRF1/STAT1 promotes sepsis associated inflammatory lung injury via activating macrophage M1 polarization. Int Immunopharmacol. 2023;114:109478. doi:10.1016/j.intimp.2022.109478
50. Hou X, Xia J, Feng Y, et al. USP47-Mediated Deubiquitination and Stabilization of TCEA3 Attenuates Pyroptosis and Apoptosis of Colorectal Cancer Cells Induced by Chemotherapeutic Doxorubicin. Front Pharmacol. 2021;12:713322. doi:10.3389/fphar.2021.713322
51. Yang Y, Wang L, Zhang H, Luo L. Mixed lineage kinase domain-like pseudokinase-mediated necroptosis aggravates periodontitis progression. J Mol Med. 2022;100(1):77–86. doi:10.1007/s00109-021-02126-7
52. Armaka M, Ospelt C, Pasparakis M, Kollias G. The p55TNFR-IKK2-Ripk3 axis orchestrates arthritis by regulating death and inflammatory pathways in synovial fibroblasts. Nat Commun. 2018;9(1):618. doi:10.1038/s41467-018-02935-4
53. Li YK, Zhu XR, Zhan Y, Yuan WZ, Jin WL. NEK7 promotes gastric cancer progression as a cell proliferation regulator. Can Cell Inter. 2021;21(1):438. doi:10.1186/s12935-021-02148-8
54. Zhang J, Yu C, Zhang X, et al. Porphyromonas gingivalis lipopolysaccharide induces cognitive dysfunction, mediated by neuronal inflammation via activation of the TLR4 signaling pathway in C57BL/6 mice. J Neuroinflammation. 2018;15(1):37. doi:10.1186/s12974-017-1052-x
55. Arguello RJ, Reverendo M, Gatti E, Pierre P. Regulation of protein synthesis and autophagy in activated dendritic cells: implications for antigen processing and presentation. Immunol Rev. 2016;272(1):28–38. doi:10.1111/imr.12427
56. Pelanda R, Greaves SA, Alves da Costa T, Cedrone LM, Campbell ML, Torres RM. B-cell intrinsic and extrinsic signals that regulate central tolerance of mouse and human B cells. Immunol Rev. 2022;307(1):12–26. doi:10.1111/imr.13062
57. Zhang J, Luo Q, Li X, et al. Novel role of immune-related non-coding RNAs as potential biomarkers regulating tumour immunoresponse via MICA/NKG2D pathway. Biomark Res. 2023;11(1):86. doi:10.1186/s40364-023-00530-4
58. Ma J, Sun L, Gao W, Li Y, Dong D. RNA binding protein: coordinated expression between the nuclear and mitochondrial genomes in tumors. J Transl Med. 2023;21(1):512. doi:10.1186/s12967-023-04373-3
59. Webb C, Ip S, Bathula NV, et al. Current Status and Future Perspectives on MRNA Drug Manufacturing. Mol Pharm. 2022;19(4):1047–1058. doi:10.1021/acs.molpharmaceut.2c00010
60. Varela-Lopez A, Quiles JL, Cordero M, Giampieri F, Bullon P. Oxidative Stress and Dietary Fat Type in Relation to Periodontal Disease. Antioxidants (Basel). 2015;4(2):322–344. doi:10.3390/antiox4020322
61. Li W, Zheng Q, Xu M, Zeng C, Deng X. Association between circulating 25-hydroxyvitamin D metabolites and periodontitis: results from the NHANES 2009-2012 and Mendelian randomization study. J Clin Periodontol. 2023;50(2):252–264. doi:10.1111/jcpe.13736
62. Zhang Z, Ji C, Wang D, et al. The burden of diabetes on the soft tissue seal surrounding the dental implants. Front Physiol. 2023;14:1136973. doi:10.3389/fphys.2023.1136973
63. Buranasin P, Kominato H, Mizutani K, et al. Influence of Reactive Oxygen Species on Wound Healing and Tissue Regeneration in Periodontal and Peri-Implant Tissues in Diabetic Patients. Antioxidants (Basel). 2023;12(9):546.
 © 2024 The Author(s). This work is published and licensed by Dove Medical Press Limited. The full terms of this license are available at https://www.dovepress.com/terms.php and incorporate the Creative Commons Attribution - Non Commercial (unported, v3.0) License.
By accessing the work you hereby accept the Terms. Non-commercial uses of the work are permitted without any further permission from Dove Medical Press Limited, provided the work is properly attributed. For permission for commercial use of this work, please see paragraphs 4.2 and 5 of our Terms.
© 2024 The Author(s). This work is published and licensed by Dove Medical Press Limited. The full terms of this license are available at https://www.dovepress.com/terms.php and incorporate the Creative Commons Attribution - Non Commercial (unported, v3.0) License.
By accessing the work you hereby accept the Terms. Non-commercial uses of the work are permitted without any further permission from Dove Medical Press Limited, provided the work is properly attributed. For permission for commercial use of this work, please see paragraphs 4.2 and 5 of our Terms.