")
Back to Journals » Journal of Healthcare Leadership » Volume 13
The Contribution of Variable Control Charts to Quality Improvement in Healthcare: A Literature Review
Authors Slyngstad L
Received 25 May 2021
Accepted for publication 31 July 2021
Published 10 September 2021 Volume 2021:13 Pages 221—230
DOI https://doi.org/10.2147/JHL.S319169
Checked for plagiarism Yes
Review by Single anonymous peer review
Peer reviewer comments 2
Editor who approved publication: Professor Russell Taichman
Line Slyngstad
Molde University College, Molde, 6410, Norway
Correspondence: Line Slyngstad
Molde University College, Britvegen 2, Molde, 6410, Norway
Tel +47 71214226
Email [email protected]
Objective: To conduct a literature review to determine where and how variable control charts have contributed to quality improvement in healthcare.
Methods: A targeted literature search of the ABI/INFORM Global, Science Direct, Medline and Google Scholar databases was conducted, which yielded 6875 papers. Screening articles on the basis of title and abstract resulted in references to 163 articles, leading to the identification of 29 articles published between 1992 and 2019 that met the inclusion criteria. Common themes, variables and units of analysis were then analyzed.
Results: Variable control charts have been applied in 11 different healthcare contexts, using 17 different variables, at various levels within healthcare organizations. The main reason for applying variable control charts is to demonstrate a process change, usually following a specific change or quality intervention. The study identified various limitations and benefits of applying variable control charts. The charts are visually easy to understand for both management and employees, but they are limited by their requirement for potentially complex and resource-intensive data collection.
Conclusion: Variable control charts contribute to quality improvement in healthcare by enabling visualization and monitoring of variations and changes in healthcare processes. The methodology has been most frequently used to demonstrate process shifts after quality interventions. There still is a great potential for more studies applying variable control charts.
Keywords: statistical process control, healthcare, quality improvement
Introduction
Quality of care can be defined as the
degree to which health services for individuals and population increase the likelihood of desired health outcomes and care consistent with professional knowledge.1
Quality of care can be measured through dimensions, most commonly effectiveness, safety, responsiveness, accessibility, equity and efficiency.2
In recent decades, quality improvement (QI) strategies and methods from industry have been applied more commonly to healthcare. Quality improvement involves concerted and continuous efforts to make changes that will improve patient outcomes, system performance and professional development.3 With rapid developments in technology and more complex healthcare systems, it is becoming increasingly important to apply methods to monitor whether changes lead to better quality and patient outcomes.
One of the most challenging tasks for healthcare leadership, is to control the processes leading to the desired quality. Over the last decade, researchers have demonstrated how control charts can be an efficient tool for monitoring processes and quality.
Statistical process control (SPC) methods are management tool for measuring and visualizing stability and monitoring QI from one point in time to another. These methods provide a powerful statistical tool for QI that distinguishes between special-cause variation and common variation. The literature on SPC in healthcare is growing, including literature reviews, tutorials and practitioners note, focusing on everything from general use of SPC in healthcare,4,5 to more specified topics, such as surgery6 or pressure ulcer prevention.7 Tutorials do also cover a wide range of areas such as detecting and monitoring hospital acquired infections,8 charts for data involving very large sample sizes,9 or the application of risk-adjusted control charts in health care.10
In addition, SPC is a practical tool that benefits different organizational levels, at the management level and front-line staff levels. Management refers to the leaders of healthcare organizations, and front-line staff is the employees dealing with the patients.
For the service quality to meet patients’ expectations, the process delivery must be stable and repeatable.11 Quality is sometimes best expressed through numerical measurements, such as the waiting time,12 length of stay13 or door-to-needle-time,14 where it is feasible to use variable control charts.11 These are SPC charts that use variables as a quality indicator. However, there appears to have been no previous review of the use of variable control charts in the context of health care.
The main objective of this literature review is to examine where and how variable control charts have contributed to QI in healthcare, including their objectives, outcomes, limitations, and benefits, for both management and front-line staff.
Materials and Methods
A targeted literature search in relevant databases was conducted by the author, to identify studies that meets the inclusion criteria. There was one reviewer of this article. Following sections describe the process of selecting articles included in the review.
Eligibility Criteria
Inclusion Criteria
The criteria for inclusion in the literature review were that the research should apply variable control charts in healthcare, and should be conducted in organizations providing care, such as hospitals, nursing homes and home healthcare.
Exclusion Criteria
Articles concerning pharmacies, laboratories and organizations providing mental health care, such as psychiatric hospitals, were excluded from the study, as were studies of random samples of patients across different institutions. Articles examining all levels of institutions were included, from organization to individual performance level. Only empirical articles were included, while tutorials, letters, reviews and books were excluded. All articles reviewed were written in English and published in peer-reviewed journals.
Study Identification
A search of the ABI/INFORM Global, Science Direct, Medline and Google Scholar databases was performed to identify research articles that applied SPC in healthcare for all years to date (2021). The search terms used were: control chart healthcare, statistical process control healthcare, variable control chart application healthcare, Shewhart control chart healthcare, process improvement healthcare, process analysis healthcare, six sigma healthcare, LSS healthcare and total quality management (TQM) healthcare. Relevant articles found in reference lists was included further in the review. When the searches were conducted, title and abstract were crucial if the article was included further in the review. It was often from the title or abstract which charts were used, since the type of variable determines what charts are appropriate to use.
Study Selection and Data Extraction
The title and abstract were reviewed to understand the content and ascertain whether the article met the inclusion criteria. If the inclusion criteria were not met, the article was excluded. Included articles were read in full, and information relevant to this review was extracted and organized in an Excel sheet, including title, authors, year of publication, country, criteria for inclusion, study objective, study outcome, output variable, journal, unit of analysis, study context and level of analysis, and length of period for the data used in the SPC charts. It was also noted whether variable control charts were used with additional methods of analysis, such as regression analysis or interviews. Visual statistics in the form of graphs were used to present relevant information from the data, such as country and year of publication. The review also extracted qualitative information on the objectives of the studies, their outcomes, and the limitations and benefits of applying SPC in healthcare.
Results
Results of the Search
The database search resulted in references to 6875 articles (see Figure 1). Screening articles on the basis of title and abstract resulted in references to 163 articles, of which 120 of the records were excluded. A reading of the abstracts suggested that 43 articles might meet the inclusion criteria. 15 of these articles were excluded; 7 applied run chart, 6 used attributes in their control chart, and 4 were was tutorial notes, and 26 of the articles met the inclusion criteria.13–40 The articles reference list were checked for possible articles, found 3 more. Thus, a total of 29 articles met the inclusion criteria.
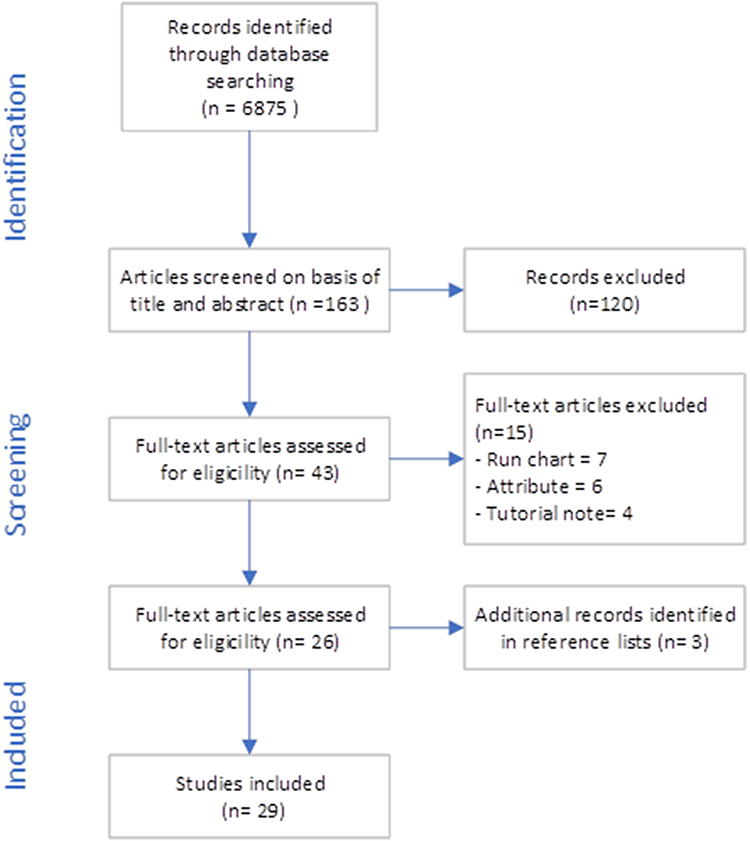 |
Figure 1 Flow diagram. |
Characteristics of the Studies
First, the articles were sorted by year of publication and the country in which the research was conducted (see Figure 2). The earliest study was published in 199241 and the latest in 2019.38 Both of these were conducted in the USA. Between 1992 and 2006, there were long gaps between publications, but from 2006 they became more frequent. The highest numbers of studies were published in 2014 and 2016, with four in 201415,24,26,33 and five in 2016.16,23,29–31
 |
Figure 2 Year of publication and country. |
Research for 11 of the articles was conducted in the USA,13,18,21,24,28,32,35–37,39,42 and one comparative study of the USA and Turkey38 was also categorized as USA. Three articles each were published in the UK,19,33,34 Sweden23,25,26 and India,15–17 and two each in Italy30,31 and Taiwan.20,40 Single studies were conducted in Brazil,29 Switzerland,14 Australia27 and Israel.20 Because the majority of articles were based on research in the USA, the others were classified into a single “other countries” category.
With regard to content, Table 1 summarizes the research contexts, output variables and units of analysis. Twelve studies were conducted in surgery departments,13,20,21,24,28–32,35,36,39 five in emergency departments19,25–27,33 and two in intensive care14,22 and health information departments.15,17 Single studies were conducted in a urology department,23 internal medicine,38 a medical record department,16 a registration department,37 a women, infants and children clinic18 and a general practice.34 One study focused on an entire hospital.41
 |
Table 1 Content of Articles |
The output variables used varied considerably. The most frequent was waiting time, which was used in six studies.13,18,25,26,34,37 Turnaround time was used in four studies,16,17,30,31 operative time in three20,24,32 and non-operative time in two.32,39 The remaining variables were used only once. The most frequent unit of analysis was department level, used in 15 articles, with the remainder conducted at individual patient, individual surgeon, individual observation and organizational levels. The follow up period in the papers, varied from 4 days to 34 months.
Reasons for Applying SPC and the Use of Additional Methods
There were different objectives for applying variable control charts in healthcare. They were generally applied to demonstrate a shift in a process, or for various reasons in retrospective studies. Fifteen studies applied variable control charts to demonstrate a change resulting from an improvement project.14,16–18,21,23,25–27,29,33,35–37,40 Waiting time was the most frequently used performance measure, used in four articles.18,25,26,37 Turnaround time was used as a measure in two articles,16,17 while the other variables were represented only once.
In the remaining studies, the reasons for applying variable control charts were diverse. In some articles, the charts were used to determine steady-state behavior or benchmarks,20,30,31 to measure variation or process performance,15,34,38 to identify links between changes and opportunities for improvement between hospital and micro- or/macro-systems,28 to evaluate whether nurse staffing was meeting needs,22 or for other reasons.19,24,39
 |
Figure 3 Were methods other than variable control charts used? |
It was noted that additional methods were often used when applying variable control charts. As illustrated in Figure 3, variable control charts were the only method used in 12 studies, while additional methods were used in 16 cases. In nine studies that used additional methods, quantitative methods were applied, while in seven articles a mixed-methods approach was adopted.
Limitations of Applying Variable Control Charts
Limitations to Data Collection
The most common limitation of applying variable control charts is that, for various reasons, collecting data may be resource-intensive and time-consuming. In some cases, where data are not readily available, collection may be complex and require people to collect sufficient data.19 Examples in the literature include undertaking manual patient chart reviews,28 collecting data on waiting times through data collection sheets,37 and measuring turnaround time for health records preparation with a stopwatch.17 Due to the time and resources required for collection, sample sizes may limit the results, since monitoring a process over time requires several months data.21 The analysis may therefore be limited to a specific period, such as one day or one shift, which may be unrepresentative of day-to-day occurrences, as the day on which the data were collected may be anomalous.19 For the similar reasons, data may be limited to one department.23
Limitations of Data Used in the Charts
A frequently raised issue is that variable control charts must sometimes be used alongside other methods. Variable control charts visualizes the performance of the output variable and do not necessarily have a descriptive function, so they must be supplemented with methods such as semi-structured interviews,25,26 descriptive statistics or value stream mapping.15,16 This is also the case when the data are retrospective and links between particular causes and events in the process cannot be identified.28,35 Such cases require the investigation of out-of-control points by care providers,38 so additional methods must be used.
Furthermore, observational bias may affect the recording of data, as in the Hawthorne effect, because observing people may improve their performance.19 In some studies this effect has been observed from the outset of the formal process analysis, but the effects are transient and should not be mistaken for definitive results.14
Other limitations reported include the difficulty of defining a true baseline or “before” period for comparison when seasonal differences affect the variables,27 and the fact that traditional control chart approaches make no adjustment for varying risk profiles. Medical contexts must deal with heterogeneous patient cases. Information on patient-related risk adjustment is rarely used,38 and few articles discuss the use of risk-adjusted Shewhart charts.20 In some cases, information on risk was unavailable, or it required information from systems to construct patient mix adjustment models, and information from a hospital-wide cost accounting system to measure total in-hospital cost.21
Like many other statistical methods, variable control charts require the data to be normally distributed. Sometimes they require transformed data, making it more difficult to present the data to others.21 It mayalso not involve the use of control groups,18 making generalization more challenging. For instance, when the unit of analysis is a single surgeon,39 the results are unlikely to be readily transposable to other surgical populations.35
Benefits of Applying Variable Control Charts
Variable Control Charts are Visually Easy to Understand
The selected articles mention several benefits of applying variable control charts. First, charts are reported to be visually easy to understand, and may reveal otherwise unobtainable insights.18 They may inspire the development of patient diagnosis-to-treatment routines and work process measurements, and enable the visualization of resource use.23 They may demonstrate whether a process is stable or unstable,34 and provide a method for assessing undisturbed or steady-state process behavior.30 Variable control charts measure effects over time through simple statistics.20 They provide early warning of systematic change taking place in a process,27,30,32,39 and enables the nature of an identified shift in performance, whether gradual or sudden, to be determined.39 Applying variable control charts in process analysis may significantly improve the quality of a time-sensitive process.14
Variable Control Charts are Useful for Front-Line Staff
Some articles suggest that variable control charts are helpful for employees. Front-line staff can see what is happening, with an opportunity to stand back from daily routines to view things differently.19 Variable control charts may also help to motivate cultural change and moves toward continuous improvement and excellence.15,19
Variable Control Charts are Useful for Management
Variable control charts benefit managers, enabling them to make decisions based on science rather than intuition.15 The charts can support public health agencies in developing service delivery processes,18 and allow comparison of an organization with and its partners or competitors.34 They provide insights into the processes investigated, allow the monitoring of consecutive events,14 and improve performance quality through early detection of problems.31 Variable control charts may be used as a monitoring tool for one-off interpretations.27 They may also help decision makers to achieve institutional goals and objectives,30 and to pinpoint performance shifts39 and the direction they are taking.34
Discussion
The review findings demonstrate that variable control charts contribute to QI in various healthcare settings, with different types of output variables, at different levels within healthcare organizations. The review also reveals the reasons for applying variable control charts and using additional methods, and it highlights the limitations and benefits of their use. The amount of previous research is less than expected, with only 29 articles meeting the inclusion criteria. The current healthcare environment, involving complex systems, presents enormous potential for using such methodologies in research and practical applications.
As illustrated by Figures 1 and 2, relevant research has increased since 2006. Primarily in the USA, with only nine studies in other countries. This may reflect a stronger tradition in the USA than in Europe regarding using applications from industry in healthcare.
There are several of benefits and limitations of applying variable control charts to QI in healthcare. The benefits and limitations mentioned in the articles indicate that variable control charts may be a powerful tool, especially in settings where data can easily be obtained. Several papers have noted that the charts are beneficial for both front-line staff and management because the charts are visual, and are good tools for understanding processes and supporting decision-making. Several articles have suggested that the application of variable control charts is limited by the resources required to collect data that are not readily available. Amassing data may require both time and resources that many institutions do not have, which may explain why few studies have applied variable control charts. However, technological developments in IT systems and applications are likely to make data collection easier and make the use of such methodologies more available. The studies included in this review suggest many potential research opportunities in new healthcare settings, as well environments where variable control charts have already been applied.
Variable control charts are a data-driven method. Application of variable control charts would not lead to changes but is often used to demonstrate process variation and effects of different quality interventions, for instance lean25 or six sigma.13 When data collection is time-consuming, and frequently used with other methods (Figure 2), it requires clear and present management to apply the charts, which might be an additional reason for the limited number of studies applying variable control charts.
From the origin SPC was applied to monitor variations in manufactured products.43 Because it sometimes difficult to provide products with equal quality from unit to unit, charts were used to monitor the variability. An example of this is the blade thickness in the production of jet turbines.11 To date, applying variable control charts in healthcare seems to have the most gain in cases where quality interventions have been made, usually after a process change or quality intervention. In such research, there would typically be more focus on whether a shift has occurred in the process, rather than on monitoring the variation itself. This concerns 15 of the selected articles in this review. The reason for this is uncertain but might relate to the service intangibility and heterogeneity, and the difficulty in research to find feasible measures to monitor. It would typically be easier to concretize a physical product than a service.
Variable control charts have been applied in 11 different healthcare fields, although some of these have been investigated more frequently than others. Some areas and variables have a more obvious connection to the quality of care than others, but most studies have a connection to the most common quality dimensions which are effectiveness, safety, responsiveness, accessibility, and efficiency.2 The results reveal great potential for applying variable control charts in QI in healthcare.
Twelve of the selected studies were conducted in surgery departments, of which five used operative and non-operative time as output variables.20,24,32,35,39 In these five studies, operative and non-operative time were used to monitor cost and efficiency. In other research, operative and non-operative time are related to safety. For example they correlate the duration of surgery with complications and higher risk.44,45 Longer operating times and increased use of theatres have also been shown to expose patients to greater risk of surgical site infections,24 and faster operating times are associated with better outcomes.46 Although variable control charts could be important for monitoring cost and efficiency, there might be potential for other measurements to be applied to SPC charts from surgery departments.
Concerning other measures monitored in surgery, reduced costs and increased efficiency seem to motivate the monitoring of turnaround time, first-case on-time start, and first-case tardiness.21,29–31,36 For first-case tardiness, delays, and patient satisfaction are mentioned as important factors.29 Days between incidences of HAPUs are considered “never events” that should be minimized.28 In the research in the review, cost, efficiency, safety and accessibility were cited as the primary reasons for monitoring operating rooms.
Eight studies were conducted in contexts where processes were highly time-sensitive, emergency departments19,25–27,33 and intensive care.14,22 In such settings, time may have significant consequences for the quality of treatment and patient outcomes. For instance, when treating myocardial infarction,14,40 door-to-needle and cycle times must be reduced, because treatments are most effective in the first hours.47 Variable control charts could provide valuable quality information when monitoring length and variation in time in such settings. Another example where variable control charts could provide valuable information, is ambulance response time after different interventions.
Waiting time is the most frequently used output variable in the articles13,18,25,26,34,37 motivated by efficiency and patient safety. Waiting time is a strong indicator of quality and patient satisfaction,18,34,37 and may affect mortality rates and lead to inefficient use of resources.25,26 It is broadly accepted in the literature that waiting times may significantly influence healthcare quality. Waiting time affect customer satisfaction,12 where total waiting time to visit a clinician is one of the most significant predictors.48 This variable is a strong quality predictor and should be readily available for institutions, it is surprising that it has not received greater attention in the literature on adopting a control chart approach. Unlike many other quality predictors in health care, waiting time is relatively easy to interpret, because it is desirable to minimize it in many settings.
Length of stay is used as an output variable in three articles13,27,38 concerning monitoring quality and performance. Although the connection between length of stay and quality of care is unclear in the selected studies, it has been accepted in the literature,49 and is often used as a metric of efficiency and effectiveness.50–52
In some studies, the objective of improvement projects was to make processes more efficient by reducing the time spent on time-consuming activities. Time spent on the registration process and preparing medical processes and health records are examples of this.15–17 In all these cases, variable control charts were used to monitor efficiency and reduce costs. For instance, reducing turnaround time on the preparation of health or medical record may improve department productivity and performance,16,17 or improve the registration process and reduce waiting times in the system.15
Conclusion
Variable control charts are a data-driven method. This review demonstrates that in health care, variable control charts have been most frequently used to demonstrate process shifts after quality interventions, such as for instance lean and Six Sigma. The review also reveals that even shown that even variable control charts are applied in various context to QI in healthcare, there still is a great potential for more studies applying variable control charts. To date, the surgery department and departments where process are highly time-sensitive, are the most frequent settings of applying variable control charts.
There are both limitations and benefits to applying variable control charts. The data for applying variable control charts often require resources to collect, and the charts are often used with other methods, which most likely explains the scarce amount of research applying variable control charts. Such research would also require clear and consistent management to apply the charts. Despite the limitations for application, the benefits of the charts` may help both employees and leaders understand the processes and monitor changes in healthcare QI.
Disclosure
The author reports no conflicts of interest for this work.
References
1. Kelley E, Hurst J. Health care quality indicators project: conceptual framework paper. OECD Health Working Paper No. 23. Paris: OECD Publishing; 2006.
2. Batalden PB, Davidoff F. What is ‘quality improvement’ and how can it transform healthcare? Qual Saf Health Care. 2007;16(1):2–3. doi:10.1136/qshc.2006.022046
3. Montgomery DC. Introduction to Statistical Quality Control. New York, NY: Wiley; 2009.
4. Thor J, Lundberg J, Ask J, et al. Application of statistical process control in healthcare improvement: systematic review. BMJ Qual Saf. 2007;16(5):387–399. doi:10.1136/qshc.2006.022194
5. Suman G, Prajapati D. Control chart applications in healthcare: a literature review. Int J Metrol Qual Eng. 2018;9:5. doi:10.1051/ijmqe/2018003
6. Nicolay C, Purkayastha S, Greenhalgh A, et al. Systematic review of the application of quality improvement methodologies from the manufacturing industry to surgical healthcare. Br J Surg. 2012;99(3):324–335. doi:10.1002/bjs.7803
7. Clark M, Young T, Fallon M. Systematic review of the use of statistical process control methods to measure the success of pressure ulcer prevention. Int Wound J. 2018;15(3):391–401. doi:10.1111/iwj.12876
8. Benneyan JC Design, use, and performance of statistical control charts for clinical process improvement. Research paper. Boston, MA: Northeastern University; 2001.
9. Benneyan JC, Lloyd R, Plsek P. Statistical process control as a tool for research and healthcare improvement. BMJ Qual Saf. 2003;12(6):458–464. doi:10.1136/qhc.12.6.458
10. Kaminsky FC, Maleyeff J, Providence S, et al. Using SPC to analyze quality indicators in a healthcare organization. J Healthc Risk Manag. 1997;17(4):14–22. doi:10.1002/jhrm.5600170404
11. Mohammed MA, Panesar JS, Laney DB, et al. Statistical process control charts for attribute data involving very large sample sizes: a review of problems and solutions. BMJ Qual Saf. 2013;22(4):362–368. doi:10.1136/bmjqs-2012-001373
12. Woodall WH, Montgomery DC. Some current directions in the theory and application of statistical process monitoring. J Qual Technol. 2014;46(1):78–94. doi:10.1080/00224065.2014.11917955
13. Bielen F, Demoulin N. Waiting time influence on the satisfaction–loyalty relationship in services. Manag Serv Qual. 2007;17(2):174–193. doi:10.1108/09604520710735182
14. Sedlack JD. The utilization of six sigma and statistical process control techniques in surgical quality improvement. J Healthc Qual. 2010;32(6):18–26. doi:10.1111/j.1945-1474.2010.00102.x
15. Bonetti PO, Waeckerlin A, Schuepfer G, et al. Improving time-sensitive processes in the intensive care unit: the example of ‘doortoneedle time’ in acute myocardial infarction. Int J Qual Health Care. 2000;12(4):311–317. doi:10.1093/intqhc/12.4.311
16. Chalmers I. Trying to do more good than harm in policy and practice: the role of rigorous, transparent, up-to-date evaluations. Ann Am Acad Pol Soc Sci. 2003;589(1):22–40. doi:10.1177/0002716203254762
17. Bhat S, Gijo E, Jnanesh N. Application of Lean Six Sigma methodology in the registration process of a hospital. Int J Product Perform Manag. 2014;63(5):613–643. doi:10.1108/IJPPM-11-2013-0191
18. Bhat S, Gijo E, Jnanesh N. Productivity and performance improvement in the medical records department of a hospital. Int J Product Perform Manag. 2016;65(1):98–125. doi:10.1108/IJPPM-04-2014-0063
19. Bhat S, Jnanesh N. Enhancing performance of the health information department of a hospital using lean Six Sigma methodology. Int J Six Sigma Competitive Advant. 2013;8(1):34–50. doi:10.1504/IJSSCA.2013.059776
20. Boe DT, Riley W, Parsons H. Improving service delivery in a county health department WIC clinic: an application of statistical process control techniques. Am J Public Health. 2009;99(9):1619–1625. doi:10.2105/AJPH.2008.138289
21. Castle A, Harvey R. Lean information management: the use of observational data in health care. Int J Product Perform Manag. 2009;58(3):280–299. doi:10.1108/17410400910938878
22. Chen TT, Chang YJ, Ku SL, et al. Statistical process control as a tool for controlling operating room performance: retrospective analysis and benchmarking. J Eval Clin Pract. 2010;16(5):905–910. doi:10.1111/j.1365-2753.2009.01213.x
23. Eisenstein EL, Bethea CF. The use of patient mix‐adjusted control charts to compare in‐hospital costs of care. Health Care Manag Sci. 1999;2(4):193–198. doi:10.1023/A:1019008400263
24. Gabbay U, Bukchin M. Does daily nurse staffing match ward workload variability? Three hospitals’ experiences. Int J Health Care Qual Assur. 2009;22(6):625–641. doi:10.1108/09526860910986885
25. Khatami A, Rosengren K. Reduced time from diagnosis to stone-free status in patients with ureteral calculi: a quantitative study. Int J Health Care Qual Assur. 2016;29(3). doi:10.1108/IJHCQA-03-2015-0028
26. Maruthappu M, Carty MJ, Lipsitz SR, et al. Patient- and surgeon-adjusted control charts for monitoring performance. BMJ Open. 2014;4(1):e004046. doi:10.1136/bmjopen-2013-004046
27. Mazzocato P, Holden RJ, Brommels M, et al. How does lean work in emergency care? A case study of a lean-inspired intervention at the Astrid Lindgren Children’s Hospital, Stockholm, Sweden. BMC Health Serv Res. 2012;12(1):28. doi:10.1186/1472-6963-12-28
28. Mazzocato P, Thor J, Backman U, et al. Complexity complicates lean: lessons from seven emergency services. J Health Organ Manag. 2014;28(2):266–288. doi:10.1108/JHOM-03-2013-0060
29. O’Brien D, Williams A, Blondell K, et al. Impact of streaming ‘fast track’ emergency department patients. Aust Health Rev. 2006;30(4):525–532. doi:10.1071/AH060525
30. Padula WV, Mishra MK, Weaver CD, et al. Building information for systematic improvement of the prevention of hospital-acquired pressure ulcers with statistical process control charts and regression. BMJ Qual Saf. 2012;21(6):473–480. doi:10.1136/bmjqs-2011-000340
31. Ramos P, Bonfá E, Goulart P, et al. First-case tardiness reduction in a tertiary academic medical center operating room: a lean six sigma perspective. Perioper Care Oper Room Manag. 2016;5:7–12. doi:10.1016/j.pcorm.2016.12.001
32. Scagliarini M, Apreda M, Wienand U, et al. Monitoring operating room turnaround time: a retrospective analysis. Int J Health Care Qual Assur. 2016;29(3):351–359. doi:10.1108/IJHCQA-08-2015-0105
33. Scagliarini M, Apreda M, Wienand U, et al. Exponentially weighted moving average control schemes for assessing hospital organizational performance. Statistica. 2016;76(2):127–139.
34. Seim A, Andersen B, Sandberg WS. Statistical process control as a tool for monitoring nonoperative time. Anesthesiology. 2006;105(2):370–380. doi:10.1097/00000542-200608000-00021
35. Silvester K, Harriman P, Walley P, et al. Does process flow make a difference to mortality and cost? An observational study. Int J Health Care Qual Assur. 2014;27(7):616–632. doi:10.1108/IJHCQA-09-2013-0115
36. Sliwa M, O’Kane J. Service quality measurement: appointment systems in UK GP practices. Int J Health Care Qual Assur. 2011;24(6):441–452. doi:10.1108/09526861111150707
37. Smith MP, Sandberg WS, Foss J, et al. High-throughput operating room system for joint arthroplasties durably outperforms routine processes. Anesthesiology. 2008;109(1):25–35. doi:10.1097/ALN.0b013e31817881c7
38. Tiwari V, Ehrenfeld J, Sandberg W. Does a first-case on-time-start initiative achieve its goal by starting the entire process earlier or by tightening the distribution of start times? Br J Anaesth. 2018;121(5):1148–1155. doi:10.1016/j.bja.2018.05.043
39. Yu Q, Yang K. Hospital registration waiting time reduction through process redesign. Int J Six Sigma Competitive Advant. 2008;4(3):240–253. doi:10.1504/IJSSCA.2008.021838
40. Pakdil F, Azadeh-Fard N, Esatoglu AE. Monitoring length of stay through control charts: a comparative study of diabetic patients. Hosp Pract. 2019;47(4):196–202. doi:10.1080/21548331.2019.1664883
41. Seim AR, Dahl DM, Sandberg WS. Rapid communication: small changes in operative time can yield discrete increases in operating room throughput. J Endourol. 2007;21(7):703–708. doi:10.1089/end.2007.0030
42. Yeh HL, Lin CS, Su CT, et al. Applying lean six sigma to improve healthcare: an empirical study. Afr J Bus Manag. 2011;5(31):12356–12370.
43. Kerley FR, Nissly BE. Total quality management and statistical quality control: practical applications to waste stream management. Hosp Mater Manag Q. 1992;14(2):40–59.
44. Hart MK, Robertson JW, Hart RF, et al. X and s charts for health care comparisons. Qual Manag Health Care. 2006;15(1):2–14. doi:10.1097/00019514-200601000-00002
45. Daley BJ, Cecil W, Clarke PC, et al. How slow is too slow? Correlation of operative time to complications: an analysis from the Tennessee Surgical Quality Collaborative. J Am Coll Surg. 2015;220(4):550–558. doi:10.1016/j.jamcollsurg.2014.12.040
46. Fogarty B, Khan K, Ashall G, et al. Complications of long operations: a prospective study of morbidity associated with prolonged operative time (> 6 h). Br J Plast Surg. 1999;52(1):33–36. doi:10.1054/bjps.1998.3019
47. Peersman G, Laskin R, Davis J, et al. Prolonged operative time correlates with increased infection rate after total knee arthroplasty. HSS J. 2006;2(1):70–72. doi:10.1007/s11420-005-0130-2
48. Boersma E, Maas AC, Deckers JW, et al. Early thrombolytic treatment in acute myocardial infarction: reappraisal of the golden hour. Lancet. 1996;348(9030):771–775. doi:10.1016/S0140-6736(96)02514-7
49. Dansky KH, Miles J. Patient satisfaction with ambulatory healthcare services: waiting time and filling time. J Healthc Manag. 1997;42(2):165–177.
50. Lagoe RJ, Westert GP, Kendrick K, et al. Managing hospital length of stay reduction: a multihospital approach. Health Care Manage Rev. 2005;30(2):82–92. doi:10.1097/00004010-200504000-00002
51. Lagoe RJ, Westert GP. Improving outcomes with community-wide distribution of health care data. Health Care Manage Rev. 2004;29(1):67–76. doi:10.1097/00004010-200401000-00008
52. Albert K, Sherman B, Backus B. How length of stay for congestive heart failure patients was reduced through six sigma methodology and physician leadership. Am J Med Qual. 2010;25(5):392–397. doi:10.1177/1062860610371823
 © 2021 The Author(s). This work is published and licensed by Dove Medical Press Limited. The full terms of this license are available at https://www.dovepress.com/terms.php and incorporate the Creative Commons Attribution - Non Commercial (unported, v3.0) License.
By accessing the work you hereby accept the Terms. Non-commercial uses of the work are permitted without any further permission from Dove Medical Press Limited, provided the work is properly attributed. For permission for commercial use of this work, please see paragraphs 4.2 and 5 of our Terms.
© 2021 The Author(s). This work is published and licensed by Dove Medical Press Limited. The full terms of this license are available at https://www.dovepress.com/terms.php and incorporate the Creative Commons Attribution - Non Commercial (unported, v3.0) License.
By accessing the work you hereby accept the Terms. Non-commercial uses of the work are permitted without any further permission from Dove Medical Press Limited, provided the work is properly attributed. For permission for commercial use of this work, please see paragraphs 4.2 and 5 of our Terms.