")
Back to Journals » Drug Design, Development and Therapy » Volume 15
Simultaneous Determination of Loratadine and Its Metabolite Desloratadine in Beagle Plasma by LC-MS/MS and Application for Pharmacokinetics Study of Loratadine Tablets and Omeprazole‑Induced Drug–Drug Interaction
Authors Zhang Y, Zhang J, Xu Q, Wang Y, Wu W, Wang W, Li X, Zhang T
Received 7 July 2021
Accepted for publication 3 November 2021
Published 22 December 2021 Volume 2021:15 Pages 5109—5122
DOI https://doi.org/10.2147/DDDT.S328106
Checked for plagiarism Yes
Review by Single anonymous peer review
Peer reviewer comments 2
Editor who approved publication: Professor Manfred Ogris
Yu Zhang, Jiaming Zhang, Qiuchi Xu, Yimeng Wang, Wenying Wu, Weiping Wang, Xiaoting Li, Tianhong Zhang
Wuya College of Innovation, Shenyang Pharmaceutical University, Shenyang, 110016, People’s Republic of China
Correspondence: Tianhong Zhang
Wuya College of Innovation, Shenyang Pharmaceutical University, No. 103, Wenhua Road, Shenyang, Liaoning Province, 110016, People’s Republic of China
Tel +86-24-23984159
Fax +86-24-23986321
Email [email protected]
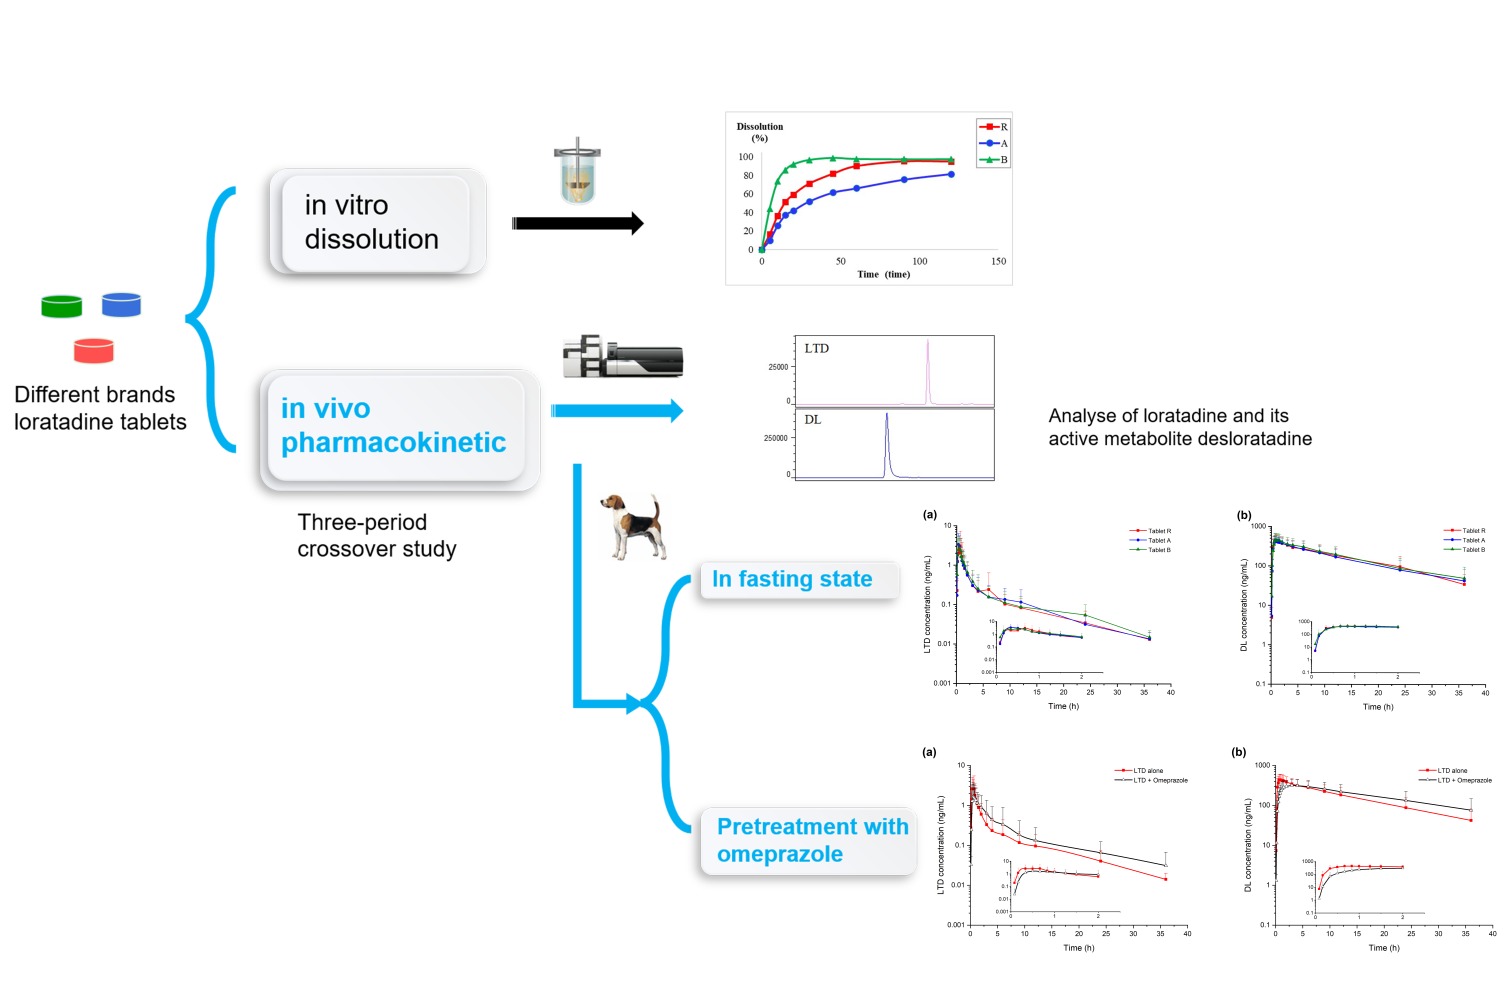
Background: Loratadine (LTD) is a Biopharmaceutical Classification System II basic drug with pH-sensitive aqueous solubility and dissolution is a speed-limiting step of its absorption. The drug dissolution and the gastrointestinal tract pH conditions are likely to influence the in vivo pharmacokinetic behavior of LTD tablets.
Materials and Method: A rapid, sensitive, and reliable bioanalytical method for simultaneous quantitation of LTD and its active metabolite desloratadine (DL) in beagle plasma was developed and validated based on liquid chromatography tandem mass spectrometry (LC-MS/MS). Sample preparation in low plasma consumption was accomplished by liquid–liquid extraction. The chromatographic separation was achieved on a Phenomenex Kinetex C8 column using acetonitrile and 5 mM ammonium formate as the mobile phase. A comparative pharmacokinetics study of three LTD tablets with different dissolution rates was conducted in male beagles in fasting state and an omeprazole-induced drug–drug interaction (DDI) study was subsequently performed under pretreatment of omeprazole.
Results and Conclusion: The method showed a good linear correlation over the concentration ranges of 0.008– 24 ng/mL for LTD and 0.8– 800 ng/mL for DL, and was successfully applied to analyze the two compounds in beagle plasma. Pharmacokinetic results showed in the fasting state the three LTD tablets were equivalent in beagles in terms of effective components. DL of the three tablets were equivalent, indicating metabolite was less susceptible to pharmaceutic preparation factors for LTD tablets in beagles. Moreover, significant changes in LTD and DL pharmacokinetics parameters were observed under the effect of omeprazole-induced pH increase in gastrointestinal tract, suggesting that DDI effects are of concern for the curative effect of LTD when combined with omeprazole. The findings will contribute to the future pharmaceutical preparations research as well as the clinical application of LTD.
Keywords: loratadine, desloratadine, LC-MS/MS, beagle dog, pharmacokinetic comparation, drug–drug interaction
Graphical Abstract:
Introduction
Allergic disorders, defined as “specific immunological hypersensitivity leading to disease,” are increasingly prevalent in modern industrialized countries, affecting up to 30% of the population and causing major public health concern worldwide.1,2 Loratadine (LTD), a powerful once-a-day, long-acting, non-sedative, second-generation antihistaminic drug in the nasal region and in the conjunctivae, originally marketed worldwide as Claritin®, is very popularly prescribed and has become a first-line agent for the treatment of allergic rhinitis, urticaria, and hay fever due to an excellent safety record.3–6 LTD is rapidly absorbed after oral administration and the time reaching peak plasma concentration is about 0.5–2 h. Metabolic studies have shown that LTD undergoes extensive first-pass metabolism to form its major active metabolite desloratadine (DL), primarily via CYP2D6 and CYP3A4 activity and to a lesser extent by other CYP enzymes.6–10 DL shows 2.5–4-fold higher affinity for histamine H1 receptors than LTD, and is currently marketed as Clarinex® for allergic rhinitis and chronic idiopathic urticaria, and eventually plays a united anti-allergic effect when combined with LTD.11–13 Thus, LTD and DL have been recommended as analytes to be measured when conducting pharmacokinetic studies of LTD.14
From the perspective of Biopharmaceutical Classification System (BCS), LTD is classified as a Biopharmaceutical Classification System II basic (BCS IIb) drug with pH-sensitive solubility in aqueous solutions and high permeability, and dissolution is a speed-limiting step of absorption.15,16 To date, LTD tablets with different dissolution properties widely circulate commercially. There are concerns about the quality of these generic drugs in the post-marketing setting. Whereas, generic pharmaceutical products play a vital role in world healthcare by lowering the costs of medication and increasing access to medical treatment.17,18 To achieve clinical interchangeability with the original branded product, the generic formulations must deliver the same amount of active drug substance, and in the same rate into the bloodstream with the reference. A commonly accepted evaluation method is the study of the preparation’s pharmacokinetic properties.19,20 It is necessary to preliminarily investigate whether LTD tablets with different dissolution rates have influence on pharmacokinetic behaviors of LTD and DL.
Furthermore, pH-dependent drug–drug interactions (DDI) may occur in the gastrointestinal tract to BCS IIb drugs, which require a low gastric pH to achieve adequate solubility and dissolution. The elevated gastric pH by hypochlorhydria or taking antacid agents could easily have a negative effect on the dissolution of such drugs, and may lead to the altered absorption as the drugs transit from the stomach into a more neutral pH in the small intestine.21–23 The “Framework for Assessing pH-Dependent Drug-Drug Interactions” posted by the United States Food and Drug administration (FDA) in 2018 also highlighted the importance of assessing a drug’s susceptibility to pH-dependent DDIs.24 Omeprazole, a classic proton-pump inhibitor (PPI), is widely used to treat the gastric acid-related disorders due to its marked and prolonged duration of gastric acid suppression, which inevitably interact with some drugs at the gastrointestinal level.25,26 Polypharmacy is common among users of PPI. For many individuals, PPI and allergy medications are long-term treatments often concurrently administered for stomach and allergic diseases, which are prevalent chronic diseases.1,26,27 For loratadine, a weak base antiallergic drug, cautions should be paid when omeprazole was co-prescribed as alterations in LTD bioavailability may occurred due to changes in solubility, dissolution rate, and metabolic interactions.27–29 Hence, it is very necessary to comprehensively evaluate the DDI risk between omeprazole and LTD through pharmacokinetic experiments.
In the present study, a comparison of the pharmacokinetic properties of three LTD tablets with different dissolution rates and an omeprazole-induced DDI were conducted in male beagle dogs separately under fasting and omeprazole pretreatment conditions. To our knowledge, there was no current validated approach to simultaneously determine both LTD and DL levels in beagle plasma in any dosage forms. A literature search revealed bioanalytical methods using gas chromatography and LC with fluorescence or ultraviolet or mass detector to quantify LTD and DL in human and rat plasma.30–37 Liquid chromatography tandem mass spectrometry (LC-MS/MS) is a popular approach as other methods usually exhibit poor sensitivity, prolonged analysis time or redundant pre-processing processes. Among the available LC-MS/MS methods, Naidong et al achieved the lower limit of quantification (LLOQ) of LTD as low as 0.01 ng/mL.32 However, the 1 mL plasma volume and 35 μL injection volume required are considered too large and greatly limit the applicability of the method. Thus, there is an urgent need to develop a new highly sensitive quantitative method with low plasma consumption on account of the trace LTD concentration in beagles. In this study, a simple and sensitive LC-MS/MS method using a small plasma sample and injection volume was developed and validated for simultaneous determination of LTD and DL plasma concentration in beagles. The method was then successfully applied to perform comparative pharmacokinetic studies of 10 mg LTD tablets in male beagles.
Materials and Methods
Chemicals and Reagents
LTD (purity: >99.7%), DL (purity: >99.6%), cyproheptadine (purity: >99.7%, CPD, IS1), and diphenhydramine (purity: >99.7%, DPM, IS2) (Figure 1) standards were obtained from the National Institutes for Food and Drug Control (Beijing, PR China). Commercially available LTD tablets R (LTD 10 mg, the original tables Clarityne®), tablets A and B (LTD 10 mg, two different generic tables) were purchased from a local drugstore (dissolution profiles of the three tablets are shown in Figure 2). Methanol, acetonitrile, and ammonium acetate were of LC-MS grade and were acquired from Fisher Scientific (Pittsburgh, PA, USA). HPLC-grade ethyl acetate, dichloromethane, and n-hexane were supplied by Yu Wang Chemical Co., Ltd. (Jinan, China). All other chemicals were of analytical grade.
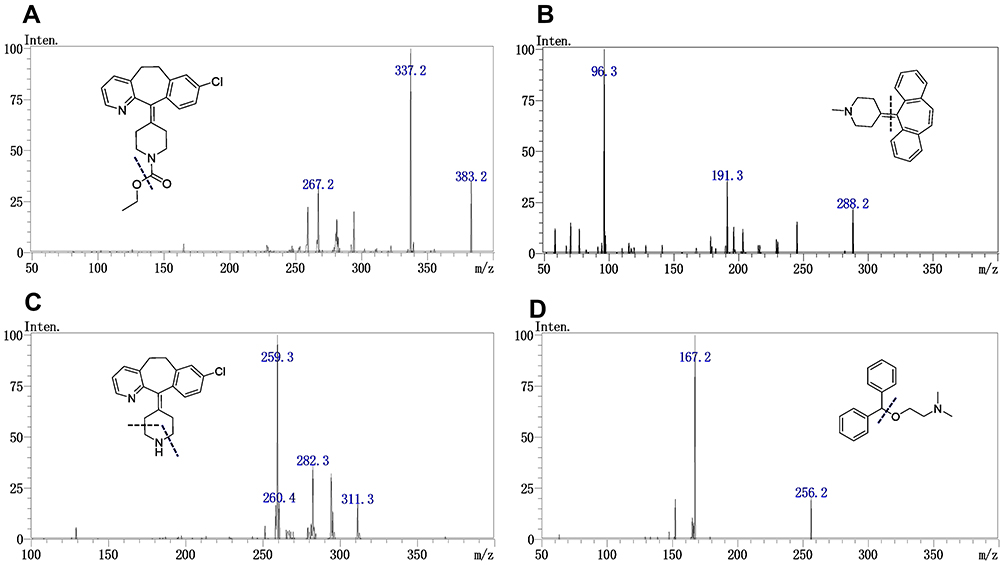 |
Figure 1 MS2 spectra of LTD (A), IS1 (B), DL (C) and IS2 (D). |
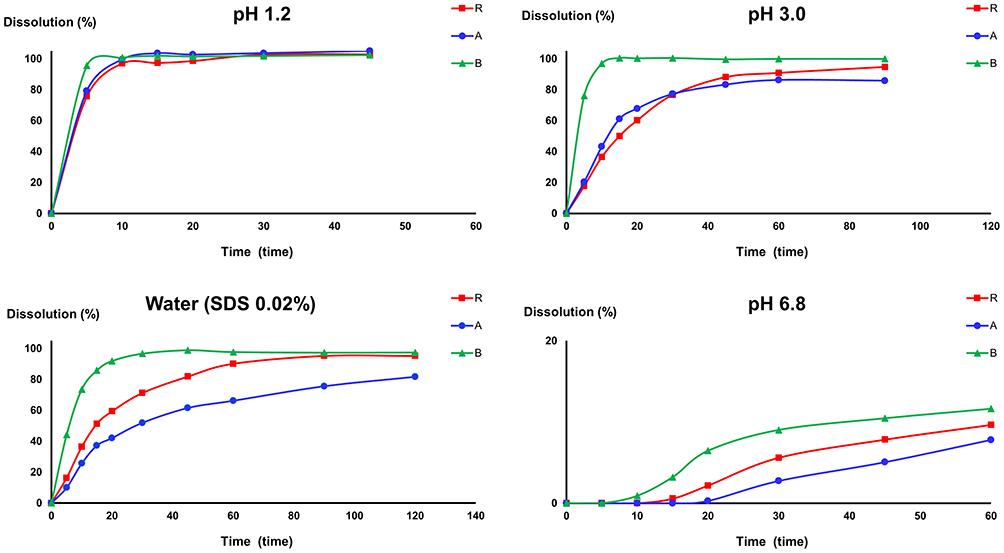 |
Figure 2 Dissolution profiles of LTD tablets (tablet R, tablet A and tablet B) in different pH media using stirring paddle method with media volume of 500 mL. |
Liquid Chromatography and MS/MS Conditions
Samples were analyzed using a Shimadzu HPLC system (DGU-20A3 Degasser; LC-20AD pump; CBM-20A Communication Module; SIL-20AC Autosampler; CTO-30AS column oven) coupled to a Shimadzu 8060 tandem mass spectrometer (Shimadzu, Kyoto, Japan). The separation was implemented on a Phenomenex Kinetex C8 column (50 × 2.1 mm, 2.6 μm) at 40°C using a gradient elution with the chosen mobile phase consisting of water (containing 5 mM ammonium formate, A)-acetonitrile (B). The gradient procedures using a flow rate of 0.4 mL/min were optimized as follows: 0–3 min, 20–85% B; 3–3.5 min, 85% B; 3.5–3.6 min, 85–20% B; and 3.6–5 min, 20% B. The auto-sampler was maintained at 4°C and the injection volume was 2 μL.
The Triple Quadrupole mass spectrometer was connected to the LC system through an electrospray ionization (ESI) interface operated in positive ion mode. Intense and stable [M+H]+ ions and their corresponding daughter ions were identified using a precursor ion scan and product ion scan. The chemical structure and mass spectra of LTD, DL as well as IS1 and IS2 are described in Figure 1. The optimized ESI source parameters were as follows: Nebulizer gas: 3.0 L/min; heating gas: 10 L/min; drying gas: 10 L/min; dissolvent line: 250°C; interface temperature: 350°C; heat block temperature: 400°C. The multiple reaction monitoring (MRM) transitions and compound dependent parameters (Table 1), such as voltage potential Q1pre, Q3pre, and collision energy (CE), were automatically adjusted and optimized using LabSolution software “Optimization for method” to achieve maximum responses for all the analytes and IS. All data acquisition and processing were performed using LCMS LabSolution software ver. 5.80 from Shimadzu.
 |
Table 1 Optimized Mass Spectrum Parameters of LTD, DL, IS1 and IS2 (Positive Ion Mode) |
Standard Solutions Preparation
The primary stock standard solutions at the concentration of 100 μg/mL for LTD, DL, IS1 and IS2 were prepared separately by dissolving accurately weighed amounts of their respective standards in methanol. The stock solutions of LTD and DL were successively diluted using 50% methanol as the solvent to yield a series of working solutions for constructing calibration curves and quality control (QC) samples. While QC samples and the calibration standards were prepared from separated stock solutions. The selective mixed IS working solution (10 ng/mL for IS1 and 20 ng/mL for IS2) was diluted using the same procedure. All the stock solutions were stored at −20°C until use.
Plasma Sample Pretreatment
Plasma samples were pretreated using a liquid–liquid extraction (LLE) method. For known concentrations of plasma samples like the calibration curve and quality control (QC) samples, an aliquot of 200 μL plasma sample was respectively spiked with 20 μL of IS, 20 μL of LTD and 20 μL of DL working solution, and then vortexed for 1 min. For plasma samples obtained after dosing, the same amount of 50% methanol was added instead of the LTD and DL solution. Next, 200 μL of borax-sodium carbonate buffer (pH = 11) and 3 mL of mixed organic solvents containing ethyl acetate, dichloromethane, and n-hexane (3:1:1, v/v /v) were added to the spiked plasma. After vortex mixing for 3 min and centrifugation at 4000 rpm for 10 min, 2.5 mL of the upper organic layer was carefully transferred into the glass tube and evaporated to dryness at 37°C under nitrogen gas. The dry residue was dissolved in 300 µL solution (methanol: water=2:1) with vortex-mixing for 3 min. After centrifuged at 15000 rpm for 10 min, 2 µL of the supernatant fluid was injected into the LC-MS/MS system.
Bioanalytical Method Validation for Beagle-Spiked Plasma
The newly developed assay was fully validated with reference to FAD Guidance for Industry: Bioanalytical Method Validation (2018).38 Specificity, Selectivity, carryover, linearity, precision, accuracy, extraction recovery, matrix effects and stability evaluations were conducted as follows.
Specificity and Carryover
Blank plasma from six individual beagle dogs, blank plasma samples spiked with analytes at LLOQ concentration and IS, and real plasma samples after oral administration of LTD were compared to assess the selectivity of this method. For each compound, the MRM channel was monitored to ensure that no interference by matrix components or other substance influenced the retention time for each analyte. Carryover was assessed by analyzing blank plasma samples injected after use of upper limit of quantification (ULOQ) samples.
Linearity and Sensitivity
Apart from a blank sample and a zero sample (blank plus IS), the final 10-point calibration curve included calibrators at the concentrations of 0.008, 0.024, 0.08, 0.24, 0.8, 2.4, 8 and 24 ng/mL for LTD and 0.8, 1.6, 4, 8, 16, 40, 80, 160, 400 and 800 ng/mL for DL was prepared daily to assess the concentration range of the collected sample. The peak area ratio of the analytes to their corresponding IS versus the plasma concentration was used for plotting the calibration curve, respectively. Using the weighed (1/x2) least-squares regression line method, a linearity equation was constructed, and evaluated using the correlation coefficient (r) obtained, and back calculated to get concentration value.
Precision and Accuracy
Intra- and inter-day precision and accuracy were evaluated by sextuple analysis of LLOQ and QC samples on three successive days. Relative standard deviation (RSD) and relative error (RE) were used to express precision and accuracy, respectively. QC samples were prepared at four concentration levels of 0.02, 0.2, 6 and 20 ng/mL as LQC (low QC), MQC (medium QC), MHQC (medium high QC), and HQC (high QC) for LTD, and 2, 40, 300 and 600 ng/mL for DL, respectively.
Recovery and Matrix Effect
Extraction recovery (RE) for each analyte was evaluated by extracted samples at QC concentrations (QC samples) versus extracts of blanks spiked with the analyte post extraction (unextracted samples). The matrix effect (ME) was determined using the unextracted samples versus the neat spiked solution at the same concentration. The IS-normalized matrix factor (MF) was eventually used to assess the ME by calculating the ME ratio of the analyte and IS. Plasma samples from different beagles were analyzed in sextuplicate but the neat spiked solution in triplicate. The comparison was based on the mean peak area of the repetitive samples.
Stability
The stability of the analytes in dog plasma was carried out using QC samples. It contained the items of room temperature stability (storage at room temperature for 8 h), post-preparation stability (storage in an auto-sampler maintained at 4 °C for 8 h), long-term stability (storage at −80 °C for 30 days) and freeze-thaw stability (repeated freeze-thaw cycles three times). Each QC sample was analyzed in triplicate and the accuracy deviation was calculated to prove the stability.
Pharmacokinetics Study Design
Nine healthy male beagle dogs (12 ± 2 kg) were selected from the Laboratory Animal Center of Shenyang Pharmaceutical University for all the pharmacokinetic studies and all protocols were approval by the Animal Care Committee of Shenyang Pharmaceutical University (Ethical review number: SYPU-IACUC-C2018-4-9-501). And the current experiment was also approved according to the Laboratory animals-guidelines for ethical review of welfare (GB/T 35892–2018). First, an open-label, randomized, single-dose, three-period crossover study with a 10-day washout period was conducted under fasting state. Beagle dogs were fasted for 12 h before each period of sample collection but with access to water. To investigate the PPI impact to the absorption of LTD, another randomized, single-dose, 3-period crossover study with a 10-day washout period was then assessed in the nine beagle dogs under pretreatment of omeprazole capsule (20 mg, Losec®) twice daily consecutively for three days and a capsule of omeprazole was given 45 min ahead of the LTD tablets dosing after an overnight fast of 12 h. During each period, subjects were orally administered the LTD tablet R, A and B (10 mg) with 20 mL water. Prior to drug administration (0 hours) and at 0.0833, 0.1666, 0.3333, 0.5, 0.6666, 0.8333, 1, 1.25, 1.5, 2, 3, 4, 6, 9, 12, 24 and 36 h post-dose, 1.2 mL blood samples were collected from the antebrachial vein into heparin-treated tubes and immediately centrifuged at 4000 rpm for 8 min. Plasma was separated and stored at −80◦C until analysis.
Pharmacokinetics Data Analysis
Pharmacokinetics parameters from plasma concentration time data of LTD and DL for each animal were assessed using the non-compartmental method of the Chinese Pharmacological Association Data Analysis System (DAS), Version 2.1.1 (Anhui, China). For each individual, the maximum plasma concentration (Cmax) and the time to achieve of the maximum plasma concentration (tmax) were obtained directly from the observed data, while the area under the plasma concentration vs time curve (AUC0–t) was calculated through the linear trapezoidal method, and the area under the plasma concentration vs time curve from 0 extrapolated to infinity (AUC0−∞) was the plus of AUC0–t and the area of extension which was extrapolated from the predicted concentration at the last time point with quantifiable concentrations. The elimination half-life (t1/2) was fitted using 3–5 consecutive time points in the terminal phase. The mean residence time (MRT) was the ratio of the area under the moment curve and the plasma concentration-time curve. The apparent clearance (CLz/F) was the radio of dose and area under the plasma concentration-time curve. And the apparent volume of distribution (Vz/F) was CLz/F times MRT. All data were presented as means with the standard deviation for each group. To evaluate significant differences of different brands of loratadine tablets and omeprazole-induced DDI, the nonparametric Wilcoxon rank-sum test for Tmax and t1/2, and the paired-samples t-test for other pharmacokinetic parameters were conducted using the Statistical Package for the Social Sciences (SPSS) software (SPSS Inc., version 17.0, Chicago, IL, USA), and a p value < 0.05 was deemed to be statistically significant. To preliminarily evaluate the equivalence of the two test preparations in beagles, the Analysis of Variance (ANOVA) was applied to calculate the 90% confidence intervals (CIs) of the geometric mean ratios using naturally log-transformed data (Cmax, AUC0-t, and AUC0-∞) and the nonparametric analysis (Wilcoxon signed-rank test) was performed to calculate 90% CIs of the median (Tmax). The analysis was completed also by DAS 2.1.1.
Results and Discussion
Liquid Chromatographic and MS/MS Conditions
In this study, we developed a sensitive and reliable bioanalytical method to determine LTD and DL in beagle plasma after the administration of LTD in a single analysis using LC-MS/MS. Two internal standards (cyproheptadine and diphenhydramine) were carefully selected to separately match with LTD and DL because of the large difference in peak area caused by the large concentration difference. All the analytes, belonging to alkaline compounds with an amino group, are easily protonated and were naturally monitored in the positive mode. The chromatographic conditions (analytical column, mobile phases, gradient elution, flow rate, and injection volume) were adjusted and optimized mainly to achieve a satisfactory separation, reasonable run time, and symmetric peak shape, as well as minimize the matrix effect of the target analytes. Acetonitrile, provided lower system pressure, and was chosen as the organic phase. As for the aqueous phase, LTD could easily achieve a good peak shape and shorter retention time as pure water was used, but the DL was difficult to elute resulting in long peak time and serious peak tailing. Next, formic acid, ammonium formate, and ammonium acetate at different concentrations were added to the water, and among these conditions the ammonium salt could dramatically improve the elution of DL, and all the analytes showed appropriate peak shape and peak time.
Plasma Sample Pretreatment
For the plasma sample preparation, the precipitation protein method was simple but LTD had marked signal suppression in the ESI-MS detection mode, namely a matrix effect. In addition, LTD needed to be concentrated given the low pg/mL range in most beagle plasma samples. Thanks to all analytes having high values of log P, the liquid–liquid extraction (LLE) technique was explored for the sample clean-up. To obtain adequate RE and ME, different organic solvents (methyl tert-butyl ether, ethyl acetate, dichloromethane, n-hexane, diethyl ether), alkaline solvents (NaOH, NaCO3, phosphate buffer, and borax-sodium carbonate buffer), and reconstituted solvents (methanol, acetonitrile, pure water) were tested. At the same time chromatographic conditions, including the degree of the gradient, the type, and concentration of ammonium salt, were also adjusted to get better results of RE and ME. Eventually, a mixture of ethyl acetate, dichloromethane, and n-hexane and the borax-sodium carbonate buffer were chosen in the LLE process to mitigate the signal inhibition and obtain the highest RE of the analytes. The water in the reconstituted solvent contributed significantly to increase the RE of DL. The ammonium formate in the aqueous phase, the low initial organic content, the shallow gradient, the small injection volume, and the choice of IS further allowed LTD to achieve a qualified ME. Furthermore, a large redissolved volume and low injection volume generated reduced on-column loading, which allowed to extend the service life of the column. Moreover, the use of a glass tube led to a more stable and higher RE compared to the disposable plastic test tubes which gave rise to an adsorption effect.
Method Validation
Selectivity
Typical chromatograms evaluating selectivity are presented in Figure 3, chromatograms of the six blank plasma samples containing no co-eluting peaks greater than 20% of the area of each analyte (LLOQ) and 5% of each IS indicating no endogenous substances affected the determination substance. The retention time for LTD, DL, IS1, and IS2 were 3.2, 2.4, 2.8, and 2.3 min, respectively. As for the carryover study, there were no clear peaks (>20% of the LLOQ or 5% of the IS) in blank plasma samples after injection of the ULOQ samples implying that the method was free from a carryover effect.
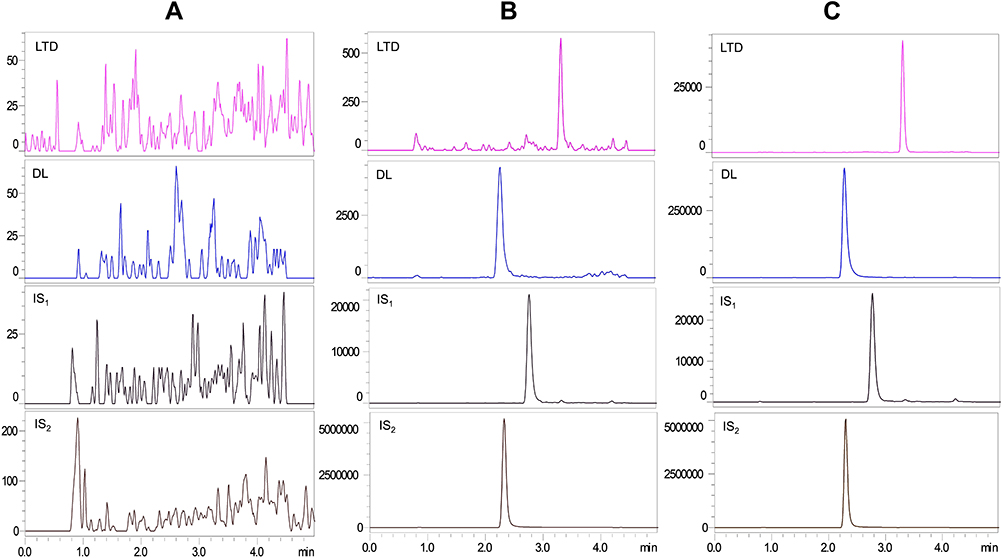 |
Figure 3 MRM chromatograms of LTD, DL, IS1 and IS2 in beagle dog plasma: (A) blank plasma sample, (B) blank plasma spiked with LTD and DL at LLOQ and the corresponding IS1 and IS2, (C) extracted plasma sample from a beagle after an oral administration of LTD tablet. |
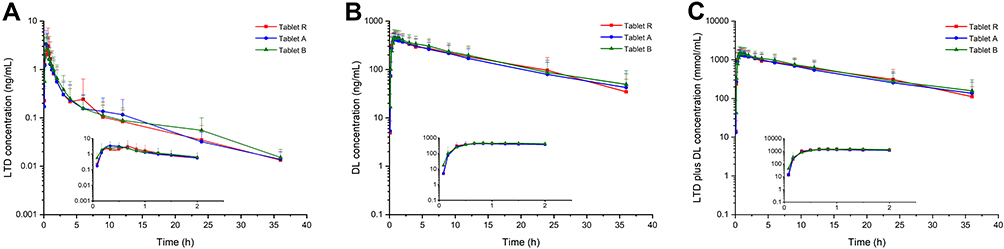 |
Figure 4 Pharmacokinetic profiles of LTD (A), DL (B) and the sum of the two components (C) after oral administration of 10 mg LTD tablet formulation R, A and B in fasting state in male beagles. |
Linearity and Sensitivity
The established method was validated on three separate days. Calibration curves showed a good correlation coefficient (r > 0.99) in the range of 0.008–24 ng/mL for LTD and 0.8–800 ng/mL for DL. The back-calculated concentrations of calibrators points had acceptable accuracies in the range of 85–115% of their nominal concentrations but 80%–120% at the LLOQ concentrations. Typical linear regression equations obtained as follows: Y = 1.41201X + 0.00269 (r = 0.999, LTD) and Y = 0.00761X + 0.00097 (r = 0.999, DL). LLOQ samples for LTD and DL presented identifiable peaks and were sufficiently sensitive for pharmacokinetic studies of LTD and DL.
Accuracy and Precision
Accuracy and precision for the LLOQ and the four QC samples are summarized in Table 2. For both compounds, all data were within the required validation criteria suggesting this method achieved good data reproducibility.
 |
Table 2 Intra-Day and Inter-Day Precision and Accuracy for the Simultaneous Determination of LTD and DL in Spiked Beagle Plasma (Intra-Day: n = 6; Inter-Day: n = 6 Series per Day, 3 Days) |
Recovery and Matrix Effect
As shown in Table 3, the RE of each analyte was stable (RSD% < 10%) and high (about 80%) considering not all the supernatant had been removed during the preparation. While the data of the ME for all the analytes were within the range of 85–115% as required, indicating that, ion suppression or enhancement could be ignored from beagle dog plasma under the established conditions for LTD, DL and IS. The satisfactory values of RE and ME guaranteed the determinability of the analytes in plasma samples.
 |
Table 3 Extraction Recovery and Matrix Effect of QC Samples for the Simultaneous Determination of LTD and DL in Spiked Beagle Plasma |
Stability
The results of the stability assay are presented in Table 4 and the RE and RSD values of the QC samples were within the required range. The data demonstrated that LTD and DL were stable under the four tested conditions.
 |
Table 4 Stability Results of LTD and DL in Spiked Beagle Plasma Under Different Storage Conditions (n = 3) |
Pharmacokinetic Application
The current developed LC-MS/MS method was successfully applied for quantitative determination of concentrations of LTD and DL in beagle plasma after a single oral administration of a 10 mg LTD tablet either alone or after dosing of omeprazole. The representative chromatograms of the actual subject samples are displayed in Figure 3, and mean plasma concentration-time curves on a semi-logarithmic scale of LTD and DL in fasting state are shown in Figure 4. The main pharmacokinetic parameters of the three kinds of tablets, presented as the arithmetic mean parameters of each subject, are summarized in Table 5.
 |
Table 5 Key Pharmacokinetic Parameters of LTD and DL After Oral Administration of 10 Mg LTD Tablet R, A and B in Fasting State to Male Beagles |
Pharmacokinetics of LTD in Beagles
Taking the reference tablet for example, the parent drug LTD was rapidly absorbed and metabolized to DL with a mean Tmax for LTD of 0.389 h and Tmax of DL of 0.795 h, while DL exhibited a longer t1/2 than LTD of 10.541 h and 7.554 h, respectively, indicating the slower elimination of DL. The Cmax and AUC 0-t for DL (472.0 ng/mL and 5740.3 ng.h/mL, respectively) were much greater than those of LTD (3.717 ng/mL and 5.472 ng.h/mL, respectively) due to the high pre-systemic metabolism of LTD. As shown in Table 6, the concentration level of DL showed a significant difference to those of humans in which the Cmax for LTD and DL were at the same concentration levels after oral administration of 10 mg LTD, meanwhile the AUC0−t and AUC0−∞ were similar.39–41 When using metabolite ratio (MR) calculated by the AUC0-∞ ratio of metabolite and parent drug to evaluate the degree of metabolism, the MR of LTD in beagle dogs was much higher than humans. The large differences tend to be the result of species-related metabolic difference. For instance, previously evaluated animal models (mice, rats, and monkeys) do not produce metabolites relevant to humans, such as 3-OH-DL and its glucuronidation compound, which are the downstream of DL.6,9,10 According to the literature and experimental data summarized in Table 6, for the same species, independently of the dose of LTD or DL, the key DL pharmacokinetic parameters except for Tmax were nearly the same, indicating DL had similar fates both as a metabolite or parent drug.25–27 It may be speculated that the concentration difference of DL between beagles and humans was related to the generation and elimination of DL in the body.
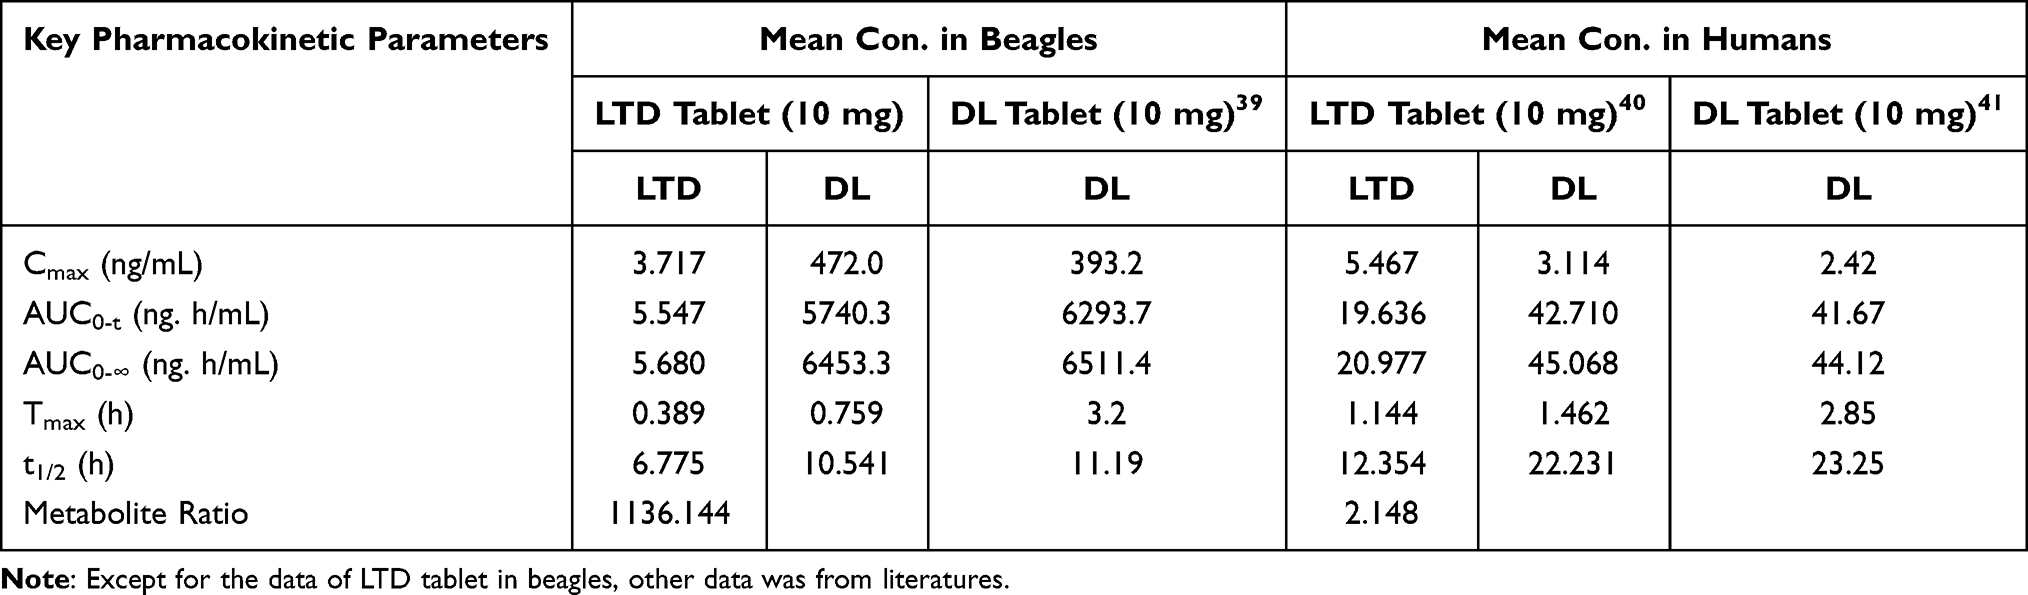 |
Table 6 Comparison of Mean LTD and DL Pharmacokinetic Parameters Between Beagles and Humans After Oral LTD or DL Tablets |
Pharmacokinetics Comparation of Different LTD Tablets
The first objective for conducting the LTD and DL pharmacokinetics study was to perform a comparative evaluation of the bioavailability of three different tablets preparations and to explore the relationship between the in vivo pharmacokinetic profiles and in vitro dissolution curves. As shown in Table 5, the key pharmacokinetic parameters of LTD and DL after fasting administration of the three formulations did not result in significant pharmacokinetic differences. For instance, the mean Cmax of tablet R, A, and B for LTD were 3.717 ng/mL, 3.914 ng/ mL, and 3.777 ng/mL, and for DL were 472.0 ng/mL, 446.5 ng/mL, and 496.9 ng/mL, respectively. The mean AUC0−t of tablet R, A, and B for LTD were 5.472 ng.h/mL, 5.814 ng.h/ mL, and 5.807 ng.h/mL, and for DL were 5740.3 ng.h/mL, 5436.6 ng.h/mL, and 6072.6 ng.h/mL, respectively. To preliminarily evaluate the equivalence of the two test tablets in beagles, pharmacokinetic parameters with a 90% CI were calculated. For DL the 90% CI for the Cmax AUC0-t, and AUC0−∞ were 82.7%–110.4%, 83.8%–108.4%, and 83.2%–110.0% for tablet A and 89.5%–119.6%, 92.4%–119.5%, and 94.2%–124.5% for tablet B, and both tablets were well within the regulatory criteria of 80.00%–125.00% lower and upper limits, whereas the parameters for the LTD preparations were all outside the predefined values. Since LTD and DL present effective components, LTD plus DL concentrations were also considered as the primary “bio-relevant” pharmacokinetic readout. Confidence interval analysis of the combination of the two active components revealed that the key pharmacokinetic parameters were within the acceptable range of 80.00–125.00% for the two tested formulations, indicating for beagles the two generics were equivalent to the reference in terms of effective components.
As the parent drug, the pharmacokinetic profile of the LTD was directly related to the disintegration and dissolution process of tablets, which were the focus of generic drugs. All the three LTD tablets used in this study met the requirement of the Chinese Pharmacopoeia (2020), showing no differences in pH 1.2 media, but produced a distinct dissolution rate and degree in other high pH dissolution mediums. Pharmacokinetics results showed that the pharmacokinetic profiles of LTD in beagles did not present significant differences between tablet R and the two generic drug, which may be related to the dissolution profiles in pH 1.2. However, what needs our attention is the high variability of LTD caused by the individual gastric pH variability, high first pass metabolism and other individual difference. Therefore, a greater number of subjects should be enrolled in the comparative pharmacokinetics study to allow a more definitive assessment of LTD. However, it is almost certain that DL was equivalent for the different LTD tablets as DL levels were independent of the formulation factors as an active metabolite.
Omeprazole-Induced DDI Study of the LTD
The other objective for conducting the LTD and DL pharmacokinetics study was to evaluate the effects of the concomitant administration with omeprazole on the pharmacokinetics properties of LTD and DL. The cross-over study of the three formulations was then conducted under omeprazole pretreatment according to the experimental scheme. LTD and DL pharmacokinetics profiles were compared with that of LTD treatment alone as shown in Figure 5. The three tablets were combined to more robustly evaluate the influence of omeprazole on LTD pharmacokinetics. Key pharmacokinetic parameters of LTD and DL are summarized in Table 7. The results indicated that coadministration of omeprazole indeed had a significant impact on the LTD and DL pharmacokinetics. The mean Cmax values of LTD and DL were reduced to 40% and 24%. While, the mean Tmax values of LTD and DL were prolonged to 1.225 h and 2.812 h, respectively. The mean MRT0-t values for LTD and DL are extended to 6.721 h and 13.115 h, respectively, and mean MRT0−∞ values for LTD and DL respectively are extended to 8.888 h and 24.825 h. Furthermore, the mean t1/2 and AUC0−∞ values for DL increased up to 54% and 43%, respectively. There were no significant changes in other pharmacokinetic parameters.
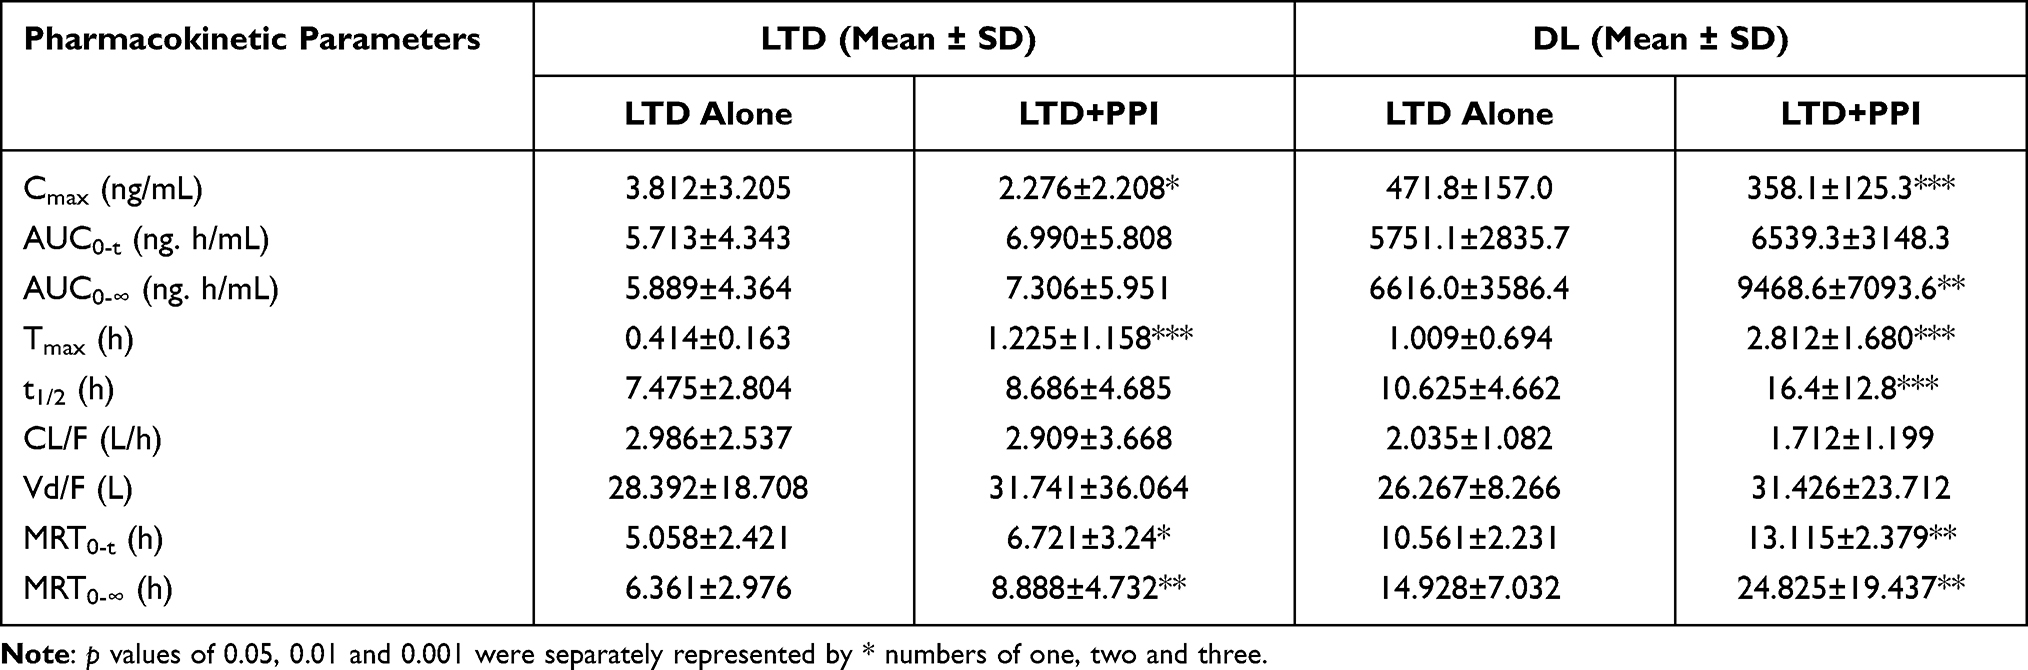 |
Table 7 Pharmacokinetic Parameters of LTD and DL in Nine Male Beagle Dogs with the Combination of Three Tablets After Oral Administration of LTD Tablet Alone or LTD Tablet Under Pretreatment of Omeprazole |
 |
Figure 5 LTD (A) and DL (B) pharmacokinetic profiles with the combination of three tablets in nine male beagle dogs after oral administration of LTD tablet alone or LTD tablet under pretreatment of omeprazole. |
Omeprazole could inhibit gastric acid secretion and remarkably elevate the gastric pH to 6 in beagles.42 LTD exhibits a pH-dependent solubility profile as a weak base and the solubility decreases sharply with the increasing pH.15 Furthermore, this sharp decline in the pH-solubility profile is also highly susceptible to the omeprazole-induced changes in gastrointestinal pH. In view of the low pKa value (4.5) for LTD, it is unlikely that it can remain supersaturated sufficiently long enough as the drug transits from the hypochlorhydric gastric juices to the alkaline environment of the intestinal fluids where LTD is absorbed and metabolized. For BCS II drugs with high permeability, dissolution of LTD is the rate-limiting step of its absorption. Hence, the omeprazole-induced pH rise would inevitably cause a decrease in the dissolution rate of LTD, and have a negative impact on the absorption of LTD, resulting in the reduced Cmax, the delay in peak time and MRT for both LTD and DL. Omeprazole undergoes CYP-mediated metabolism, mainly through CYP2C19 and CYP3A4 enzymes, and is also an in vivo inhibitor of the both enzymes.27 As described above, CYP2C19 and CYP3A4 enzymes also play a critical role in the extensive metabolism of LTD to DL and of DL to other secondary metabolites. Thereby, treatment with omeprazole, given the effects of the enzymes, may potentially inhibit the further metabolism of DL and then prolong the elimination of DL, and in turn increasing the half-life and AUC0−∞ values of DL.
Overall, the omeprazole-induced pH increase primarily accounted for the Cmax fall, Tmax and MRT delay of LTD and DL, while omeprazole-mediated enzyme effects may lead to the t1/2 and AUC0−∞ values increase for DL. Our findings showed the existence of a DDI between omeprazole and LTD, suggesting that subjects regularly taking omeprazole may indeed present the risk that the peak pharmacodynamic properties of their medications may be reduced due to reduced concentrations of the components, which could be important for therapeutic effects of LTD. Greater attention should be paid to these pharmacokinetic effects in the clinic. In addition, our study also provided meaningful reference for the pharmacokinetic profiles of other BCS IIb drugs. It is important to be vigilant about the risk of changes in drug therapeutic efficacy with marked fluctuations in the gastrointestinal pH.
Conclusion
In this study, a sensitive and reliable LC-MS/MS method was developed and fully validated for the simultaneous determination of LTD and its main active metabolite DL in beagle dog plasma. A low plasma consumption in sample preparation and a low LLOQ value for LTD was achieved in the method. The proposed method provided a valuable tool to study pharmacokinetic profiles of LTD and DL in beagles, and was successfully applied to the comparative pharmacokinetic analysis of three different LTD tablets with different dissolution rates and an omeprazole‑induced DDI study. The mean pharmacokinetic parameters of LTD and DL after fasted administration of the three LTD tablets showed no significant differences. The equivalence evaluation results indicated that in the fasting state the three LTD tablets were equivalent in terms of effective components in beagles. And DL of the three tablets were also equivalent, suggesting metabolites were not easily affected by preparation factors. Additionally, under the effect of PPI-induced pH increase caused by co-administering omeprazole ahead of time, the pharmacokinetic behavior of LTD and DL indeed reflected significant changes, suggesting that taking omeprazole daily would ultimately lead to DDI between LTD and omeprazole in beagles. Our findings will be conducive to future pharmaceutical preparation research as well as the clinical practice of LTD. Meanwhile, our study also provided meaningful reference for other drugs of a similar nature.
Disclosure
The authors have declared no conflict of interest.
References
1. Brozek JL, Bousquet J, Agache I, et al. Allergic Rhinitis and its Impact on Asthma (ARIA) guidelines-2016 revision. J Allergy Clin Immunol. 2017;140(4):950–958. doi:10.1016/j.jaci.2017.03.050
2. Kapoora Y, Kumar K. Structural and clinical impact of anti-allergy agents: an overview. Bioorg Chem. 2020;94:103351. doi:10.1016/j.bioorg.2019.103351
3. Haria M, Fitton A, Peters DH. Loratadine. A reappraisal of its pharmacological properties and therapeutic use in allergic disorders. Drugs. 1994;48(4):617–637. doi:10.2165/00003495-199448040-00009
4. Lawrence M, Du Buske MD. Clinical comparison of histamine H1-receptor antagonist drugs. J Allergy Clin Immunol. 1996;98:S307–318. doi:10.1016/S0091-6749(96)80116-3
5. Philpot EE. Safety of second generation antihistamines. Allergy Asthma Proc. 2000;21(1):15–20. doi:10.2500/108854100778249033
6. Ramanathan R, Reyderman L, Kulmatycki K, et al. Disposition of loratadine in healthy volunteers. Xenobiotica. 2007;37(7):753–769. doi:10.1080/00498250701463317
7. Hilbert J, Radwanski E, Weglein R, et al. Pharmacokinetics and dose proportionality of loratadine. J Clin Pharmacol. 1987;27(9):694–698. doi:10.1002/j.1552-4604.1987.tb03090.x
8. Sharma A, Hamelin BA. Classic histamine H1 receptor antagonists: a critical review of their metabolic and pharmacokinetic fate from a bird’s eye view. Curr Drug Metab. 2003;4(2):105–129. doi:10.2174/1389200033489523
9. Ramanathan R, Alvarez N, Su AD, et al. Metabolism and excretion of loratadine in male and female mice, rats and monkeys. Xenobiotica. 2005;35(2):155–189. doi:10.1080/00498250500038906
10. Aratyn-Schaus Y, Ramanathan R. Advances in high-resolution MS and hepatocyte models solve a long-standing metabolism challenge: the loratadine story. Bioanalysis. 2016;8(16):1645–1662. doi:10.4155/bio-2016-0094
11. Kleinetebbe J, Josties C, Frank G, et al. Inhibition of IgE- and non-IgE-mediated histamine release from human basophil leukocytes in vitro by a histamine H1-antagonist, desethoxycarbonyl-loratadine. J Allergy Clin Immunol. 1994;93(2):494–500. doi:10.1016/0091-6749(94)90359-X
12. Murdoch D, Goa KL, Keam SJ. Desloratadine-an update of its efficacy in the management of allergic disorders. Adis Drug Evaluation. 2003;63(19):2051–2077. doi:10.2165/00003495-200363190-00010
13. Fura A, Shu YZ, Zhu MS, et al. Discovering drugs through biological transformation: role of pharmacologically active metabolites in drug discovery. J Med Chem. 2004;47(18):4339–4351. doi:10.1021/jm040066v
14. Product-specific guidances for generic drug development; 2008. Available from: https://www.accessdata.fda.gov/scripts/cder/psg/index.cfm.
15. Khan MZ, Rausl D, Zanoski R, et al. Classification of loratadine based on the biopharmaceutics drug classification concept and possible in vitro-in vivo correlation. Biol Pharm Bull. 2004;27(1635):1630–1635. doi:10.1248/bpb.27.1630
16. Popovi G, Cakar M, Agbaba D. Acid-base equilibria and solubility of loratadine and desloratadine in water and micellar media. J Pharmaceut Biomed. 2009;49(1):42–47. doi:10.1016/j.jpba.2008.09.043
17. Davit BM, Nwakama PE, Buehler GJ, et al. Comparing generic and innovator drugs: a review of 12 years of bioequivalence data from the United States Food and Drug Administration. Ann Pharmacother. 2009;43(10):1583–1597. doi:10.1345/aph.1M141
18. Alfonso-Cristancho R, Andia T, Barbosa T, et al. Definition and classification of generic drugs across the world. Appl Health Econ Health Policy. 2015;13(Suppl 1):S5–S11. doi:10.1007/s40258-014-0146-1
19. Micheal F, Sayana M, Motial BM. Current regulatory standpoint on evaluating the bioequivalence of different classes of generic drugs - Is the evaluation in the right direction? Curr Drug Metab. 2019;20(10):835–844. doi:10.2174/1389200220666191007152542
20. Yang Y, Maliepaard M. Interchangeability of Generics-experiences and outlook toward pharmacokinetics variability and generic-generic substitution. Clin Pharmacol Ther. 2018;105(2):292–294. doi:10.1002/cpt.1250
21. Frank KJ, Locher K, Zecevic DE, et al. In vivo predictive mini-scale dissolution for weak bases: advantages of pH-shift in combination with an absorptive compartment. Eur J Pharm Sci. 2014;61:32–39. doi:10.1016/j.ejps.2013.12.015
22. Chung J, Kesisoglou F. Physiologically based oral absorption modelling to study gut-level drug interactions. J Pharm Sci. 2018;107(1):18–23. doi:10.1016/j.xphs.2017.08.015
23. Van Den Abeele J, Kostantini C, Barker R, et al. The effect of reduced gastric acid secretion on the gastrointestinal disposition of a ritonavir amorphous solid dispersion in fasted healthy volunteers: an in vivo - in vitro investigation. Eur J Pharm Sci. 2020;151:105377. doi:10.1016/j.ejps.2020.105377
24. [Docket No. FDAe2018eNe1820], framework for assessing pH dependent drug-drug interactions. U.S. Food and Drug Administration. Available from: https://www.gpo.gov/fdsys/pkg/FR-2018-05-22/pdf/2018-10927.pdf.
25. Richardson P, Hawkey CJ, Stack WA. Proton pump inhibitors. Pharmacology and rationale for use in gastrointestinal disorders. Drugs. 1998;56:307–335. doi:10.2165/00003495-199856030-00002
26. Blume H, Donath F, Warnke A, et al. Pharmacokinetic drug interaction profiles of proton pump inhibitors. J Drug Safety. 2006;29(9):769–784. doi:10.2165/00002018-200629090-00002
27. Li W, Zeng S, Yu L, et al. Pharmacokinetic drug interaction profile of omeprazole with adverse consequences and clinical risk management. Ther Clin Risk Manag. 2013;9:259–271. doi:10.2147/TCRM.S43151
28. Soons PA, Berg GVD, Danhof M, et al. Influence of single- and multiple-dose omeprazole treatment on nifedipine pharmacokinetics and effects in healthy subjects. Eur J Clin Pharmacol. 1992;42(3):319–324. doi:10.1007/BF00266355
29. Gerson LB, Triadafilopoulos G. Proton pump inhibitors and their drug interactions: an evidence-based approach. Eur J Gastroenterol Hepatol. 2001;13(5):611–616. doi:10.1097/00042737-200105000-00025
30. Johnson R, Christensen J, Lin CC. Sensitive gas-liquid chromatographic method for the determination of loratadine and its major active metabolite, descarboethoxyloratadine, in human plasma using a nitrogen-phosphorus detector. J Chromatogr B. 1994;657(1):125–131. doi:10.1016/0378-4347(94)80078-2
31. Zhong D, Blume H. HPLC-determination of loratadine and its active metabolite descarboethoxyloratadine in human plasma. Die Pharmazie. 1994;49(10):736–739.
32. Yin OQP, Shi X, Chow MSS. Reliable and specific high-performance liquid chromatographic method for simultaneous determination of loratadine and its metabolite in human plasma. J Chromatogr B. 2003;796(1):165–172. doi:10.1016/j.jchromb.2003.08.023
33. Sora DI, Udrescu S, David V, et al. Validated ion pair liquid chromatography/fluorescence detection method for assessing the variability of the loratadine metabolism occurring in bioequivalence studies. Biomed Chromatogr. 2007;21(10):1023–1029. doi:10.1002/bmc.845
34. Patel BN, Sharma N, Sanyal M, et al. LC-MS-ESI for the determination of loratadine and descarboethoxyloratadine in human plasma. J Chromatogr Sci. 2010;48(1):35–44. doi:10.1093/chromsci/48.1.35
35. Sutherland FCW, de Jager AD, Badenhorst D, et al. Sensitive liquid chromatography-tandem mass spectrometry method for the determination of loratadine and its major active metabolite descarboethoxyloratadine in human plasma. J Chromatogr A. 2001;914(1):37–43. doi:10.1016/S0021-9673(01)00646-X
36. Weng ND, Addison T, Schneider T, et al. A sensitive LC/MS/MS method using silica column and aqueous-organic mobile phase for the analysis of loratadine and descarboethoxy-loratadine in human plasma. J Pharmaceut Biomed. 2003;32(4):609–617. doi:10.1016/S0731-7085(03)00168-7
37. Zhang YX, Lu YH, Wang LJ, et al. Pharmacokinetics and tissue distribution of loratadine, desloratadine and their active metabolites in rat based on a newly developed LC-MS/MS analytical method. Drug Res. 2020;70(10):528–540. doi:10.1055/a-1233-5575
38. Food and Drug Administration Center for Drug Evaluation and Research, Bioanalytical method validation guidance for industry; 2018. Available from: https://www.fda.gov/regulatory-information/search-fda-guidance-documents/bioanaly-tical-method-validation-guidance-industry.
39. Liu L, Qi M, Wang P, et al. High-performance liquid chromatographic method for the bioequivalence evaluation of desloratadine fumarate tablets in dogs. J Pharmaceut Biomed. 2004;34:1013–1019. doi:10.1016/j.jpba.2003.11.002
40. Patel BN, Sharma N, Sanyal M, et al. LC-MS-ESI for the determination of loratadine and descarboethoxyloratadine in human plasma. J Chromatogr Sci. 2010:48. doi:10.1093/chromsci/48.1.35
41. Xu HR, Li XN, Chen WL, et al. Simultaneous determination of desloratadine and its active metabolite 3-hydroxydesloratadine in human plasma by LC/MS/MS and its application to pharmacokinetics and bioequivalence. J Pharm Biomed Anal. 2007;45:659–666. doi:10.1016/j.jpba.2007.07.012
42. Yamada I, Goda T, Kawata M, et al. Application of gastric acidity-controlled beagle dog to bioavailability study of cinnarizine. Yakugaku Zasshi. 1990;110(4):280–285. doi:10.1248/yakushi1947.110.4_280
 © 2021 The Author(s). This work is published and licensed by Dove Medical Press Limited. The full terms of this license are available at https://www.dovepress.com/terms.php and incorporate the Creative Commons Attribution - Non Commercial (unported, v3.0) License.
By accessing the work you hereby accept the Terms. Non-commercial uses of the work are permitted without any further permission from Dove Medical Press Limited, provided the work is properly attributed. For permission for commercial use of this work, please see paragraphs 4.2 and 5 of our Terms.
© 2021 The Author(s). This work is published and licensed by Dove Medical Press Limited. The full terms of this license are available at https://www.dovepress.com/terms.php and incorporate the Creative Commons Attribution - Non Commercial (unported, v3.0) License.
By accessing the work you hereby accept the Terms. Non-commercial uses of the work are permitted without any further permission from Dove Medical Press Limited, provided the work is properly attributed. For permission for commercial use of this work, please see paragraphs 4.2 and 5 of our Terms.