")
Back to Journals » International Journal of Women's Health » Volume 16
Significant Prognostic Factor at Age Cut-off of 73 Years for Advanced Ovarian Serous Cystadenocarcinoma Patients: Insights from Real-World Study
Authors Zhang K, Feng S, Wang Y, Feng W, Shen Y
Received 8 September 2023
Accepted for publication 22 January 2024
Published 3 February 2024 Volume 2024:16 Pages 203—218
DOI https://doi.org/10.2147/IJWH.S439335
Checked for plagiarism Yes
Review by Single anonymous peer review
Peer reviewer comments 2
Editor who approved publication: Professor Elie Al-Chaer
Ke Zhang,1 Songwei Feng,1 Yan Wang,1 Wen Feng,2 Yang Shen1,3
1Department of Obstetrics and Gynecology, Zhongda Hospital, School of Medicine, Southeast University, Nanjing, People’s Republic of China; 2Department of Gynecology, The First People’s Hospital of Lianyungang, Lianyungang, 222000, People’s Republic of China; 3Institute of Sports and Health, Nanjing, People’s Republic of China
Correspondence: Wen Feng, Department of Gynecology, The First People’s Hospital of Lianyungang, Lianyungang, 222000, People’s Republic of China, Tel +86-0518-85452253, Fax +86-0518-85456700, Email [email protected] Yang Shen, Department of Obstetrics and Gynaecology, Zhongda Hospital, School of Medicine, Southeast University, Nanjing, Jiangsu, 210096, People’s Republic of China, Email [email protected]
Objective: The objective of this research was to determine the age cut-off for worse prognosis and investigate age-related differentially expressed genes (DEGs) in patients with advanced ovarian serous cystadenocarcinoma (AOSC).
Methods: In this research, we included a cohort of 20,846 patients diagnosed with AOSC, along with RNA-seq data from 374 patients in publicly available databases. Then we used the X-tile software to determine the age cut-off and stratified the patients into young and old groups. We utilized propensity score matching (PSM) to balance baseline between the young and old groups. Furthermore, we conducted an enrichment analysis of DEGs between the two age groups using Kyoto Encyclopedia of Genes and Genomes (KEGG) pathways and gene ontology (GO) to identify dysregulated pathways. To evaluate the potential prognostic value of the DEGs, we performed survival analysis, such as Kaplan-Meier analysis and Log rank test.
Results: We stratified the patients into young group (n=16,336) and old group (n=4510) based on the cut-off age of 73 years by X-tile software. Age over 73 years was identified as an independent risk factor for overall survival (OS) and cancer-specific survival (CSS). Next, we identified 436 DEGs and found that the neurotrophin signaling pathway and translation factor activity were associated with prognosis outcomes. Among the top 10 hub genes (RELA, NFKBIA, TRAF6, IRAK2, TAB3, AKT1, TBP, EIF2S2, MAPK10, and SUPT3H), RELA, TAB3, AKT1, TBP, and SUPT3H were found to be significantly associated with poor prognosis in old patients with AOSC.
Conclusion: Our study determined 73 years as the cutoff value for age in patients with AOSC. RELA, TAB3, AKT1, TBP, and SUPT3H were identified as age-related DEGs that could contribute to the poor prognosis of older patients with AOSC.
Keywords: advanced ovarian serous cystadenocarcinoma, propensity score matching, prognosis, real-world study, age
Introduction
Ovarian cancer is prevalent and remains a common gynecological malignancy worldwide. Although ovarian cancer has a lower incidence than cervical cancer, according to the latest research, it has the highest mortality rate of gynecological malignancies with 5%.1 Meanwhile, ovarian cancer is comprised of a range of malignant tumors, which are heterogeneous in etiology, molecular biology, and other characteristics, including epithelial ovarian cancer, sex cord-stromal ovarian cancer, germ cell ovarian cancer and other type of ovarian cancer.2 Epithelial ovarian cancer represents the predominant form of ovarian cancer, accounting for more than 90% of all cases and ovarian serous cystadenocarcinoma accounts for more than half of epithelial ovarian cancer which means that ovarian serous cystadenocarcinoma is the most commonly occurring subtype among all types of ovarian cancer.3 However, most ovarian serous cystadenocarcinomas are advanced tumors at the time of initial diagnosis, due to the absence of typical clinical signs and symptoms and specific diagnostic methods, and the prognosis of patients with the advanced ovarian serous cystadenocarcinoma (AOSC) is poor.4 The factor age is a crucial prognostic factor in numerous types of solid cancer.5–7 Meanwhile, one of the widely recognized risk factors for the prognose of ovarian cancer is age, and the probability of developing ovarian cancer varies according to age.8,9 It is regrettable that the optimal age threshold is still missing for distinguishing old patients from young patients in AOSC, heretofore.
Real world study (RWS) is a method of using real world data to investigate clinical problems, such as etiology, diagnosis and prognosis, which is becoming an indispensable research method in the field of medical research.10 For RWS, Lorenzi et al indicated that the first-line use of osimertinib revealed both efficacy and safety in the treatment of advanced non-small cell lung cancer with EGFR mutation.11 The team of Hung obtained the scientific discovery that patients with ovarian cancer had the better prognosis by using bevacizumab.12 Therefore, it is important to conduct real-world studies on ovarian serous cystadenocarcinomas in order to get a better understand of this disease.
The Surveillance, Epidemiology, and End Results (SEER) database has emerged as one of the most comprehensive publicly available databases, including the huge amount of American clinical information such as incidence, treatment and prognosis, from which global researchers can obtain tremendous useful message to conduct clinical research for free. The Cancer Genome Atlas (TCGA) is a highly fruitful and abundant initiative in the field of cancer genomics, providing a vast repository of genomic data on more than ten thousand individuals encompassing diverse types of cancers.13 Ma et al revealed that the expression of key genes varies between young patients (under 50 years old) and old patients (over 50 years old) those who diagnosed with ovarian serous cystadenocarcinoma.14 One fly in the ointment is that the study did not testify to the sufficient reason that why 50 years old was chosen as the age threshold for AOSC.
In this study, we obtained clinical information of patients with AOSC from the SEER database to determine the optimal age threshold for worse prognosis of AOSC. Meanwhile, we acquired the information of RNA-seq for patients with AOSC form the TCGA, in order to explore the age-related differentially expressed genes (DEGs) and involved pathway.
Methods
Study Population Data from the SEER Database
We were granted access to the National Cancer Institute’s Surveillance, Epidemiology, and End Results (SEER) database (user name: 11,322-Nov2021) and obtain the clinical information for patients with ovarian serous cystadenocarcinoma. The data we have downloaded include the patients’ ID, survival time, vital status recode, age record, race record, marital status at diagnosis, SEER cause-specific death classification, the Site recode ICD-O-3 / WHO 2008 (International Classification of Diseases for Oncology, 3rd edition), AJCC (Asia Joint Conference on Computing) stage grope, T stage, N stage, M stage, grade, laterality, surgery record, chemotherapy recode, radiation record, CS site-specific factor 1 (CA125). In this study, we defined the overall survival (OS) as the length of time from the diagnosis of the disease to either the time of death or the date of the last follow-up assessment. Meanwhile, the cancer-specific survival (CSS) was defined as the length of time from cancer diagnosis to the time of death, with the specific cause of death being attributable to the cancer.
This study categorizes surgical procedures into three types: fertility-sparing surgery (FSS), radical surgery (RS), and other operations. The SEER database codes for FSS are 17, 27, 36, 51, and 56. Likewise, the SEER database codes for RS include 25, 26, 28, 35, 37, 50, 52, 55, 57, 70, 71, 72, 73, and 74.
Inclusion and Exclusion Criteria
To ensure the validity and reliability of our study, we employed stringent criteria to select participants. Patients were included in this study if they met the specified criteria listed below: (1) patients with ovarian cancer were diagnosed between 2004 and 2015; (2) patients diagnosed with ovarian serous cystadenocarcinoma were confirmed through pathological analysis and defined using the Site Recode ICD-O-3 (International Classification of Diseases for Oncology, 3rd edition) / WHO 2008 classification system; (3) patients’ condition of the morphological codes was C56.9 (ovary); (4) patients’ morphological codes were: 8441/3 and 8460/3; (5) patients with AOSC were in accordance with FIGO (Federation International of Gynecology and Obstetrics) stage III and IV. The following criteria were utilized to exclude participants in this study: (1) undetermined TNM stage or unable to be converted into FIGO stage; (2) patients with FIGO stage I and II; (3) incomplete follow-up information; (4) survival time less than 1 month; (5) unknown if surgery performed. The flowchart for screening patients was shown in Figure 1.
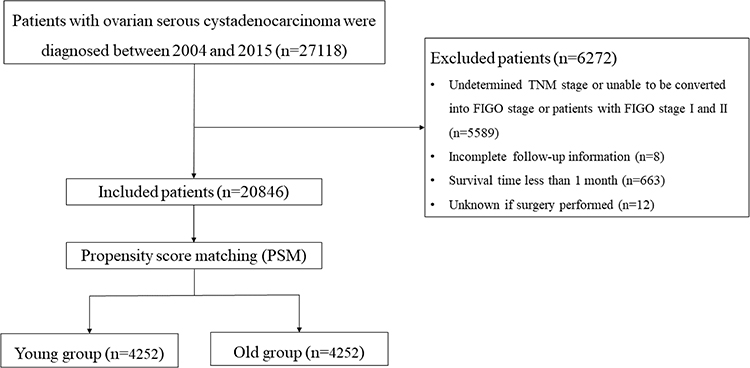 |
Figure 1 Flowchart for screening patients. |
Age Cut-off in Advanced Ovarian Serous Cystadenocarcinoma
In this investigation, our aim was to identify the significant cut-off value for the patients with AOSC using the X-tile software. This software is a valuable resource for assessing biomarkers and optimizing outcome-based cut-off values. It provides a comprehensive assessment of different ways to divide a population based on low and high levels of marker expression through the use of an “x-tile plot”. The X-tile software considers every possible count within the retrieved ranges as critical values for grouping and calculates the χ2 score and P value using that number as a cut-off. X-tile plots were utilized to assess all potential age cutoff values and quantify the survival rate corresponding to each value. Meanwhile, the Log rank test was performed to validate the results. The cut-off value with the highest χ2 score was selected as the most appropriate value.
RNA-Seq Analysis of Advanced Ovarian Serous Cystadenocarcinoma from the TCGA Database
The RNA sequencing data (TPM format) and clinical data, from the TCGA database, pertaining to patients diagnosed with ovarian serous cystadenocarcinoma were obtained. The study encompassed a total of 374 patients after excluding those with duplicates and unknown survival time. To conduct the differential gene expression analysis the R software “limma” package was used with a threshold of |Log FC| > 0 and adj.P < 0.05 to delineate the significant differentially expressed genes (DEGs) between the young group and old group. Enrichment analysis of Kyoto Encyclopedia of Genes and Genomes (KEGG) pathways and gene ontology (GO) was carried out using the R software “clusterProfiler” package.15
The online database STRING (version 11.5, https://cn.string-db.org/) was utilized to encode the protein-protein interaction network (PPI) of the DEGs. Visualization of the PPI network was performed through the Cytoscape software (version 3.9.1, https://cytoscape.org/).16 Subsequently, the identification of hub genes within the PPI network was analyzed concurrently utilizing the plug-in Cytohubba embedded within the Cytoscape software. Meanwhile, we utilized the R software “survminer” package to investigate the prognostic significance of the hub genes.
Statistical Analysis
The X-tile’s optimal cut-off value was used to classify patients into two groups: young group and old group in this study. We used the chi-square test to analyze categorical data. Meanwhile, we performed univariate and multivariate analyses using COX Hazard Regression Analysis to evaluate the risk variables of patients with AOSC. For the multivariate Cox hazard regression analysis, we employed the forward modeling approach with the stepwise regression method.
To mitigate the impact of confounding factors, variables exhibiting notable distributional differences between the young and old group were incorporated into propensity score matching (PSM) analyses. We utilized a 1:1 nearest neighbor matching strategy with the caliper of 0.2. The distribution of baseline data was compared, and we analyzed the factors influencing patient survival and prognosis using the Cox proportional hazard model. Subsequently, we stratified the cases based on the relevant variables and the results were displayed in the forest plot. The Kaplan-Meier method was used to generate survival curves, and the Log rank test was employed to evaluate hypotheses, subsequently.
We utilized several R libraries, including “regplot”, “survminer”, “MatchIt”, “forestploter”, “pheatmap”, and “dplyr” to perform propensity score matching and analyze and visualize the data from the TCGA database. We conducted statistical analyses using software programs such as SPSS software (version 19.0; IBM Corporation, St. Louis, Missouri, USA) and R software (version 3.6.2; The R Project for Statistical Computing, TX, USA; http://www.r-project.org). The P value <0.05 was regarded as statistically significant, and the 95% confidence interval was established in this research.
Result
73-Year-Old Was the Age Cut-off Value for Patients with Advanced Ovarian Serous Cystadenocarcinoma
We obtained a total of 20,846 patients with AOSC, finally. The median age of these patients was 63 (interquartile range: 51–75), while the X-tile analysis determined that 73 was the optimal age cut-off value (Figure 2A–C). Next, we divided the patients with AOSC into two groups based on the cut-off value: the young group (73 years or younger) and the old group (over 73 years). Additionally, the young group included 16,336 (78.4%) patients and the old group included 4510 (21.6%) patients.
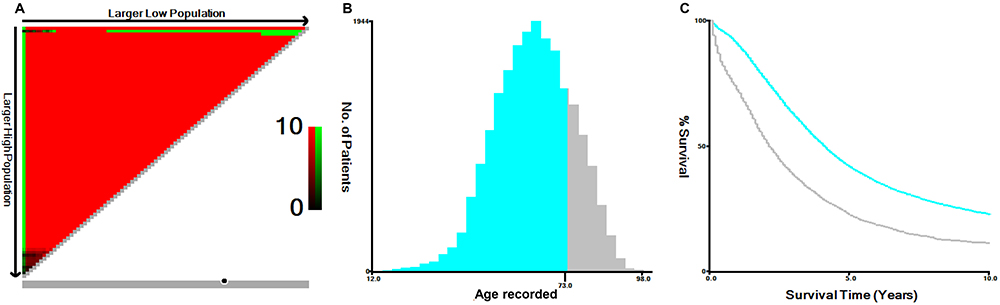 |
Figure 2 X-Tile analysis of survival data from the SEER database. (A) The X-Tile plot displays red coloration of cut-points, indicating a negative correlation with survival, while green coloration represents a positive correlation. The plot illustrates patient age divided at the mean age, and the optimal cut-point is highlighted by a black circle located in the middle of the color bar. (B) The histogram of the entire cohort reveals that the optimal cut-off value of age at diagnosis is 73 years, based on cancer-specific survival (CSS). The X-axis represents the age of patients, and the Y-axis represents the number of patients at each age. (C) The Kaplan-Meier survival curve is generated based on these cut-off values. |
Prior to propensity score matching, significant differences in various clinical baseline data were found between the young and old groups, including race, marital status, FIGO stage, grade, laterality, surgery, chemotherapy, and CA125 levels (P<0.001). There were no significant differences in radiotherapy characteristics between the young and old groups. (P=0.058). After propensity score matching (caliper=0.2) based on the aforementioned variables, 4252 pairs (8504 cases) of patients were matched between the two groups. The distribution of baseline data, including race, marital status, FIGO stage, grade, laterality, surgery, chemotherapy, radiotherapy, CA125 level, and others, was not significantly different between the young group and the old group (P > 0.05), indicating an effective matching result (Table 1).
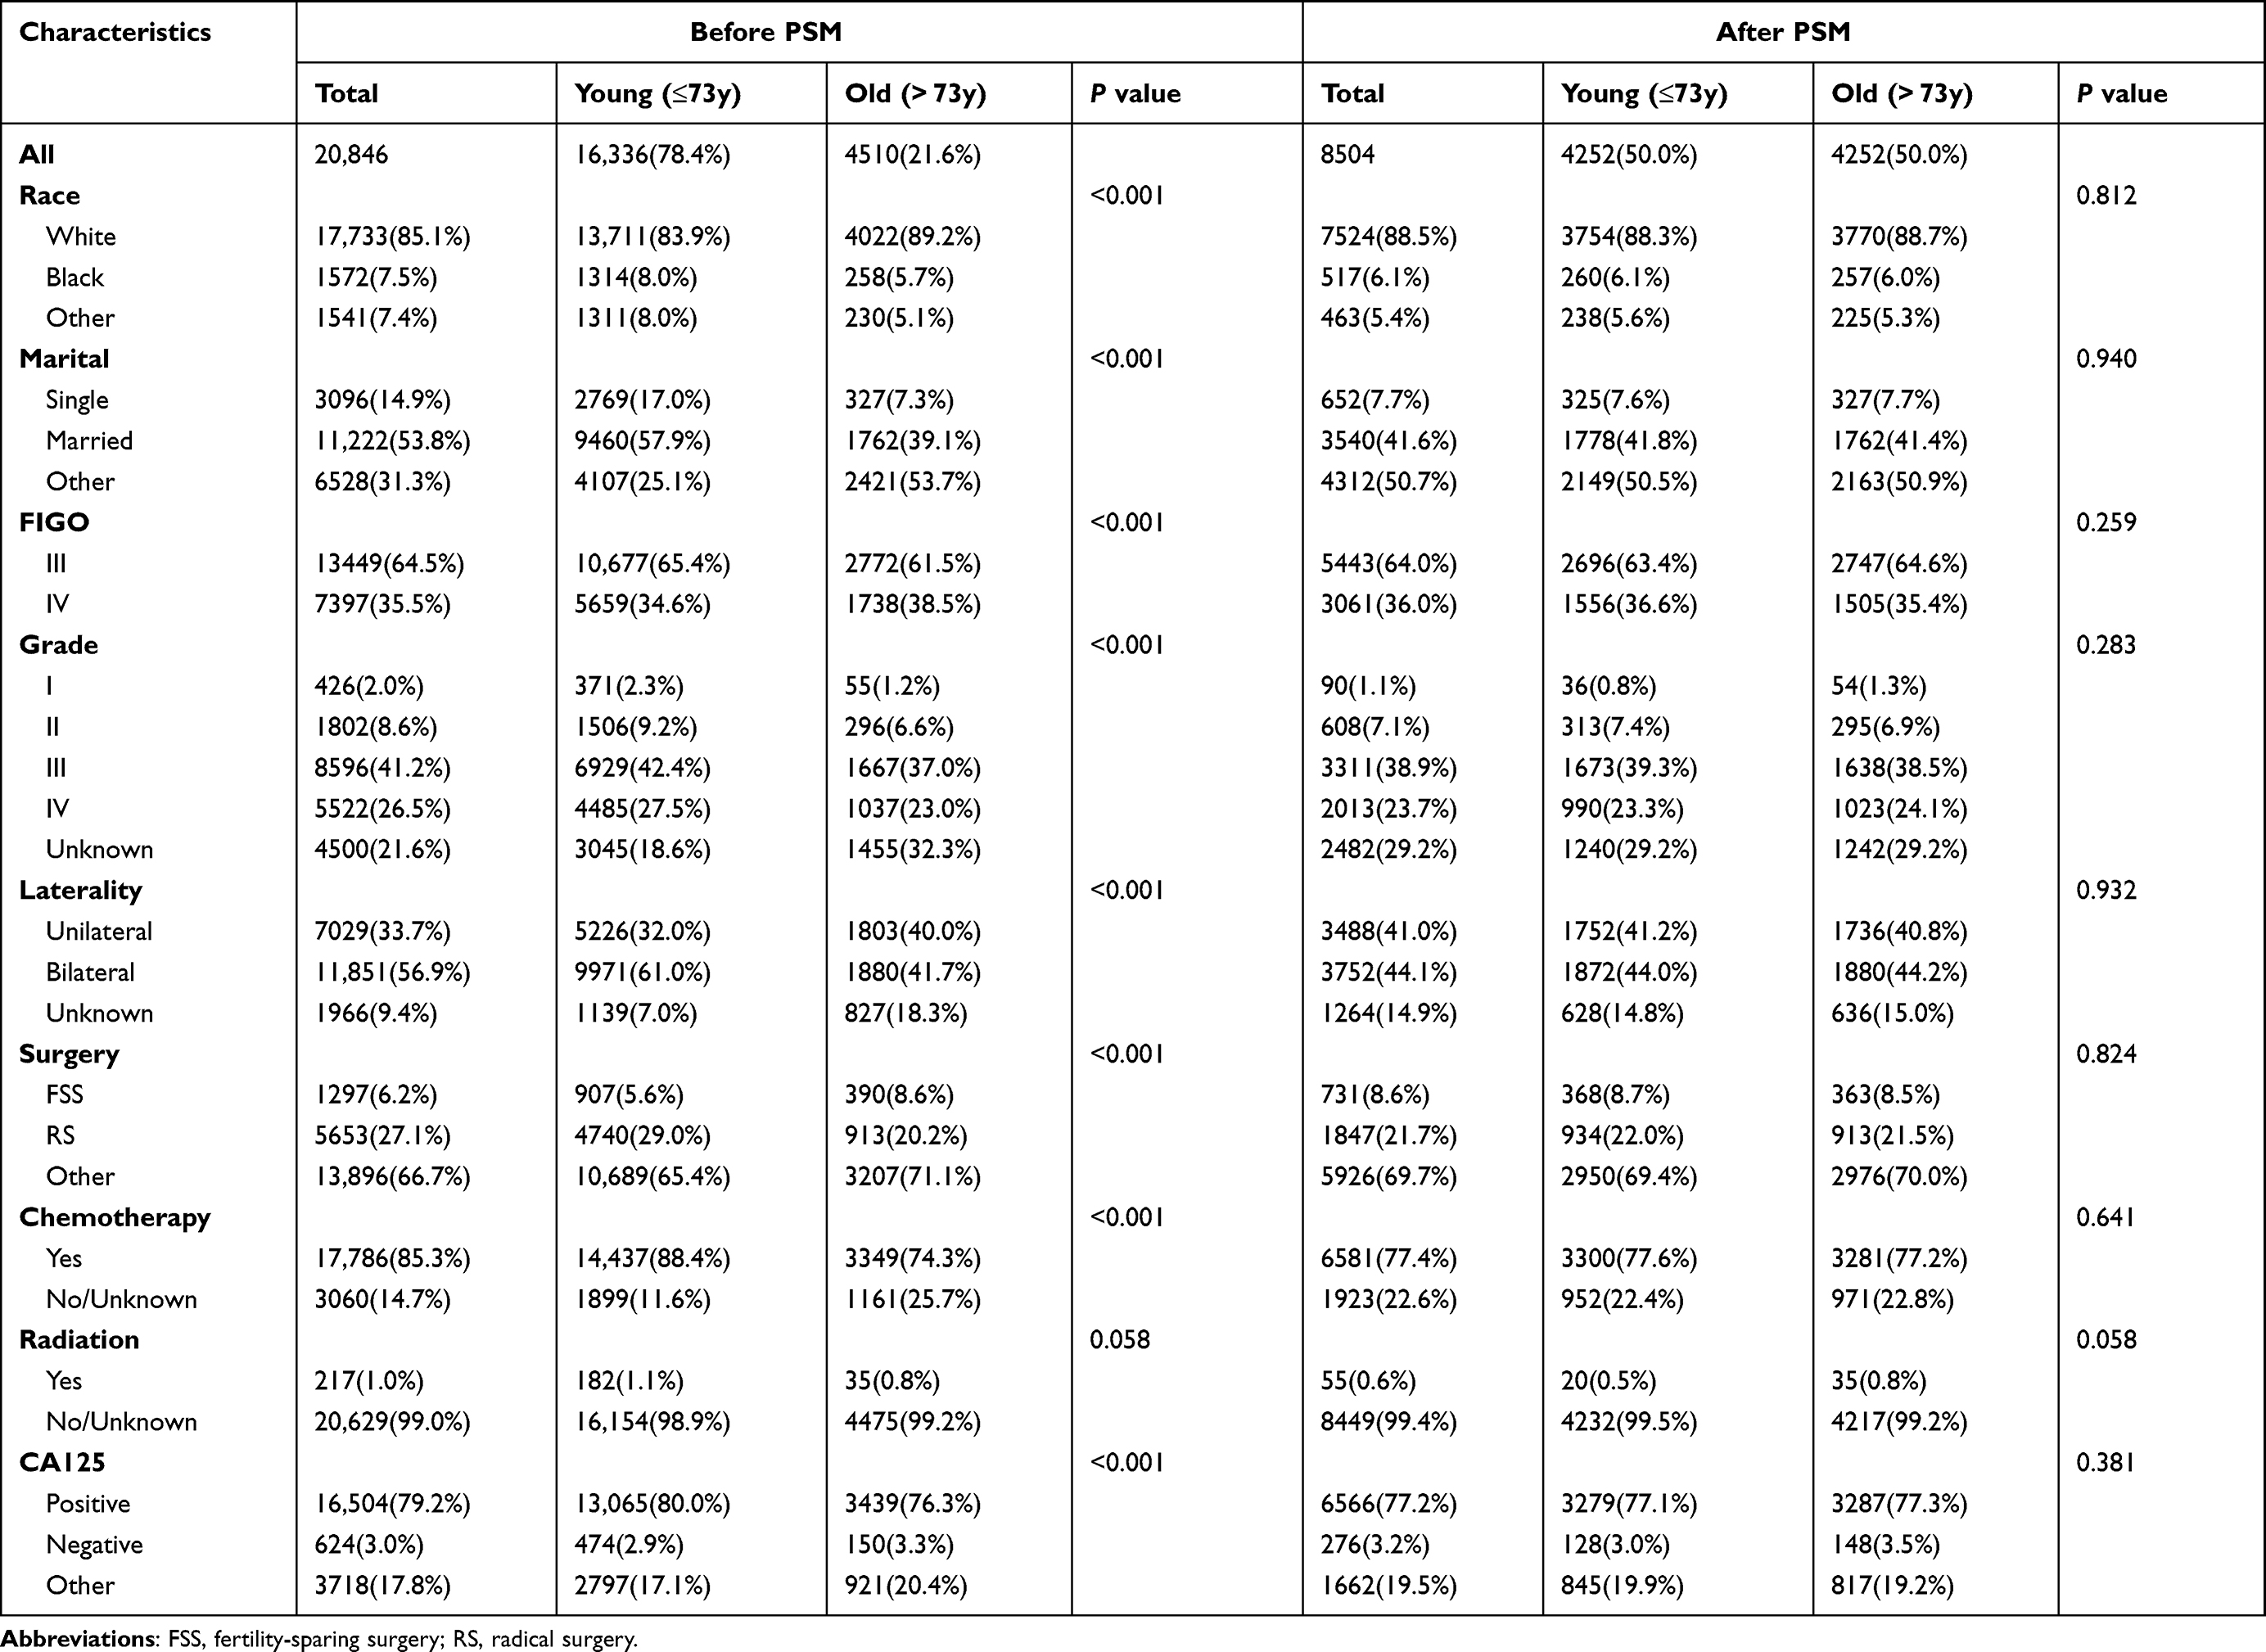 |
Table 1 Baseline Characteristics of Patients with Advanced Ovarian Serous Cystadenocarcinoma in the SEER Database, n(%) |
Survival Analysis
The young group exhibited 1-year, 3-year, and 5-year OS rates of 88.9%, 59.7%, and 38.9%, respectively. However, the old group exhibited 1-year, 3-year, and 5-year OS rates of 68.3%, 33.9% and 18.5%, respectively. The median survival time for younger and older patients with AOSC were 46 months and 23 months. The OS of the old group was significantly lower than that of the young group(P < 0.001, Figure 3A). The results for the CSS rates were consistent with the OS rates. The 1-year, 3-year and 5-year CSS rate were 89.7%, 61.8% and 41.5%, respectively, in the young group. Nevertheless, in the old group, the 1-year, 3-year and 5-year CSS rate were 71.2%, 37.8% and 22.4%, respectively. The median survival time were 49 months and 25 months for young and old group. The statistical analysis indicated that patients in the young group with AOSC had a substantially improved prognosis than those who were in the old group (P < 0.001, Figure 3B). Meanwhile, we conducted the univariate and multivariate Cox hazard regression analysis to investigate the prognostic factors for patients with AOSC. The univariate Cox hazard regression analysis indicated that age, race, marital status, FIGO stage, grade, laterality, surgery, chemotherapy, radiation and CA125 level could serve as the reliable biomarkers to predict the survival outcome of patients with AOSC. Then, the significant variables were further included in the multivariate Cox hazard regression. The multivariate analysis found that age, race, marital status, FIGO stage, grade, laterality, surgery, chemotherapy, radiation and CA125 level were potential predictors for OS in patients (Table 2). As for the CSS rates, our research indicated that age, race, marital status, FIGO stage, grade, laterality, surgery, chemotherapy, radiation and CA125 level were the independent prognostic factors for CSS in patients with AOSC by using the univariate and multivariate Cox hazard regression analysis (Table 3).
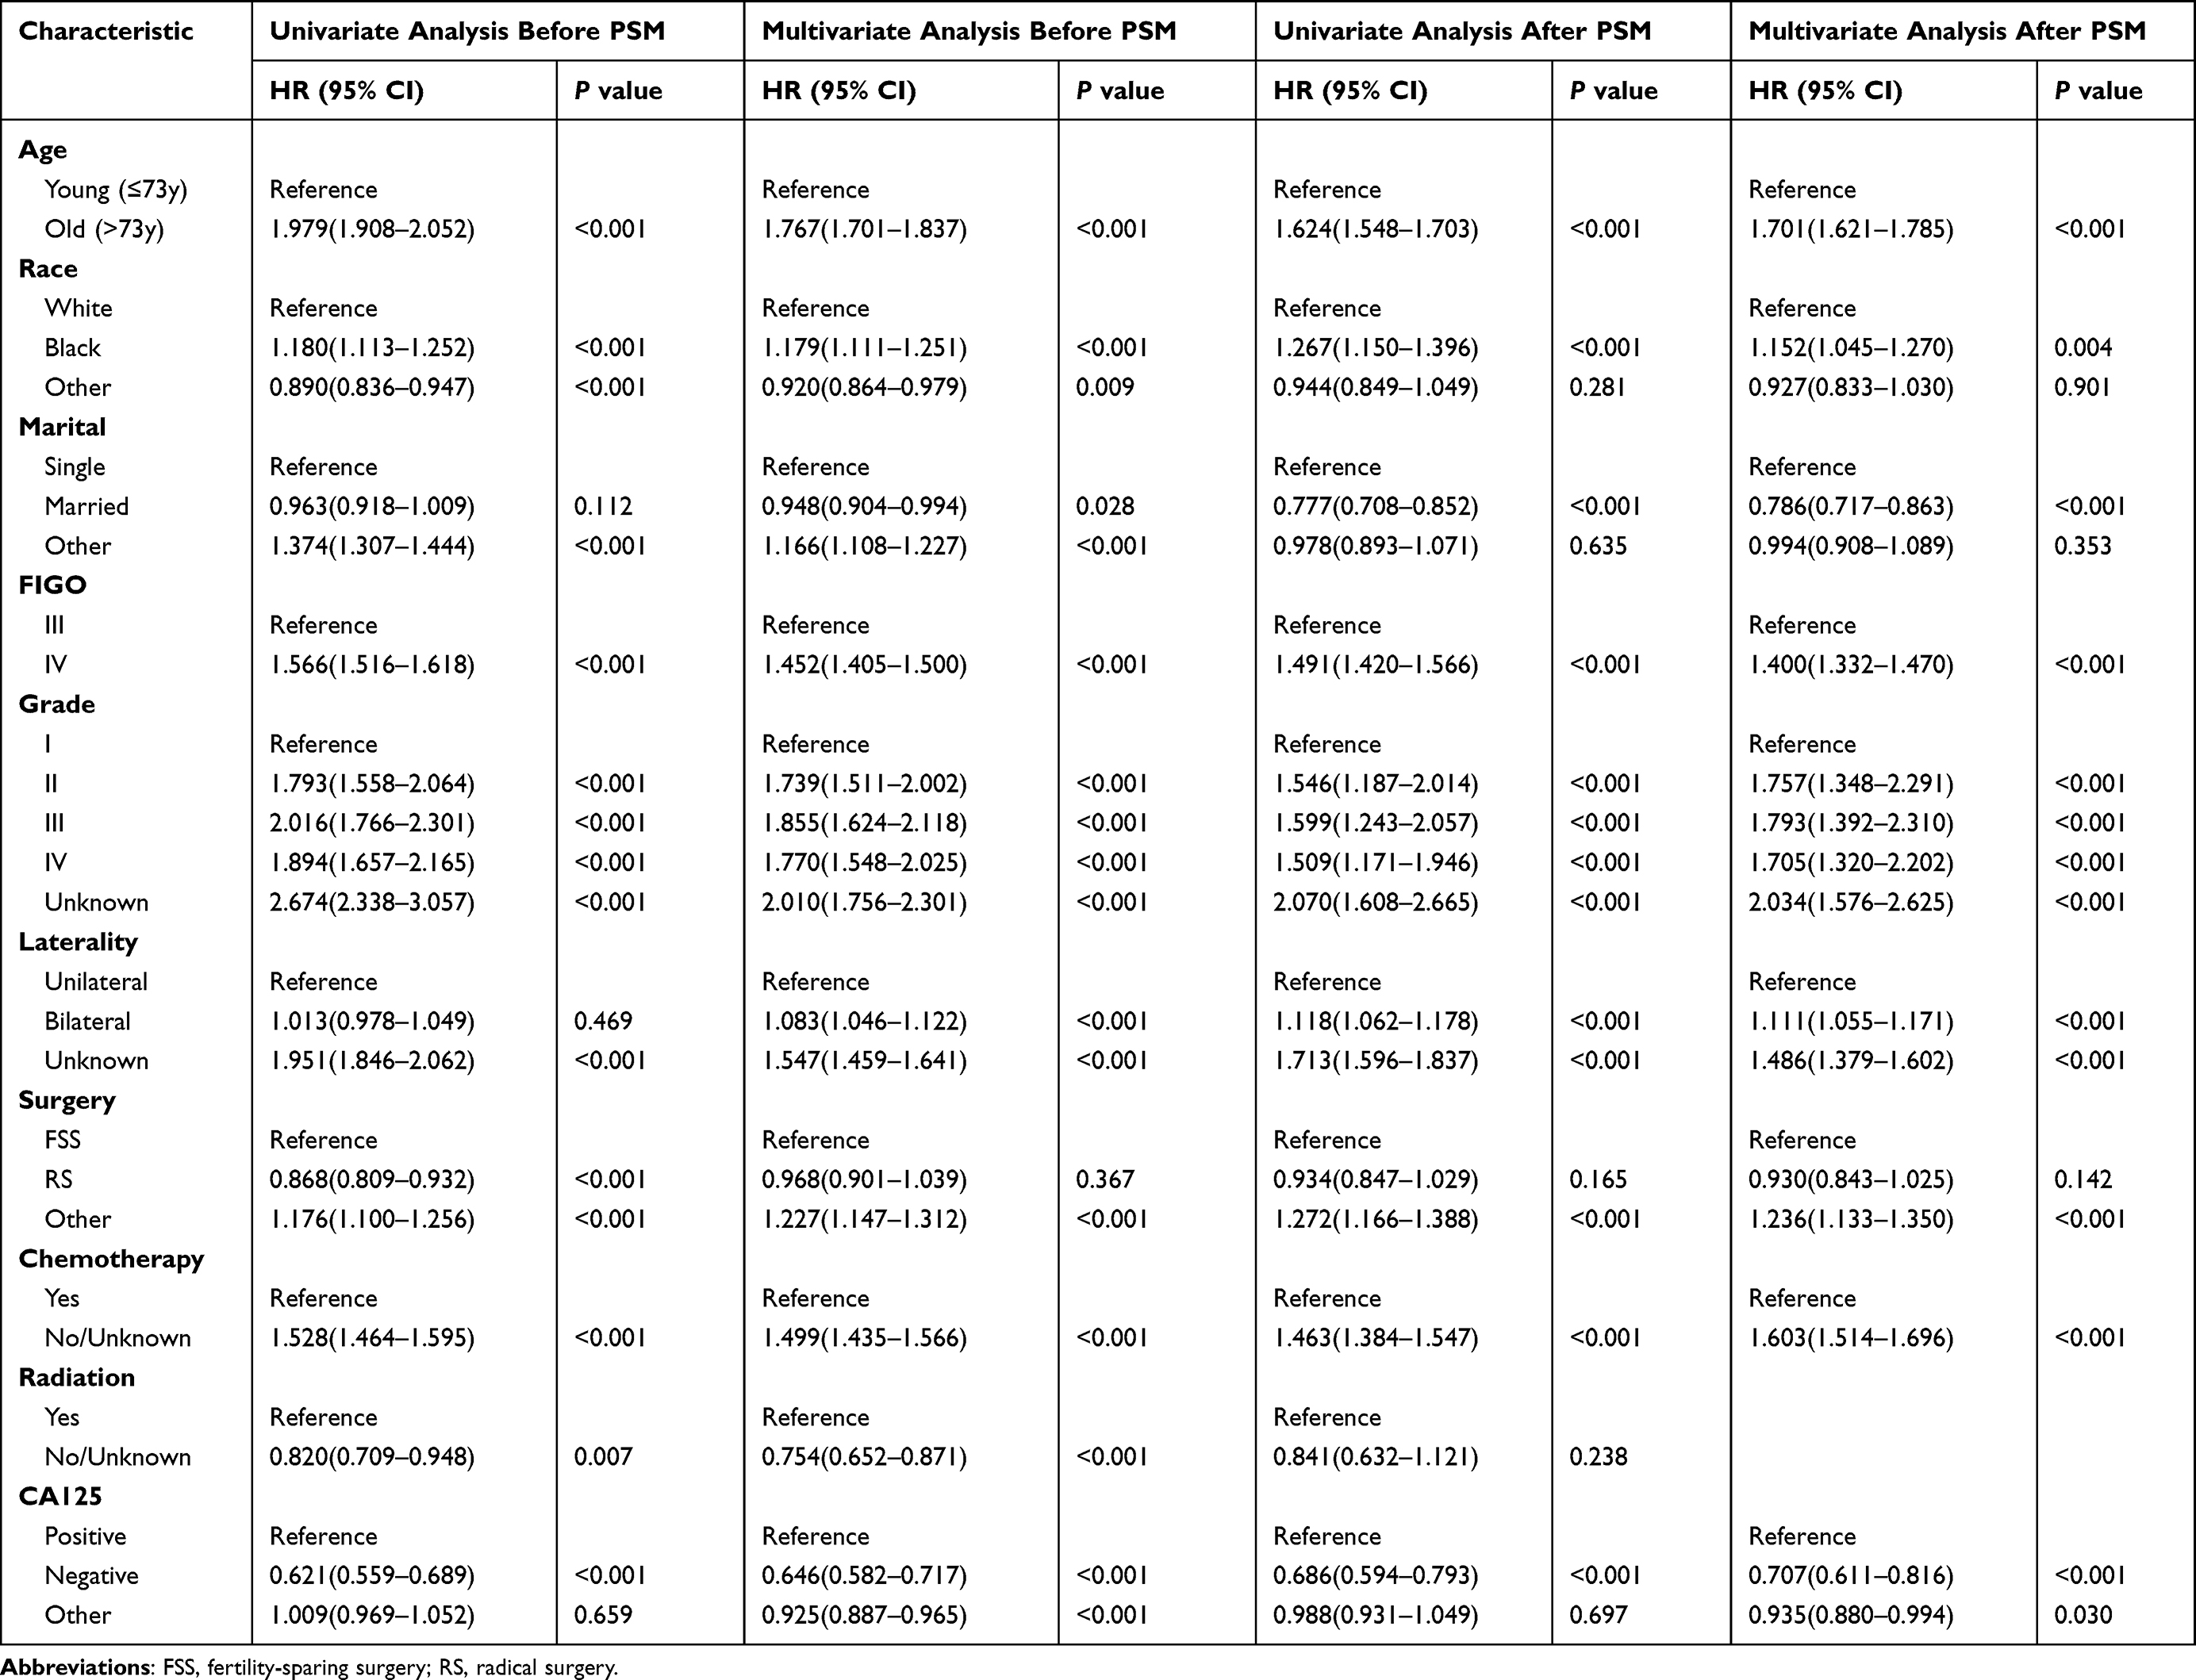 |
Table 2 The Cox Hazard Regression Analysis of Overall Survival |
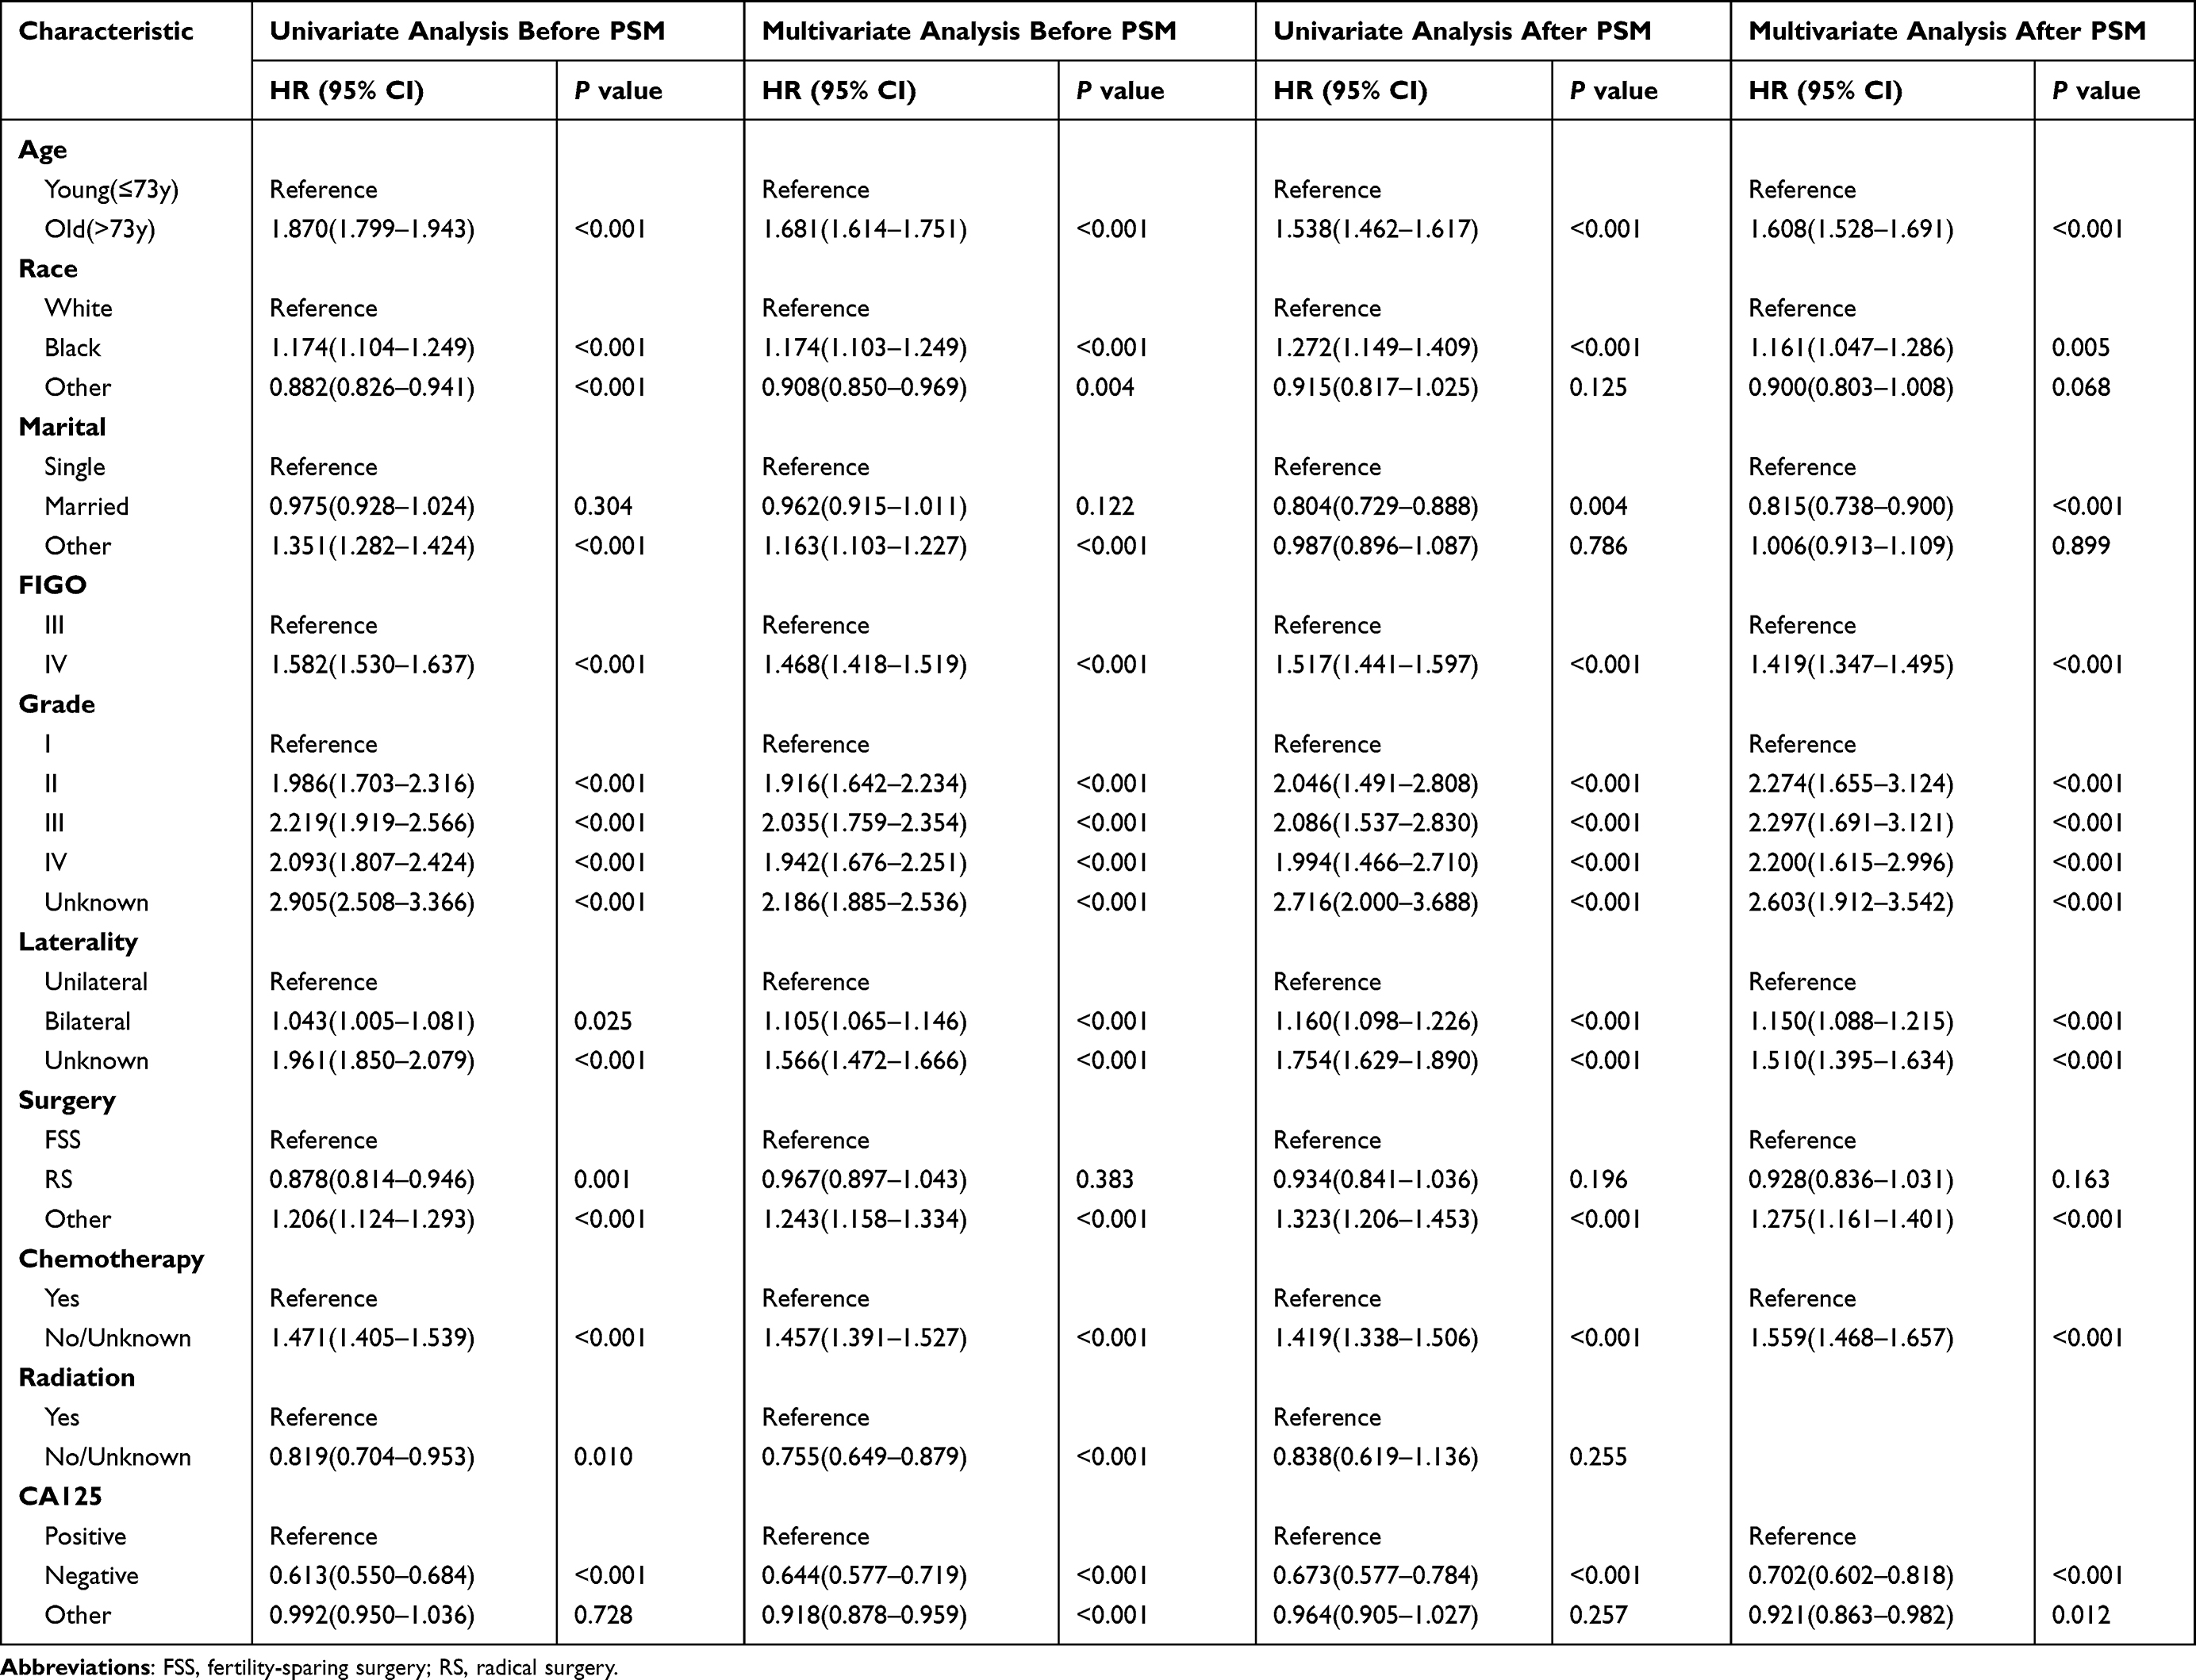 |
Table 3 The Cox Hazard Regression Analysis of Cancer-Specific Survival |
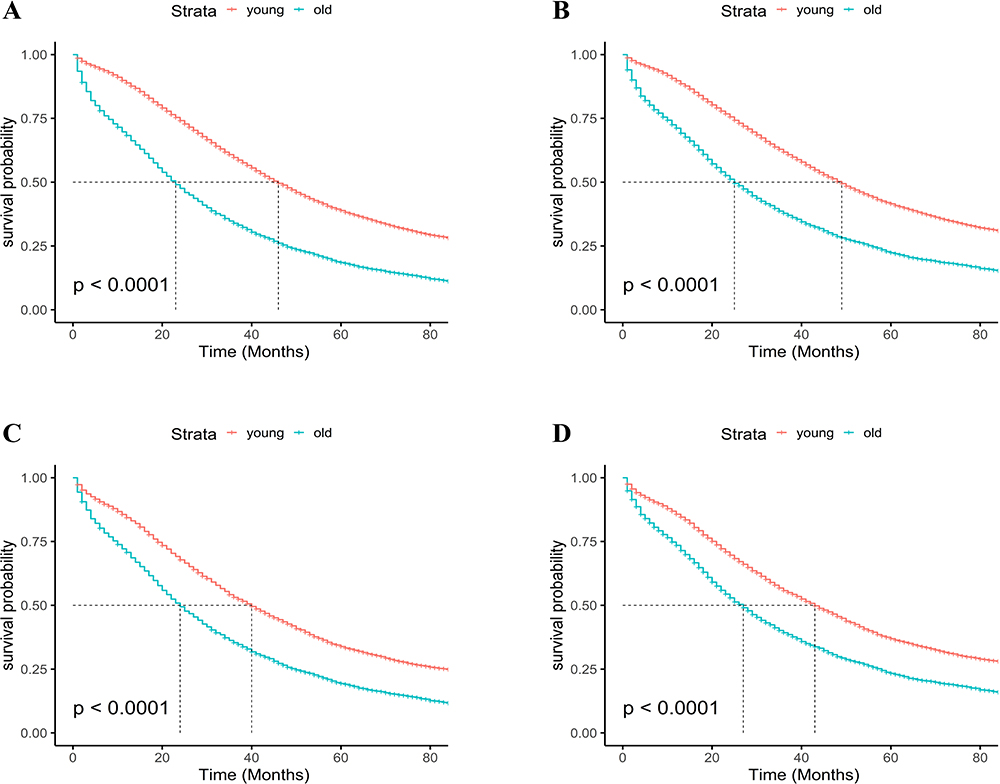 |
Figure 3 Kaplan-Meier curves of overall survival (OS) and cancer-specific survival (CSS). Kaplan-Meier curves of OS (A) and CSS (B) before propensity score matching (PSM), Kaplan-Meier curves of OS (C) and CSS (D) after PSM. |
During the course of our analysis, we detected considerable dissimilarities in the clinical characteristics between the young group and old group, which included age, race, marital status, FIGO stage, grade, laterality, surgery, chemotherapy, radiation and CA125 level. These differences have the potential to affect our analysis. Therefore, we utilized a 1:1 nearest neighbor matching method to balance the differences in basic clinical characteristics between the two groups and created a fresh queue in which all covariates were balanced. After performing PSM, the median survival time of OS was found to be 40 months in the young group and 24 months in the old group. In the young group, the 1-year, 3-year and 5-year OS rates were 84.3%, 53.1% and 33.9%, respectively. While in the old group, the 1-year, 3-year and 5-year OS rates were 70.7%, 35.4% and 19.4%, respectively. After PSM, significant differences in CSS rates were observed for both the two groups compared to the results before PSM. In the young group, the 1-year, 3-year, and 5-year CSS rates were 85.7%, 55.8%, and 36.9%, respectively. Similarly, in the old group, the 1-year, 3-year, and 5-year CSS rates were 73.5%, 39.3%, and 23.3%, respectively. The median survival time for CSS was found to be 43 months in the young group and 27 months in the old group. Our analysis revealed that patients with AOSC had better prognosis in terms of the OS and CSS (P < 0.001, Figure 3C and D). In the PSM cohort, both univariate and multivariate Cox hazard regression analyses identified age, race, marital status, FIGO stage, grade, laterality, surgery, chemotherapy and CA125 level can serve as significant predictors of survival outcome in patients with AOSC. However, the analysis revealed that radiation was not considered as the significant prognostic factor for either OS (P =0.238, Table 2) and CSS (P =0.255, Table 3).
Subgroup Analysis
Next, we conducted a subgroup analysis in the PSM cohort that was founded on multiple factors, including race, marital status, FIGO stage, grade, laterality, surgery, chemotherapy, radiation, and CA125 level, to investigate the prognosis of patients with AOSC in the young group and the old group. The forest plot (Figure 4) demonstrated that in most subgroups, patients in the young group had a better prognosis (P < 0.001), except for the radiation subgroup (HR=1.69, 95% CI: 0.87–3.27, P = 0.12).
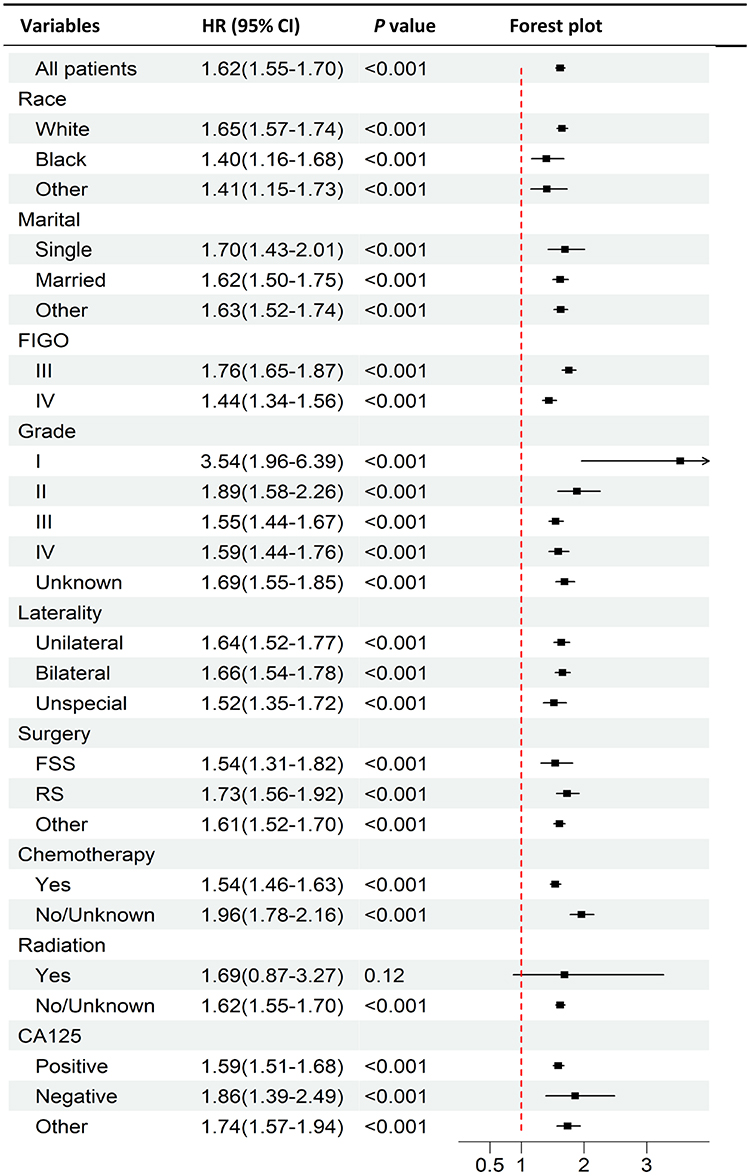 |
Figure 4 The forest plot of subgroup analyses according to age (young vs old) of patients with advanced serous ovarian cystadenocarcinoma in the PSM cohort from the SEER database. |
Differential Expressed Genes and Prognosis Related Genes
After filtering for significant differential expression, we identified 436 DEGs between the young group and the old group of patients with AOSC. Among these DEGs, 318 genes were upregulated and 118 genes were downregulated in the old group (Figure 5A and B).
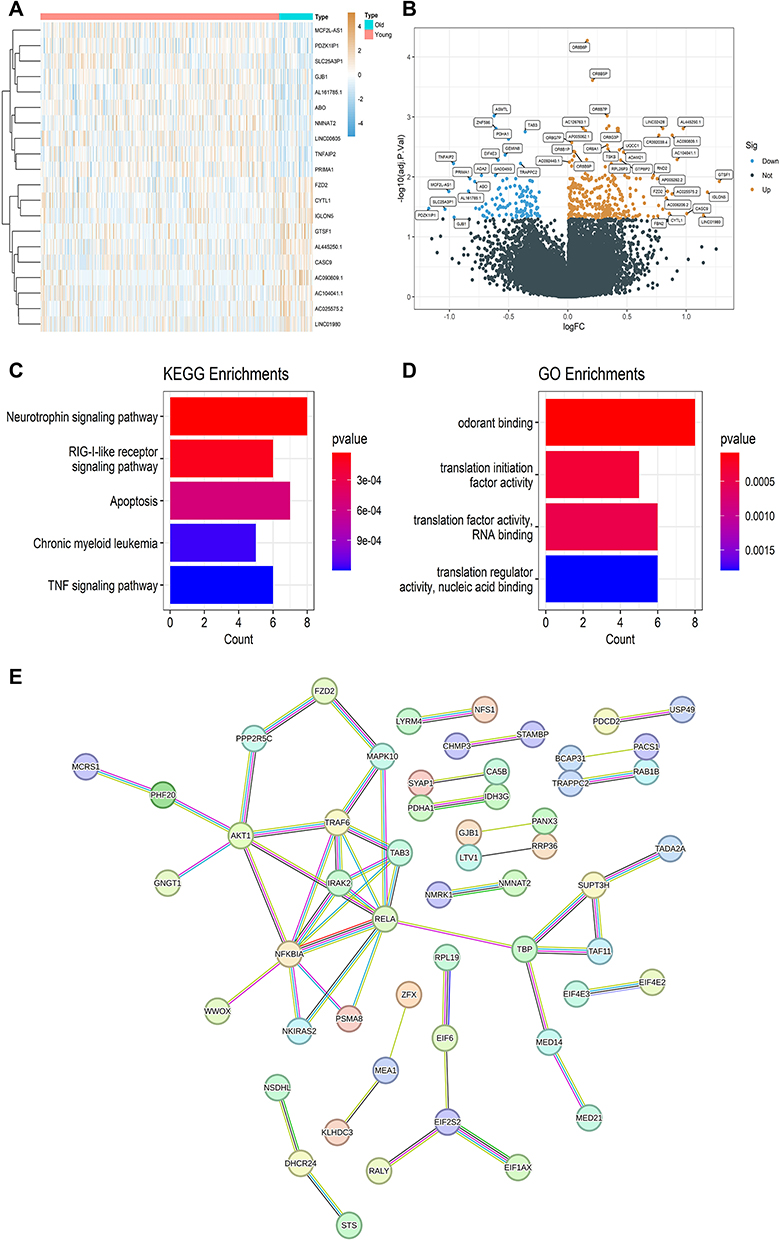 |
Figure 5 Differentially expressed genes (DEGs) between the old group and the young group. (A) The heatmap of DEGs. (B) The volcano plot of DEGs. (C) A bar chart of Kyoto Encyclopedia of Genes and Genomes (KEGG) enrichment of DEGs. (D) A bar chart of Gene Ontology (GO) analysis of DEGs. (E) The protein-protein interaction network of DEGs. |
The KEGG analysis demonstrated DEGs were particularly enriched in several pivotal pathways, including the neurotrophin signaling pathway, RIG-I-like receptor signaling pathway, apoptosis, chronic myeloid leukemia and TNF signaling pathway (Figure 5C). Additionally, the results of GO analysis further elucidated the functional significance of the DEGs were particularly enriched in odorant binding, translation initiation factor activity, translation factor activity RNA binding and translation regulator activity nucleic acid binding (Figure 5D). To further scrutinize the relationship between differentially expressed proteins, 436 DEGs mentioned were used to construct a PPI network, utilizing the online database STRING, with a minimum required interaction score set to 0.7. Subsequently, we obtained the PPI network diagram (Figure 5E) and employed the cytohubba plug-in within the Cytoscape software to explore the hub genes in the PPI network. We identified RELA, NFKBIA, TRAF6, IRAK2, TAB3, AKT1, TBP, EIF2S2, MAPK10, and SUPT3H as the top 10 hub genes in the PPI network using the MMC method. Among these hub genes, the 4 hub genes TBP, EIF2S2, MAPK10, and SUPT3H were upregulated, while the 6 hub genes RELA, NFKBIA, TRAF6, IRAK2, TAB3, and AKT1 were downregulated in elderly patients with AOSC.
The analysis of the prognostic value of these 10 hub genes indicated a significant correlation existing between their expression profiles of RELA, TAB3, AKT1, TBP, SUPT3H and the prognosis of patients with AOSC (Figure 6). Specifically, elevated expression of AKT1 and SUPT3H was positively associated with better prognosis, whereas higher expression levels of RELA, TAB3, and TBP were linked with poorer outcomes in individuals suffering from AOSC. These findings underscore the potential utility of these hub genes as prognostic biomarkers for the clinical management and treatment of ovarian cancer.
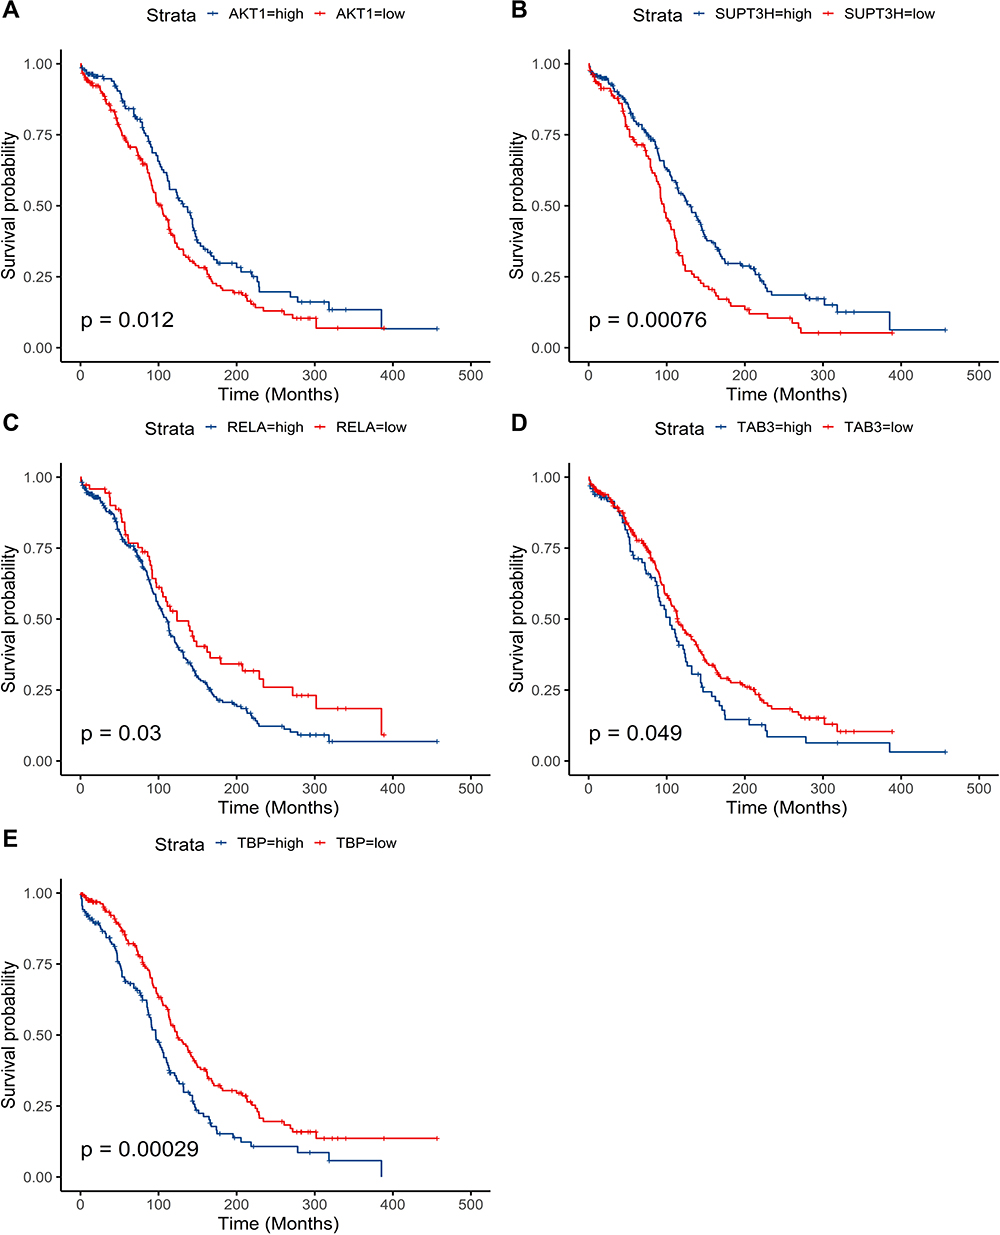 |
Figure 6 Survival analysis of DEGs. Kaplan-Meier analysis is developed based on the expression levels of AKT1 (A), SUPT3H (B), RELA (C), TAB3 (D), and TBP (E). |
Discussion
Ovarian cancer is a malignant neoplasm with a poor prognosis, making it one of the most challenging tumors to manage effectively.1 Accurately determining the prognosis and risk stratification of patients with ovarian cancer according to their age is crucial in selecting the most appropriate treatment plan and ultimately impacting treatment outcomes, especially with an aging population. In this study, we included a large cohort of 20,846 patients with AOSC from the SEER database. Meanwhile, the patients were classified into the young and old group using the 73-year-old cut-off value. Survival analysis results revealed the better prognosis for patients in the young group (below the age of 73) compared to those in the old group, significantly. Furthermore, we analyzed the RNA sequencing data and clinical information of 374 patients with AOSC, which were downloaded from the TCGA database. Our analysis led to the identification of 436 DEGs and signaling pathways that were significantly associated with the onset and progression of tumors. These results shed new light on the importance of age in the prognosis of patients with AOSC and could have a significant impact on improving the therapeutic strategies and clinical management of this disease.
The factor age was a crucial prognostic factor in various cancers, such as renal cell carcinoma,17 colorectal cancer18 and gastric cancer.19 Our previous study had highlighted the significance of age in predicting the clinical outcomes of patients with mucinous ovarian cancer.9 Meanwhile, similar results had been obtained from other studies of ovarian cancer recently. For instance, Ma et al proposed that 50-year-old could be used as the optimal cutoff value to distinguish between early-onset and late-onset ovarian serous cystadenocarcinoma. Similarly, Liu et al demonstrated that age could be employed as a predictive marker for OS in serous ovarian cancer.20 It was noteworthy to mention that elderly patients with advanced epithelial ovarian cancer tend to have a worse prognosis than the younger patients in Zheng’s study.21 To the best of our knowledge, the optimal cutoff value of age for AOSC patients had not been established in previous studies. Our research successfully bridged this gap and identified 73-year-old as the optimal cutoff value for distinguishing between young and old groups in this particular population. Furthermore, in the Cox hazard regression analysis and the subgroup analysis, the old group consistently demonstrated worse prognosis compared to the young group across most subgroups in this study. However, in the radiation subgroup, no significant difference in prognosis was observed between the two groups. It is plausible that the incomplete information on radiotherapy for patients with AOSC in the SEER database contributed to this result.
In this investigation, we achieved a comparative analysis of RNA-seq data from young and old group patients with advanced serous ovarian cystadenocarcinoma through which we successfully identified 436 DEGs. Notably, the KEGG analysis revealed that the DEGs were significantly enriched in the neurotrophin signaling pathway. Neurotrophins and their receptors have been extensively investigated in various human cancers, and evidence suggests that they can contribute to the autocrine stimulation of cancer cell growth and dissemination.22 For instance, nerve growth factor, a member of the neurotrophin family, can be released by cancer cells to drive tumor neurogenesis via the activation of its receptors.23 Davidson et al reported that neurotrophins and their receptors were overexpressed in serous ovarian carcinoma, consistent with our findings.24 Therefore, we speculated that the neurotrophin signaling pathway was affected in patients with AOSC, resulting in poor prognosis. Based on the findings, we proposed that the neurotrophin signaling pathway may be dysregulated in patients with AOSC, which could contribute to the poor prognosis associated with this disease. Meanwhile, more investigations are required to completely elucidate the role of neurotrophin signaling pathway, and to explore the potential clinical implications. According to the results of the GO analysis, these DEGs were substantially enriched in a number of biological processes, including translation initiation factor activity, translation factor activity RNA binding, and translation regulator activity nucleic acid binding. Translation activity is the process by which genetic information flows from DNA to RNA. Transcription factors are known to play a crucial role in the formation and progression of malignant tumors, through both transcription-dependent and transcription-independent mechanisms.25,26 These findings highlight the potential significance of transcription factors in the development and progression of AOSC, and underscore the importance of further research in this area.
We obtained 436 DEGs by comparing RNA-seq data from patients with AOSC in the young group and the old group. Subsequently, the top 10 genes were then utilized for survival analysis. The expression of RELA, TAB3, AKT1, TBP, and SUPT3H were related to the prognosis of the old patients with advanced serous ovarian cystadenocarcinoma. Previous studies have shown that these genes play important functions in ovarian cancer-related pathways. RELA, an essential component of the NF-κB signaling pathway, has been implicated in promoting chemoresistance, cancer stem cell maintenance, metastasis, and immune escape in ovarian cancer.27 Meanwhile, TAB3 is an activating protein in the NF-κB signaling pathway. Chen’s study demonstrated that TAB3 knockdown in ovarian cancer cells significantly inhibited their biological activity.28 Transcription factor IID (TFIID) has been implicated in regulating the growth of ovarian cancer which is composed of TBP and a group of evolutionarily conserved proteins.29 Additionally, AKT1, a core factor of the PI3K/AKT signaling pathway, performs a crucial function in cell apoptosis regulation.30 Tian’s research has shown that elevated expression of AKT1 promotes the progression of ovarian cancer.31 Despite its significance in the growth and self-renewal of mouse embryonic stem cells, further research is necessary to determine the effect of SUPT3H on ovarian cancer.32 Our research has demonstrated the significant correlation between the identified 5 hub genes and age-related differential gene expression. The underlying reason for this observation is not entirely clear at this time. One possible explanation is that aging is associated with a decline in immune function and increased inflammation, which could create a more favorable environment for tumor growth and progression. Additionally, older patients may have accumulated more genetic mutations or epigenetic alterations over time, leading to increased genomic instability and tumor heterogeneity.33 This finding holds promise for advancing clinical monitoring efforts in patients. Further investigations are required to thoroughly investigate the clinical utility of these hub genes in the context of this malignancy.
Real-world studies have emerged as a critical area of inquiry in the medical and healthcare industries, representing an indispensable component of modern medical research.34 By leveraging information from electronic databases of diverse patient populations, real-world studies enable investigators to collect large amounts of clinical information from prospective or retrospective data, which hold significant potential for advancing our understanding of drug effectiveness and safety, as well as disease occurrence and progression in real-world clinical settings.35,36 Therefore, real world studies are rapidly becoming a valuable tool for clinical research, offering new insights into the complex interplay between patient health outcomes, treatment regimens, and environmental factors. Moreover, in our research, in order to mitigate potential confounding biases in our study, we employed PSM to balance the variables between the young and old groups. This approach enhanced the comparability of the groups and strengthened the validity of our findings.
Several limitations must be acknowledged in this study. Firstly, the SEER and TCGA databases used in our study did not provide complete clinical information, such as specific chemotherapy regimens, drugs and underlying diseases, which may affect the validity of our results. Secondly, majority of the data was collected from western populations, and the generalizability of our findings to Chinese patients requires further validation. Thirdly, our study utilized retrospective data, and although the PSM method was implemented to mitigate potential biases, residual bias cannot be entirely ruled out. Finally, the molecular mechanisms underlying the age-related DEGs were not explored further, and our future research will aim to investigate the role of these DEGs in the pathogenesis of AOSC.
Despite the limitations of our study, we successfully determined that 73-year-old represents the optimal cut-off value for differentiating the prognoses of patients with AOSC. Our findings offered a valuable reference for tailoring individualized clinical treatment plans for patients with this challenging disease. Moreover, the identification of age-related genes in our study shed new light on the molecular mechanisms underpinning AOSC pathogenesis and presented a promising avenue for future research in this field.
Conclusions
To summarize, our study indicated that 73-year-old represented a reasonable cut-off value for AOSC patients, with the old group exhibiting poorer prognoses compared to their younger counterparts. These findings served as a reminder for clinicians to provide more attentive care and improved treatment to AOSC patients over 73 years old. Additionally, we explored age-related differential genes for patients with AOSC. Increased expression levels of AKT1 and SUPT3H were positively associated with improved patient outcomes. In contrast, heightened expression levels of RELA, TAB3, and TBP were linked with poorer clinical outcomes. However, their specific mechanisms require further investigation.
Data Sharing Statement
The following information was supplied regarding data availability: Data is available at the SEER database (https://seer.cancer.gov/) and the TCGA database (https://portal.gdc.cancer.gov/).
Ethics Statement
We had signed the SEER research data agreement (user name: 11322-Nov2021). The data in this research was obtained from the SEER database and the TCGA database following approved guidelines. The information of patients had been studied by the United States Department of Health and Human Services. The data is publicly available and deidentified after permission. Therefore, the research was exempted by the ethics committee of the Zhongda Hospital Southeast University. We confirm that the research was performed in accordance with the principles stated in the Declaration of Helsinki.
Acknowledgments
The authors thank the SEER database and the TCGA database.
Author Contributions
All authors made a significant contribution to the work reported, whether that is in the conception, study design, execution, acquisition of data, analysis and interpretation, or in all these areas; took part in drafting, revising or critically reviewing the article; gave final approval of the version to be published; have agreed on the journal to which the article has been submitted; and agree to be accountable for all aspects of the work.
Funding
This study was supported by National Natural Science Foundation of China (No. 82072078), Jiangsu Province Key Research and Development Project (SBE2020741118), and Postgraduate Research & Practice Innovation Program of Jiangsu Province (SJCX22_0070; SJCX23_0090).
Disclosure
There are no conflicts of interest regarding the publication of this article.
References
1. Siegel RL, Miller KD, Wagle NS, Jemal A. Cancer statistics, 2023. Ca a Cancer J Clinicians. 2023;73(1):17–48. doi:10.3322/caac.21763
2. Matz M, Coleman MP, Sant M, et al. The histology of ovarian cancer: worldwide distribution and implications for international survival comparisons (Concord-2). Gynecologic Oncol. 2017;144(2):405–413. doi:10.1016/j.ygyno.2016.10.019
3. Torre LA, Trabert B, DeSantis CE, et al. Ovarian cancer statistics, 2018. Ca a Cancer J Clinicians. 2018;68(4):284–296. doi:10.3322/caac.21456
4. Singh A, Gupta S, Sachan M. Epigenetic biomarkers in the management of ovarian cancer: current prospectives. Front Cell Develop Biol. 2019;7:182. doi:10.3389/fcell.2019.00182
5. Jin S, Liu X, Peng D, Li D, Ye YN. Differences between cancer-specific survival of patients with anaplastic and primary squamous cell thyroid carcinoma and factors influencing prognosis: a SEER database analysis. Front Endocrinol. 2022;13:830760. doi:10.3389/fendo.2022.830760
6. Iqbal J, Ginsburg O, Rochon PA, Sun P, Narod SA. Differences in breast cancer stage at diagnosis and cancer-specific survival by race and ethnicity in the United States. JAMA. 2015;313(2):165–173. doi:10.1001/jama.2014.17322
7. Ding J, Wen Z. Survival improvement and prognosis for hepatocellular carcinoma: analysis of the SEER database. BMC Cancer. 2021;21(1):1157. doi:10.1186/s12885-021-08904-3
8. Wang R, Xie G, Shang L, et al. Development and validation of nomograms for epithelial ovarian cancer: a SEER population-based, real-world study. Future Oncol. 2021;17(8):893–906. doi:10.2217/fon-2020-0531
9. Zhang K, Feng S, Ge Y, Ding B, Shen Y. A nomogram based on SEER database for predicting prognosis in patients with mucinous ovarian cancer: a real-world study. Int J Women’s Health. 2022;14:931–943. doi:10.2147/ijwh.S372328
10. Sharpe N. Clinical trials and the real world: selection bias and generalisability of trial results. Cardiovasc Drugs Ther. 2002;16(1):75–77. doi:10.1023/a:1015327801114
11. Lorenzi M, Ferro A, Cecere F, et al. First-line osimertinib in patients with EGFR-mutant advanced non-small cell lung cancer: outcome and safety in the real world: FLOWER study. Oncologist. 2022;27(2):87–e115. doi:10.1002/onco.13951
12. Hung JN, Hsu ST, Sun L, et al. Real-world efficacy of bevacizumab in patients with recurrent epithelial ovarian cancer. Front Oncol. 2022;12:843278. doi:10.3389/fonc.2022.843278
13. Wang Z, Jensen MA, Zenklusen JC. A practical guide to the cancer genome atlas (TCGA). Meth Molecul Biol. 2016;1418:111–141. doi:10.1007/978-1-4939-3578-9_6
14. Ma S, Zheng Y, Fei C. Identification of key factors associated with early- and late-onset ovarian serous cystadenocarcinoma. Future Oncol. 2020;16(34):2821–2833. doi:10.2217/fon-2020-0668
15. Wu T, Hu E, Xu S, et al. clusterProfiler 4.0: a universal enrichment tool for interpreting omics data. Innovation. 2021;2(3):100141. doi:10.1016/j.xinn.2021.100141
16. Shannon P, Markiel A, Ozier O, et al. Cytoscape: a software environment for integrated models of biomolecular interaction networks. Genome Res. 2003;13(11):2498–2504. doi:10.1101/gr.1239303
17. Tang F, Lu Z, He C, Zhang H, Wu W, He Z. 53 years old is a reasonable cut-off value to define young and old patients in clear cell renal cell carcinoma: a study based on TCGA and SEER database. BMC Cancer. 2021;21(1):638. doi:10.1186/s12885-021-08376-5
18. Yu C, Zhang Y. Establishment of prognostic nomogram for elderly colorectal cancer patients: a SEER database analysis. BMC Gastroenterol. 2020;20(1):347. doi:10.1186/s12876-020-01464-z
19. Zhu Y, Fang X, Wang L, Zhang T, Yu D. A predictive nomogram for early death of metastatic gastric cancer: a retrospective study in the SEER database and China. J Cancer. 2020;11(18):5527–5535. doi:10.7150/jca.46563
20. Liu YY, Zhao RF, Liu C, Zhou J, Yang L, Li L. Development and validation of nomograms to predict overall survival outcomes in serous ovarian cancer patients with satisfactory cytoreductive surgery and chemotherapy. Int J Gene Med. 2022;15:123–131. doi:10.2147/ijgm.S337827
21. Zheng P, Zheng P, Chen G. Conditional survival of advanced epithelial ovarian cancer: a real-world data retrospective cohort study from the SEER database. Front Med. 2021;8:756401. doi:10.3389/fmed.2021.756401
22. Feng Q, Song D, Wang X. Pan-cancer analysis reveals that neurotrophin signaling correlates positively with anti-tumor immunity, clinical outcomes, and response to targeted therapies and immunotherapies in cancer. Life Sci. 2021;282:119848. doi:10.1016/j.lfs.2021.119848
23. Griffin N, Faulkner S, Jobling P, Hondermarck H. Targeting neurotrophin signaling in cancer: the renaissance. Pharmacol Res. 2018;135:12–17. doi:10.1016/j.phrs.2018.07.019
24. Davidson B, Lazarovici P, Ezersky A, et al. Expression levels of the nerve growth factor receptors TrkA and p75 in effusions and solid tumors of serous ovarian carcinoma patients. Clin Can Res. 2001;7(11):3457–3464.
25. Dai C, Chen X, Li J, Comish P, Kang R, Tang D. Transcription factors in ferroptotic cell death. Cancer Genet Ther. 2020;27(9):645–656. doi:10.1038/s41417-020-0170-2
26. Crick F. Central dogma of molecular biology. Nature. 1970;227(5258):561–563. doi:10.1038/227561a0
27. Harrington BS, Annunziata CM. NF-κB signaling in ovarian cancer. Cancers. 2019;11(8):1182. doi:10.3390/cancers11081182
28. Chen Y, Wang X, Duan C, et al. Loss of TAB3 expression by shRNA exhibits suppressive bioactivity and increased chemical sensitivity of ovarian cancer cell lines via the NF-κB pathway. Cell Proliferation. 2016;49(6):657–668. doi:10.1111/cpr.12293
29. Ribeiro JR, Lovasco LA, Vanderhyden BC, Freiman RN. Targeting TBP-associated factors in ovarian cancer. Front Oncol. 2014;4:45. doi:10.3389/fonc.2014.00045
30. Yue H, Li W, Chen R, Wang J, Lu X, Li J. Stromal POSTN induced by TGF-β1 facilitates the migration and invasion of ovarian cancer. Gynecologic Oncol. 2021;160(2):530–538. doi:10.1016/j.ygyno.2020.11.026
31. Tian X, Liu D, Zuo X, et al. Hexokinase 2 promoted cell motility and proliferation by activating Akt1/p-Akt1 in human ovarian cancer cells. Jovarian Res. 2022;15(1):92. doi:10.1186/s13048-022-01027-8
32. Fischer V, Hisler V, Scheer E, et al. SUPT3H-less SAGA coactivator can assemble and function without significantly perturbing RNA polymerase II transcription in mammalian cells. Nucleic Acids Res. 2022;50(14):7972–7990. doi:10.1093/nar/gkac637
33. Calcinotto A, Kohli J, Zagato E, Pellegrini L, Demaria M, Alimonti A. Cellular Senescence: aging, Cancer, and Injury. Physiol Rev. 2019;99(2):1047–1078. doi:10.1152/physrev.00020.2018
34. Sun X, Tan J, Tang L, Guo JJ, Li X. Real world evidence: experience and lessons from China. BMJ (Clinical Research Ed). 2018;360:j5262. doi:10.1136/bmj.j5262
35. Schad F, Thronicke A. Real-world evidence-current developments and perspectives. Int J Environ Res Public Health. 2022;19(16):10159. doi:10.3390/ijerph191610159
36. Blonde L, Khunti K, Harris SB, Meizinger C, Skolnik NS. Interpretation and impact of real-world clinical data for the practicing clinician. Advan Thera. 2018;35(11):1763–1774. doi:10.1007/s12325-018-0805-y
 © 2024 The Author(s). This work is published and licensed by Dove Medical Press Limited. The full terms of this license are available at https://www.dovepress.com/terms.php and incorporate the Creative Commons Attribution - Non Commercial (unported, v3.0) License.
By accessing the work you hereby accept the Terms. Non-commercial uses of the work are permitted without any further permission from Dove Medical Press Limited, provided the work is properly attributed. For permission for commercial use of this work, please see paragraphs 4.2 and 5 of our Terms.
© 2024 The Author(s). This work is published and licensed by Dove Medical Press Limited. The full terms of this license are available at https://www.dovepress.com/terms.php and incorporate the Creative Commons Attribution - Non Commercial (unported, v3.0) License.
By accessing the work you hereby accept the Terms. Non-commercial uses of the work are permitted without any further permission from Dove Medical Press Limited, provided the work is properly attributed. For permission for commercial use of this work, please see paragraphs 4.2 and 5 of our Terms.