")
Back to Journals » Journal of Asthma and Allergy » Volume 17
Short-Term Nitrogen Dioxide Exposure and Emergency Hospital Admissions for Asthma in Children: A Case-Crossover Analysis in England
Authors Wang W , Gulliver J, Beevers S, Freni Sterrantino A, Davies B, Atkinson RW, Fecht D
Received 21 November 2023
Accepted for publication 12 March 2024
Published 9 April 2024 Volume 2024:17 Pages 349—359
DOI https://doi.org/10.2147/JAA.S448600
Checked for plagiarism Yes
Review by Single anonymous peer review
Peer reviewer comments 2
Editor who approved publication: Dr Amrita Dosanjh
Weiyi Wang,1,2 John Gulliver,3 Sean Beevers,4,5 Anna Freni Sterrantino,1,6 Bethan Davies,1,2 Richard W Atkinson,3 Daniela Fecht1,2
1UK Small Area Health Statistics Unit, MRC Centre for Environment and Health, Department of Epidemiology and Biostatistics, School of Public Health, Imperial College London, London, UK; 2National Institute for Health and Care Research Health Protection Research Unit in Chemical and Radiation Threats and Hazards, School of Public Health, Imperial College London, London, UK; 3Population Health Research Institute, St George’s, University of London, London, UK; 4MRC Centre for Environment and Health, Environmental Research Group, School of Public Health, Imperial College London, London, UK; 5National Institute for Health and Care Research Health Protection Research Unit in Environmental Exposures and Health, School of Public Health, Imperial College London, London, UK; 6The Alan Turing Institute, London, UK
Correspondence: Weiyi Wang, MRC Centre for Environment and Health, Department of Epidemiology and Biostatistics, School of Public Health, Imperial College London, Norfolk Place, London, W2 1PG, UK, Email [email protected]
Background: There is an increasing body of evidence associating short-term ambient nitrogen dioxide (NO2) exposure with asthma-related hospital admissions in children. However, most studies have relied on temporally resolved exposure information, potentially ignoring the spatial variability of NO2. We aimed to investigate how daily NO2 estimates from a highly resolved spatio-temporal model are associated with the risk of emergency hospital admission for asthma in children in England.
Methods: We conducted a time-stratified case-crossover study including 111,766 emergency hospital admissions for asthma in children (aged 0– 14 years) between 1st January 2011 and 31st December 2015 in England. Daily NO2 levels were predicted at the patients’ place of residence using spatio-temporal models by combining land use data and chemical transport model estimates. Conditional logistic regression models were used to obtain the odds ratios (OR) and confidence intervals (CI) after adjusting for temperature, relative humidity, bank holidays, and influenza rates. The effect modifications by age, sex, season, area-level income deprivation, and region were explored in stratified analyses.
Results: For each 10 μg/m³ increase in NO2 exposure, we observed an 8% increase in asthma-related emergency admissions using a five-day moving NO2 average (mean lag 0– 4) (OR 1.08, 95% CI 1.06– 1.10). In the stratified analysis, we found larger effect sizes for male (OR 1.10, 95% CI 1.07– 1.12) and during the cold season (OR 1.10, 95% CI 1.08– 1.12). The effect estimates varied slightly by age group, area-level income deprivation, and region.
Significance: Short-term exposure to NO2 was significantly associated with an increased risk of asthma emergency admissions among children in England. Future guidance and policies need to consider reflecting certain proven modifications, such as using season-specific countermeasures for air pollution control, to protect the at-risk population.
Keywords: asthma, nitrogen dioxide, children, hospital admissions, case-crossover
Introduction
Epidemiological studies have provided a strong body of evidence for an association of short-term exposure to traffic-related air pollution with asthma exacerbations and hospitalisations in children.1–5 Children are particularly affected by the adverse health effects of air pollution because their lungs are still developing,6 they have a higher ventilation rate,7 and they are at a higher risk of viral respiratory infections.8
Most studies on the short-term health effects of air pollution rely on measurements obtained from routine monitoring sites assigned to a large number of study participants.9,10 This fails to account for spatial contrasts in air pollution exposure – varying from day to day – between individuals living in the same geographic region, which might lead to non-differential exposure misclassification and, consequently, attenuation of effect estimates towards the null. Advances in spatio-temporal modelling mean that studies can now predict daily exposure at a high spatial resolution, such as the place of residence.11–14
Nitrogen dioxide (NO2) is one of the main constituents of a group of reactive gases known as nitrogen oxides. The primary source of nitrogen oxides in England is road transport through the combustion of vehicle fuels. Therefore, the spatial distribution of NO2 tends to highest levels of concentrations in the vicinity of roads, especially in urban environments. Using an advanced spatio-temporal exposure model which we developed previously to predict daily NO2 concentrations for each residential postcode in Great Britain,15 we aimed to examine the association between short-term NO2 exposure and the risk of emergency hospital admissions for asthma in children across England. We used a case-crossover design and explored potential effect modifications by age, sex, season, area-level income deprivation, and region.
Materials and Methods
We carried out a case-crossover analysis to compare residential NO2 exposure on the day of asthma-related emergency hospital admission with exposure on days without an event, and adjusted for time-variant confounders.
Study Population and Outcome
We included all children aged 0–14 years who were admitted to a National Health Service (NHS) hospital in England between 1st January 2011 and 31st December 2015 with a primary diagnosis of asthma (International Statistical Classification of Disease 10th revision (ICD–10: J45, J46)). This age range was chosen based on established age brackets, which is consistent with previous studies on childhood asthma and air pollution.16,17 Daily emergency (non-elective) admissions were obtained from the Hospital Episode Statistics (HES) held by the UK Small Area Health Statistics Unit (SAHSU) at Imperial College London, provided by NHS England. Each admission record included the admission date, age, sex, and residential postcode of address at the time of admission. Each postcode represents the geographic centroid of approximately fifteen households.
The study was covered by national research ethics approval from the London–South East Research Ethics Committee (Reference 22/LO/0256). Data access to confidential patient information without consent was covered by the Health Research Authority - Confidentiality Advisory Group under Regulation 5 of the Health Service (Control of Patient Information) Regulations 202 (‘section 251 support’) (Reference 20/CAG/0008), which supports the application of confidential patient information in circumstances where it is not possible to use anonymised information and obtaining consent is not practical.
Air Pollution Data
We modelled daily NO2 concentrations on a 25-metre grid using an advanced, validated spatio-temporal air pollution model that is described in detail elsewhere.15 Briefly, the model combines air pollution measurements from fixed sites from the UK Automatic Urban and Rural Monitoring Network (AURN, https://uk-air.defra.gov.uk/networks/network-info?view=aurn) and spatially highly resolved local-scale predictors derived using a Geographic Information System (including traffic load, length of major roads, and building volume around major roads) and temporal predictor variables (including daily estimates from a chemical transport model and daily meteorological characteristics) in a generalised additive mixed model framework. In the cross-validation against NO2 measurements from the monitoring sites, the model performed well and explained 63% of the variability in the daily averaged measured concentrations. Using the established model, we extracted the daily NO2 concentration for each patient’s post-code centroid.
Confounders
By design, time-invariant confounders such as age, sex, and socioeconomic status are controlled for in the case-crossover study design as each case acts as its own control. We controlled for time-variant confounders, including meteorological data, public holidays, and influenza rates in accordance with previous studies.18–20 We computed the daily mean temperature and relative humidity for each patient postcode using ERA5-Land reanalysed hourly climate models from the European Centre for Medium-Range Weather Forecasts (https://www.ecmwf.int/en/era5-land) with a spatial resolution of 0.1° × 0.1°. To account for variations in air pollution levels associated with travel behaviours, we included bank holidays in England as a confounder. We obtained weekly influenza consultation rates from the Office for National Statistics (https://www.ons.gov.uk), reported as weekly influenza-like illnesses per 100,000 population by the Royal College of General Practitioners of England.
Statistical Analysis
We used a time-stratified case-crossover study design.21 For each individual case, a “case day”, the day on which the outcome of interest occurs (ie date of admission), was matched to a set of “control days”, days on which the outcome of interest did not occur. Thus, each case was compared to itself, thereby controlling for time-invariant individual factors. We defined control days as those on the same day of the week and month (before and/or after the case day) to control for any potential time trends,22 resulting in 3 or 4 control days depending on the month. We fitted conditional logistic regression models for the matched datasets,23 with binary responses coded as 1 (case day) or 0 (control day). NO2 was included as a five-day moving average, representing the daily mean NO2 concentration averaged over the day of admission and four days prior (lag 0–4), based on previous evidence.24,25 Individual lags of the same day (lag 0) and four days prior (lag 1 to lag 4) were also explored, and the results are presented in Supplementary Materials.
The models were controlled for the daily mean temperature and relative humidity with the same delayed effect (lag 0–4). We assessed the potential nonlinearity of the response functions for meteorological covariates using natural cubic splines with three degrees of freedom. Binary terms for public holidays and weekly consultation rates for influenza were also included. All results were reported as odds ratios (OR) with 95% confidence intervals (CIs) per 10 µg/m3 increase in the NO2 concentration.
We explored possible effect modifications in stratified analysis by age (0–4, 5–9, and 10–14 years), sex (female and male), season (cold season [defined as January to March and October to December], and warm season [defined as April to September]). We also tested area-level characteristics, including the income deprivation quintile (quintiles of the proportion of population claiming income-related benefits due to being out-of-work or having low earnings from the English Index of Multiple Deprivation 2015) and region (nine regions of England) (Figure S1). We used the Wald test to compare the differences between subgroups of each potential effect modifier.
Preliminary analysis showed that the distance between the patient address and the hospital of admission varied from a few meters to 498 kilometres (Table S1, Figure S2). As people are unlikely to travel hundreds of kilometres for emergency hospital admissions, it is likely that some patients were travelling or staying away from their home addresses at the time of admission, or the patients used an address other than their current address. Therefore, assigning exposure to patients’ registered home addresses may not reflect true exposure. To minimise misclassification of exposure, we applied a threshold for the “patient-to-hospital” distance of ten kilometres, based on previous evidence that 70% of emergency admissions in England happen within 6.2 miles (~ ten kilometres) of a patient’s home.26 If the distance between residential postcode and hospital was less than or equal to ten kilometres, we assigned NO2 exposure based on the registered patient residential postcode; if the distance was larger than ten kilometres, we assigned NO2 exposure based on hospital address. As part of the sensitivity analysis, we tested the validity of the approach by restricting the analysis to only those cases with a patient-to-hospital distance of less than or equal to ten kilometres. This study was conducted in accordance with the guidelines of Strengthening the Reporting of Observational Studies in Epidemiology (STROBE; Table S2). All analyses were performed using R statistical software (v.3.5.1) with the survival package to fit conditional logistic regression models.
Results
Descriptive Statistics
After removing 1200 cases with missing information (sex or postcode), we included 111,766 asthma-related emergency hospital admissions in children younger than 15 years residing in England at the time of admission during the five-year study period (Figure 1). Table 1 summarises the characteristics of the emergency admissions included. The mean count of emergency admissions was 61 cases per day (standard deviation 28). The cases were predominantly male (63%) and in younger age groups (43% aged 0–4 years, 37% aged 5–9 years, and 20% aged 10–14 years). 53% of emergency hospital admissions occurred during the cold season. The most deprived areas (the highest quintile of income deprivation) had the highest number of emergency admissions (35%), with admissions gradually decreasing with decreasing income deprivation to 11% of admissions in the lowest income deprivation quintile. For the nine regions in England, over 20% of the asthma emergency admissions occurred in the North West, followed by London (16%), the West Midlands (15%), and the South East (12%). 73% of admissions were within the patient-to-hospital threshold of ten kilometres and we did not observe a temporal pattern in admissions within this threshold (Table S1).
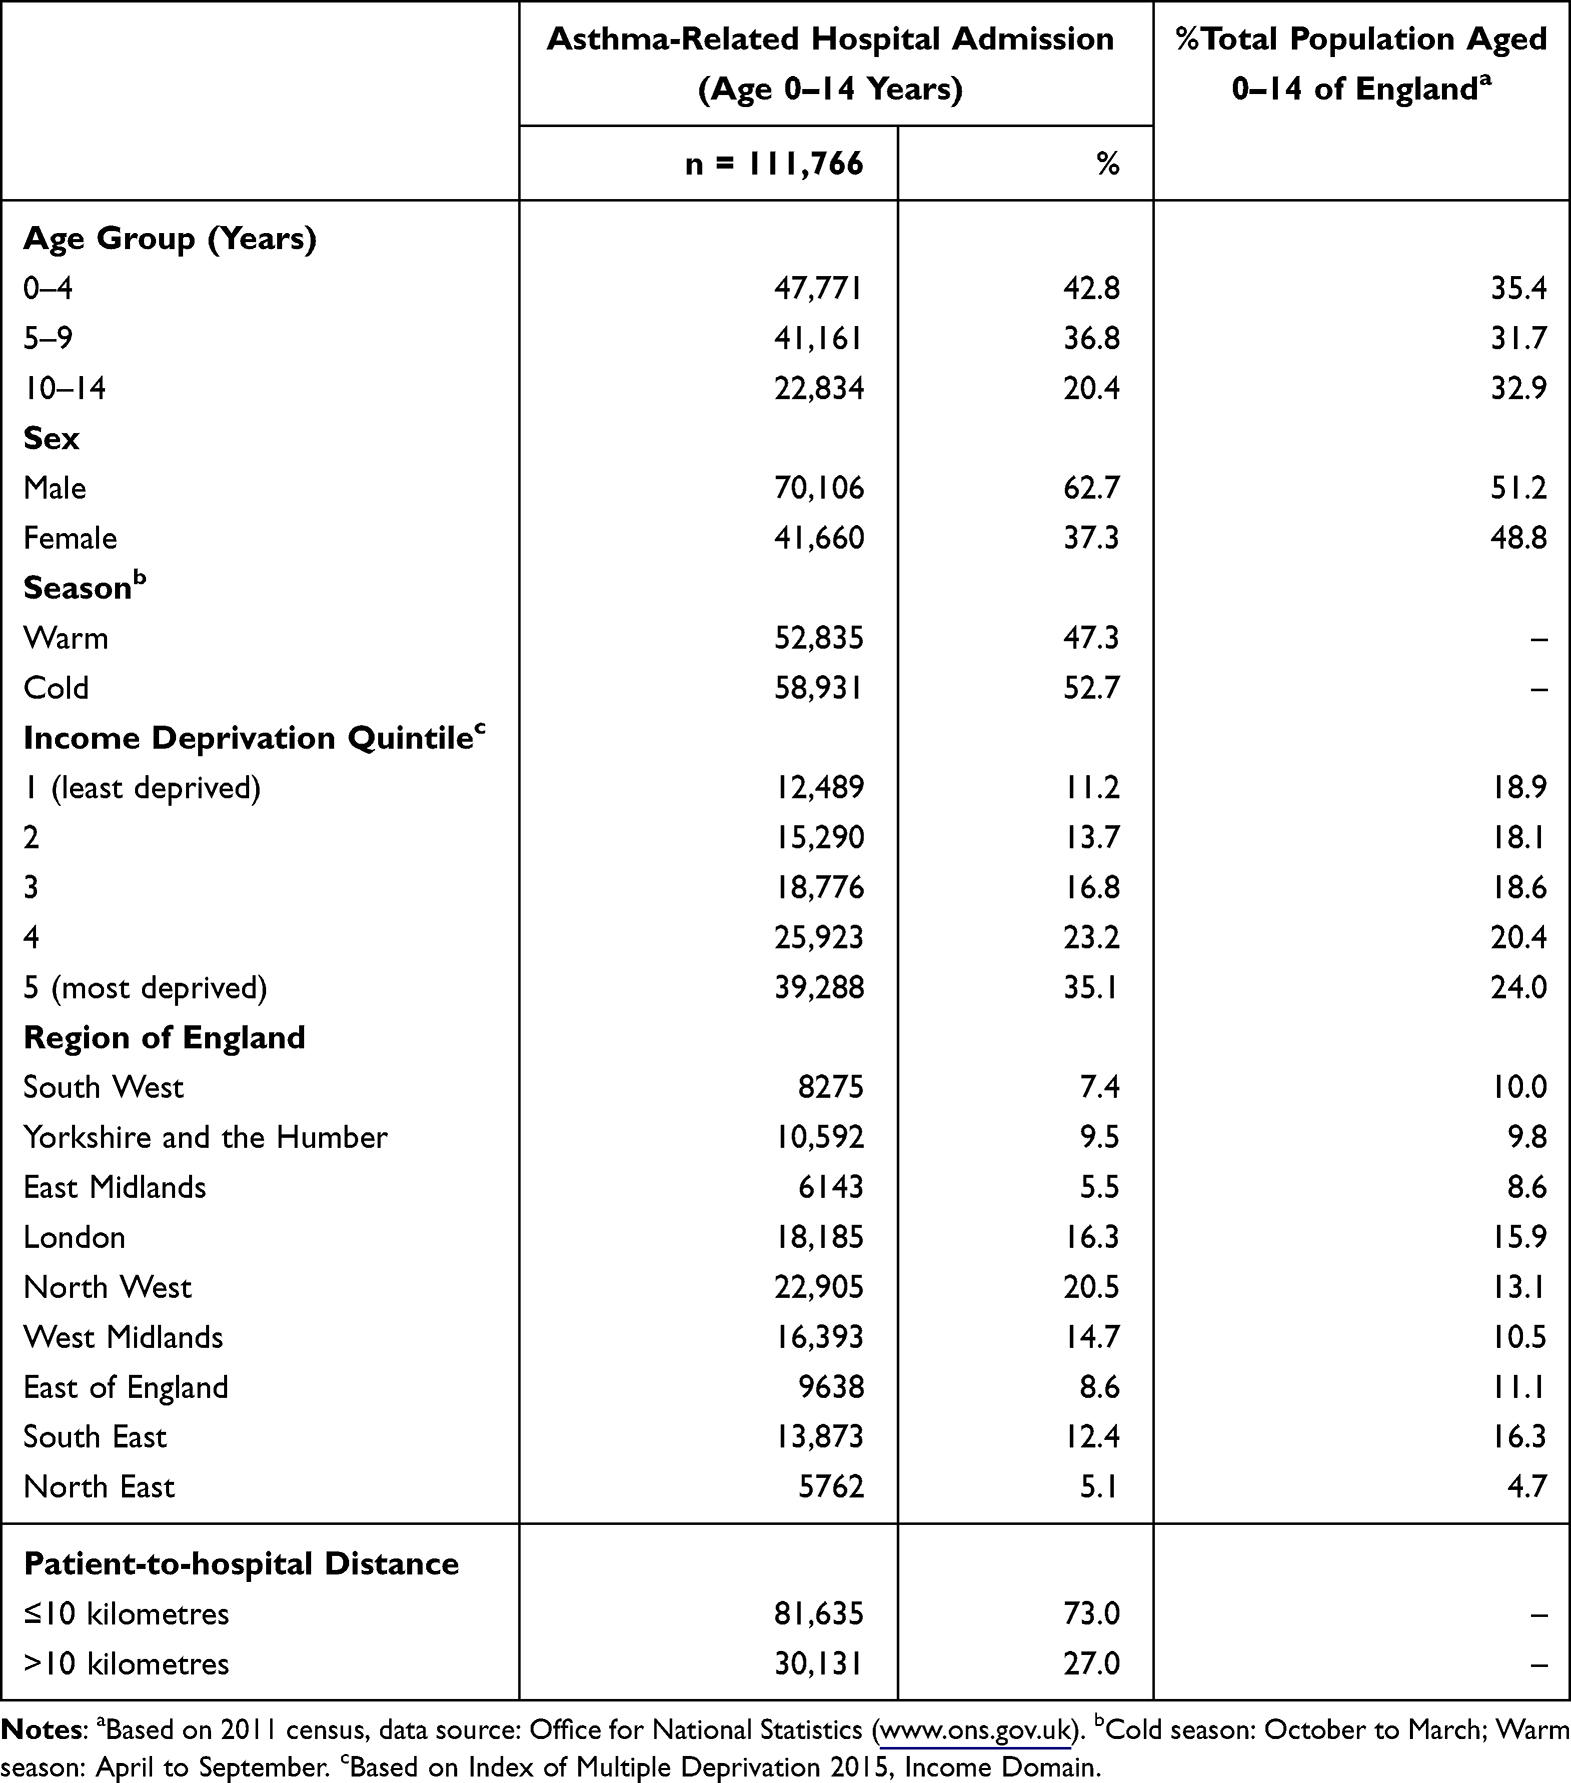 |
Table 1 Characteristics of Asthma Emergency Hospital Admissions of Children Aged 0–14 in England between 2011 and 2015 |
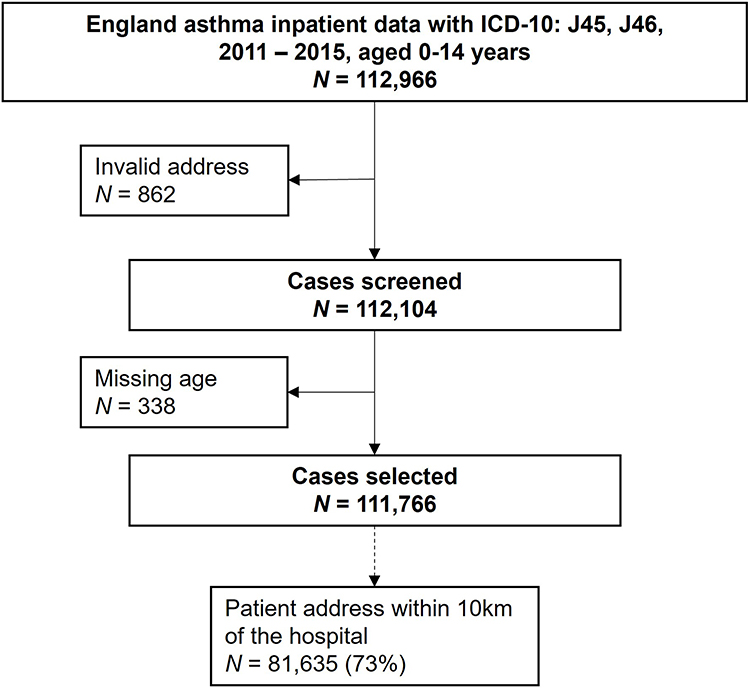 |
Figure 1 Flow chart of case selection. |
There was no clear seasonal pattern of daily emergency hospital admissions, except a peak in September observed in all years, coinciding with the return to school after the summer holiday (Figure 2). The mean daily NO2 exposure across all patients was 19.0 µg/m3 (interquartile range (IQR): 12.6–26.5 µg/m3) (Table S3). The average NO2 exposure showed a clear seasonal pattern (Figure S3), with the cold season (19.6 µg/m3) 2.2 µg/m3 higher than the warm season (17.4 µg/m3) (Table S3). Patients residing in London had the highest daily average NO2 exposure (29.5 µg/m3), and patients residing in the South West had the lowest (13.0 µg/m3) (Table S3). Patients residing in other regions had daily average exposures between 14.6 µg/m3 and 19.7 µg/m3.
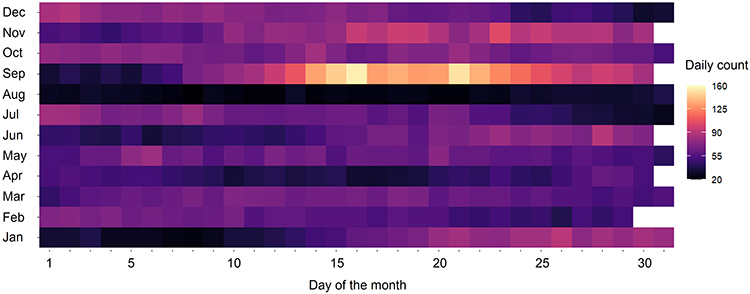 |
Figure 2 Daily average count of asthma-related emergency hospital admissions in children in England by month, averaged across 2011–2015. |
Associations Between NO2 and Emergency Admissions for Asthma
We found an 8% increase in the odds of asthma-related emergency hospital admissions in children aged 0 to 14 years per 10 µg/m3 increase in five-day moving average NO2 (OR 1.08 [95% CI: 1.06–1.10]), after adjustment for time-variant confounders (Figure 3). Effect sizes were larger for male (OR 1.10 [95% CI 1.07–1.12]) than for female (OR 1.06 [95% CI 1.03–1.09], p-value for difference 0.045). In age-stratified analyses, we observed similar effect sizes for the three age groups (OR 1.09 [95% CI 1.06–1.12] for 0 to 4 years; OR 1.08 [95% CI 1.05–1.11] for 5 to 9 years; and OR 1.08 [95% CI 1.04–1.12] for 10 to 14 years). There was a difference in the direction of association between warm and cold seasons (Figure 3), with a 10% increase in odds during cold season (OR 1.10 [95% CI 1.08–1.12]) but 7% decrease during warm season (OR 0.93 [95% CI 0.90–0.97]). Stratified analysis by area-level income deprivation showed no clear trend. The highest effect was observed in the third deprivation quintile (OR 1.11 [95% CI 1.06–1.16]) and the lowest in the least deprived quintile (OR 1.04 [95% CI 0.98–1.10]). Effect sizes varied by region, with the highest observed in the South West (OR 1.12 [95% CI 1.05–1.19] and lowest in the North East (OR 1.01 [95% CI 0.94–1.09]). The North East also had the lowest number of asthma-related emergency admissions. Notably, East Midlands had a comparatively high effect estimate (OR 1.11 [95% CI 1.03–1.21]), but the second lowest number of asthma admissions.
 |
Figure 3 Odds ratios and 95% confidence intervals for asthma-related emergency hospital admissions in children associated per 10 μg/m3 increase in NO2 (lag 0–4), including overall effect size and stratification by age, sex, season, income deprivation quintile, and region. P-value for difference was calculated using a Wald test to compare the difference between subgroups. |
Sensitivity Analyses
In sensitivity analyses, restricting admissions to those within the ten-kilometre patient-to-hospital distance threshold, we found similar effect sizes compared to the main analysis, although with larger confidence intervals due to smaller sample sizes (Table S4). In contrast to the main analysis, we did not observe a decrease in odds during the warm season (OR 1.07 [95% CI 0.99–1.15], p > 0.05). Findings from the single-day lag analysis were generally consistent with those using mean lag 0–4 (Tables S5–S7), but the odds were moderately larger for mean lag 0–4 than for single-day lags.
Discussion
In this case-crossover study, we investigated the association between daily ambient NO2 exposure and asthma-related emergency hospital admissions among children aged 0–14 years in England. NO2 exposure was measured cumulatively over the case day and four days prior (mean lag 0–4). We found positive associations between NO2 and all asthma emergency hospital admissions and for each age and sex strata examined.
The effect estimates were similar across the three age groups, but we observed an effect modification by sex. There were noticeably more male than female asthma hospital admissions in children, which is consistent with the results of previous studies.27–29 We also found that the association between short-term exposure to NO2 and increased risk of asthma emergency admissions was stronger in male children. However, other studies have reported mixed findings, with higher risk in both male and female children.30–32 The reasons for this difference remain unclear, although studies have suggested factors including sex-linked physiological differences such as growth rates and airway sizes, and social differences such as activity patterns.33–35
We observed seasonality in emergency hospital admissions for asthma in children. In this study, short-term exposure to NO2 during the cold season was statistically significantly associated with a 10.1% increased risk of asthma emergency admissions per 10 µg/m3 increase in NO2 exposure. There was no clear evidence of an association in the warm season based on the sensitivity analysis. In England, air pollution levels were generally higher during the cold season than during the warm season (Figure S3). Therefore, air pollution could be a key asthma exacerbation factor during the cold season, whereas other factors, such as pollen, play a more important role in the warm season. Moreover, cold air can trigger functional changes in the airways,36 and air pollution may further irritate the lungs during the cold season, as it passes through the upper respiratory tract to the deep-end bronchus. In contrast to our findings, several previously published studies have found stronger associations among children during the warm season.2,24,37 This difference might be related to the different study characteristics, as these studies used population-level (or group-level) exposure rather than individual-level exposure and assessed emergency department visits which are likely to be less severe than emergency admissions.38
The observed peak in asthma-related admissions in September is likely linked to the known “September asthma epidemic”, when most children return to school in England. There are several potential reasons for this. First, school children may be re-exposed to respiratory viral tract infections (especially rhinovirus) after the summer holiday, and indoor mixing may lead to asthma exacerbations.39 Second, the school environment around August and September exhibited relatively high levels of allergens such as pollen and mould spores.40 Finally, returning to school may lead to high stress, which can worsen asthma symptoms.40
The area-level deprivation index used in this study is based on deprivation measures for geographic areas containing approximately 1500 people, and therefore may not reflect the socioeconomic status of individuals or families. This may explain why the deprivation stratification analysis did not show a consistent effect among the least to most deprived quintiles. Although there is evidence that more deprived households tend to live in areas with poor air quality,41 one study found that low socioeconomic status was not associated with asthma prevalence in England.42 The number of asthma emergency admissions is generally proportional to the population in each region. However, it is notable that 13.1% of children aged 0 to 14 years in England live in the North West, yet 20.5% of asthma emergency admissions came from this region. This may be linked to the relatively high daily average NO2 concentrations in the region (the second highest region after London). The four regions that showed statistically significant associations in both the primary and sensitivity analyses were North West, London, East Midlands, and South West. However, the effect estimates did not show a significant disparity across these regions.
Most previous studies on the association between air pollution and hospital admissions or visits used daily counts of hospital admissions or visits in a Poisson regression time-series or case-crossover analysis.4,19,43–47 These studies account for temporal changes in exposure but assign the same exposure estimate to all cases in the study area, and therefore do not account for spatial differences in exposure. Owing to data requirements (ie individual addresses and pollution estimates), few studies have examined associations at the individual level,17,32,48,49 and less evidence is based on estimates from detailed exposure models.12,14,50 We identified one study that investigated the association between NO2 and asthma hospitalisation among socioeconomically disadvantaged populations (< 65 years of age) in the United States using exposure estimated from machine learning-based models.14 The study found that a 1-ppb (equivalent to around 1.88 µg/m3) increase in NO2 at lag 0–6 was associated with 0.31% (95% CI 0.24–0.37%) increase in the risk of asthma hospitalisation. Children were at a higher risk than the overall population, with 0.35% (95% CI 0.27–0.44%) for 0–4 years and 0.52% (95% CI 0.43–0.62%) for 5–12 years. Additionally, for the study population of all ages, a higher risk was observed in inpatients living in more disadvantaged communities with a high area-level deprivation index (0.33% [95% CI 0.25–0.42%]) than in the medium to low index (0.26% [95% CI 0.20–0.31%]). No modification effect was found between male and female.
Although not directly comparable, our results are in agreement with those of several population-level studies that have assessed NO2 and asthma among children.25,51 For example, a study in Canada reported a 9% increased risk per 13.5 ppb (equivalent to approximately 25.4 µg/m3) increase in asthma emergency visits among children aged 5 to 14 years using a mean lag 0–4.24 The finding is similar to a study in Italy, where a 22.3 µg/m3 increase in NO2 was associated with a 10.7% increase in asthma admissions for children aged 0 to 14 years.16 The effect estimate in our study was similar in magnitude (8.2%), but the increment level of NO2 was 10 µg/m3, suggesting a higher risk.
Strengths and Limitations
A major strength of this study is the use of highly detailed modelled air pollution data that made it possible to assign NO2 estimates to patients’ residential postcodes, rather than using measurement data from the nearest monitoring stations, as in previous studies, which can lead to substantial measurement errors. Measurement errors existed in both the monitored and modelled pollutant concentrations. Errors in exposure models could be linked to a lack of representation of the sources and instrument data used to calibrate the model. The extent of air pollution measurement errors could have an impact on epidemiological studies, especially the statistical power to detect effects. However, studies with only concentrations from scattered monitoring stations have more bias, which increase the likelihood of obtaining a null association in the odds ratio.52 Various simulation studies have suggested that the attenuation of health effect estimates in time-series studies may result from misspecification of exposure.53–56
Some limitations of our study should be noted. First, our definition of asthma-related emergency hospital admission required an ICD code for asthma as the primary diagnosis at admission. This approach has been shown to be highly specific for identifying children with a documented diagnosis of asthma, but it excludes children with undiagnosed asthma which is common, particularly before the age of 6 years, when spirometry can be performed. Therefore, these findings cannot be extrapolated to a cohort of children who present with asthma symptoms (eg, cough, wheezing, or dyspnoea) in the absence of a pre-existing diagnosis of asthma. Second, indoor air pollution, from sources such as smoking and cooking, can also irritate the airways and lead to respiratory diseases.57–59 However, due to the individual-level nature and the scale of the study, we were not able to consider indoor air pollution in our analysis. Third, it is not certain whether the patients were at or around their home addresses during the five-day cumulative exposure window. Although we adopted a “patient-to-hospital” distance with a threshold of ten kilometres, the results were still subject to exposure misclassification. The effect estimates for NO2 in the sensitivity analysis, using only cases within the ten-kilometre threshold, did not differ substantially from the primary analysis, except for the null association during the warm season. This suggests that the approach of assigning exposure based on the distance threshold can be applied in future studies, yet the threshold needs to be carefully chosen and justified. One may consider using different distances for rural and urban locations. Fourth, some modifiers (eg, deprivation quintile) were only available for small geographies, meaning that some findings may not truly reflect individuals within that area. The lack of more granular data (eg, individual socioeconomic status) may explain why we did not find a modification effect in area-level analyses. Fifth, stratification in the analysis to examine effect sizes by subgroup may have resulted in small numbers and reduced statistical power. Last, because of the complexity of modelling and linking exposure from the spatio-temporal air pollution model to the health data, we only conducted a single-pollution analysis. Multi-pollutant models often face validity issues due to multicollinearity, particularly when the assessed pollutants are highly correlated.60 Nonetheless, humans experience simultaneous exposure to a diverse array of other air pollutants (eg, particulate matter) and allergens (eg, pollen and spores).61 Adopting a multi-pollutant approach may offer a more realistic representation of the environmental conditions individuals may experience, and mitigating the risk of confounding in epidemiological studies.
Conclusions
Our findings suggest a significant increase in the risk of asthma-related emergency admissions with higher levels of NO2 exposure in children in England, particularly during colder seasons and among males. Future guidance and policies should consider incorporating proven modifications, such as using season-specific countermeasures for air pollution control, to protect at-risk populations. Further research is needed to explore the potential interaction between air pollutants, allergens, and other factors (eg, ethnicity and underlying health conditions) that could exacerbate childhood asthma and to inform targeted public health strategies to minimise these risks.
Data Sharing Statement
Data may be obtained from a third party and are not publicly available. The UK Small Area Health Statistics Unit (SAHSU) does not have permission to supply data to third parties.
Acknowledgment
We thank Hima Daby, Gajanan Natu, and Eric Johnson for their assistance with the data acquisition, storage, preparation, and governance. The views expressed are those of the authors. This paper does not necessarily reflect the views of the National Institute for Health and Care Research or the Department of Health and Social Care. Hospital Episode Statistics (hospital admissions) data are copyright © 2023, re-used with the permission of NHS Digital. All rights reserved.
The abstract of this paper was presented at the 34th Annual Conference of the International Society for Environmental Epidemiology as a poster presentation with interim findings. The poster’s abstract was published in “ISEE Conference Abstracts”: https://doi.org/10.1289/isee.2022.P-0424.
Author Contributions
All authors made a significant contribution to the work reported, whether that is in the conception, study design, execution, acquisition of data, analysis and interpretation, or in all these areas; took part in drafting, revising or critically reviewing the article; gave final approval of the version to be published; have agreed on the journal to which the article has been submitted; and agree to be accountable for all aspects of the work.
Funding
The work of the UK Small Area Health Statistics Unit (SAHSU) is overseen by the UK Health Security Agency (UK HSA). SAHSU is part of the MRC Centre for Environment and Health supported by the UK Medical Research Council (MR/S019669/1, 2019–2024), and the National Institute for Health and Care Research (NIHR) through its Health Protection Research Units (HPRU) at Imperial College London in Environmental Exposures and Chemical Radiation Threats and Hazards, and through Health Data Research UK (HDR UK). Infrastructure support for the Department of Epidemiology and Biostatistics was provided by the NIHR Imperial BRC.
Disclosure
The authors declare that they have no known competing financial interests or personal relationships that could have appeared to influence the work reported in this paper.
References
1. Zheng X, Orellano P, Lin H, Jiang M, Guan W. Short-term exposure to ozone, nitrogen dioxide, and sulphur dioxide and emergency department visits and hospital admissions due to asthma: a systematic review and meta-analysis. Environ Int. 2021;150:106435. doi:10.1016/j.envint.2021.106435
2. Strickland MJ, Darrow LA, Klein M, et al. Short-term associations between ambient air pollutants and pediatric asthma emergency department visits. Am J Respir Crit Care Med. 2010;182:307–316. doi:10.1164/rccm.200908-1201OC
3. Peters A, Dockery DW, Heinrich J, Wichmann HE. Short-term effects of particulate air pollution on respiratory morbidity in asthmatic children. Eur Respir J. 1997;10(4):872–879. doi:10.1183/09031936.97.10040872
4. Ding L, Zhu D, Peng D, Zhao Y. Air pollution and asthma attacks in children: a case–crossover analysis in the city of Chongqing, China. Environ Pollut. 2017;220:348–353. doi:10.1016/j.envpol.2016.09.070
5. Mann JK, Balmes JR, Bruckner TA, et al. Short-term effects of air pollution on wheeze in asthmatic children in Fresno, California. Environ Health Perspect. 2010;118(10):1497–1502. doi:10.1289/EHP.0901292
6. Valent F, Little D, Bertollini R, Nemer LE, Barbone F, Tamburlini G. Burden of disease attributable to selected environmental factors and injury among children and adolescents in Europe. Lancet. 2004;363(9426):2032–2039. doi:10.1016/S0140-6736(04)16452-0
7. Bateson TF, Schwartz J. Children’s response to air pollutants. J Toxicol Environ Health A. 2008;71(3):238–243. doi:10.1080/15287390701598234
8. Gauderman WJ, Vora H, McConnell R, et al. Effect of exposure to traffic on lung development from 10 to 18 years of age: a cohort study. Lancet. 2007;369(9561):571–577. doi:10.1016/S0140-6736(07)60037-3
9. Son JY, Lee JT, Kim H, Yi O, Bell ML. Susceptibility to air pollution effects on mortality in Seoul, Korea: a case-crossover analysis of individual-level effect modifiers. J Expo Sci Environ Epidemiol. 2012;22(3):227–234. doi:10.1038/jes.2012.6
10. Mahalingaiah S, Hart JE, Laden F, et al. Adult air pollution exposure and risk of infertility in the nurses health study II. Hum Reprod. 2016;31(3):638–647. doi:10.1093/humrep/dev330
11. Di Q, Dai L, Wang Y, et al. Association of short-term exposure to air pollution with mortality in older adults. JAMA. 2017;318(24):2446–2456. doi:10.1001/jama.2017.17923
12. Wei Y, Wang Y, Di Q, et al. Short term exposure to fine particulate matter and hospital admission risks and costs in the Medicare population: time stratified, case crossover study. BMJ. 2019;367:16258. doi:10.1136/bmj.l6258
13. Fisher JA, Puett RC, Laden F, et al. Case-crossover analysis of short-term particulate matter exposures and stroke in the health professionals follow-up study. Environ Int. 2019;124:153–160. doi:10.1016/j.envint.2018.12.044
14. Wei Y, Qiu X, Sabath MB, et al. Air pollutants and asthma hospitalization in the Medicaid population. Am J Respir Crit Care Med. 2022;205(9):1075–1083. doi:10.1164/rccm.202107-1596OC
15. Wang W, Fecht D, Beevers S, Gulliver J. Predicting daily concentrations of nitrogen dioxide, particulate matter and ozone at fine spatial scale in Great Britain. Atmos Pollut Res. 2022;13(8):101506. doi:10.1016/J.APR.2022.101506
16. Fusco D, Forastiere F, Michelozzi P, et al. Air pollution and hospital admissions for respiratory conditions in Rome, Italy. Eur Respir J. 2001;17(6):1143–1150. doi:10.1183/09031936.01.00005501
17. Cheng J, Tong S, Su H, Xu Z. Association between sub-daily exposure to ambient air pollution and risk of asthma exacerbations in Australian children. Environ Res. 2022;212:113556. doi:10.1016/J.ENVRES.2022.113556
18. Bhaskaran K, Gasparrini A, Hajat S, Smeeth L, Armstrong B. Time series regression studies in environmental epidemiology. Int J Epidemiol. 2013;42(4):1187–1195. doi:10.1093/ije/dyt092
19. Blangiardo M, Richardson S, Gulliver J, Hansell A. A Bayesian analysis of the impact of air pollution episodes on cardio-respiratory hospital admissions in the Greater London area. Stat Methods Med Res. 2011;20(1):69–80. doi:10.1177/0962280210372571
20. Schwarze J, Openshaw P, Jha A, et al. Influenza burden, prevention, and treatment in asthma-A scoping review by the EAACI Influenza in asthma task force. Allergy. 2018;73(6):1151–1181. doi:10.1111/all.13333
21. Maclure M. The case-crossover design: a method for studying transient effects on the risk of acute events. Am J Epidemiol. 1991;185(11):1174–1183. doi:10.1093/aje/kwx105
22. Janes H, Sheppard L, Lumley T. Case-crossover analyses of air pollution exposure data: referent selection strategies and their implications for bias. Epidemiology. 2005;16(6):717–726. doi:10.1097/01.EDE.0000181315.18836.9D
23. Lu Y, Zeger SL. On the equivalence of case-crossover and time series methods in environmental epidemiology. Biostatistics. 2007;8(2):337–344. doi:10.1093/biostatistics/kxl013
24. Villeneuve PJ, Chen L, Rowe BH, Coates F. Outdoor air pollution and emergency department visits for asthma among children and adults: a case-crossover study in northern Alberta, Canada. Environ Health. 2007;6(1):40. doi:10.1186/1476-069X-6-40
25. Chen K, Glonek G, Hansen A, et al. The effects of air pollution on asthma hospital admissions in Adelaide, South Australia, 2003–2013: time-series and case–crossover analyses. Clin Exp Allergy. 2016;46(11):1416–1430. doi:10.1111/cea.12795
26. Roberts A, Blunt I, Bardsley M Focus On: distance from Home to Emergency Care. The Health Foundation and the Nuffield Trust; 2014. Available from: www.qualitywatch.org.uk.
27. Kanatani KT, Ito I, Al-Delaimy WK, et al. Desert dust exposure is associated with increased risk of asthma hospitalization in children. Am J Respir Crit Care Med. 2010;182(12):1475. doi:10.1164/RCCM.201002-0296OC
28. Altzibar JM, Tamayo-Uria I, De Castro V, et al. Epidemiology of asthma exacerbations and their relation with environmental factors in the Basque Country. Clin Exp Allergy. 2015;45(6):1099–1108. doi:10.1111/cea.12419
29. Grineski SE, Staniswalis JG, Bulathsinhala P, Peng Y, Gill TE. Hospital admissions for asthma and acute bronchitis in El Paso, Texas: do age, sex, and insurance status modify the effects of dust and low wind events? Environ Res. 2011;111(8):1148–1155. doi:10.1016/j.envres.2011.06.007
30. Sheffield PE, Zhou J, Shmool JLC, Clougherty JE. Ambient ozone exposure and children’s acute asthma in New York City: a case-crossover analysis children s environmental health. Environ Health. 2015;14(1):25. doi:10.1186/s12940-015-0010-2
31. Zhang Y, Ni H, Bai L, et al. The short-term association between air pollution and childhood asthma hospital admissions in urban areas of Hefei City in China: a time-series study. Environ Res. 2019;169:510–516. doi:10.1016/J.ENVRES.2018.11.043
32. Kuo CY, Pan RH, Chan CK, Wu CY, Phan D, Chan CL. Application of a time-stratified case-crossover design to explore the effects of air pollution and season on childhood asthma hospitalization in cities of differing urban patterns: big data analytics of government open data. Int J Environ Res Public Health. 2018;15(4):647. doi:10.3390/ijerph15040647
33. Osman M. Therapeutic implications of sex differences in asthma and atopy. Arch Dis Child. 2003;88(7):587–590. doi:10.1136/adc.88.7.587
34. Vink NM, Postma DS, Schouten JP, Rosmalen JGM, Boezen HM. Gender differences in asthma development and remission during transition through puberty: the Tracking Adolescents Individual Lives Survey (TRAILS) study. J Allergy Clin Immunol. 2010;126(3):498–504. doi:10.1016/j.jaci.2010.06.018
35. Clougherty JE. A growing role for gender analysis in air pollution epidemiology. Environ Health Perspect. 2010;118(2):167–176. doi:10.1289/ehp.0900994
36. Koskela HO. Cold air-provoked respiratory symptoms: the mechanisms and management. Int J Circumpolar Health. 2007;66(2):91–100. doi:10.3402/IJCH.V66I2.18237
37. Barnett AG, Williams GM, Schwartz J, et al. Air pollution and child respiratory health: a case-crossover study in Australia and New Zealand. Am J Respir Crit Care Med. 2005;171(11):1272–1278. doi:10.1164/rccm.200411-1586OC
38. Winquist A, Klein M, Tolbert P, Flanders WD, Hess J, Sarnat SE. Comparison of emergency department and hospital admissions data for air pollution time-series studies. Environ Health. 2012;11(1):70. doi:10.1186/1476-069X-11-70
39. Johnston NW, Johnston SL, Norman GR, Dai J, Sears MR. The September epidemic of asthma hospitalization: school children as disease vectors. J Allergy Clin Immunol. 2006;117(3):557–562. doi:10.1016/j.jaci.2005.11.034
40. Sears MR, Johnston NW. Understanding the September asthma epidemic. J Allergy Clin Immunol. 2007;120(3):526–529. doi:10.1016/j.jaci.2007.05.047
41. Fecht D, Fischer P, Fortunato L, et al. Associations between air pollution and socioeconomic characteristics, ethnicity and age profile of neighbourhoods in England and the Netherlands. Environ Pollut. 2015;198:201–210. doi:10.1016/j.envpol.2014.12.014
42. Wheeler BW, Ben-Shlomo Y. Environmental equity, air quality, socioeconomic status, and respiratory health: a linkage analysis of routine data from the Health Survey for England. J Epidemiol Community Health. 2005;59(11):948–954. doi:10.1136/jech.2005.036418
43. Tian L, Qiu H, Sun S, Tsang H, Chan KP, Leung WK. Association between emergency admission for peptic ulcer bleeding and air pollution: a case-crossover analysis in Hong Kong’s elderly population. Lancet Planet Health. 2017;1(2):e74–e81. doi:10.1016/S2542-5196(17)30021-9
44. Petroeschevsky A, Simpson RW, Thalib L, Rutherford S. Associations between outdoor air pollution and hospital admissions in Brisbane, Australia. Arch Environ Health. 2001;56(1):37–52. doi:10.1080/00039890109604053
45. Andersen HR, Spix C, Medina S, et al. Air pollution and daily admissions for chronic obstructive pulmonary disease in 6 European cities: results from the APHEA project. Eur Respir J. 1997;10(5):1064–1071. doi:10.1183/09031936.97.10051064
46. Muhsin HA, Steingrimsson S, Oudin A, Åström DO, Carlsen HK. Air pollution and increased number of psychiatric emergency room visits: a case-crossover study for identifying susceptible groups. Environ Res. 2022;204:112001. doi:10.1016/J.ENVRES.2021.112001
47. Hoffmann C, Maglakelidze M, von Schneidemesser E, Witt C, Hoffmann P, Butler T. Asthma and COPD exacerbation in relation to outdoor air pollution in the metropolitan area of Berlin, Germany. Respir Res. 2022;23(1):64. doi:10.1186/S12931-022-01983-1
48. Cheng J, Su H, Song J, Wang X. Short-term effect of air pollution on childhood epilepsy in eastern China: a space–time-stratified case-crossover and pooled analysis. Environ Int. 2022;170:107591. doi:10.1016/j.envint.2022.107591
49. Myung W, Lee H, Kim H. Short-term air pollution exposure and emergency department visits for amyotrophic lateral sclerosis: a time-stratified case-crossover analysis. Environ Int. 2019;123:467–475. doi:10.1016/J.ENVINT.2018.12.042
50. Lavigne E, Ryti N, Gasparrini A, et al. Short-term exposure to ambient air pollution and individual emergency department visits for COVID-19: a case-crossover study in Canada. Thorax. 2023;78(5):459–466. doi:10.1136/thoraxjnl-2021-217602
51. Lee JT, Kim H, Song H, et al. Air pollution and asthma among children in Seoul, Korea. Epidemiology. 2002;13(4):481–484. doi:10.1097/00001648-200207000-00018
52. Butland BK, Atkinson RW, Crichton S, et al. Air pollution and the incidence of ischaemic and haemorrhagic stroke in the South London stroke register: a case-cross-over analysis. J Epidemiol Community Health. 2017;71(7):707–712. doi:10.1136/jech-2016-208025
53. Butland BK, Armstrong B, Atkinson RW, et al. Measurement error in time-series analysis: a simulation study comparing modelled and monitored data. BMC Med Res Methodol. 2013;13(1):136. doi:10.1186/1471-2288-13-136
54. Strickland MJ, Gass KM, Goldman GT, Mulholland JA. Effects of ambient air pollution measurement error on health effect estimates in time-series studies: a simulation-based analysis. J Expo Sci Environ Epidemiol. 2015;25(2):160–166. doi:10.1038/jes.2013.16
55. Goldman GT, Mulholland JA, Russell AG, et al. Impact of exposure measurement error in air pollution epidemiology: effect of error type in time-series studies. Environ Health. 2011;10(1):61. doi:10.1186/1476-069X-10-61
56. Dionisio KL, Chang HH, Baxter LK. A simulation study to quantify the impacts of exposure measurement error on air pollution health risk estimates in copollutant time-series models. Environ Health. 2016;15(1):114. doi:10.1186/s12940-016-0186-0
57. Marseglia GL, Avanzini MA, Caimmi S, et al. Passive exposure to smoke results in defective interferon-γ production by adenoids in children with recurrent respiratory infections. J Interferon Cytokine Res. 2009;29(8):427–431. doi:10.1089/JIR.2008.0108
58. Simon SA, Liedtke W. How irritating: the role of TRPA1 in sensing cigarette smoke and aerogenic oxidants in the airways. J Clin Invest. 2008;118(7). doi:10.1172/JCI36111
59. Lin W, Brunekreef B, Gehring U. Meta-analysis of the effects of indoor nitrogen dioxide and gas cooking on asthma and wheeze in children. Int J Epidemiol. 2013;42(6):1724–1737. doi:10.1093/IJE/DYT150
60. Orellano P, Reynoso J, Quaranta N, Bardach A, Ciapponi A. Short-term exposure to particulate matter (PM10 and PM2.5), nitrogen dioxide (NO2), and ozone (O3) and all-cause and cause-specific mortality: systematic review and meta-analysis. Environ Int. 2020;142:105876. doi:10.1016/J.ENVINT.2020.105876
61. Dominici F, Peng RD, Barr CD, Bell ML. Protecting human health from air pollution: shifting from a single-pollutant to a multi-pollutant approach. Epidemiology. 2010;21(2):187. doi:10.1097/EDE.0B013E3181CC86E8
 © 2024 The Author(s). This work is published by Dove Medical Press Limited, and licensed under a Creative Commons Attribution License.
The full terms of the License are available at http://creativecommons.org/licenses/by/4.0/.
The license permits unrestricted use, distribution, and reproduction in any medium, provided the original author and source are credited.
© 2024 The Author(s). This work is published by Dove Medical Press Limited, and licensed under a Creative Commons Attribution License.
The full terms of the License are available at http://creativecommons.org/licenses/by/4.0/.
The license permits unrestricted use, distribution, and reproduction in any medium, provided the original author and source are credited.