")
Back to Journals » Drug Design, Development and Therapy » Volume 11
Schiff base derived from thiosemicarbazone and anthracene showed high potential in overcoming multidrug resistance in vitro with low drug resistance index
Authors Bai J, Wang RH, Qiao Y, Wang A, Fang CJ
Received 30 March 2017
Accepted for publication 15 May 2017
Published 31 July 2017 Volume 2017:11 Pages 2227—2237
DOI https://doi.org/10.2147/DDDT.S138371
Checked for plagiarism Yes
Review by Single anonymous peer review
Peer reviewer comments 3
Editor who approved publication: Professor Manfred Ogris
Video abstract presented by Fang CJ.
Views: 629
Jie Bai,1 Rui-Hui Wang,1 Yan Qiao,2 Aidong Wang,3 Chen-Jie Fang1
1Department of Chemical Biology, School of Pharmaceutical Sciences, Capital Medical University, Beijing, 2Department of Pathophysiology, School of Basic Medical Sciences, Zhengzhou University, Zhengzhou, Henan, 3Department of Pharmaceutical Engineering, College of Chemistry and Chemical Engineering, Huangshan University, Huangshan, Anhui, China
Abstract: Multidrug resistance (MDR) is a huge obstacle in cancer chemotherapeutics. Overcoming MDR is a great challenge for anticancer drug discovery. Here, DNA binding and cytotoxicity of Schiff base L1 and L2 were explored to assess their efficiency in fighting cancer and overcoming the MDR. L1 and L2 could treat extremely chemoresistant MCF-7/ADR cell as drug-sensitive cell, with drug resistance index (DRI) <2.13, showing high potential in overcoming the MDR. The apoptotic ratio induced by L1 and L2 was low for both MCF-7 and MCF-7/ADR cells. L1 and L2 induced an impairment of cell cycle progression of MCF-7 and MCF-7/ADR cell lines and suppressed cell growth by perturbing progress through the G0/G1 phase, with L2 causing more profound effect, which might account for lower drug resistance after L2 treatment. The molecular docking revealed weak interaction between L1/L2 and P-glycoprotein (P-gp), the most important drug efflux pump and intracellular Rhodamine 123 accumulation indicated that the activity of P-gp was not inhibited by L1 and L2. Combined with the cellular uptake results, it implied that L1 and L2 could bypass P-gp efflux to exert anticancer activity.
Keywords: DNA intercalating, antiproliferation, multidrug resistance, P-glycoprotein
Introduction
Cancer is one of the most fatal diseases, and millions of people are diagnosed with this noncommnunicable disease every year.1–3 Chemotherapeutics is a main treatment for cancer, which essentially means applying cytotoxic medications to kill cancer cells or make them less active. A major obstacle to the ultimate success of cancer chemotherapy is the resistance of human tumors to multiple anticancer drugs (multidrug resistance [MDR]), which accounts for approximately 90% of chemotherapeutic failures in cancer patients.4,5 Therefore, it is of utmost importance to develop new drugs with low drug resistance index (DRI).
Within diverse class of active agents, the anthracycline is the most important with respect to clinically approved drugs for various tumors,6,7 eg, anthracycline-based chemotherapy has long been considered the standard approach to treat breast cancer.8 To date, the most successful anthracycline is doxorubicin (DOX) as it has demonstrated a wide spectrum of antitumor activity. However, the therapeutic index of DOX is limited by its adverse toxicity such as dose-limiting cardiotoxicity and by the development of MDR.
Thiosemicarbazones have proved significant in vitro antitumor activity against several human tumor cell lines,9–11 some of which has been clinically evaluated against several malignancies including leukemia.12–14 Recently, some thiosemicarbazone has shown unique property and potential toxicity, rather than antagonized by the P-glycoprotein (P-gp), the best-known and most important mediator of the MDR,15,16 suggesting an applicable potential in overcoming the MDR, while thiosemicarbazone itself is not a substrate for P-gp.
Numerous biological experiments have demonstrated that DNA is the primary intracellular target of anticancer drugs. Many anticancer drugs exert their biological activity through DNA intercalation17,18 to cause damage in cancer cells, block the division, and result in cell death.19 Among the types of DNA intercalators, anthracene features has a significant potential of overlapping with DNA base pairs, facilitating intercalation into the DNA helix.20–22 In this respect, we explored two Schiff base derivatives (Scheme 1, L1 and L2) from anthracene-9-carboxaldehy and thiosemicarbazide for intercalating with DNA and overcoming MDR. They showed antiproliferative properties in parental breast cancer cell line MCF-7 and DOX-resistant MCF-7/ADR cell line with low DRI, suggesting the potential of L1 and L2 in overcoming MDR.
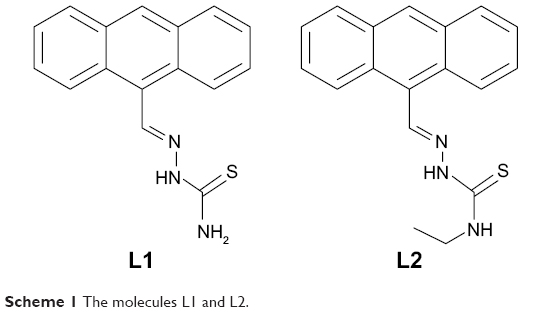 | Scheme 1 The molecules L1 and L2. |
Materials and methods
All reagents were analytical grade, and aqueous solutions were prepared using distilled deionized water. Calf thymus DNA (CT-DNA) and DOX (Sigma-Aldrich, St Louis, MO, USA) were used without further purification. The purity of the CT-DNA was identified with the ratio of A260 nm to A280 nm 1.9, and the concentration was spectroscopically determined using molar absorption coefficient of 6,600 cm−1 M−1 at 260 nm. L1 and L2 were prepared according to our previous work23 and characterized with 1H NMR and MS data (Supplementary materials). L1 and L2 were dissolved in dimethylsulfoxide (DMSO) from which working solutions were prepared by dilution with 0.02 M Tris buffer (pH 7.4) to a concentration (c) of 1.0×10⁻⁵ M as used in spectroscopic experiment study at room temperature.
Spectroscopic experiment
UV–vis spectra were measured on a UV-2600 spectrophotometer. Fluorescence was scanned on an F-2500 Fluorescence Spectrophotometer with a 5 nm slit for excitation and emission beams. Fluorescence titrations were conducted by adding increasing amounts of CT-DNA directly into the cell containing the solution of L1 and L2 (c =1.0×10⁻⁵ M, 0.02 M Tris buffer, pH 7.4).
Cell lines and cell culture
The human breast cancer cell MCF-7 was cultured in RPMI-1640 medium (HyClone; Thermo Fisher Scientific, Waltham, MA, USA) supplemented with 10% fetal calf serum (FBS; Sijiqing Biological Engineering Materials Co., Ltd., Hangzhou, China), 100 units mL−1 penicillin, and 100 μg mL−1 streptomycin at 37°C. The DOX-resistant MCF-7/ADR cells were cultured in the abovementioned medium, plus 1 μg mL−1 DOX. All cells were maintained at 37°C in a humidified and 5% CO2 incubator. MCF-7/ADR cells were cultured in DOX-free medium for 2 weeks before the experiments. All cell lines were purchased from Jiangsu Keygen Biotech Corp., Ltd (Jiangsu, China).
Cell viability
Cell viability was evaluated by the 3-(4,5-dimethylthiazolyl-2)-2,5-diphenyltetrazolium bromide (MTT) assay. The concentration of L1 was set as 0.25, 0.5, 1, 5, 10, 15, 20, and 25 μg mL−1, L2 as 0.25, 0.5, 1, 2, 4, 6, 8, and 10 μg mL−1, and DOX was set as the positive control with the concentration of 0.023, 0.047, 0.094, 0.19, 0.37, 0.75, 1.5, and 3.0 μg mL−1 for MCF-7, and 1, 5, 10, 20, 30, 40, 50, and 60 μg mL−1 for MCF-7/ADR. The cells (100 μL) were left to adhere onto 96-well plates for 24 h and treated with the drug for 24, 48, and 72 h. After incubation with MTT (5 mg mL−1 in phosphate-buffered saline [PBS]) for 4 h at 37°C, the supernatant was removed, and 100 μL of DMSO were added to dissolve the formosan formed. Absorbance at 490 nm was measured with an multilable reader (EnSpire 2300 multilable reader; PerkinElmer, Waltham, MA, USA), and the percentage of cell viability was calculated as [(Atreated − Ablank)/(Auntreated − Ablank)] ×100%. Triplicate experiments were performed.
Cell apoptosis
The apoptosis was assessed by dual dye staining using Annexin V-Fluorescein isothiocyanate (FITC)/Propidium iodide (PI) kit (Beyotime, Hangzhou, China). At the end of the treatment, untreated and treated cells were harvested and washed with cold PBS. Then, cells were collected with 195 μL Annexin-binding buffer and incubated with 5 μL Annexin V-FITC and 10 μL propidium iodide (PI) in the dark for 10 min. The samples were analyzed using flow cytometer (Becton Dickinson, Franklin Lakes, NJ, USA).
Cell cycle analysis
MCF-7/ADR cells (2.0×10⁵) were seeded in six-well plates and treated with L1 or L2 for 24 h. The cells without drug were set as the control group. The concentration of L1 was set as 5, 10, and 15 μg mL−1 and L2 as 5 and 10 μg mL−1. The cells were harvested by centrifugation, washed with PBS, and fixed in ice-cold 70% ethanol at 4°C overnight. The cells were collected by centrifugation and stained with 500 μL of PI staining solution (50 μg mL−1 PI and 100 μg mL−1 RNase). The cell cycle was analyzed on Couter EPICS XL flow cytometer with MultiCycle software (De Novo Software, Glendale, CA, USA).
Intracellular Rhodamine 123 accumulation
P-gp pump function was assessed by measuring intracellular accumulation of Rhodamine 123. MCF-7/ADR cells were seeded into six-well flat-bottom plates and cultured overnight in RPMI-1640 medium containing 10% FBS, then treated with or without L1 and L2 (5 μM) for 48 h. Rhodamine 123 (10 μM) was added to the cells and incubated in dark at 37°C in 5% CO2 for another 1 h. The cells were harvested and washed twice with ice-cold PBS. The mean fluorescence intensity (MFI) associated with Rhodamine 123 was then determined with λex 488 nm using FACS flow cytometer (Becton Dickinson).
Cellular uptake
MCF-7 and MCF-7/ADR cells were seeded into six-well flat-bottom plates and cultured overnight in RPMI-1640 medium containing 10% FBS, then treated with L1 and L2 (20 μM) for 12 h, and the cells treated without L1/L2 were set as the control group. The cells were harvested and washed twice with ice-cold PBS. The MFI associated with L1 and L2 was then determined with λem 500±50 nm using FACS flow cytometer (Becton Dickinson).
Computational detail
Homology modeling and molecular dynamics (MD) simulations were performed to construct and optimize the 3D structure of human P-gp based on the X-ray crystal structures of mouse P-gp (PDB ID: 4Q9L).24 Briefly, the homology modeling was carried out using the automated modeling module, MODELLER 9.13.25 The sequence alignment of human P-gp with mouse P-gp was conducted using BLAST. The sequence identity is as high as 82.3%, indicating that the homology-modeled human P-gp structure based on mouse P-gp structure is reliable. The initial model was then minimized, and DOX was docked into the possible active site of the enzyme using the AutoDock 4.2 program.26 Next, the ionizable residues were set to the standard protonated or deprotonated states at the physiological conditions (pH =~7.4). Then, the whole structure of human P-gp binding with DOX was solvated in a rectangular box of TIP3P water molecules with a minimum solute–wall distance of 10 Å. Additional Cl− were added in the solvent as counter ions to neutralize the whole system. In the following, a series of energy minimizations were carried out using the Sander module of Amber 16 program27 with a nonbonded cutoff of 10 Å and a conjugate gradient energy-minimization method. Later, ~3 ns MD simulations for the resultant binding complex were performed with both the inhibitor and enzyme relaxed to obtain a reasonable binding conformation. At last, the representative snapshots extracted from MD simulations were used to dock the Schiff base L1 and L2.
Statistical analysis
All experiments were carried out at least in triplicate, and the results were expressed as the mean ± SD. The difference between two groups was analyzed by Student’s t-test, and the difference between three or more groups was analyzed by one-way analysis of variance (ANOVA) multiple comparisons. Difference with P<0.05 (*), P<0.01 (**), or P<0.001 (***) was considered statistically significant, while P>0.05 (ns) was considered as no significant difference.
Results and discussion
DNA binding interaction
It is known that the planar anthracene is suitable for intercalation into the DNA helix to support a good overlap with DNA base pairs. As many anticancer drugs are known to target DNA, the ability of L1 and L2 to bind to DNA was measured at molecular level with spectroscopy (Figure 1). L1 and L2 exhibited broad absorption band in the region 320–460 nm, with fine structural bands located at 351, 372, and 389 nm, which is typical for transitions between the π-electronic energy levels of the anthracene skeleton. The titration experiments at various concentrations of CT-DNA showed a moderate decrease (10.1% for L1 and 13.3% for L2) in the absorption intensity within the increasing concentrations of CT-DNA, combined with appearance of isosbestic point. This hypochromicity is due to the interaction between the electronic states of the intercalating anthracene and the DNA base pairs,21 indicating potential anticancer activity via intercalating interactions with DNA. Therefore, the cytotoxicity of L1 and L2 against cancer cells was further assessed with standard MTT assay to measure the cell viability after incubation of MCF-7 and MCF-7/ADR cells.
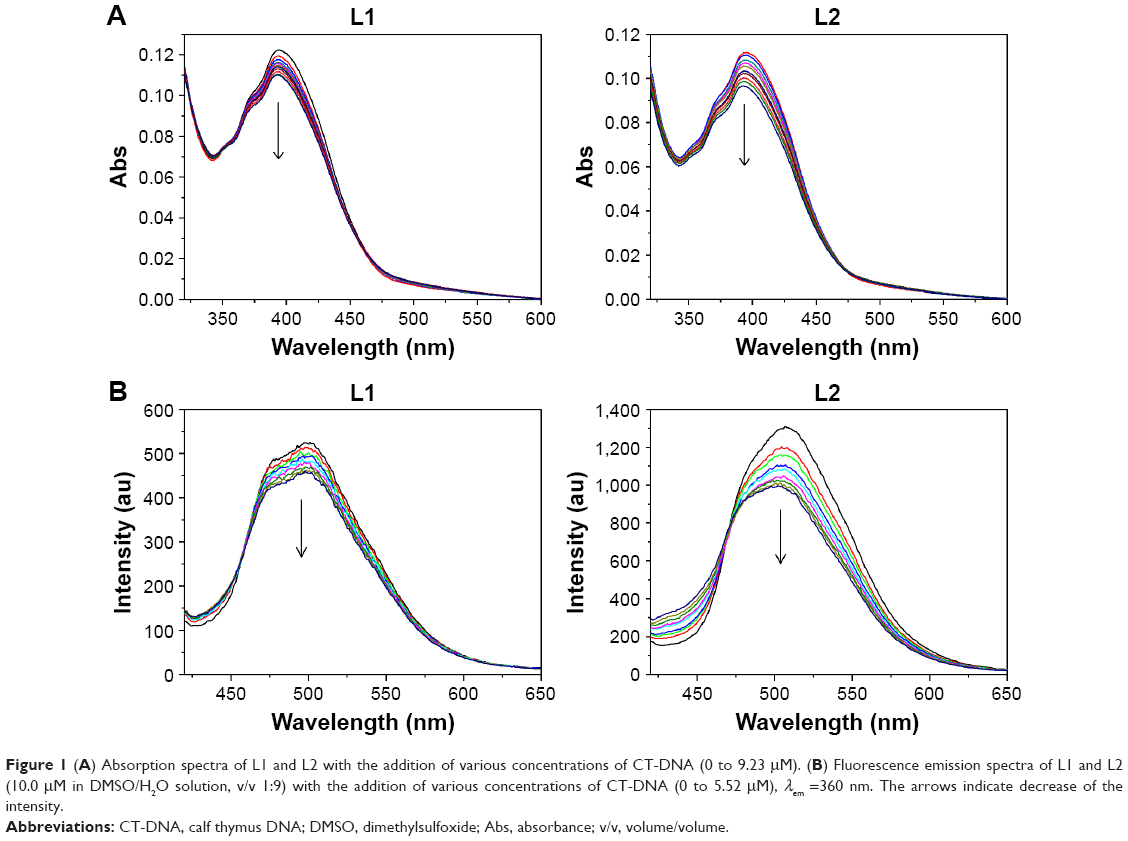 | Figure 1 (A) Absorption spectra of L1 and L2 with the addition of various concentrations of CT-DNA (0 to 9.23 μM). (B) Fluorescence emission spectra of L1 and L2 (10.0 μM in DMSO/H2O solution, v/v 1:9) with the addition of various concentrations of CT-DNA (0 to 5.52 μM), λem =360 nm. The arrows indicate decrease of the intensity. |
The complexes formed by DNA and L1/L2 were detected with fluorescence titration experiments (Figure 2), and the association constant (K) was calculated according to the method of McGhee and von Hippel equation and Scatchard plot.28 L1 and L2 showed comparable DNA binding constant K and binding site number n, 3.41×10⁵ M−1 and 1.19 for L1 and 1.88×10⁴ M−1 and 0.89 for L2, suggesting an affinity of L1 and L2 to the DNA base pairs. The binding isotherms were linear for L1 and L2, confirming one binding site. Generally, the emission from the intercalators is suppressed or enhanced while the fluorophore interacts with DNA via electron transfer processes. The fluorescence of L1 and L2 was quenched after addition of CT-DNA, due to π-stacking between anthryl plane and DNA base pairs, which suggests an intercalating between L1/L2 and DNA.29,30 Also, the fluorescence titration represents a useful marker to identify the nature of the binding site,22,29,31 that is, the GC sequence of DNA quenches the fluorescence of anthryl while AT sequence enhances the fluorescence, in most cases. Within the tested CT-DNA concentrations, the emission of L1 and L2 from anthracene was quenched as CT-DNA was added, with the emission intensity decreased to 12.6% for L1 and 24.3% for L2, suggesting an intercalative binding mode and GC sequence of binding site. Although DNA intercalation is not sufficient for conferring cytotoxicity, it appears to be a necessary component of anticancer activity demonstrated by the anthracyclines.
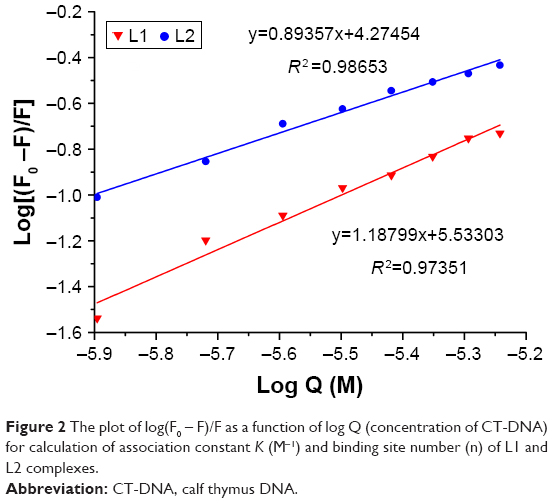 | Figure 2 The plot of log(F0 – F)/F as a function of log Q (concentration of CT-DNA) for calculation of association constant K (M−1) and binding site number (n) of L1 and L2 complexes. |
Cytotoxicity
Breast cancer is the most frequently diagnosed cancer in women worldwide. Some of anthracyclines, typically DOX, are considered to be most effective and therefore as a standard formula in cancer therapy. However, the limitations including MDR are frequently associated with the clinical use of anthracyclines. Herein, we selected a pair of human breast cancer cell lines, parental MCF-7 and DOX-resistant MCF-7/ADR, to assess the antiproliferative activity of L1 and L2. Cell viability was measured using MTT assay (Figure S1). The mean IC50 of L1 and L2 and DRI calculated by the ratio of IC50 for MCF-7/ADR cell line to IC50 for MCF-7 cell line are shown in Table 1. The weak inhibition compared to DOX may be attributed to the moderate intercalation with DNA, as suggested by the DNA binding measurement. The DRI value indicates how many times more resistant is the drug-resistant cancer cell line in comparison to its parental cell line.32 With the DRI value, the cells can be classified to three categories: drug-sensitive one with the DRI ranging from 0 to 2, moderate drug-resistant one with the DRI from 2 to 10, and high drug-resistant one with the DRI higher than 10.32,33 As expected, DOX showed an excellent in vitro proliferative inhibition in parental MCF-7, which is concentration and time dependent. The IC50 value of DOX for MCF-7/ADR is extremely large, suggesting that the antiproliferative activity of DOX is dramatically weakened in the MDR phenotype, in which the DRI value is higher than 200 and up to 770 as the incubation time is prolonged. In contrast to DOX, L1 and L2 showed high potential in overcoming the MDR in the cancer chemotherapeutics. The IC50 of L1 for MCF-7 ranges from 54.92±5.41 to 30.57±8.08 μM and 54.02±10.06 to 65.22±10.37 μM in MCF-7/ADR after 24, 48, and 72 h incubation. The data suggest that L1 showed a comparable cytotoxicity to both parental and DOX-resistant breast cancer cells, with the DRI from 0.98 to 2.13. It means L1 treated an extremely chemoresistant cancer cell line as sensitive one. For L2 treatment, no inhibition rate high than 50% was detected in the tested concentration, therefore, IC40 values after 24, 48, and 72 h incubation are calculated to compare the MDR overcoming efficiency of L2. IC40 at 24 h is 20.45±12.18 μM for the parental MCF-7 and 5.37±4.96 μM for the drug-resistant MCF-7/ADR, giving rise to a very small DRI of 0.26. The antiproliferation result indicates that both L1 and L2 strongly break the drug-resistance of cancer cell line tested, with L2 more strongly than L1, showing a high potential in overcoming the MDR.
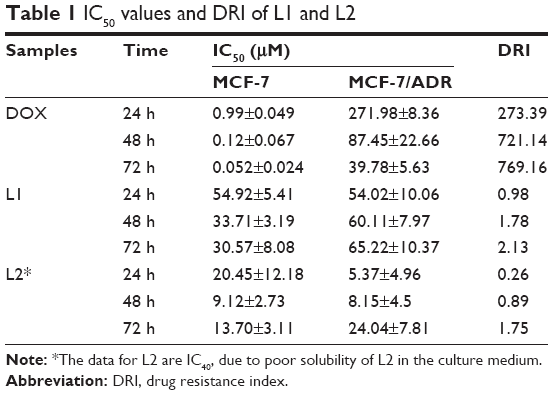 | Table 1 IC50 values and DRI of L1 and L2 |
Apoptosis
As known, a key factor in the response of cancer cells to chemotherapeutic drugs is the activation of the apoptotic pathway. Therefore, cellular apoptosis was examined to investigate whether the antiproliferative activity of L1 and L2 is associated with apoptosis. The morphological change of the nuclei is obvious, which featured in cytoplasmic condensation, nuclei shrinkage, and disintegration, indicating an early apoptosis (Figure 3). However, the mean apoptotic rate is low for both MCF-7 and MCF-7/ADR cell lines. The apoptotic rate of MCF-7 cell induced by L1 ranged from 7.0%–14.05% in the tested concentrations, compared with 3.8% in the control group (Figure 4). The mean apoptotic rate of MCF-7/ADR induced by L1 is even lower, ranged from 4.8%–6.5%, as 2.3% for the control. The apoptosis of MCF-7 and MCF-7/ADR induced by L2 is unapparent, and thus the data are not presented. Although the DNA binding experiment indicates the intercalation between L1/L2 and DNA, in the tested conditions, the degree of DNA damage may trigger cellular apoptosis but does not result in a significant apoptosis. Otherwise, the apoptotic pathway of the tested cancer cell lines might be paired, which is often encountered in chemoresistant cancer cells.34
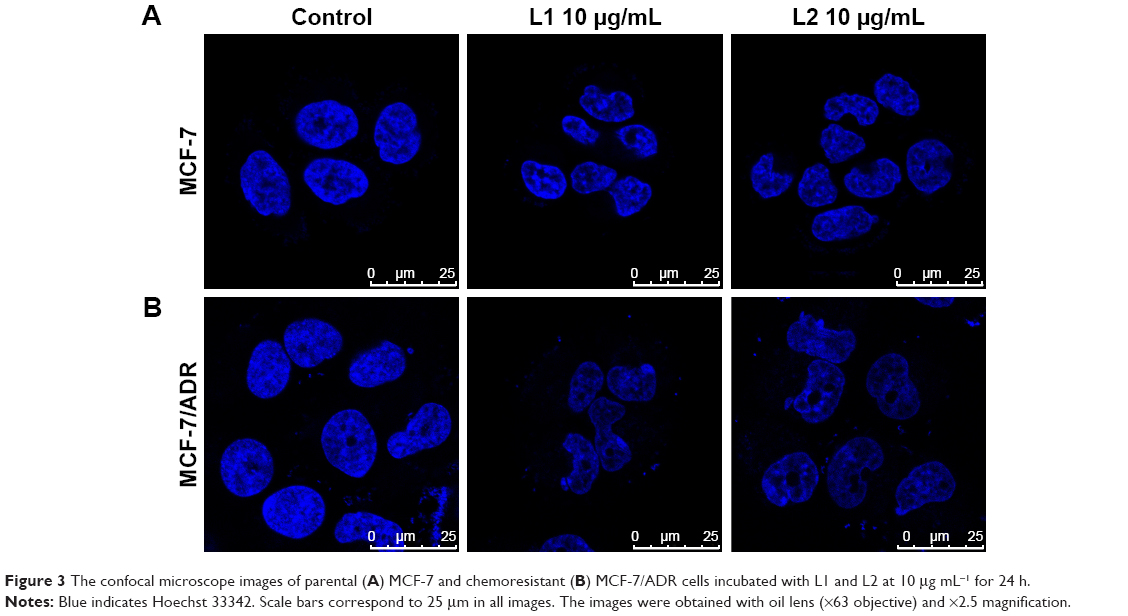 | Figure 3 The confocal microscope images of parental (A) MCF-7 and chemoresistant (B) MCF-7/ADR cells incubated with L1 and L2 at 10 μg mL−1 for 24 h. |
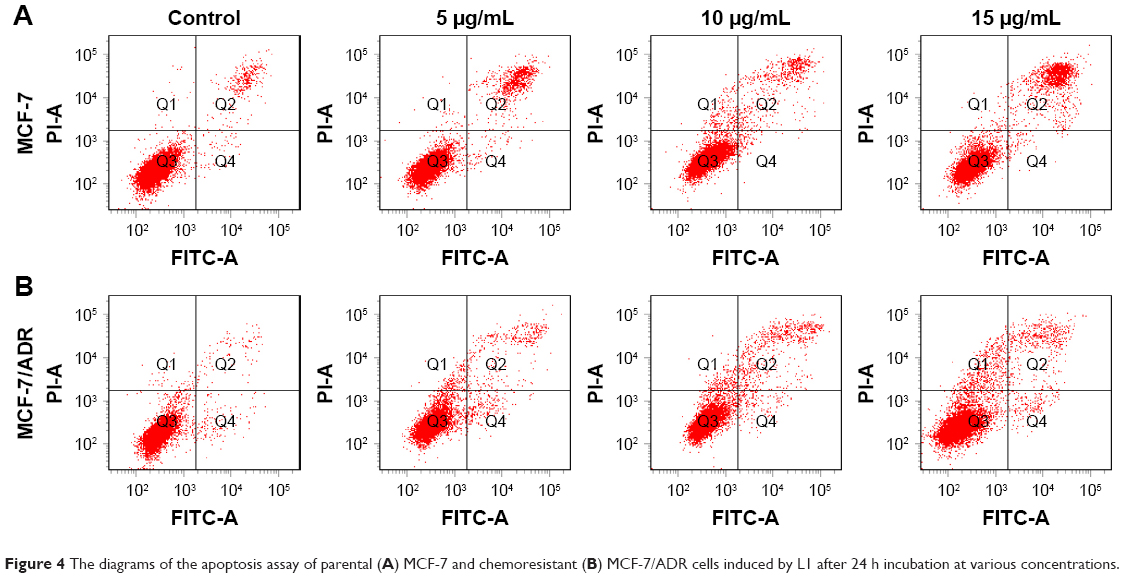 | Figure 4 The diagrams of the apoptosis assay of parental (A) MCF-7 and chemoresistant (B) MCF-7/ADR cells induced by L1 after 24 h incubation at various concentrations. |
Cell cycle distribution
Cell cycle plays a crucial role in the cell development, however, it is frequently unregulated in many cancerous diseases,35–38 because the components of the cell cycle machinery are altered. Therefore, it is an important strategy to inhibit the progression of the cell cycle for the control of cancer growth.39,40 To analyze the effect of L1 and L2 on cell cycle distribution, fluorescence activated cell sorting (FACS) was carried out with PI staining MCF-7 and MCF-7/ADR cells after treatment with L1 and L2 (Figure 5). For both MCF-7 and MCF-7/ADR, L1 at low concentration (5.0 μg mL−1) caused an increase in the percentage of cells in the G0/G1 phase, accompanied by a decrease in the percentage of cells in the S (DNA synthesis) phase. At high concentrations 10.0 and 15.0 μg mL−1, more cells entered into the G2/M phase, accompanied by a decrease in the percentage of cells in the G0/G1 phase, compared with the control group. This observation is indicative that L1 at low concentration induces cell cycle arrest at the G0/G1 phase, while at high ones it induces cell cycle arrest at the G2/M phase. The effect of L2 on the cell cycle distribution is different from that of L1. For both MCF-7 and MCF-7/ADR at concentrations of 5.0 and 10.0 μg mL−1, L2 induced an increase in the percentage of cells in the G0/G1 phase, accompanied by a decrease in the percentage of cells in the S phase. It suggests that the cell cycle arrest at G0/G1 phase occurred in both MCF-7 and MCF-7/ADR cell lines after L2 treatment. The FACS data demonstrated that L1 and L2 induced an impairment of cell cycle progression of MCF-7 and MCF-7/ADR cell lines and suppressed cell growth by perturbing progress through the G0/G1 phase, with L2 causing more profound effect on cell cycle arrest at G0/G1 phase, which might account for a smaller DRI in drug-resistant MCF-7/ADR cell line.41 The results suggest that the cytotoxicity of L1 and L2 against both parental MCF-7 and DOX-resistant MCF-7/ADR cells may be related to their intercalating interaction with DNA, as the damage to DNA normally induces cell cycle arrest or apoptosis.40
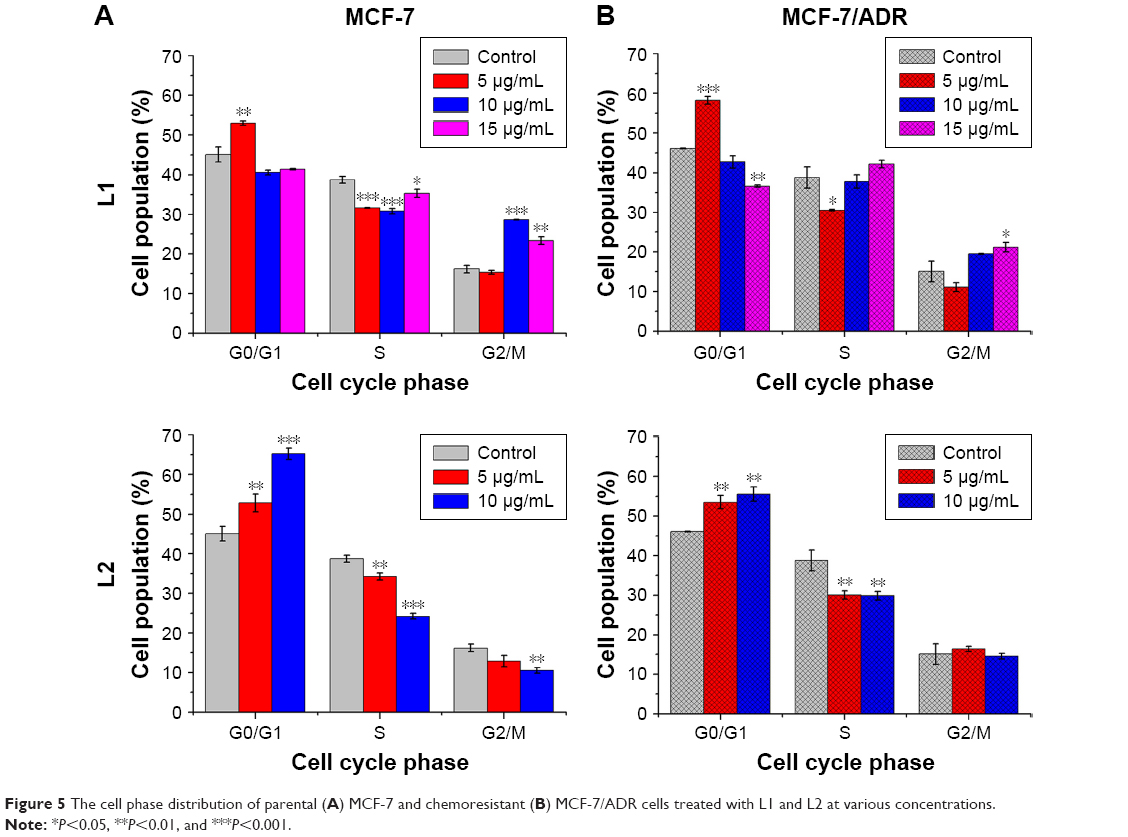 | Figure 5 The cell phase distribution of parental (A) MCF-7 and chemoresistant (B) MCF-7/ADR cells treated with L1 and L2 at various concentrations. |
Intracellular Rhodamine 123 accumulation
Although MDR has been studied for a long time, the exact mechanism remains under extensive exploration. Among many factors involved in MDR, a key MDR mechanism is efficient P-gp-mediated drug efflux, which prevents intracellular drug accumulation and suppresses therapeutic efficacy. Similar to DOX, the fluorescent Rhodamine 123 (Rh 123) is a known substrate of P-gp, which is commonly used to evaluate P-gp activity in chemoresistant cancer cells.42 The intracellular accumulation of Rh 123 was measured by monitoring the intracellular fluorescence after 48 h incubation of the chemoresistant MCF-7/ADR cell with L1/L2 (Figure 6). The MFI in the treated MCF-7/ADR and untreated MCF-7/ADR cell lines (as the control) is almost identical. The difference with P>0.05 vs the control indicated that both L1 and L2 had no statistically significant effects on intracellular Rh 123 accumulation, compared with that of the untreated MCF-7/ADR. The result suggests that the activity of P-gp was not inhibited by L1 and L2, and thus the intracellular accumulation of Rh 123 was not influenced in a P-gp overexpressing cancerous cell. On the other hand, it indicated that the recognition and interaction of L1 and L2 with P-gp might be insignificant and L1/L2 was not the suitable substrate of P-gp, which is further explored with cellular uptake and molecular docking method.
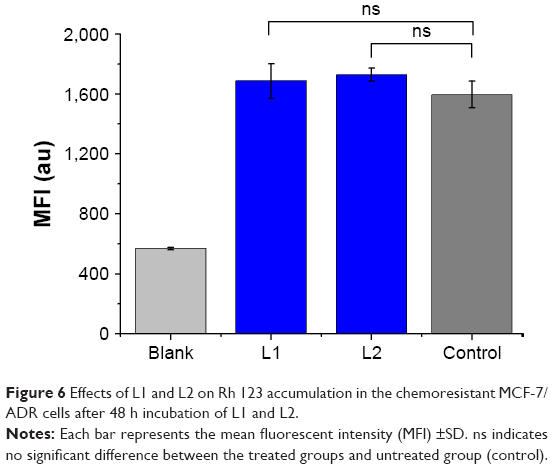 | Figure 6 Effects of L1 and L2 on Rh 123 accumulation in the chemoresistant MCF-7/ADR cells after 48 h incubation of L1 and L2. |
Cellular uptake
If the anticancer drugs can be recognized and interacted by P-gp in the P-gp overexpressing MDR cancerous cells, the efficacy of the anticancer drugs is usually suppressed, mainly due to the drug efflux by P-gp. The cellular uptake of L1/L2 by the parental MCF-7 and drug-resistant MCF-7/ADR cells, the intracellular MFI associated with the emission of anthryl in L1/L2 was measured with FACS flow cytometer. As shown in Figure 7, the MFI of L1/L2-treated groups is higher than that of the control, indicating the cellular uptake of L1/L2 after incubation. For L1-treated group, the MFI of MCF-7 and MCF-7/ADR cells is comparable, suggesting the low efficacy of L1 expelled out by P-gp. It is noted that this phenomenon is even significant in the L2-treated group, with much high MFI in the MCF-7/ADR cells, compared to that in the MCF-7 cells. It is correlated with the cytotoxicity results, which indicated L2 is more potently active in high-P-gp-expressing cell MCF-7/ADR. The cellular uptake experiment implies that L1/L2 could not be the suitable substrate of P-gp, the interaction between L1/L2 with P-gp was further explored theoretically.
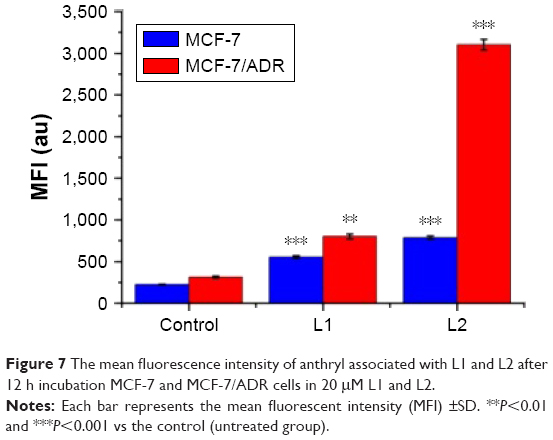 | Figure 7 The mean fluorescence intensity of anthryl associated with L1 and L2 after 12 h incubation MCF-7 and MCF-7/ADR cells in 20 μM L1 and L2. |
Molecular docking with P-gp
To reveal the interaction between L1/L2 and P-gp protein, homology modeling, molecular docking, and MD simulations were performed using mouse P-gp crystal structure (PDB entry 3G60) to compare theoretically the interactions of L1/L2 and DOX with human P-gp protein.43–48 Since no crystal structure for human P-gp is available at present, based on the crystal structure of mouse P-gp followed by MD simulations, homology modeling were conducted to predict the human P-gp structure. The predicted binding modes of human P-gp with DOX, L1, and L2 are depicted in Figure 8. The molecules are stabilized in the active site by extensive hydrophobic interactions, π-π stacking interactions, and hydrogen bond interactions. Specifically, the aromatic plane of both DOX and L1/L2 fits well in the hydrophobic pocket enclosed by the side chains of I306, Y307, Y310, F336, F728, F732, F759, F983, and M986. For DOX, the glucose ring is also involved in hydrophobic interactions with the side chains of M68, M69, F72, M949, and Y953. In addition, hydroxyl and amine groups form H-bonding interactions with Y953 and V982, respectively. While for L1 and L2, thiourea forms H-bonding interactions with S979. The small amine in L1 and ethyl in L2 render their interactions with the surrounding hydrophobic interactions weaker than that in DOX, thus lowering its potential activity toward P-gp. The results imply that L1 and L2 were both poor substrate of P-gp, compared to DOX. The weak interactions account for the low DRI measured with the MTT assay. The lower DRI value of L2 may be due to the ethyl substitution on the terminal amine N atom, which gives rise to weaker interaction between L2 and P-gp. Combined with Rh 123 accumulation data, it suggests that both L1 and L2 poorly communicated with P-gp in chemoresistant cancer cells. The results are consistent with the cellular uptake and Rh 123 accumulation experiments.
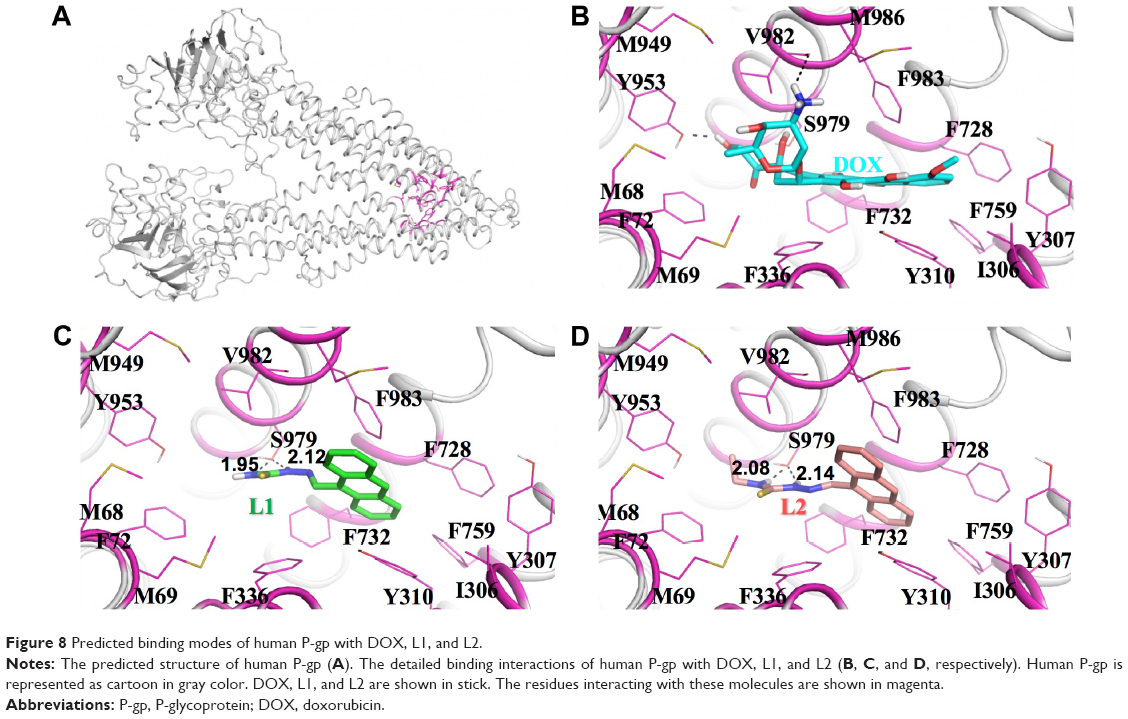 | Figure 8 Predicted binding modes of human P-gp with DOX, L1, and L2. |
Conclusion
In this work, we explored the antiproliferative property of L1 and L2 against a pair of human cancer cell lines: parental MCF-7 and DOX-resistant MCF-7/ADR. Compared with L2, L1 showed stronger inhibition to the cell growth, while L2 showed stronger potential in overcoming the MDR. Molecular biologic study revealed that L1 and L2 intercalate into the DNA. Combined with the MTT result, it is indicative that L1 and L2 have very definitive sites of DNA binding, which are rapidly saturated and no further drug can associate with the DNA. It is worth noting that both L1 and L2 strongly overcome the MDR of DOX-resistant phenotype, which is expressed by low values of DRI. No obvious apoptosis induced by L1 and L2 was measured in the present experiments. L1 and L2 changed the cycle phase distribution, with L2 inducing more profound effect. The intracellular Rhodamine 123 accumulation experiment indicates that the activity of P-gp was not inhibited by L1 and L2. The molecular modeling revealed that the binding interactions of L1 and L2 with human P-gp are weaker than that of DOX, suggesting L1 and L2 were not suitable substrate of P-gp, as indicated with the cellular uptake measurement. Overall, it implies that L1 and L2 could bypass P-gp efflux to exert anticancer activity. Compared with the clinically used first-line anticancer drug DOX, the cytotoxicity of L1 and L2 is not satisfying. Therefore, great efforts are further needed to improve the antiproliferative property and understand the mechanism of the anticancer activity of L1 and L2 against the parental MCF-7 and chemoresistant MCF-7/ADR cell lines, which should shed light in the design of effective anticancer therapeutic agents toward the MDR phenotype.
Acknowledgment
The authors thank the NSFC (21571133, 21171120, and 21403199) and Natural Science Foundation of Beijing Municipality (7132020) for financial support.
Disclosure
The author reports no conflicts of interest in this work.
References
American Cancer Society. Cancer Facts& Figures 2016. Atlanta: American Cancer Society; 2016. | ||
Harold V. The new era in cancer research. Science. 2006;312(5777):1162–1165. | ||
Wiseman M. The second World Cancer Research Fund/American Institute for Cancer Research expert report. Food, nutrition, physical activity, and the prevention of cancer: a global perspective. Proc Nutr Soc. 2008;67(3):253–256. | ||
Krohn K. Anthracycline chemistry and biology II. Mode of action, clinical aspects and new drugs. In: Krohn K, editor. Top Curr Chem. Vol. 283. Heidelberg: Springer; 2008:136. | ||
Coley HM. Mechanisms and strategies to overcome chemotherapy resistance in metastatic breast cancer. Cancer Treat Rev. 2008;34(4):378–390. | ||
William Lown J. Anthracycline and anthraquinone anticancer agents: current status and recent developments. Pharmacol Ther. 1993;60(2):185–214. | ||
Muggia FM, Green MD. New anthracycline antitumor antibiotics. Crit Rev Oncol Hematol. 1991;11(1):43–64. | ||
Fisher B, Brown AM, Dimitrov NV, et al. Two months of doxorubicin-cyclophosphamide with and without interval reinduction therapy compared with 6 months of cyclophosphamide, methotrexate, and fluorouracil in positive-node breast cancer patients with tamoxifen-nonresponsive tumors: results from the National Surgical Adjuvant Breast and Bowel Project B-15. J Clin Oncol. 1990;8(9):1483–1496. | ||
Brockman RW, Thomson JR, Bell MJ, Skipper HE. Observations on the antileukemic activity of pyridine-2-carboxaldehyde thiosemicarbazone and thiocarbohydrazone. Cancer Res. 1956;16(2):167–170. | ||
Beraldo H, Gambino D. The wide pharmacological versatility of semicarbazones, thiosemicarba-zones and their metal complexes. Mini Rev Med Chem. 2004;4(1):31–39. | ||
West DX, Liberta AE, Padhye SB, et al. ChemInform abstract: thiosemicarbazone complexes of copper(II): structural and biological studies. Coord Chem Rev. 1993;123(1–2):49–71. | ||
Deconti RC, Toftness BR, Agrawal KC, et al. Clinical and pharmacological studies with 5-hydroxy-2-formylpyridine thiosemicarbazone. Cancer Res. 1972;32(7):1455–1462. | ||
Giles FJ, Fracasso PM, Kantarjian HM, et al. Phase I and pharmacodynamic study of Triapine, a novel ribonucleotide reductase inhibitor, in patients with advanced leukemia. Leuk Res. 2003;27(12):1077–1083. | ||
Yun Y, Margolin K, Doroshow J, et al. A phase I trial of 3-aminopyridine-2-carboxaldehyde thiosemicarbazone in combination with gemcitabine for patients with advanced cancer. Cancer Chemother Pharmacol. 2004;54(4):331–342. | ||
Gergely S, Jean Philippe A, Samir L, et al. Predicting drug sensitivity and resistance: profiling ABC transporter genes in cancer cells. Cancer Cell. 2004;6(2):129–137. | ||
Ludwig JA, Gergely S, Martin SE, et al. Selective toxicity of NSC73306 in MDR1-positive cells as a new strategy to circumvent multidrug resistance in cancer. Cancer Res. 2006;66(9):4808–4815. | ||
Lerman LS. Structural considerations in the interaction of DNA and acridines. Mol Biol. 1961;3(1):18–30. | ||
Liu HK, Sadler PJ. Metal complexes as DNA intercalators. Acc Chem Res. 2011;44(5):349–359. | ||
Zuber G, Quada JC, Hecht SM. Sequence selective cleavage of a DNA octanucleotide by chlorinated bithiazoles and bleomycins. J Am Chem Soc. 1998;120(36):9368–9369. | ||
Becker HC, Nordén B. DNA binding mode and sequence specificity of piperazinylcarbonyloxyethyl derivatives of anthracene and pyrene. J Am Chem Soc. 1999;121(51):11947–11952. | ||
Duff MR, Tan WB, Bhambhani A, et al. Contributions of hydroxyethyl groups to the DNA binding affinities of anthracene probes. J Phys Chem B. 2006;110(41):20693–20701. | ||
Kumar CV, Asuncion EH. Sequence dependent energy transfer from DNA to a simple aromatic chromophore. J Chem Soc Chem Commun. 1992:6(6):470–472. | ||
Fu XF, Yue YF, Guo R, et al. An enhanced fluorescence in a tunable face-to-face π…π stacking assembly directed by the H-bonding. CrystEngComm. 2009;11(11):2268–2271. | ||
Szewczyk P, Tao H, McGrath AP, et al. Snapshots of ligand entry, malleable binding and induced helical movement in P-glycoprotein. Acta Crystallogr D Biol Crystallogr. 2015;71(3):732–741. | ||
Fiser A, Šali A. Modeller: generation and refinement of homology-based protein structure models. In: Charles Carter Jr., editor. Methods in Enzymology. Vol. 374. Cambridge, MA: Academic Press; 2003:461–491. | ||
Morris GM, Huey R, Lindstrom W, et al. AutoDock4 and AutoDockTools4: automated docking with selective receptor flexibility. J Comput Chem. 2009;30(16):2785–2791. | ||
Case DA, Betz RM, Cerutti DS, et al. AMBER 2016. San Francisco: University of California; 2016. | ||
Kochevar IE, Dunn DA. Photosensitized reactions of DNA: cleavage and addition. In: Morrison H, editor. Bioorganic Photochemistry, Photochemistry and the Nucleic Acids. Vol. 1. New York: John Wiley and Sons; 1990:273–315. | ||
Joseph J, Kuruvilla E, Achuthan AT, Ramaiah D, Schuster GB. Tuning of intercalation and electron-transfer processes between DNA and acridinium derivatives through steric effects. Bioconjug Chem. 2004;15(6):1230–1235. | ||
Li N, Ma Y, Yang C, Guo LP, Yang XR. Interaction of anticancer drug mitoxantrone with DNA analyzed by electrochemical and spectroscopic methods. Biophys Chem. 2005;116(3):199–205. | ||
Rodger A, Taylor S, Adlam G, Blagbrough IS, Haworth IS. Multiple DNA binding modes of anthracene-9-carbonyl-N1-spermine. Bioorg Med Chem. 1995;3(6):861–872. | ||
Grandi M, Geroni C, Giuliani FC. Isolation and characterization of a human colon adenocarcinoma cell line resistant to doxorubicin. Br J Cancer. 1986;54(3):515–518. | ||
Zhang X, Yashiro M, Qiu H, Nishii T, Matsuzaki T, Hirakawa K. Establishment and characterization of multidrug-resistant gastric cancer cell lines. Anticancer Res. 2010;30(3):915–921. | ||
Millan A, Huerta S. Apoptosis-inducing factor and colon cancer. J Surg Res. 2009;151(1):163–170. | ||
Jia S, Ma ZY, Li A, et al. Thiosemicarbazone Cu(II) and Zn(II) complexes as potential anticancer agents: syntheses, crystal structure, DNA cleavage, cytotoxicity and apoptosis induction activity. J Inorg Biochem. 2014;136(4):13–23. | ||
Guo WJ, Ye SS, Cao N, Huang J, Gao J, Chen QY. ROS-mediated autophagy was involved in cancer cell death induced by novel copper(II) complex. Exp Toxicol Pathol. 2010;62(5):577–582. | ||
Paul A, Gupta RK, Dubey M, et al. Potential apoptosis inducing agents based on a new benzimidazole schiff base ligand and its dicopper(ii) complex. RSC Adv. 2014;4(78):41228–41236. | ||
Walworth NC. Cell-cycle checkpoint kinases: checking in on the cell cycle. Curr Opin Cell Biol. 2000;12(6):697–704. | ||
Qiu PJ, Guan HS, Dong P, et al. The p53-, Bax- and p21-dependent inhibition of colon cancer cell growth by 5-hydroxy polymethoxyflavones. Mol Nutr Food Res. 2011;55(4):613–622. | ||
Shapiro GI, Harper JW. Anticancer drug targets: cell cycle and checkpoint control. J Clin Invest. 1999;104(12):1645–1653. | ||
Hsieh TC, Juan G, Darzynkiewicz Z, Wu JM. Resveratrol increases nitric oxide synthase, induces accumulation of p53 and p21(WAF1/CIP1), and suppresses cultured bovine pulmonary artery endothelial cell proliferation by perturbing progression through S and G2. Cancer Res. 1999;59(11):2596–2601. | ||
Lee JS, Paull K, Alvarez M, et al. Rhodamine efflux patterns predict P-glycoprotein substrates in the National Cancer Institute drug screen. Mol Pharmacol. 1994;46(4):627–638. | ||
Jbeen I, Wetwitayaklung P, Klepsch F, Parveen Z, Chibac P, Ecker GF. Probing the stereoselectivity of P-glycoprotein – synthesis, biological activity and ligand docking studies of a set of enantiopure benzopyrano[3,4-b][1,4]oxazines. Chem Commun. 2011;47:2586–2588. | ||
Dolghih E, Bryant C, Renslo AR, Jacobson MP. Predicting binding to P-glycoprotein by flexible receptor docking. PLoS Comput Biol. 2011;7(6):e1002083. | ||
Bikadi Z, Hazai I, Malik D, et al. Predicting P-glycoprotein-mediated drug transport based on support vector machine and three-dimensional crystal structure of P-glycoprotein. PLoS One. 2011;6(10):e25815. | ||
Yan Q, Yang QH, Song CJ, Chang JB. Computational insights into the origin of decrease/increase in potency of N-CDPCB analogues toward FTO. J Biomol Struct Dyn. 2017;35(8):1758–1765. | ||
Li DM, Huang XQ, Han KL, Zhan CG. Catalytic mechanism of cytochrome P450 for 5′-hydroxylation of nicotine: fundamental reaction pathways and stereoselectivity. J Am Chem Soc. 2011;133(19):7416–7427. | ||
Wei D, Lei B, Tang M, Zhan CG. Fundamental reaction pathway and free energy profile for inhibition of proteasome by epoxomicin. J Am Chem Soc. 2012;134(25):10436–10450. |
Supplementary materials
Characterization of L1 and L2
L1: 1H NMR (DMSO-d6) δ =7.58 (m, 2H, anthryl), 7.63 (m, 2H, anthryl), 7.747 (s, 1H, NH2), 8.152 (d, 2H, anthryl), 8.352 (s, 1H, NH2), 8.57 (d, 2H, anthryl), 8.717 (s, 1H, CH=N), 9.328 (s, 1H, anthryl), 11.668 (s, 1H, NH).
ESI MS, m/z ([M+H]+): 279.74.
L2: 1H NMR (DMSO-d6) δ =2.502 (t, 3H, CH3), 3.595 (m, 2H, CH2), 7.615 (m, 4H, anthryl), 8.154 (d, 2H, anthryl), 8.386 (t, 1H, NH-C), 8.491 (d, 2H, anthryl), 8.711 (s, 1H, CH=N), 9.274 (s, 1H, anthryl), 11.675 (s, 1H, NH).
ESI MS, m/z ([M+H]+): 307.62.
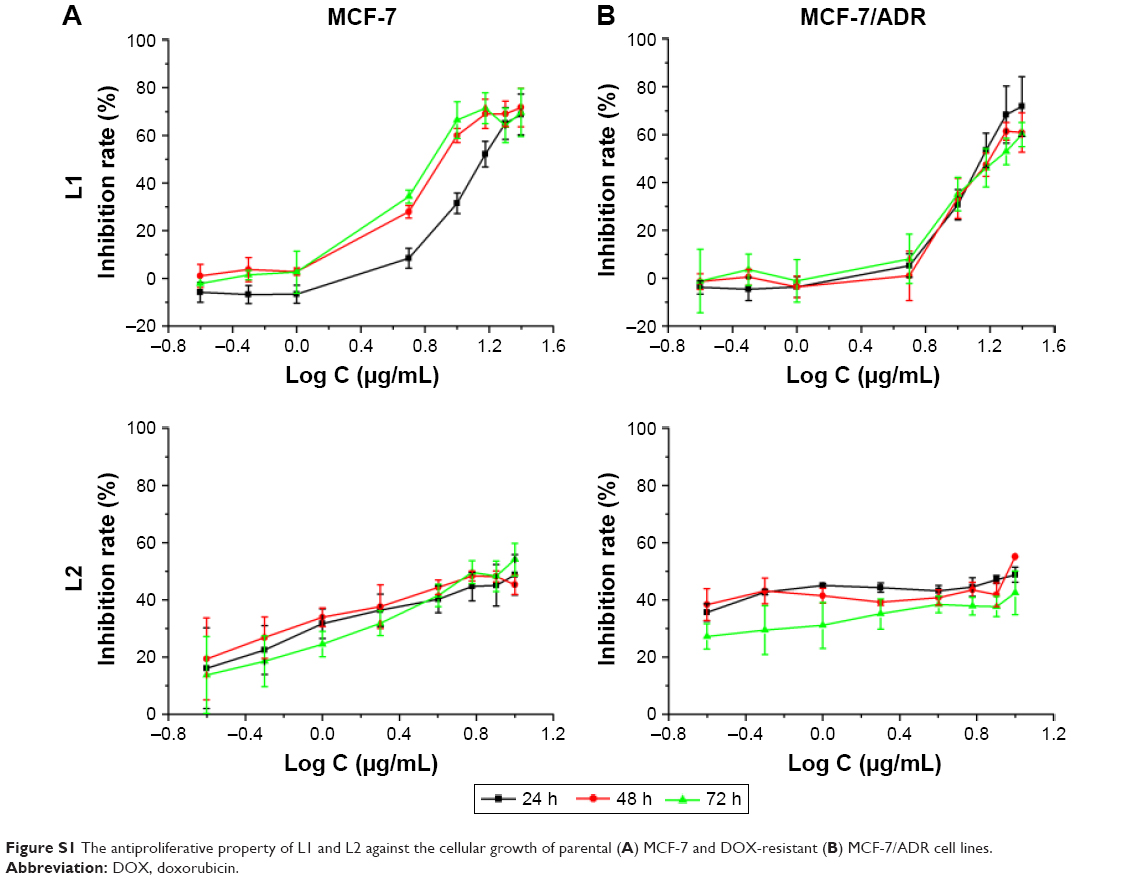 | Figure S1 The antiproliferative property of L1 and L2 against the cellular growth of parental (A) MCF-7 and DOX-resistant (B) MCF-7/ADR cell lines. |
 © 2017 The Author(s). This work is published and licensed by Dove Medical Press Limited. The full terms of this license are available at https://www.dovepress.com/terms.php and incorporate the Creative Commons Attribution - Non Commercial (unported, v3.0) License.
By accessing the work you hereby accept the Terms. Non-commercial uses of the work are permitted without any further permission from Dove Medical Press Limited, provided the work is properly attributed. For permission for commercial use of this work, please see paragraphs 4.2 and 5 of our Terms.
© 2017 The Author(s). This work is published and licensed by Dove Medical Press Limited. The full terms of this license are available at https://www.dovepress.com/terms.php and incorporate the Creative Commons Attribution - Non Commercial (unported, v3.0) License.
By accessing the work you hereby accept the Terms. Non-commercial uses of the work are permitted without any further permission from Dove Medical Press Limited, provided the work is properly attributed. For permission for commercial use of this work, please see paragraphs 4.2 and 5 of our Terms.