")
Back to Journals » International Journal of Nanomedicine » Volume 17
RNA-Seq Explores the Mechanism of Oxygen-Boosted Sonodynamic Therapy Based on All-in-One Nanobubbles to Enhance Ferroptosis for the Treatment of HCC
Authors Chen Y, Shang H, Wang C , Zeng J, Zhang S, Wu B, Cheng W
Received 13 October 2021
Accepted for publication 22 December 2021
Published 7 January 2022 Volume 2022:17 Pages 105—123
DOI https://doi.org/10.2147/IJN.S343361
Checked for plagiarism Yes
Review by Single anonymous peer review
Peer reviewer comments 4
Editor who approved publication: Dr Yan Shen
Yichi Chen,1 Haitao Shang,1 Chunyue Wang,1 Jiaqi Zeng,2 Shentao Zhang,1 Bolin Wu,1,3 Wen Cheng1,3
1Department of Ultrasound, Harbin Medical University Cancer Hospital, Harbin, People’s Republic of China; 2School of Life Science and Technology, Computational Biology Research Center, Harbin Institute of Technology, Harbin, People’s Republic of China; 3Department of Interventional Ultrasound, Harbin Medical University Cancer Hospital, Harbin, People’s Republic of China
Correspondence: Wen Cheng; Bolin Wu
Department of Ultrasound, Harbin Medical University Cancer Hospital, No. 150, Haping Road, Nangang District, Harbin, Heilongjiang Province, 150081, People’s Republic of China
Tel +86 13313677182
; +86 15663615088
Fax +86 451 85718392
; +86 451 86298651
Email [email protected]; [email protected]
Background: The combination of sonodynamic therapy and oxygenation strategy is widely used in cancer treatment. However, due to the complexity, heterogeneity and irreversible hypoxic environment produced by hepatocellular carcinoma (HCC) tissues, oxygen-enhancing sonodynamic therapy (SDT) has failed to achieve the desired results. With the emergence of ferroptosis with reactive oxygen species (ROS) cytotoxicity, this novel cell death method has attracted widespread attention.
Methods: In this study, nanobubbles (NBs) were connected with the sonosensitizer Indocyanine green (ICG) to construct a 2-in-1 nanoplatform loaded with RAS-selective lethal (RSL3, ferroptosis promoter) (RSL3@O2-ICG NBs), combined with oxygen-enhanced SDT and potent ferroptosis. In addition, nanobubbles (NBs) combined with low-frequency ultrasound (LFUS) are called ultrasound-targeted nanobubble destruction (UTND) to ensure specific drug release and improve safety.
Results: MDA/GSH and other related experimental results show that RSL3@O2-ICG NBs can enhance SDT and ferroptosis. Through RNA sequencing (RNA-seq), the differential expression of LncRNA and mRNA before and after synergistic treatment was identified, and then GO and KEGG pathways were used to enrich and analyze target genes and pathways related ferroptosis sensitivity. We found that they were significantly enriched in the ferroptosis-related pathway MAPK cascade and cell proliferation. Then, we searched for the expression of differentially expressed genes in the TCGA Hepatocellular carcinoma cohort. At the same time, we evaluated the proportion of immune cell infiltration and the identification of co-expression network modules and related prognostic analysis. We found that it was significantly related to the tumor microenvironment of hepatocellular carcinoma. The prognostic risk genes “SLC37A2” and “ITGB7” may represent new hepatocellular carcinoma ferroptosis-inducing markers and have guiding significance for treating hepatocellular carcinoma.
Conclusion: The therapeutic effect of the in vitro synergistic treatment has been proven to be significant, revealing the prospect of 2-in-1 nanobubbles combined with SDT and ferroptosis in treating HCC.
Keywords: ferroptosis, sonodynamic therapy, HCC, RSL3, synergistic therapy
Graphical Abstract:

Introduction
Hepatocellular carcinoma, as the fourth cancer incidence, has been the fastest-rising cause of cancer-related deaths worldwide.1 There are approximately 840,000 new cases of HCC each year, and at least 780,000 people die from HCC.2 The main treatment for liver cancer is surgical resection, liver transplantation, local radiotherapy and chemotherapy.3 However, due to the invisibility of the onset of HCC and the lack of specific early markers, most patients are usually diagnosed as advanced HCC,4 the above treatment methods cannot get a thorough treatment, and sorafenib has been the mainstream targeted therapy for advanced HCC.
However, drug resistance gradually develops in the later stages of treatment.5,6 According to reports, sorafenib is mainly causing cell ferroptosis to achieve antitumor, and the role of apoptosis in sorafenib resistance in HCC has been demonstrated.7 Induce ferroptosis and increase the sensitivity of ferroptosis, avoid apoptosis, effectively improve the treatment of hepatocellular carcinoma, and reduce the occurrence of drug resistance.8 Many nanomedicines have been invented for HCC and rodent hepatoma model treatment.9–11 In addition, some nanocapsules could also promote chemotherapy and induce an immune response, which synergistically performed antitumor efficacy.12–14
Ferroptosis was first proposed as a novel type of cell death in 2012.15,16 Unlike other apoptotic and non-apoptotic death forms, iron and lipid peroxides are the two main features of ferroptosis. The redox balance in normal cells mainly depends on glutathione peroxidase 4 (GPX4), a repair enzyme for cell lipid oxidation. Therefore, directly or indirectly inhibiting the activity of GPX4, leading to the accumulation of LPO, can lead to subsequent ferroptosis.17 RSL3, an enzyme inhibitor of GPX4, a small molecule that causes ferroptosis, was selectively lethal to oncogenic RAS mutant cell lines. The RAS family of small GTPases (HRAS, NRAS, and KRAS) are commonly mutated in HCC. Finding compounds that are selectively lethal to RAS mutant tumor cells is also a high priority.
SDT has attracted much attention as a non-invasive way to treat tumors.18–20 SDT with LFUS can avoid photodynamic therapy (PDT) limitations with low tissue penetration depth.21 PDT could generate immunogenic cell death (ICD), accompanied by the release of high-mobility group box 1 protein (HMGB1) and adenosine triphosphate (ATP) and the exposure of calreticulin (CRT), sending the “eat me” signal and promoting the antigen presentation and maturation of dendritic cells (DCs).22–24 Also, Photothermal therapy (PTT) is a developing field that uses the strategy of employing near-infrared (NIR) irradiation to trigger drug delivery.25 These emerging non-invasive techniques have been widely used in antitumor research.26,27 However, due to the intrinsic or obtained resistance of cancer cells on apoptosis, the effectiveness of SDT in tumor-induced induction is limited. Therefore, the other non-apoptotic cell death model has opened new treatment pathways for eliminating cancer cells and reducing the resistance brought about apoptosis. ICG, A near-infrared fluorescent dye to diagnose and treat hepatocellular carcinoma, which is widely used in liver surgery and fluorescence imaging system.28–31 Much research shows that ICG can produce a large amount of ROS after being triggered by LFUS, which is a superior sonosensitizer.32–36 At the same time, ICG has high HCC specificity. However, the further application of ICG is limited for several reasons, such as its tendency to aggregate, non-specific binding to proteins, and rapid clearance from the body.37,38 Based on this, scientists continue to explore various carrier materials to overcome these limitations and maintain the stable optical performance of ICG.39,40
Nanobubbles have been widely used as vehicles with LFUS called UTND compared to other nanocarriers. The NBs could be used as cavitation nuclei, which may expand, compress and destroy under ultrasound stimulation.41 In cavitation, destruction generates microjets that create shear stress on cells and leads to reversible pore formation in the cell membranes, which could enhance cell membrane permeability transiently without deterring the cell viability and promote the drug into cells.42 Several studies have shown that lipid chitosan core NBs can successfully reverse tumor hypoxia by down-regulating the expression of HIF-1α.42,43 Thus, NBs are a good candidate for research.
Next-generation high-throughput RNA sequencing (RNA-Seq) is the first sequencing-based technology to perform high-throughput and quantitative measurements of the entire transcriptome. RNA-Seq is a more accurate method of presenting transcript and isotype levels than any other sequencing technology. In order to further explore the mechanism of combination therapy to increase the sensitivity of ferroptosis and find related gene changes, combining RNA-Seq technology in our experiments can obtain new insights into tumor treatment mechanisms.
Herein, RSL3@O2-ICG NBs, which have the ability to oxygen-boosted SDT and increase sensitization ferroptosis, was used in the combined treatment of HCC. Then RNA-Seq further explores its mechanism and finds related gene changes, which provide a promising strategy and therapeutic target for HCC therapy.
Materials and Methods
Chemicals
1,2-Distearoyl-sn-glycerol-3-phosphocholine (DSPC); 1,2-stearoyl-sn-glycerol-3-phosphoethanolamine-N-(methoxy [polyethylene glycol]-2000) (DSPE-PEG-2000) were got from Avanti Polar Lipids (Alabaster, AL). 20,70-Dichlorofluorescin diacetate (DCFH-DA), MDA and GSH were acquired from Beyotime Biotechnology (Shanghai, China). ICG was received from Shanghai Yuanye Bio-Technology Co, Ltd (Shanghai, China). Annexin V-FITC Apoptosis Detection Kit and Cell counter kit-8 (CCK-8) were obtained from BD Pharmingen. RSL3 was gained from Shanghai MCE Chemicals Technology (Shanghai, China).
Preparation of RSL3@O2-ICG NBs
As reported in previous studies, we have prepared RSL3@O2-ICG NBs using the thin-film hydration ultrasound method.44 First, mix DSPC and DSPE-PEG-2000 at a mass ratio of 9:1, and then add 10ul of 5 mM RSL3 in methylene chloride and methanol (2:1, vol/vol). After entirely dissolving and mixing, transfer the above solution to a beaker and evaporate to form a lipid film. The dried film was hydrated into a lipid suspension with 5mL of 100ug/mL ICG in PBS. Next, the suspension was extruded 20 times through a 200nm membrane through a micro-extruder (Avanti Polar Lipids, Alabaster, AL). Then, the squeezed suspension was transferred to a sealed vial, and the syringe was evacuated and replaced with pure oxygen. The mixture was then mechanically shaken in a dental mixer (YJT Medical Apparatus and Instruments, Shanghai, China) for 60 seconds and resuspended in 2 mL of PBS solution for storage at 4°C. All processes are carried out in a dark environment. The blank nanobubbles (without RSL3 or ICG) were prepared using the same method. The stability of the RSL3@O2-ICG NBs and blank nanobubbles was evaluated by a hemocytometer at different time points, such as 6 h, 12h, 24h, and 48h after preparation at 4°C.
Characterization
Observe the distribution and morphology of RSL3@O2-ICG NBs under a scanning electron microscope (SEM. Hitachi, Japan), and observe the element enrichment. At the same time, the encapsulation rate of ICG and RSL3 on the composite is calculated by the proportion of elements. Dynamic light scattering (DLS) analyzer (ZEN3600, Malvern Instruments) can analyze its particle size distribution and zeta potential. An ultraviolet-visible spectrophotometer (Thermo Fisher) was used to obtain the absorption spectrum of the particles.
Cell Culture
HepG2 and Huh7 derived from the human hepatocellular carcinoma cell line, and WRL68 cells, a normal human liver cell line, were included in this experiment. All the cells were purchased from the Cell Bank of Chinese Academy ofSciences (Shanghai, China). All cells were cultured in DMEM medium containing 10% FBS in a humidified incubator at 37°C and 5% CO2.
Cell Viability of Cells
WRL68, HepG2 and Huh7 cells were seeded into 96-well plates at a density of 8000 cells per well. After the application of different ICG concentrations (40, 80, 100, 150, 200, 250, 300μg/mL), they were exposed to LFUS for 30 seconds (1.0 W/cm2) and then assessed by CCK8 assay to kill the cells. Then, different RSL3 concentrations (4, 6, 8, 10, 12, 15, 20 μM) and specific concentrations of ICG under the same experimental environment.
ROS Detection
In order to study the ability of O2-ICG-NB to enhance SDT, RSL3 was not carried in the nanobubbles in this experiment. HepG2 and Huh7 cells were, respectively, seeded in 6-well plates, cultured overnight to remove the medium, and the cells were treated with PBS, ICG, ICG-NBs, and O2-ICG-NBs for another 4 hours. Subsequently, DCFH-DA was added to the cells and incubated at 37°C for 30 minutes, protected from light. After removing the medium, the cells were irradiated with ultrasound for 30 seconds (1.0 W/cm2) and washed twice with DMEM, then 1mL of ice PBS was added, and the cells were quickly observed under a fluorescence microscope. Flow cytometry is performed by digesting cells from a 6-well plate, and the operation is processed as before.
Analysis of GSH
After various treatments (PBS, RSL3, O2-ICG-NBs+LFUS, RSL3@O2-ICG NBs + LFUS, RSL3@O2-ICG NBs+LFUS+Fer-1), the cells were washed 3 times with PBS and trypsinized. Collect the cells and centrifuge at 1000 rpm at 4°C for 5 min twice. According to the weight of the cell pellet, resuspend each milligram in 3 μL of protein removal solution M. After vortexing, place it in liquid nitrogen and in a 37 °C water bath for two quick freezing and thawing times, and then place it at 4 °C. Centrifuge for 10 minutes at 10,000 rpm for 5 minutes. The supernatant is used to determine the content of GSH in the sample. Prepare the appropriate amount of detection working solution and supernatant sample according to the instructions, mix them and incubate at room temperature for 5 minutes, and then add NADPH to the system to trigger the reaction. After 60 minutes, measure the TNB absorbance at 412 nm and calculate the GSH level according to the instructions.
MDA Assay
Collect the protein in HepG2 and Huh7 through various treatments (PBS, RSL3, O2-ICG-NBs+LFUS, RSL3@O2-ICGNBs+LFUS, RSL3@O2-ICG NBs+LFUS+Fer-1), and after lysis 40min After centrifugation, the supernatant was mixed with the TBA detection working solution, heated in a boiling water bath for 15 minutes, cooled to room temperature, 200μL was transferred to a 96-well plate, the absorbance was measured at 532nm, compare the standard curve to calculate the MDA content.
Measurement of Mitochondrial Membrane Potential
Mitochondrial membrane potential was detected by JC-1 (Beyotime, C2005) detection kit. After treatment in the 4 treatment groups (PBS, RSL3, O2-ICG-NBs+LFUS, RSL3@O2-ICG NBs + LFUS), HepG2 and Huh7 cells were incubated with JC-1 staining working solution for 20 minutes, and then JC-1 Wash twice with buffer solution. After adding ice PBS solution, the stained cells were observed under a fluorescence microscope.
Cell Cycle Analysis
After various treatments (PBS, RSL3, O2-ICG-NBs+LFUS, RSL3@O2-ICG NBs + LFUS), HepG2 and Huh7 cells were digested and collected with trypsin, and then fixed with 70% ice-cold ethanol at 4°C overnight. Subsequently, add 500μL of the prepared staining working solution (keygentec. Nanjing, China) for staining. The DNA content of each group of cells was determined by flow cytometry.
Whole Transcriptome Library Construction, Sequencing, and Analysis
The total RNA of HepG2/Huh7 cells before and after RSL3@O2-ICG NBs + LFUS treatment was taken, respectively, named A, B, C, D group, and quality control was performed. The preparation and deep sequencing of the whole transcriptome library were performed by Novogene Bioinformatics (Beijing, China).
Whole Transcriptome Library Construction and Sequencing
A total amount of 3 μg RNA per sample was used as input material for the RNA sample preparations. According to the manufacturer’s instructions, the clustering of the index-coded samples was performed on a cBot Cluster Generation System using TruSeq PE Cluster Kit v3-cBot-HS (Illumia). After cluster generation, the libraries were sequenced on an Illumina HiSeq 2500 platform, and 125 bp paired-end reads were generated. The data discussed in this publication have been deposited in NCBI’s Gene Expression Omnibus and are accessible through GEO Series accession number GSE178573 (https://www.ncbi.nlm.nih.gov/geo/query/acc.cgi?acc=GSE178573).
RNA-Seq Data Analysis
Quality Control and Comparative Analysis
The generation of sequencing data goes through multiple steps such as RNA extraction, library construction, and sequencing. These steps will produce some low-quality or invalid data. For example, there will be a deviation in the length of the library during the library construction stage, and a sequencing error will occur during the sequencing stage. Therefore, it is necessary to perform quality control on the raw data obtained from the machine to ensure the accuracy of subsequent analysis. The raw data obtained by sequencing contains a small number of reads with sequencing adapters or low sequencing quality. In order to ensure the quality and reliability of data analysis, it is necessary to filter the original data. The filtering content is as follows: (1) Remove the adapter (2) Remove the reads with N (N means that the base information cannot be determined) greater than 0.002; (3) When the number of low-quality bases contained in a single-ended read exceeds read When the length is 50%, you need to remove the paired reading. After raw data filtering, sequencing error rate check, and GC content distribution check, clean reads for subsequent analysis are obtained. Use Hisat2 to compare the valuable sequencing data (clean reads) to the reference genome.
Quantitative Expression Level of Transcripts
Stringtie software can accurately and accurately splice genes and realize gene quantification. Therefore, we use Stringtie software to assemble the reads into genes and quantify gene expression based on the results of the alignment to the genome.
In this article, the gene expression level of RNA-seq uses FPKM (Fragments Per Kilobase of transcript sequence per Millions of base pairs sequenced) calculation. FPKM is the number of fragments from a gene/transcript per kilobase length per million fragments. It also corrects the influence of sequencing depth and gene length on the count of fragments. It is currently the most commonly used method for estimating gene expression levels.
Differential Expression Analysis
After the quantitative analysis is completed, the gene expression matrix of all samples is obtained, and the expression level of the gene level can be analyzed for the significance of the difference to find the functional genes related to the treatment group. In this work, we use edgeR software to analyze the significance of gene expression differences. Use p-value or corrected p-value (padj) to determine the significance level. Padj is the value obtained by using the BH method to perform multiple test corrections on the p-value when the false positive rate is high. The smaller the corrected P-value value is, the more significant it is. Use padj<0.05 as the difference significance criterion (if padj is<0.05 to screen for too few differences, use p-value<0.05 for differential screening, and finally get a list of genes with significant differences for subsequent analysis.
GO and KEGG Enrichment Analysis
In organisms, different genes coordinate with each other to perform their biological functions. By exploring the pathways that are significantly enriched in functional genes, we will further explore the important functional genes involved in important biochemical metabolic pathways and signal transduction pathways among differentially expressed genes. This article uses GOseq software for GO enrichment analysis; KOBAS (2.0) for pathway enrichment analysis. GO is a comprehensive database describing gene functions, divided into molecular function, biological process, and cellular component. GO enrichment takes padj<0.05 (default) or p-value<0.05 as significant enrichment. In organisms, different genes coordinate with each other to perform their biological functions, and the most important biochemical metabolic pathways and signal transduction pathways involved in candidate target genes can be determined through Pathway significant enrichment. KEGG (Kyoto Encyclopedia of Genes and Genomes) is a comprehensive database that integrates genome, chemistry and system function information. Pathway significant enrichment analysis takes KEGG Pathway as the unit and applies a hypergeometric test to find pathways that are significantly enriched in candidate target genes compared with the background of the entire genome. Similarly, KEGG pathway enrichment takes p-value or padj<0.05 as significant enrichment.
Expression and Immune Infiltration in TCGA
In order to further explore whether the genomic changes caused by RSL3@O2-ICG NBs + LFUS treatment will affect the immunity of hepatocellular carcinoma, we obtained the RNA-seq data of hepatocellular carcinoma from the TCGA database (https://portal.gdc.cancer.gov/). Including gene expression information from 373 samples of hepatocellular carcinoma patients, we find some of the differential genes that overlap with this research, and use overlapping differentially expressed genes to perform heat map cluster analysis on TCGA hepatocellular carcinoma patients. At the same time, we used Xcell database (https://xcell.ucsf.edu/) to evaluate the proportion of immune cell infiltration of all liver cancer samples from TCGA. Explore the difference in the proportion of immune cell infiltration between different clusters.
Prognostic Analysis of TCGA Cohort
In order to further confirm that the genomic changes caused by RSL3@O2-ICG NBs + LFUS treatment can regulate the tumor microenvironment and further affect the survival status of hepatocellular carcinoma, we used the tumor microenvironment score obtained from the Xcell database in the previous step. We used the Pearson method to screen out the results. Among the differentially expressed genes, the genes whose correlation with the tumor microenvironment score is more significant than 0.4 and the significance P-value is less than 0.05 will be analyzed later. 373 TCGA hepatocellular carcinoma patients were randomly divided into training set and test set according to the ratio of 7:3, and single-factor cox risk regression and multi-factor risk regression were used to screen the prognostic risk genes that were significantly related to the prognosis (p<0.05). Calculate each sample’s ferroptosis risk score by multiplying the risk gene’s expression value by the sum of the risk coefficient of the risk regression and using the median value of the risk score to divide hepatocellular carcinoma samples into high-risk and low-risk groups. Use Log rank test to explore the prognostic difference between high- and low-risk groups.
Statistical Analysis
All experiments were conducted in triplicate. The biological data are calculated as an average of three replicates ± standard deviation and presented in percentages. All sample values were related to the control (untreated cells) value, which was considered 100% and compared using Student’s t-test by GraphPad Prism 8.0 software. The differences between control and samples values were considered to be significant if P<0.05, highly significant if P<0.01 and extremely significant if P<0.001.
Results
Preparation and characterization of RSL3@O2-ICG NBs
It can be seen from Figure 1A, the RSL3@O2-ICG NBs had a green suspension. At the same time, the electron microscopy energy spectrum measurement was observed that the representative Chlorine element of RSL3 and Sodium Sulfur elements of ICG were enriched on nanobubbles (Figure 1B–F). According to the proportion of Chlorine and Sulfur elements in the complex, it is inferred that the loading efficiency of RSL3 and ICG in the complex are, respectively, 27.73±0.38% and 1.80±0.37%. The mean diameter of RSL3@O2-ICG NBs measured by DLS was 280.8 ± 16.8 nm (Figure 1G). At the same time, the zeta potential of the complex is –3.86 ± 0.35 mV (Table S1). As shown in Figure 1H, the composite has absorption peaks at about 770nm and 240nm, indicating that ICG and RSL3 are successfully loaded into RSL3@O2-ICG NBs, which is consistent with the previous SEM imaging results.
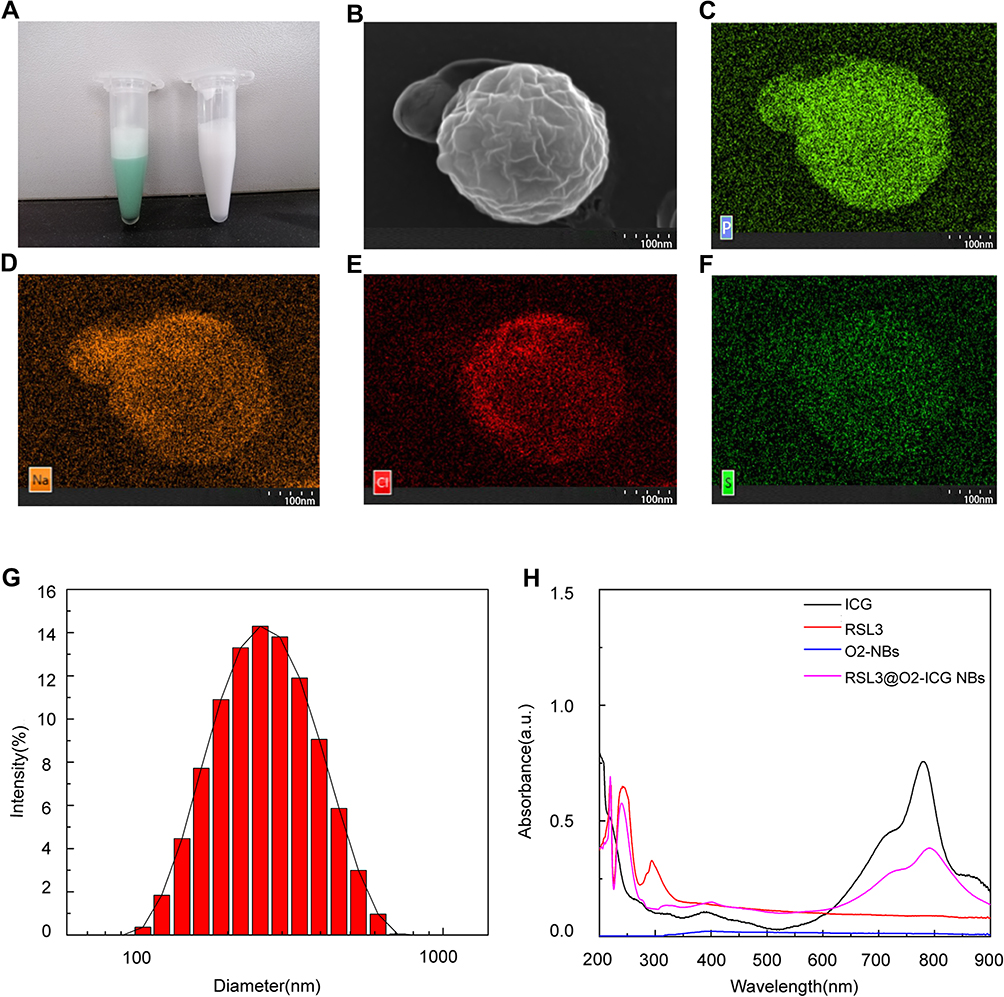 |
Figure 1 Structure and characterization of composite RSL3@O2-ICG NBs. (A) General morphology of General morphology of microbubbles; (B) Scanning Electron Microscopy image showing a quasi-spherical morphology; (C–F) Enrichment degree of different elements on RSL3@O2-ICG NBs; (G) The DLS results showed a mean particle size of to be with a polydispersity value; (H) The absorption spectrum of RSL3, ICG, O2-NBs and RSL3@O2-ICG NBs. |
The stability of RSL3@O2-ICG NBs and blank nanobubbles is expressed in concentration. The RSL3@O2-ICG NBs and blank nanobubbles concentration is diluted to 4 × 10⁸/mL. The concentrations of different times were shown in Figure S1A. Brown–Forsythe test shown the P value of RSL3@O2-ICG NBs was 0.5060 and the P value of blank nanobubbles was 0.7860, which demonstrated no statistical significance in concentration changes within 48 hours, respectively.
Detection of Intracellular ROS of SDT
CCK8 experiment verified the cell viability of different concentrations of ICG on WRL68, HepG2 and Huh7 cells in Supplementary Figure S1B–D. We choose 100ug/mL of ICG used for the next experiment. Besides, the CCK-8 assay showed that RSL3@O2-ICG NBs + LFUS could cause damage to normal hepatocytes, when the concentration of RSL3 was 8uM (Figure S1E). The fluorescence microscope shows that HepG2/Huh7 cells presented the most amount of green fluorescence in the O2-ICG-NBs+LFUS group (Figure 2A). Flow cytometry also showed that the number of fluorescence intensities in the O2-ICG-NBs+LFUS group was much higher. Therefore, the role of O2-ICG-NBs in enhancing SDT has been proven (Figures 2B and S1F, G).
 |
Figure 2 Analysis of ROS. (A) Fluorescence microscope images of intracellular ROS generation as indicated by DCFH-DA detection after receiving different treatments as indicated. (B) Flow cytometry analyses of intracellular ROS generation in the same experiment as above. |
The Enhancement Effect of Ferroptosis
First of all, CCK8 experiment found that different concentrations of RSL3 combined with SDT, the HepG2/Huh7 cells viability decreased significantly compared to RSL3 treatment alone (Figure S2A and B). Mitochondrial damage is a significant feature of ferroptosis. We found that in the combined treatment group RSL3@O2-ICG NBs + LFUS, the red fluorescence decreased significantly, while the green fluorescence increased, indicating the decrease in mitochondrial membrane potential and damage (Figure 3A). Then, we conducted GSH and MDA experiments. GSH level is usually used to evaluate the intensity of ferroptosis.45,46 As seen from Figure 3C and Figure 3E, the GSH level of the combination treatment group was significantly reduced (P < 0.001, one-way ANOVA). In order to prove that the GSH level reduction in the combination treatment group was mainly caused by ferroptosis, Fer-1, a ferroptosis inhibitor, the drugs were added to our combined treatment group, and it was found that GSH did not decrease. At the same time, MDA is an advanced fat oxidation end product. The results in Figure 3B and Figure 3D show that the expression level increases throughout the process (P < 0.001, one-way ANOVA), and there is a negative correlation between GSH.
 |
Figure 3 Analysis of Mitochondrial membrane potential (MMP) and the function of RSL3@O2-ICG NBs in ferroptosis. (A) Fluorescence microscope images of the JC-1 monomer (green channel), and aggregate (red channel) in the mitochondria of HCC cells after differential treatments as indicated; (B–E) DTNB assay of GSH Level, MDA examination in HCC cells under different treatment. ***P<0.001. |
Influence on Cell Cycle Progression in vitro
After various treatments, more than half of HepG2/Huh7 cells stagnated in G0/G1 phase in the combination therapy group compared to PBS groups (Figure 4). These data suggested that RSL3@O2-ICG NBs with LFUS could inhibit cell cycle progression (P < 0.001, two-way ANOVA), thus affecting HepG2/Huh7 cells growth.
 |
Figure 4 Analyses of Cell Cycle. (A) Cell cycle of HCC cells was analyzed by flow cytometry after differential treatments as indicated. (B and C) The column charts of different cell period of Hep G2 and Huh7 cells. |
Differential Expression Analysis Based on RNA-Seq
Estimate the expression of mRNA and lncRNA by expression level (FPKM). Show the difference between differentially expressed mRNA and lncRNA through the volcano graph (P<0.05). As a result, a total of 3391 mRNAs in group A and group B (A vs B) were differentially expressed significantly, of which 2307 were up-regulated (Figure 5A). Similarly, compared with group B, 2281 lncRNAs showed significant differences in expression, including 1516 up-regulated genes and 765 down-regulated genes (Figure 5B). A total of 2582 mRNAs expression differences between C group and D group (C vs D), of which 1335 were down-regulated (Figure 5C). 2227 lncRNA expressions are significantly different, including 1328 up-regulated genes and 902 down-regulated genes (Figure 5D). A total of 886 mRNAs and 570 lncRNAs overlapped between the differentially expressed genes between group A and group B and the differentially expressed genes between group C and D (Figure S3A and B).
 |
Figure 5 Screening of differentially expressed genes and KEGG enrichment analysis. (A) group A vs group B differentially expressed mRNA; (B) group C vs group D differentially expressed mRNA; (C) group A vs group B differentially expressed lncRNA; (D) lncRNA differentially expressed in group C vs group D; Up-regulated genes are represented by red dots, down-regulated genes are represented by green dots, and blue dots are genes that have not changed significantly. |
Differentially Expressed Analysis
In the previous step of the differentially expressed gene, we found that A vs B, C vs D are also significantly enriched in cell functions such as regulation of protein phosphorylation, leukocyte chemotaxis, MAPK cascade, and response to alcohol, regulation of cell proliferation (Table 1). The differentially expressed mRNAs of the two groups A vs B, C vs D of cell lines were enriched by the KEGG pathway, respectively. The bubble chart (Figure 6A and B) shows the top 20 main enriched pathways. After comparison, we found that after RSL3@O2-ICG NBs + LFUS treatment, the common enrichment pathway is ECM-receptor interaction. We predict the target genes of all differentially expressed lncRNAs (Table S2 and S3), that is, predict the target genes of lncRNAs through the co-location of lncRNAs and protein-coding genes. GO and KEGG enrichment analyses were performed on target genes to predict the function of lncRNA. Functional enrichment of the predicted target genes found that the target genes of A vs B and C vs D were also significantly enriched in protein phosphorylation, ubiquitin protein ligase binding, regulation of Wnt receptor signaling pathway, cell cycle process, autophagy, and other pathways (Table 2). The result of KEGG pathway enrichment shows that the differentially expressed LncRNA target genes are also significantly enriched in the Alcoholism pathway (Figure 6C and D).
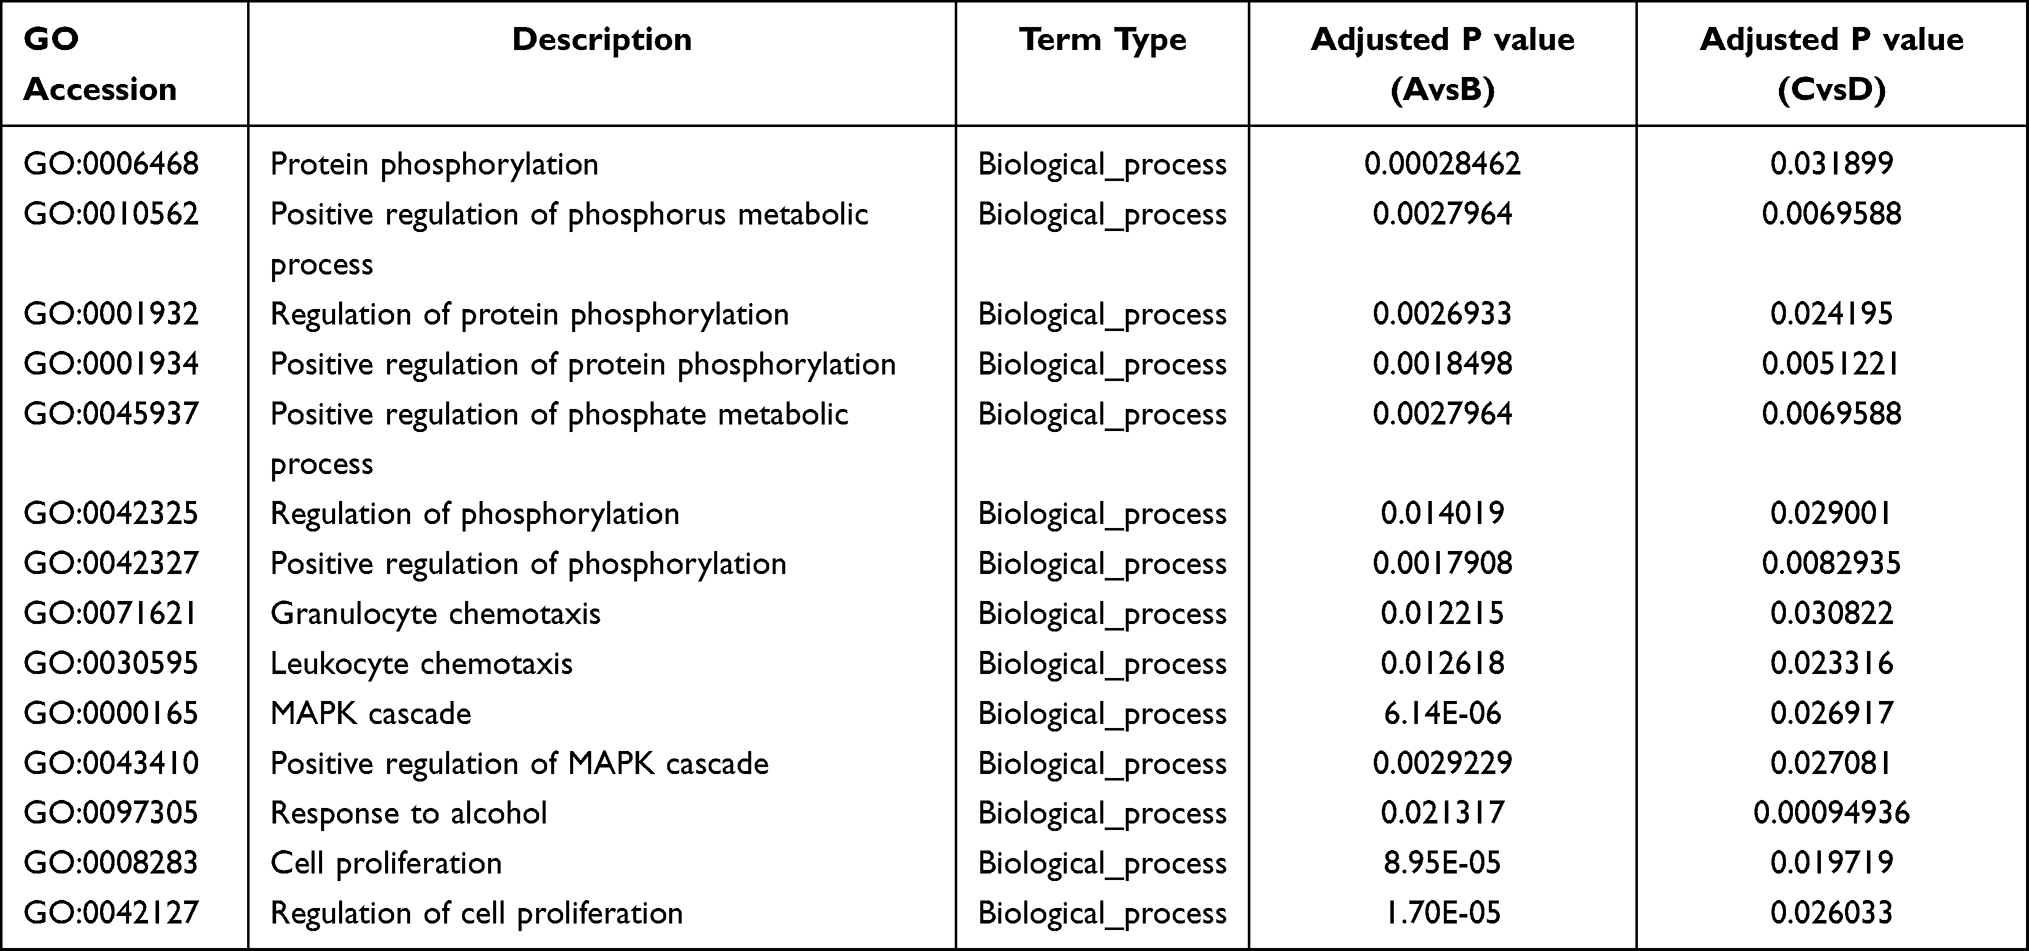 |
Table 1 The Representative Results of GO Enrichment Analysis with Differential mRNA |
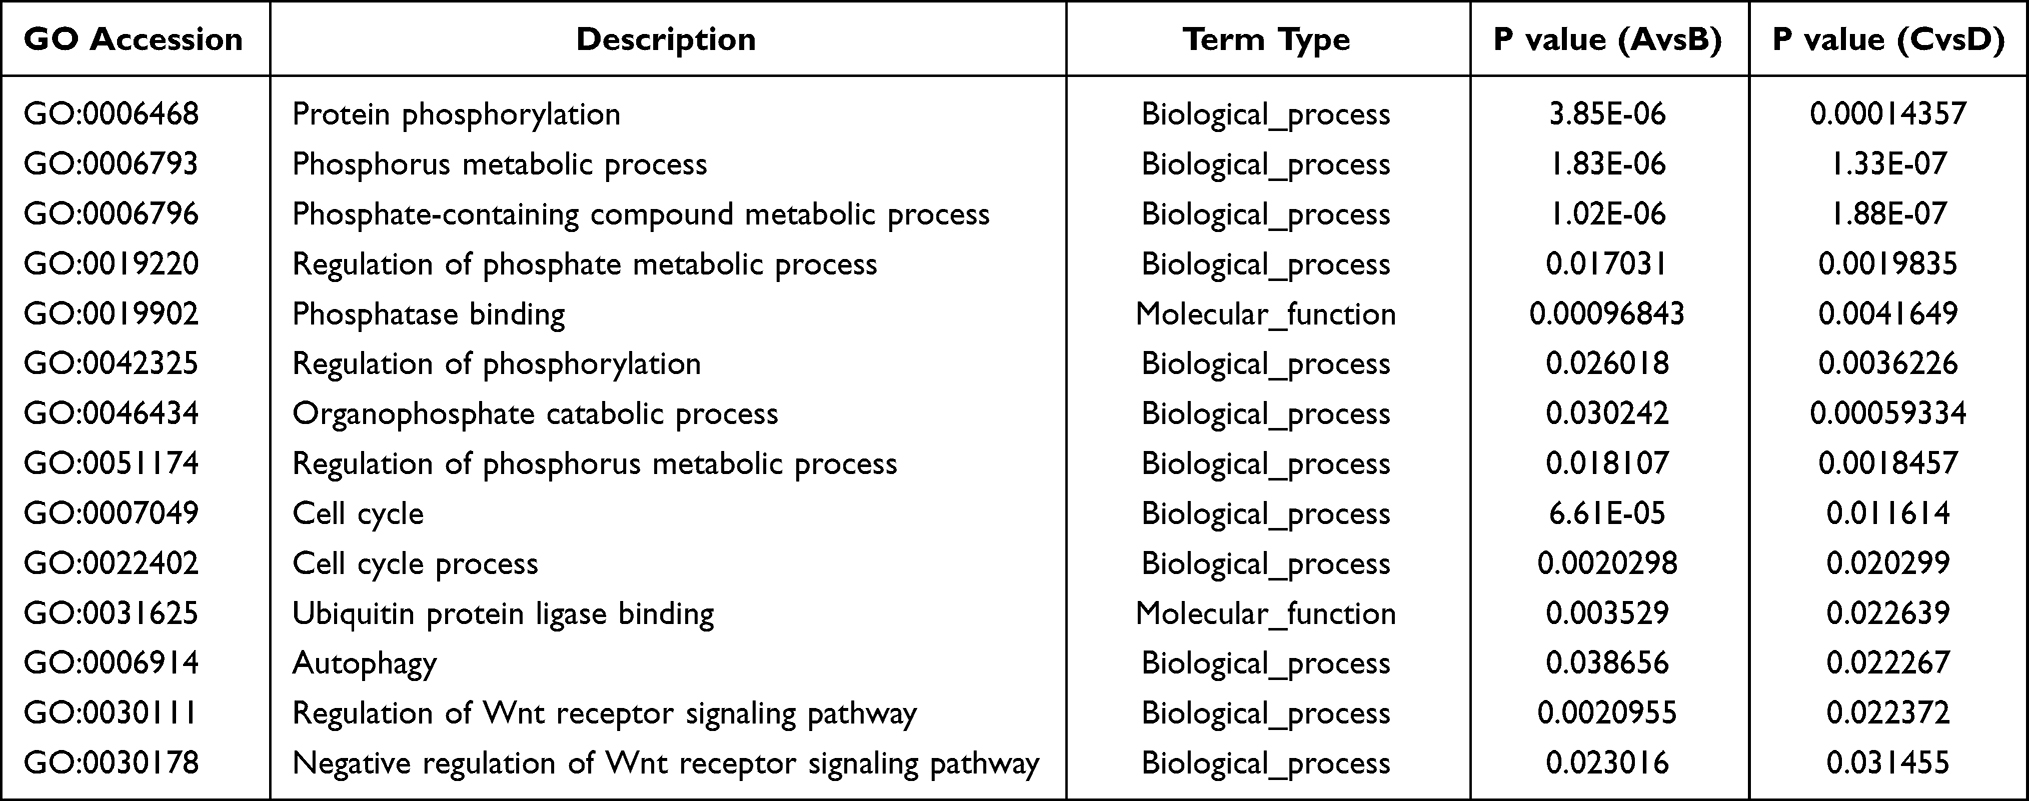 |
Table 2 The Representative Results of GO Enrichment Analysis with Differential LncRNA Targets |
 |
Figure 6 KEGG enrichment analysis of differentially expressed genes. (A) The first 20 KEGG pathways enriched with mRNA differentially expressed between A vs B groups; bubble chart; (B) Differences between C vs D groups Enriched bubble chart of the first 20 KEGG pathways expressing mRNA; (C) Enriched bubble chart of the first 20 KEGG pathways that differentially express lncRNA target genes between A vs B groups; (D) The first 20 KEGG pathways that differentially express lncRNA target genes between C vs D groups Enrichment bubble chart; the y-axis is the enriched pathway, and the x-axis is the ratio of the total genes in the gene of a pathway. The bubble color represents the p value. The larger the p value, the darker the color, and the bubble size represents the enrichment. The number of genes collected. |
Based on the differentially expressed genes identified in the previous step, we found that the differentially expressed genes between A vs B, C vs D groups were also significantly enriched in cell functions such as regulation of protein phosphorylation, leukocyte chemotaxis, MAPK cascade, and response to alcohol, regulation of cell proliferation (Table 1). Among them, the MAPK cascade and cell proliferation are important biological processes affected by Ferroptosis.47 KEGG pathway analysis shows that DEGs are highly correlated with ECM−receptor interaction, Focal adhesion, and some metabolic related pathways. The bubble chart (Figure 6A and B) shows the top 20 main enriched pathways. After comparison, we found that after RSL3@O2-ICG NBs + LFUS treatment, the common enrichment pathway is ECM-receptor interaction. Interestingly, the term of focal adhesion, which was also reported closely related to the tumor immune microenvironment (TME), was enriched in KEGG analyses.48 Next, we predict the target genes of all differentially expressed lncRNAs (Table S2 and S3), that is, predict the target genes of lncRNAs through the co-location of lncRNAs and protein-coding genes. GO and KEGG enrichment analyses were performed on target genes to predict the function of lncRNA. We found that the target genes of A vs B and C vs D were also significantly enriched in protein phosphorylation, ubiquitin protein ligase binding, regulation of Wnt receptor signaling pathway, cell cycle process, autophagy, and other pathways (Table 2). The result of KEGG pathway enrichment shows that the differentially expressed LncRNA target genes are significantly enriched in the Notch signaling pathway, TGF−beta signaling pathway (Figure 6C and D).
The Expression in the TCGA and the Immune Infiltration Status
We obtained the RNA-seq data of hepatocellular carcinoma from the TCGA database (https://portal.gdc.cancer.gov/), including the gene expression information of 373 samples of hepatocellular carcinoma patients. The combination therapy group and the control group included a total of 886 significantly different mRNA overlaps between group A and group B, group C and group D. Disturbances in the expression of these genes may indicate different clinical outcomes in patients with hepatocellular carcinoma. We used 886 overlapping differentially expressed genes (DEGs) to perform heat map cluster analysis of TCGA hepatocellular carcinoma patients, and we found that the expression of these differential genes can divide 373 hepatocellular carcinoma patients into two distinct categories. We define these two categories as ferroptosis-sensitive class 1 and ferroptosis insensitive class 2 (Figure 7A and B). At the same time, we evaluated the immune cell infiltration ratio of all hepatocellular carcinoma samples from TCGA using the Xcell database. For class 1 and class 2, the scores of immune cell abundance, stromal cell abundance, and tumor microenvironment scores all show significant differences. It indicates that the treatment of the RSL3@O2-ICG NBs + LFUS treatment group can adjust the proportion of immune cells in the hepatocellular carcinoma tumor microenvironment to induce the sensitivity of ferroptosis further (Figure 7C).
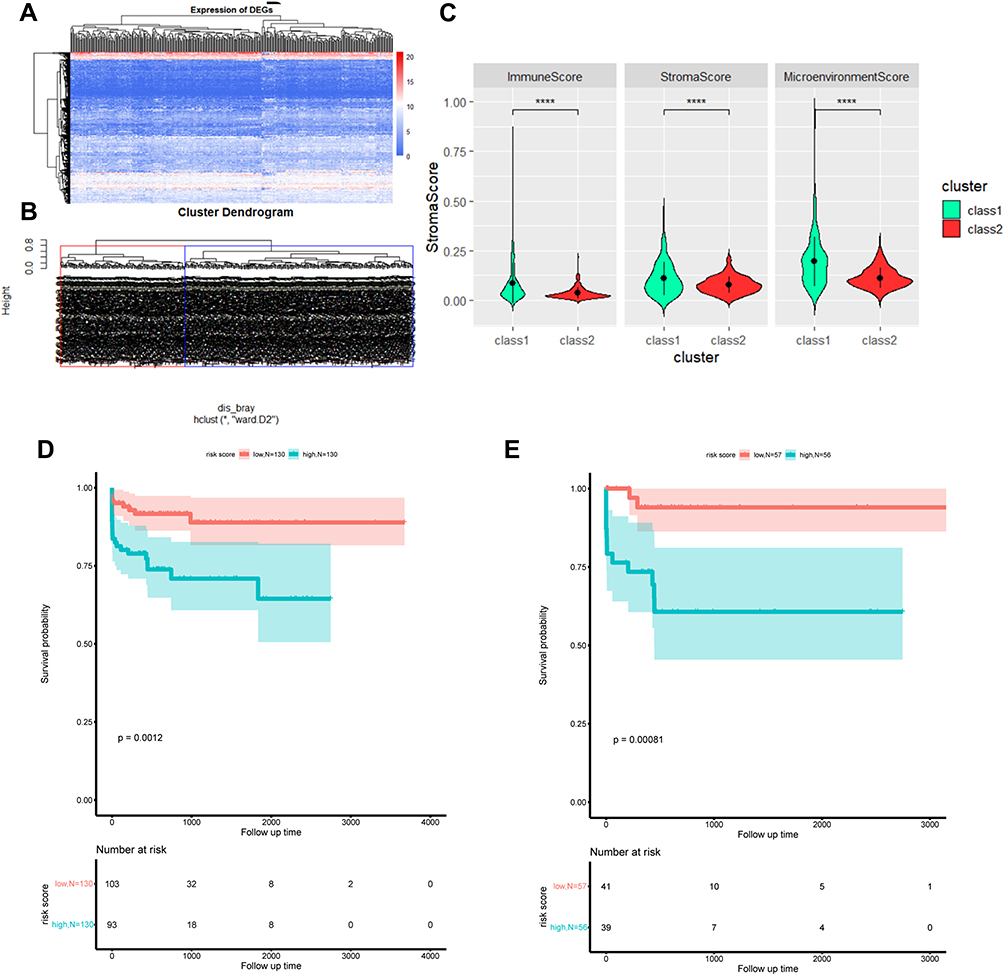 |
Figure 7 DEG function enrichment and DEG expression in TCGA hepatocellular carcinoma data and immune infiltration status. (A) Hierarchical clustering heat map of the expression of the intersection of differentially expressed genes between A vs B and C vs D in TCGA hepatocellular carcinoma RNA-seq; (B) overlapping DEG in TCGA hepatocellular carcinoma patients based on the hierarchical clustering of expression, red and Blue is the two types of aggregation, defined as class 1 and class 2; (C) box plot of the difference in immune cell abundance between class 1 and class 2 in TCGA hepatocellular carcinoma (t-test, p<0.05), green represents class 1 and red represents class 2; (D) the prognosis of the two types in the training set (Log rank test, p<0.05); (E) the prognosis of the two types in the test set (Log rank test, p<0.05); ****P<0.0001. |
Prognostic Analysis of the TCGA Cohort
We used the tumor microenvironment score obtained from the Xcell database in the previous step and used Pearson to screen out 122 differential genes related to the tumor microenvironment score for subsequent analysis. First, in the training set, two prognostic risk genes were obtained, namely “SLC37A2” and “ITGB7” genes, and then these two genes were used to calculate the risk score of ferroptosis sensitivity for each sample, and the training set samples were divided high-risk group and low-risk group (Figure 7D and E). The Log rank test shows that the prognosis of the high-risk group and the low-risk group is significantly different. Low-risk group means a worse prognosis. In the test set, the Log rank test also found that the low-risk group means a worse prognosis. The above results indicate that the prognostic risk genes “SLC37A2” and “ITGB7” which are significantly related to the tumor microenvironment of hepatocellular carcinoma, may represent new hepatocellular carcinoma ferroptosis inducing markers and have guiding significance for the treatment of hepatocellular carcinoma. The expression of the two prognostic risk genes between the class 1 and class 2 groups is also significantly different, and both are highly expressed in the class 1 group relative to the class 2 group (Figure 8A and B). At the same time, the scatter plot shows that the Pearson correlations between the prognostic risk genes “SLC37A2” and “ITGB7” and the hepatocellular carcinoma tumor microenvironment score are 0.46 and 0.41, respectively (Figure 8C).
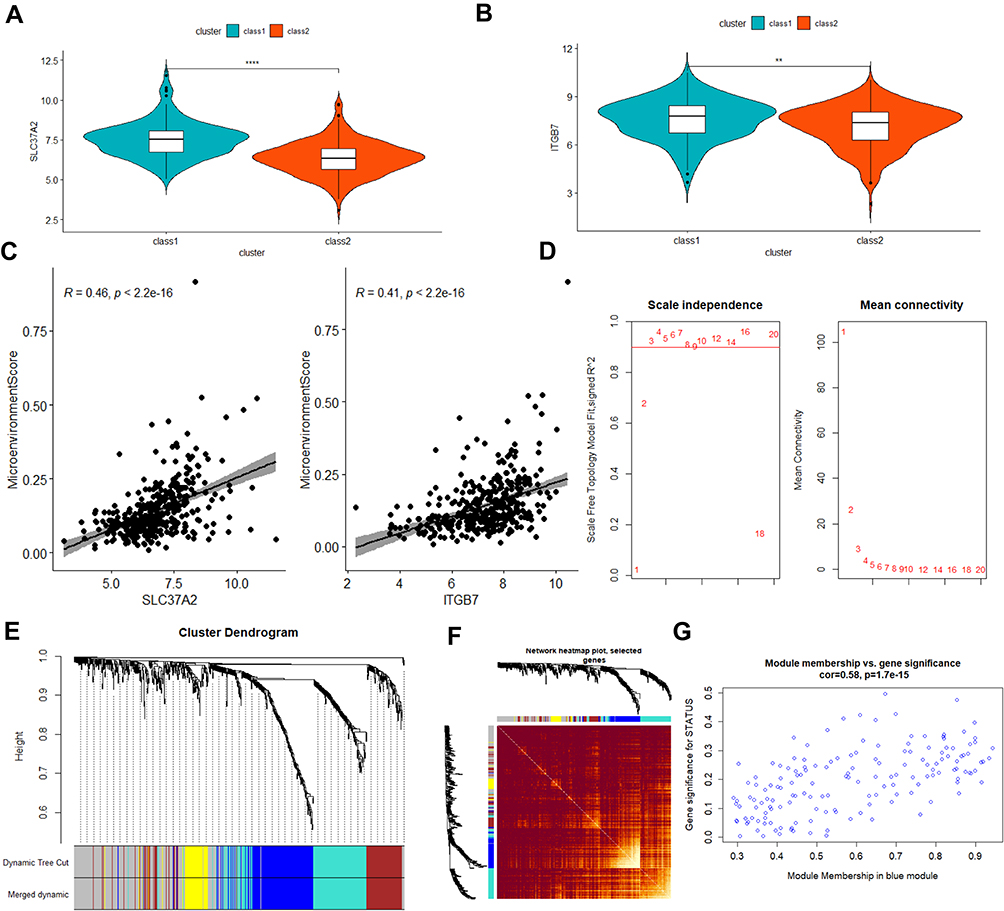 |
Figure 8 Prognosis analysis of the TCGA cohort and weighted co-expression network analysis in the TCGA queue. (A and B) box plot of differences in expression of two prognostic risk genes between class 1 and class 2 groups (t-test, p<0.05), blue represents class 1, red represents class 2; (C) Scatter plot of the correlation between two prognostic risk genes and tumor microenvironment scores (Pearson, R>0.4, p<0.05); (D) Soft Threshold (power) represents the weight, and the ordinate represents the correlation between the connection degree k and p(k); (E) the gene tree for clustering genes by Euclidean distance, different colors represent different gene modules; (F) the heat map of gene co-expression similarity matrix, and the characterization module Cluster trees are displayed in combination. The higher the expression similarity between genes, the darker the color; (G) the scatter plot of the correlation between the blue module and the characteristic gene. **P<0.01, ****P<0.0001. |
Weighted Co-Expression Network Analysis in the TCGA Cohort
In order to explore the correlation pattern between the gene expression of hepatocellular carcinoma in the class 1 and class 2 groups in the TCGA data, we use the WGCNA method to hope to find gene co-expression modules related to ferroptosis sensitivity. WGCNA first divides the gene co-expression network of 886 overlapping genes in hepatocellular carcinoma into several highly correlated characteristic modules, representing several groups of highly coordinated gene sets. When the soft threshold is set to 3, we found that four different gene co-expression feature modules can be obtained, namely blue, brown, turquoise, and yellow modules, containing 157, 116, 164, and 60 genes, respectively. Use the gene co-expression similarity matrix to draw a heat map and display it in combination with the cluster tree of the characterization module. It can be seen that the higher the expression similarity between genes, the darker the color. Genes in the same module have a high co-expression pattern, but there are apparent differences between different modules. In order to further determine which module is most related to the iron death-sensitive phenotype, we calculated the Pearson correlation coefficients between the feature vector ME of the four modules and the phenotype (Table S4). We found that the blue module is most relevant to the ferroptosis-sensitive phenotype. On this basis, we calculated the overall Pearson correlation coefficient between the blue module and the gene to be 0.58. In the end, we screened out 6 genes with a correlation greater than 0.4 in the blue module. We believe that these 6 co-expressed genes are the essential genes that affect the sensitivity to ferroptosis of hepatocellular carcinoma, including “CPNE5”, “GLIPR2”, “FAIM2”, “ANKDD1A”, “P2RX1”, “LYPD5”. GO and KEGG analysis further show that they are enriched in membrane-related and glycosylation pathways (Figure 8D–G).
Discussion
In recent years, combination therapy has shown good advantages in the treatment of HCC. Combination therapy can overcome the shortcomings of monotherapy and reduce the resistance caused by a single medication.49,50 Sonodynamic therapy, as a non-invasive ultrasound-induced treatment method, due to the hypoxia and high GSH of HCC TME, the effect of single sonodynamic therapy is not good.50 Ferroptosis is a type of programmed cell death characterized by iron overload and lipid peroxidation. Since ROS of ferroptosis has great similarity with SDT’s cytotoxicity, homologous ROS generation therapies bypass the apoptosis pathway and avoid the occurrence of multi-drug resistance (MDR),51 alleviating the inherent Resistance. Indocyanine green was selected for the construction of nanobubbles as a sonosensitizer. ICG can produce abundant ROS under the stimulation of ultrasound. We constructed RSL3@O2-ICG NBs that took advantage of the amphiphilic nature of phospholipid molecules, loaded hydrophilic ICG on the surface of the hydrophilic head of the phospholipid, and packaged the hydrophobic RSL3. With the core of oxygen encapsulated in lipid NBs, NBs in this study can also be used as oxygen carrier combined with US to relieve hypoxia in the tumor microenvironment and achieve UTND simultaneously. UTND can selectively deliver the sonosensitizer ICG and the molecularly targeted drug RSL3 to the tumor site through NBs to increase the drug concentration in the tumor site and increase the permeability of cell membranes through the cavitation effect and promote the entry of drugs into cells. Furthermore, it has ultrasound imaging function. In the next experiment, we will add RSL3@O2-ICG NBs combined with LFUS to achieve the combined treatment of SDT and ferroptosis for HCC.
Firstly, as shown in Figure 1A, Spherical nanoparticles with a diameter of about 300 nm can be seen by SEM. It was observed that the representative Chlorine element of RSL3 and Sodium Sulfur elements of ICG were enriched on the phospholipid nanobubbles (Figure 1B–F). The Zeta potential of the nanoplatform is shown in Table 1, and it showed a negative charge at about –3.86 mV. The size of 300 nm diameter, negative potential and good solubility of the NBs all indicated that might have EPR (Enhanced Permeability and Retention) effect. As shown in (Figure 1H), NBs had specific absorption of ICG and RSL3 at approximately 770nm and 240nm, indicating the successful incorporation of ICG and RSL3 into RSL3@O2-ICG NBs, which is consistent with the previous SEM imaging results.
Secondly, the role of O2-ICG-NBs in enhancing SDT has been proven (Figure 2B), which proved that the ROS generated by LFUS increased and supported us to carry out the following experiment. Since the intracellular GSH will be reduced due to the cytotoxic •OH produced by the Fe Fenton reaction in ferroptosis, the GSH level is generally used to evaluate the intensity of ferroptosis.52 It can be seen from Figure 3C and E that compared with the PBS treatment group, the GSH level of the combined treatment group decreased significantly, while the decreased GSH levels of the other two groups treated with SDT or RSL3 alone were considered to be negligible. In order to prove more convincingly that most of the decrease in GSH level in the combination treatment group was caused by ferroptosis, we chose to add Fer-1 (1μM). The results showed that the GSH level was similar to the blank group, indicating that GSH depletion was mainly due to ferroptosis. At the same time, kinds of literature indicate that LPO in cells is an important biomarker of ferroptosis,53,54 and its accumulation contributes to the occurrence of ferroptosis. As an end product of fat oxidation, MDA has increased expression during the whole process, which can also indicate the occurrence of ferroptosis process.16 The results in Figure 3B and D show that the MDA content of the combined treatment group increased. It can be seen that there is a negative correlation between MDA and GSH. In contrast, MMP analysis showed similar results; the combination therapy effectively enhanced the green fluorescence of the cells. After determining the method of leading induced cells, we will further explore the effects of cell division through cell cycle experiments; after various treatments, more than half of HepG2/Huh7 cells stagnated in G0/G1 phase in combination therapy group compared to PBS groups (Figure 4). These data suggested that RSL3@O2-ICG NBs with LFUS could inhibit cell cycle progression, thus affecting HepG2/Huh7 cells growth.
Thirdly, RNA-seq analysis further clarify the primary mechanism. Moreover, the target genes of the differential lncRNAs were predicted, and then GO and KEGG function analyses were performed on the differential mRNAs and the predicted target gene of the differential lncRNAs. We found that different mRNAs before and after treatment in different cell lines are collectively enriched in “protein phosphorylation,” “positive regulation of phosphorus metabolic process,” “regulation of protein phosphorylation,” “positive regulation of protein phosphorylation,” “positive regulation of phosphate metabolic process,” “regulation of phosphorylation,” “positive regulation of Phosphorylation” and other protein phosphorylation-related functional pathways (Table 1). It suggests that targeted protein phosphorylation may help increase the sensitivity of HCC to ferroptosis. In addition, mRNA was also enriched in “granulocyte chemotaxis,” “leukocyte chemotaxis,” and other pathways (Table 1). It showed that the treatment caused the change of tumor cell TME and caused the change of related immune cells. To further confirm it, the immune cell infiltration ratio of all hepatocellular carcinoma samples from TCGA was evaluated, which found that the scores of stromal cell abundance and tumor microenvironment scores showed significant differences between the ferroptosis sensitive and insensitive groups that we considered. It shows that combined treatment can adjust the proportion of immune cells in the hepatocellular carcinoma tumor microenvironment to improve ferroptosis sensitivity further. Moreover, the WGCNA weighted co-expression network found six key modular genes related to ferroptosis sensitivity and found them enriched in membrane-related pathways and glycosylation-related pathways. It will become a new target for HCC.
Finally, we analyze the 122 differential genes related to the tumor microenvironment score for subsequent prognostic analysis, then discovered that the prognostic risk genes “SLC37A2” and “ITGB7” which are significantly related to the tumor microenvironment of hepatocellular carcinoma, which may represent new ferroptosis inducing markers for hepatocellular carcinoma, this has guiding significance for the clinical treatment of hepatocellular carcinoma.
Hepatocellular carcinoma, realize effective treatment of liver cancer, and reduce drug resistance. It may become the application of more sensitive molecular imaging probes in the diagnosis of early cancer and potentially effective treatment methods.
There are a large number of reports in the literature that RSL3 is an effective small molecule inhibitor that can cause ferroptosis in liver cancer cells.55–57 It mainly induces ferroptosis by inhibiting the key enzyme GPX4 in the ferroptosis pathway, which makes the intracellular redox imbalance and leads to cell death. To achieve the effect of antitumor, it has the effect of anti-liver cancer when used alone.58 Unlike the sonosensitizers we use, it does not significantly increase its efficacy under ultrasound irradiation, so we added the sonosensitizer Indocyanine Green. Sonodynamic therapy is produced by the combination of sonosensitizers and ultrasound to make Hepatocellular Carcinoma cells sensitive to RSL3-induced ferroptosis and achieve better anti-liver cancer effects.
However, this study still has some shortcomings and limitations; the potential therapeutic targets obtained by RNA sequencing have not been verified by QPCR, and animal experiments have not been carried out.
Conclusions
In this study, RSL3@O2-ICG NBs provide a two-in-one treatment platform for SDT and sensitization ferroptosis treatment of liver cancer, showing high antitumor efficacy and safety. We found that it was significantly related to the tumor microenvironment of hepatocellular carcinoma. The prognostic risk genes “SLC37A2” and “ITGB7” may represent new hepatocellular carcinoma ferroptosis-inducing markers and have guiding significance for treating hepatocellular carcinoma.
Abbreviations
HCC, hepatocellular carcinoma; SDT, sonodynamic therapy; PDT, photodynamic therapy; ROS, reactive oxygen species; LFUS, low-frequency ultrasound; RNA-seq, RNA sequencing; MMP, mitochondrial membrane potential; RSL3, RAS-selective lethal 3; UTND, ultrasound-targeted nanobubble destruction; GPX4, glutathione peroxidase 4.
Data Sharing Statement
The datasets used and analyzed during the current study were uploaded and deposited in NCBI’s Gene Expression Omnibus and are accessible through GEO Series accession number GSE178573 (https://www.ncbi.nlm.nih.gov/geo/query/acc.cgi?acc=GSE178573).
Funding
This research was supported by the National Natural Science Foundation of China (grant number 81873900 and 82171947), Natural Science Foundation of Heilongjiang Province (grant number YQ2020H037 and ZD2021H005), and HAI YAN Science Foundation of Harbin Medical University Cancer Hospital (grant number JJMS2021-30).
Disclosure
The authors report no conflicts of interest in this work.
References
1. McGlynn KA, Petrick JL, El-Serag HB. Epidemiology of hepatocellular carcinoma. Hepatology. 2021;73(Suppl1):4–13. doi:10.1002/hep.31288
2. Bray F, Ferlay J, Soerjomataram I, Siegel RL, Torre LA, Jemal A. Global cancer statistics 2018: GLOBOCAN estimates of incidence and mortality worldwide for 36 cancers in 185 countries. CA Cancer J Clin. 2018;68(6):394–424. doi:10.3322/caac.21492
3. Forner A, Reig M, Bruix J. Hepatocellular carcinoma. Lancet. 2018;391(10127):1301–1314. doi:10.1016/S0140-6736(18)30010-2
4. Hollebecque A, Malka D, Ferté C, Ducreux M, Boige V. Systemic treatment of advanced hepatocellular carcinoma: from disillusions to new horizons. Eur j Cancer. 2015;51(3):327–339. doi:10.1016/j.ejca.2014.12.005
5. Kuczynski EA, Lee CR, Man S, Chen E, Kerbel RS. Effects of sorafenib dose on acquired reversible resistance and toxicity in hepatocellular carcinoma. Cancer Res. 2015;75(12):2510–2519. doi:10.1158/0008-5472.CAN-14-3687
6. Wang H, Lu Z, Zhao X. Tumorigenesis, diagnosis, and therapeutic potential of exosomes in liver cancer. J Hematol Oncol. 2019;12(1):133. doi:10.1186/s13045-019-0806-6
7. Méndez-Blanco C, Fondevila F, García-Palomo A, González-Gallego J, Mauriz JL. Sorafenib resistance in hepatocarcinoma: role of hypoxia-inducible factors. Exp Mol Med. 2018;50(10):1–9. doi:10.1038/s12276-018-0159-1
8. Shen Z, Song J, Yung BC, Zhou Z, Wu A, Chen X. Emerging strategies of cancer therapy based on ferroptosis. Adv Materials. 2018;30(12):e1704007. doi:10.1002/adma.201704007
9. Wang Q, Zhang P, Li Z, et al. Evaluation of polymer nanoformulations in hepatoma therapy by established rodent models. Theranostics. 2019;9(5):1426–1452. doi:10.7150/thno.31683
10. Ding J, Chen J, Gao L, et al. Engineered nanomedicines with enhanced tumor penetration. Nano Today. 2019;2;29.
11. Zheng P, Liu Y, Chen J, Xu W, Li G, Ding J. Targeted pH-responsive polyion complex micelle for controlled intracellular drug delivery. Chin Chem Lett. 2020;31(5):1178–1182. doi:10.1016/j.cclet.2019.12.001
12. Zhao D, Zhu T, Li J, et al. Poly(lactic-co-glycolic acid)-based composite bone-substitute materials. Bioact Mater. 2021;6(2):346–360. doi:10.1016/j.bioactmat.2020.08.016
13. Feng X, Xu W, Liu J, et al. Polypeptide nanoformulation-induced immunogenic cell death and remission of immunosuppression for enhanced chemoimmunotherapy. Science Bulletin. 2021;66(4):362–373. doi:10.1016/j.scib.2020.07.013
14. Wei L, Chen J, Ding J. Sequentially stimuli-responsive anticancer nanomedicines. Nanomedicine. 2021;16(4):261–264. doi:10.2217/nnm-2021-0019
15. Zhou Z, Song J, Tian R, et al. Activatable singlet oxygen generation from lipid hydroperoxide nanoparticles for cancer therapy. Angewandte Chemie. 2017;56(23):6492–6496. doi:10.1002/anie.201701181
16. Conrad M, Pratt DA. The chemical basis of ferroptosis. Nat Chem Biol. 2019;15(12):1137–1147. doi:10.1038/s41589-019-0408-1
17. Xu T, Ma Y, Yuan Q, et al. Enhanced Ferroptosis by Oxygen-Boosted Phototherapy Based on a 2-in-1 Nanoplatform of Ferrous Hemoglobin for Tumor Synergistic Therapy. ACS Nano. 2020;14(3):3414–3425. doi:10.1021/acsnano.9b09426
18. Yumita N, Sasaki K, Umemura S, Yukawa A, Nishigaki R. Sonodynamically induced antitumor effect of gallium-porphyrin complex by focused ultrasound on experimental kidney tumor. Cancer Lett. 1997;112(1):79–86. doi:10.1016/S0304-3835(96)04548-X
19. Zhang R, Yan F, Chen Y. Exogenous physical irradiation on titania semiconductors: materials chemistry and tumor-specific nanomedicine. Adv Sci. 2018;5(12):1801175. doi:10.1002/advs.201801175
20. Zhang Y, Zhang X, Yang H, et al. Advanced biotechnology-assisted precise sonodynamic therapy. Chem Soc Rev. 2021;50(20):11227–11248. doi:10.1039/D1CS00403D
21. Huang J, Liu F, Han X, et al. Nanosonosensitizers for Highly Efficient Sonodynamic Cancer Theranostics. Theranostics. 2018;8(22):6178–6194. doi:10.7150/thno.29569
22. Zhang R, Xu Y, Zhang Y, et al. Rational design of a multifunctional molecular dye for dual-modal NIR-II/photoacoustic imaging and photothermal therapy. Chem Sci. 2019;10(36):8348–8353. doi:10.1039/C9SC03504D
23. Li Y, Tu L, Ma X, et al. Engineering a smart nanofluidic sensor for high-performance peroxynitrite sensing through a spirocyclic ring open/close reaction strategy. ACS Sensors. 2021;6(3):808–814. doi:10.1021/acssensors.0c01719
24. Huang W, Yang H, Hu Z, et al. Rigidity Bridging Flexibility to Harmonize Three Excited-State Deactivation Pathways for NIR-II-Fluorescent-Imaging-Guided Phototherapy. Adv Healthc Mater. 2021;10(20):e2101003. doi:10.1002/adhm.202101003
25. Li C, Liu C, Fan Y, et al. Recent development of near-infrared photoacoustic probes based on small-molecule organic dye. RSC Chemical Biol. 2021;2(3):743–758. doi:10.1039/D0CB00225A
26. Guan T, Cheng M, Zeng L, et al. Engineering the Redox-Driven Channel for Precisely Regulating Nanoconfined Glutathione Identification and Transport. ACS Appl Mater Interfaces. 2021;13(41):49137–49145. doi:10.1021/acsami.1c12061
27. Ouyang Q, Tu L, Zhang Y, et al. Construction of a smart nanofluidic sensor through a redox reaction strategy for high-performance carbon monoxide sensing. Anal Chem. 2020;92(22):14947–14952. doi:10.1021/acs.analchem.0c02424
28. Lieto E, Galizia G, Cardella F, et al. Indocyanine green fluorescence imaging-guided surgery in primary and metastatic liver tumors. Surg Innov. 2018;25(1):62–68. doi:10.1177/1553350617751451
29. Souzaki R, Kawakubo N, Matsuura T, et al. Navigation surgery using indocyanine green fluorescent imaging for hepatoblastoma patients. Pediatr Surg Int. 2019;35(5):551–557. doi:10.1007/s00383-019-04458-5
30. Yang J, Tao HS, Cai W, et al. Accuracy of actual resected liver volume in anatomical liver resections guided by 3-dimensional parenchymal staining using fusion indocyanine green fluorescence imaging. J Surg Oncol. 2018;118(7):1081–1087. doi:10.1002/jso.25258
31. Peyrat P, Blanc E, Guillermet S, et al. HEPATOFLUO: a prospective monocentric study assessing the benefits of indocyanine green (ICG) fluorescence for hepatic surgery. J Surg Oncol. 2018;117(5):922–927. doi:10.1002/jso.25011
32. Nguyen Cao TG, Kang JH, You JY, et al. Safe and Targeted Sonodynamic Cancer Therapy Using Biocompatible Exosome-Based Nanosonosensitizers. ACS Appl Mater Interfaces. 2021;13(22):25575–25588. doi:10.1021/acsami.0c22883
33. Ma R, Wu Q, Si T, Chang S, Xu RX. Oxygen and Indocyanine Green loaded microparticles for dual-mode imaging and sonodynamic treatment of cancer cells. Ultrason Sonochem. 2017;39:197–207. doi:10.1016/j.ultsonch.2017.03.019
34. Liu Z, Li J, Chen W, Liu L, Yu F. Light and sound to trigger the Pandora’s box against breast cancer: a combination strategy of sonodynamic, photodynamic and photothermal therapies. Biomaterials. 2020;232:119685. doi:10.1016/j.biomaterials.2019.119685
35. Wu P, Sun Y, Dong W, et al. Enhanced anti-tumor efficacy of hyaluronic acid modified nanocomposites combined with sonochemotherapy against subcutaneous and metastatic breast tumors. Nanoscale. 2019;11(24):11470–11483. doi:10.1039/C9NR01691K
36. Xie W, Zhu S, Yang B, et al. The destruction of laser-induced phase-transition nanoparticles triggered by low-intensity ultrasound: an innovative modality to enhance the immunological treatment of ovarian cancer cells. Int J Nanomedicine. 2019;14:9377–9393. doi:10.2147/IJN.S208404
37. Chen Q, Liang C, Wang C, Liu Z. An imagable and photothermal “Abraxane-like” nanodrug for combination cancer therapy to treat subcutaneous and metastatic breast tumors. Adv Materials. 2015;27(5):903–910. doi:10.1002/adma.201404308
38. Proulx ST, Luciani P, Derzsi S, et al. Quantitative imaging of lymphatic function with liposomal indocyanine green. Cancer Res. 2010;70(18):7053–7062. doi:10.1158/0008-5472.CAN-10-0271
39. Liu Y, Xu M, Chen Q, et al. Gold nanorods/mesoporous silica-based nanocomposite as theranostic agents for targeting near-infrared imaging and photothermal therapy induced with laser. Int J Nanomedicine. 2015;10:4747–4761. doi:10.2147/IJN.S82940
40. Ma Y, Sadoqi M, Shao J. Biodistribution of indocyanine green-loaded nanoparticles with surface modifications of PEG and folic acid. Int J Pharm. 2012;436(1–2):25–31. doi:10.1016/j.ijpharm.2012.06.007
41. Tian Y, Liu Z, Tan H, et al. New aspects of ultrasound-mediated targeted delivery and therapy for cancer. Int J Nanomedicine. 2020;15:401–418. doi:10.2147/IJN.S201208
42. Tan H, Tian Y, Yang H, et al. Oxygen-sufficient lipid nanobubbles combined with UTMD for enhanced sonodynamic therapy of Hep-G2 cells. J Biomed Mater Res B Appl Biomater. 2021;109(11):1796–1806. doi:10.1002/jbm.b.34839
43. Khan MS, Hwang J, Seo Y, et al. Engineering oxygen nanobubbles for the effective reversal of hypoxia. Artif Cells, Nanomed Biotechnol. 2018;46(sup3):S318–s327. doi:10.1080/21691401.2018.1492420
44. Wu B, Yuan Y, Liu J, et al. Single-cell RNA sequencing reveals the mechanism of sonodynamic therapy combined with a RAS inhibitor in the setting of hepatocellular carcinoma. J Nanobiotechnology. 2021;19(1):177. doi:10.1186/s12951-021-00923-3
45. Deng F, Sharma I, Dai Y, Yang M, Kanwar YS. Myo-inositol oxygenase expression profile modulates pathogenic ferroptosis in the renal proximal tubule. J Clin Invest. 2019;129(11):5033–5049. doi:10.1172/JCI129903
46. Doll S, Freitas FP, Shah R, et al. FSP1 is a glutathione-independent ferroptosis suppressor. Nature. 2019;575(7784):693–698. doi:10.1038/s41586-019-1707-0
47. Lv H, Zhen C, Liu J, Shang P. β-Phenethyl Isothiocyanate Induces Cell Death in Human Osteosarcoma through Altering Iron Metabolism, Disturbing the Redox Balance, and Activating the MAPK Signaling Pathway. Oxid Med Cell Longev. 2020;2020:5021983. doi:10.1155/2020/5021983
48. Murphy JM, Rodriguez YAR, Jeong K, Ahn EE, Lim SS. Targeting focal adhesion kinase in cancer cells and the tumor microenvironment. Exp Mol Med. 2020;52(6):877–886. doi:10.1038/s12276-020-0447-4
49. Xu M, Zhou L, Zheng L, et al. Sonodynamic therapy-derived multimodal synergistic cancer therapy. Cancer Lett. 2021;497:229–242. doi:10.1016/j.canlet.2020.10.037
50. Liang S, Deng X, Ma P, Cheng Z, Lin J. Recent Advances in Nanomaterial-Assisted Combinational Sonodynamic Cancer Therapy. Adv Materials. 2020;32(47):e2003214. doi:10.1002/adma.202003214
51. Tang D, Kroemer G. Ferroptosis. Current Biology. 2020;30(21):R1292–r1297. doi:10.1016/j.cub.2020.09.068
52. Stockwell BR, Jiang X, Gu W. Emerging Mechanisms and Disease Relevance of Ferroptosis. Trends Cell Biol. 2020;30(6):478–490. doi:10.1016/j.tcb.2020.02.009
53. Xie Y, Hou W, Song X, et al. Ferroptosis: process and function. Cell Death Differ. 2016;23(3):369–379. doi:10.1038/cdd.2015.158
54. Stockwell BR, Friedmann Angeli JP, Bayir H, et al. Ferroptosis: a Regulated Cell Death Nexus Linking Metabolism, Redox Biology, and Disease. Cell. 2017;171(2):273–285. doi:10.1016/j.cell.2017.09.021
55. Asperti M, Bellini S, Grillo E, et al. H-ferritin suppression and pronounced mitochondrial respiration make Hepatocellular Carcinoma cells sensitive to RSL3-induced ferroptosis. Free Radic Biol Med. 2021;169:294–303. doi:10.1016/j.freeradbiomed.2021.04.024
56. Zhao Y, Li M, Yao X, et al. HCAR1/MCT1 Regulates Tumor Ferroptosis through the Lactate-Mediated AMPK-SCD1 Activity and Its Therapeutic Implications. Cell Rep. 2020;33(10):108487. doi:10.1016/j.celrep.2020.108487
57. Wang Q, Bin C, Xue Q, et al. GSTZ1 sensitizes hepatocellular carcinoma cells to sorafenib-induced ferroptosis via inhibition of NRF2/GPX4 axis. Cell Death Dis. 2021;12(5):426. doi:10.1038/s41419-021-03718-4
58. Zhu G, Murshed A, Li H, et al. O-GlcNAcylation enhances sensitivity to RSL3-induced ferroptosis via the YAP/TFRC pathway in liver cancer. Cell Death Discovery. 2021;7(1):83. doi:10.1038/s41420-021-00468-2
 © 2022 The Author(s). This work is published and licensed by Dove Medical Press Limited. The full terms of this license are available at https://www.dovepress.com/terms.php and incorporate the Creative Commons Attribution - Non Commercial (unported, v3.0) License.
By accessing the work you hereby accept the Terms. Non-commercial uses of the work are permitted without any further permission from Dove Medical Press Limited, provided the work is properly attributed. For permission for commercial use of this work, please see paragraphs 4.2 and 5 of our Terms.
© 2022 The Author(s). This work is published and licensed by Dove Medical Press Limited. The full terms of this license are available at https://www.dovepress.com/terms.php and incorporate the Creative Commons Attribution - Non Commercial (unported, v3.0) License.
By accessing the work you hereby accept the Terms. Non-commercial uses of the work are permitted without any further permission from Dove Medical Press Limited, provided the work is properly attributed. For permission for commercial use of this work, please see paragraphs 4.2 and 5 of our Terms.