")
Back to Journals » Diabetes, Metabolic Syndrome and Obesity » Volume 14
Relationship Between the TyG Index and Diabetic Kidney Disease in Patients with Type-2 Diabetes Mellitus
Authors Lv L, Zhou Y, Chen X, Gong L, Wu J, Luo W, Shen Y, Han S, Hu J , Wang Y, Li Q, Wang Z
Received 30 April 2021
Accepted for publication 2 July 2021
Published 17 July 2021 Volume 2021:14 Pages 3299—3306
DOI https://doi.org/10.2147/DMSO.S318255
Checked for plagiarism Yes
Review by Single anonymous peer review
Peer reviewer comments 4
Editor who approved publication: Prof. Dr. Juei-Tang Cheng
Liangjing Lv,1,* Yangmei Zhou,1,* Xiangjun Chen,1 Lilin Gong,1 Jinshan Wu,1 Wenjin Luo,1 Yan Shen,1 Shichao Han,2 Jinbo Hu,1 Yue Wang,1 Qifu Li,1 Zhihong Wang1 On behalf of the Chongqing Diabetes Registry Group
1Department of Endocrinology, The First Affiliated Hospital of Chongqing Medical University, Chongqing, People’s Republic of China; 2Department of Statistics, University of California, Berkeley, CA, USA
*These authors contributed equally to this work
Correspondence: Zhihong Wang
Department of Endocrinology, The First Affiliated Hospital of Chongqing Medical University, Yuzhong District, Chongqing, People’s Republic of China
Tel/Fax +86-023-89011552
Email [email protected]
Background: Diabetic kidney disease (DKD) lacks a simple and relatively accurate predictor. The Triglyceride–Glucose (TyG) Index is a proxy of insulin resistance, but the association between the TyG Index and DKD is less certain. We investigated if the TyG Index can predict DKD onset effectively.
Materials and Methods: Cross-sectional and longitudinal analyses were undertaken. In total, 1432 type-2 diabetes mellitus (T2DM) patients were included in the cross-sectional analysis. The TyG Index (calculated by ln [fasting triglycerides (mg/dL) × fasting glucose (mg/dL)/2]) was split into three tertiles. Associations of the TyG Index with microalbuminuria and estimated glomerular filtration rate (eGFR) < 60 mL/min/1.73 m2 were calculated. Longitudinally, 424 patients without DKD at baseline were followed up for 21 (range, 12– 24) months. The main outcome was DKD prevalence as defined with eGFR < 60 mL/min/1.73 m2 or continuously increased urinary microalbuminuria: creatinine ratio (> 30 mg/mL) over 3 months. Cox regression was used to analyze the association between the TyG Index at baseline and DKD. Receiver operating characteristics curve (ROC) analysis was used to assess the sensitivity and specificity of the TyG Index in predicting DKD.
Results: In cross-sectional analysis, patients with a higher TyG Index had a higher risk of microalbuminuria (OR = 2.342, 95% CI = 1.744– 3.144, p < 0.001), and eGFR < 60 mL/min/1.73 m2 (1.696, 95% CI =1.096– 2.625, p = 0.018). Longitudinally, 94 of 424 participants developed DKD. After confounder adjustment, patients in the high tertile of the TyG Index at baseline had a greater risk to developing DKD than those in the low tertile (HR = 1.727, 95% CI = 1.042– 2.863, p = 0.034). The area under the ROC curve was 0.69 (0.63– 0.76).
Conclusion: The TyG Index is a potential predictor for DKD in T2DM patients.
Clinical Trial: Clinical Trials identification number = NCT03692884.
Keywords: diabetic kidney disease, triglyceride–glucose index, insulin resistance
Introduction
Diabetic kidney disease (DKD) is a microvascular complication of diabetes mellitus (DM).1 About 20–40% of DM patients have DKD.2 The risk of end-stage renal disease (ESRD), cardiovascular disease, and cumulative mortality rate increases remarkably over decades, along with DKD risk.3 An early diagnosis and comprehensive treatment can prevent and delay kidney disease.4,5 Nevertheless, fewer than 20% of patients are aware of DKD and receive optimal treatment.6 Thus, investigation of effective predictors of DKD is very important.
Insulin resistance (IR) is closely related to an increased risk of kidney disease in DM populations.7–9 Maahs et al found that type-2 diabetes mellitus (T2DM), characterized etiologically by IR, often presented with excess albuminuria compared with that observed in T1DM.10 Besides, a recent study from Sweden illustrated that a new subtype of DM with the highest IR was most susceptible to DKD according to a genome-wide association study and genetic risk score.11 A cohort study enrolling 119 patients with T2DM and DKD with a follow-up duration of 4 years discovered that IR was independently associated with ESRD.12 Those studies suggested that IR was correlated with the occurrence and development of DKD.
The “gold standard” for the diagnosis of IR is measuring the glucose disposal rate using a hyperinsulinemic–euglycemic clamp. However, its expense and complex procedure limit its clinical use. Hence, numerous surrogate measures have emerged. Homeostatic Model Assessment for Insulin Resistance (HOMA-IR) has been shown to outperform several other measures of IR.13,14 Nevertheless, in patients with DM, measurement of IR using HOMA-IR can be inaccurate. This is because HOMA-IR is calculated using levels of endogenous insulin, but patients with DM often receive treatment with insulin, which hampers accurate measurement of endogenous insulin.15 Furthermore, measurement of endogenous insulin is not conducted routinely clinically (especially in community hospitals). Therefore, there is an urgent need for a more accessible and applicable indicator of IR.
Impaired levels of fasting blood glucose (FBG) and triglyceride (TG) can often be found in IR. The Triglyceride–Glucose (TyG) Index is calculated using levels of FBG and TG, and performs well when measuring IR.16 Accordingly, the TyG Index is correlated with IR as measured by the hyperinsulinemic–euglycemic clamp17 and HOMA-IR.18 For decades, the TyG Index has been recognized as a surrogate marker of IR.16 Recent studies have shown that the TyG Index is a new predictor of T2DM19 and cardiovascular disease.20 In Australia, one study enrolled 176,420 individuals (body mass index (BMI) = 20.6–29.2 kg/m2) and investigated the correlation between the TyG Index and ESRD. Results demonstrated that the TyG Index was positively correlated with ESRD risk (hazard ratio [HR] per 1-unit increase in SD = 1.56–1.82).21 Although the TyG Index is related to kidney disease, the evidence regarding the association between the TyG Index and DKD is limited. One cross-sectional study illustrated a higher TyG Index to be associated with a higher risk of proteinuria in DM patients, but the sample size was small and they defined DKD using the rate of albumin excretion only. In addition, few longitudinal studies have demonstrated the relationship between the TyG Index and DKD.22 Thus, we investigated the correlation between the TyG Index and DKD in cross-sectional studies and longitudinal studies.
Methods
Study Population
This study was conducted in accordance with the Declaration of Helsinki 1964 and its later amendments. The study protocol was approved (2018–042) by the Ethics Committee of the First Affiliated Hospital of Chongqing Medical University (Chongqing, China). All participants provided written informed consent.
The Chongqing Diabetes Registry (Clinical Trials ID: NCT03692884) is a prospective, ongoing, and multistage population study. Patients with T2DM were enrolled randomly from March 2018 to January 2020 in the First Affiliated Hospital of Chongqing Medical University. Patients with T1DM, other special types of DM, other kidney disease or with severe infection, immune dysfunction, or malignant tumor, were excluded. Ultimately, 1432 patients with T2DM were enrolled in a cross-sectional study to elucidate the association between the TyG Index and DKD. Then, 515 individuals with T2DM without DKD underwent physical examination annually. With a median duration of follow-up of 21 (range, 12–24) months, the predictive value of the TyG Index for DKD was investigated (Figure 1).
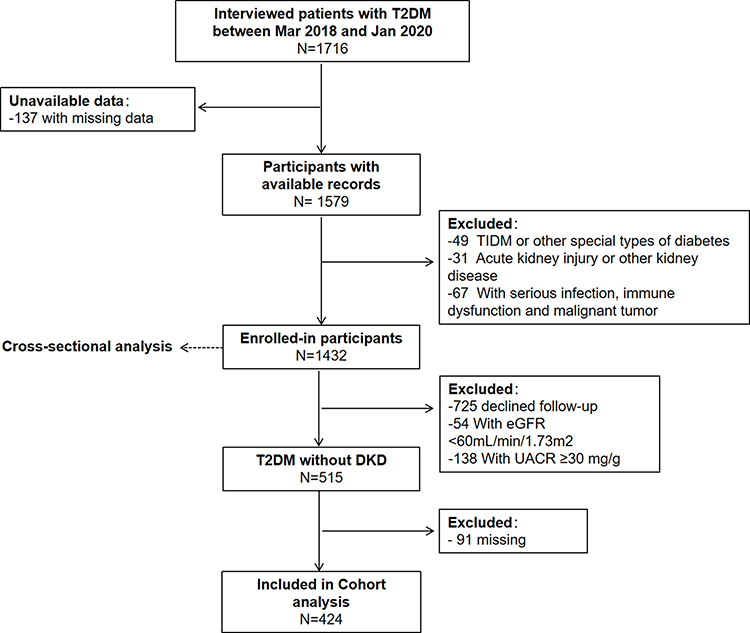 |
Figure 1 Flowchart of the study population. Type-2 diabetes mellitus (T2DM) was diagnosed based on the diagnostic criteria for T2DM set by the World Health Organization in 1999. Data used in this analysis were collected for all participants by the same instruments and methods. |
Data Collection and Measurements
At baseline, each patient received a normative questionnaire for the collection of demographic characteristics, family history of DM, and medical history. These data were collected by physicians using face-to-face interviews.
Height and weight were measured with patients wearing lightweight clothes while shoeless. Then, BMI was calculated. Waist circumference (WC) was measured in the standing position. Blood pressure was measured on the non-dominant arm of seated individuals using an automated electronic device (HEM-7071; Kyoto, Japan) after resting for ≥5 min.
Blood specimens were collected using vacutainers containing the anticoagulant sodium fluoride and centrifuged on site within 2 h of collection. Levels of FBG, total cholesterol (TC), serum TG, high-density lipoprotein-cholesterol, and low-density lipoprotein-cholesterol were measured using an auto-analyzer (7080 series; Hitachi, Tokyo, Japan). The serum level of creatinine, urinary level of creatinine, and albumin were measured by an automatic biochemical analyzer (Modular DDP; Roche, Basel, Switzerland). The urinary microalbuminuria: creatinine ratio (UACR) was calculated. The estimated filtration rate (eGFR) was determined using the Modification of Diet in Renal Disease Study equation (male: eGFR = 186 × SCr−1.154 × year−0.203; female: eGFR = 186 × SCr−1.154 × year−0.203 × 0.724).19 The TyG Index was calculated as: ln [fasting triglycerides (mg/dL) × fasting glucose (mg/dL)/2].
Definitions
The definition of DKD is based on eGFR <60 mL/min/1.73 m2 or continuously increased UACR (>30 mg/g Cr) over 3 months in a patient with T2DM without other types of kidney disease.4 Microalbuminuria is defined as UACR >30 mg/g Cr.4
Statistical Analyses
Statistical analyses were undertaken using SPSS 26.0 (IBM, Armonk, NY, USA). The Kolmogorov–Smirnov Z-test was used to verify continuous variables with a normal distribution. Variables with an approximately normal distribution are expressed as the mean ± standard deviation. Variables with a non-normal distribution are presented as median (interquartile range). The Student’s t-test or Mann–Whitney U-test were employed for group comparisons of continuous variables. Categorical variables are described as a frequency or percentage, and the chi-square test was used for group comparisons.
The TyG Index at baseline was divided into three tertiles, and participants were stratified into groups based on “low”, “median” and “high” values accordingly. The odds ratios (ORs) and 95% confidence intervals (95% CIs) of the median and high-quantile groups were calculated with reference to the low-tertile group. We created three binary logistic regression models in the cross-sectional study, and three proportional hazards models (Cox regression) in the longitudinal study, to estimate the independent association between the TyG Index and DKD while adjusting for potential confounders. The results of the longitudinal study are presented through forest plots using R (www.R-project.org/). The variables in these models are shown in Table 1 or Figure 2. Analyses of receiver operating characteristics curves (ROCs) were undertaken to determine the sensitivity and specificity of the TyG Index for predicting DKD. p < 0.05 was considered significant.
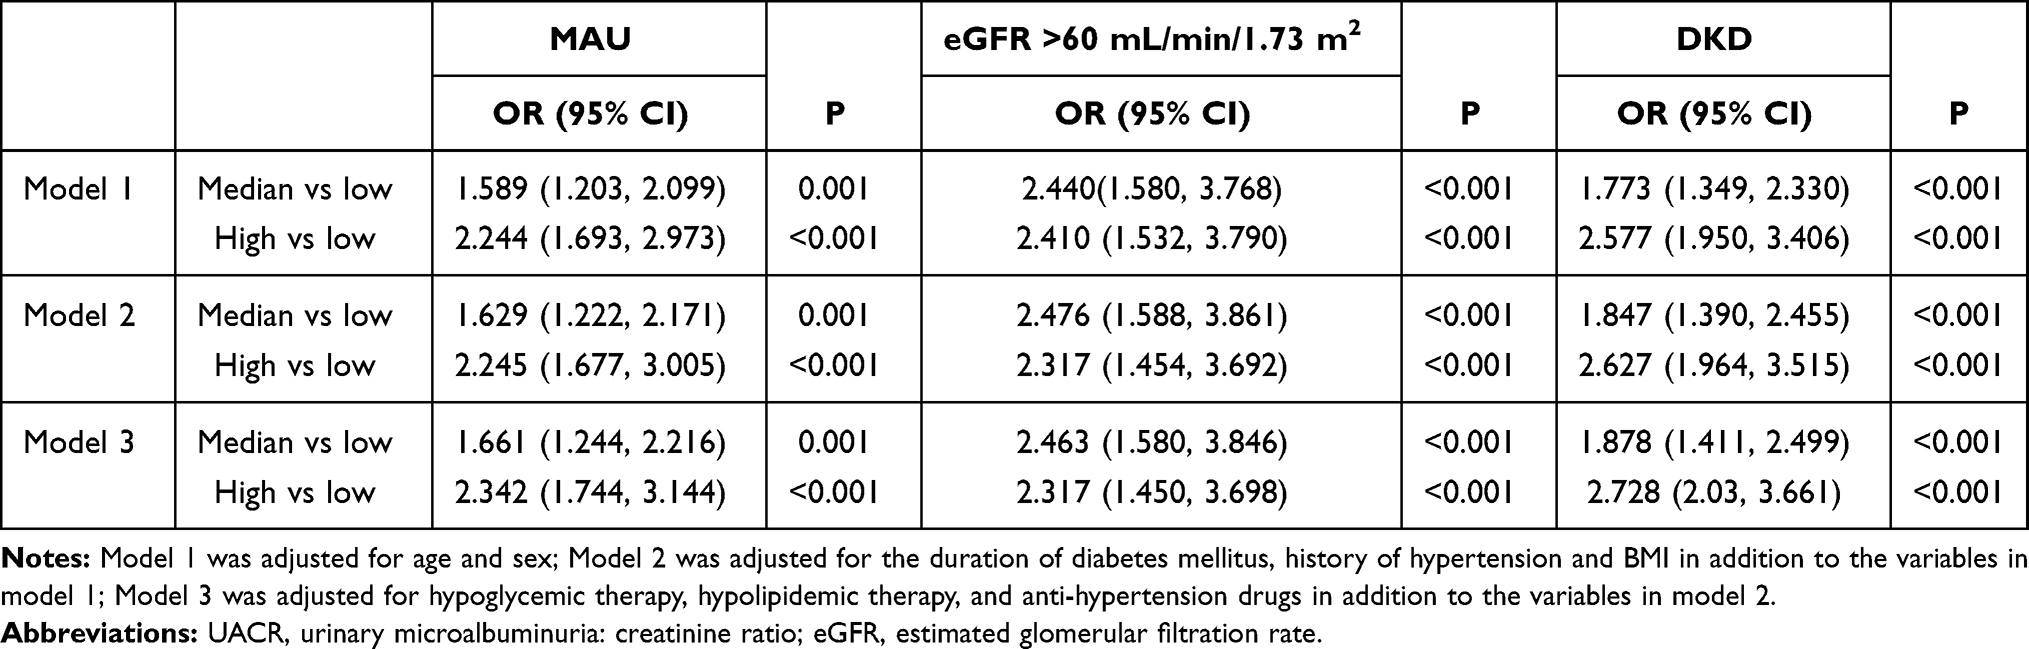 |
Table 1 Binary Logistic Regression for UACR, eGFR and DKD According to the Quartiles of the TyG Index in Cross-Sectional Data |
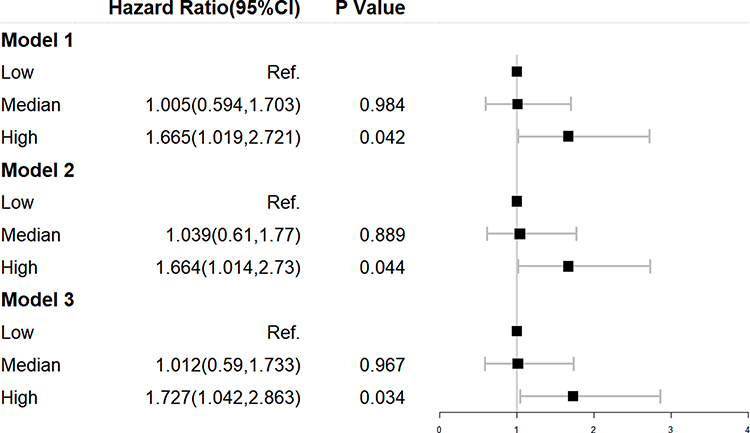 |
Figure 2 Cox regression for DKD according to the tertiles of the TyG Index in longitudinal data. Model 1 was adjusted for age and sex. Model 2 was adjusted for the duration of diabetes mellitus, history of hypertension, and BMI in addition to the variables in model 1. Model 3 was adjusted for hypoglycemic therapy, hypolipidemic therapy, and anti-hypertension drugs in addition to the variables in model 2. |
Results
Characteristics of Study Participants
A total of 1432 participants with DM were included in the cross-sectional analysis. The clinical characteristics of participants grouped by three tertiles of the TyG Index are shown in Table 2. The mean age of participants was 61 (range, 52–68) years, and 57.9% were men. The eGFR showed a significant difference among the three groups if eGFR <60 mL/min/1.73 m2 (p = 0.004). With an increase in the TyG Index, participants tended to be younger, with a higher level of albumin (p < 0.001). In terms of the risk factors for DKD, the proportion of male participants, BMI, WC, and diastolic blood pressure tended to increase along with the TyG Index (p < 0.05 for all).
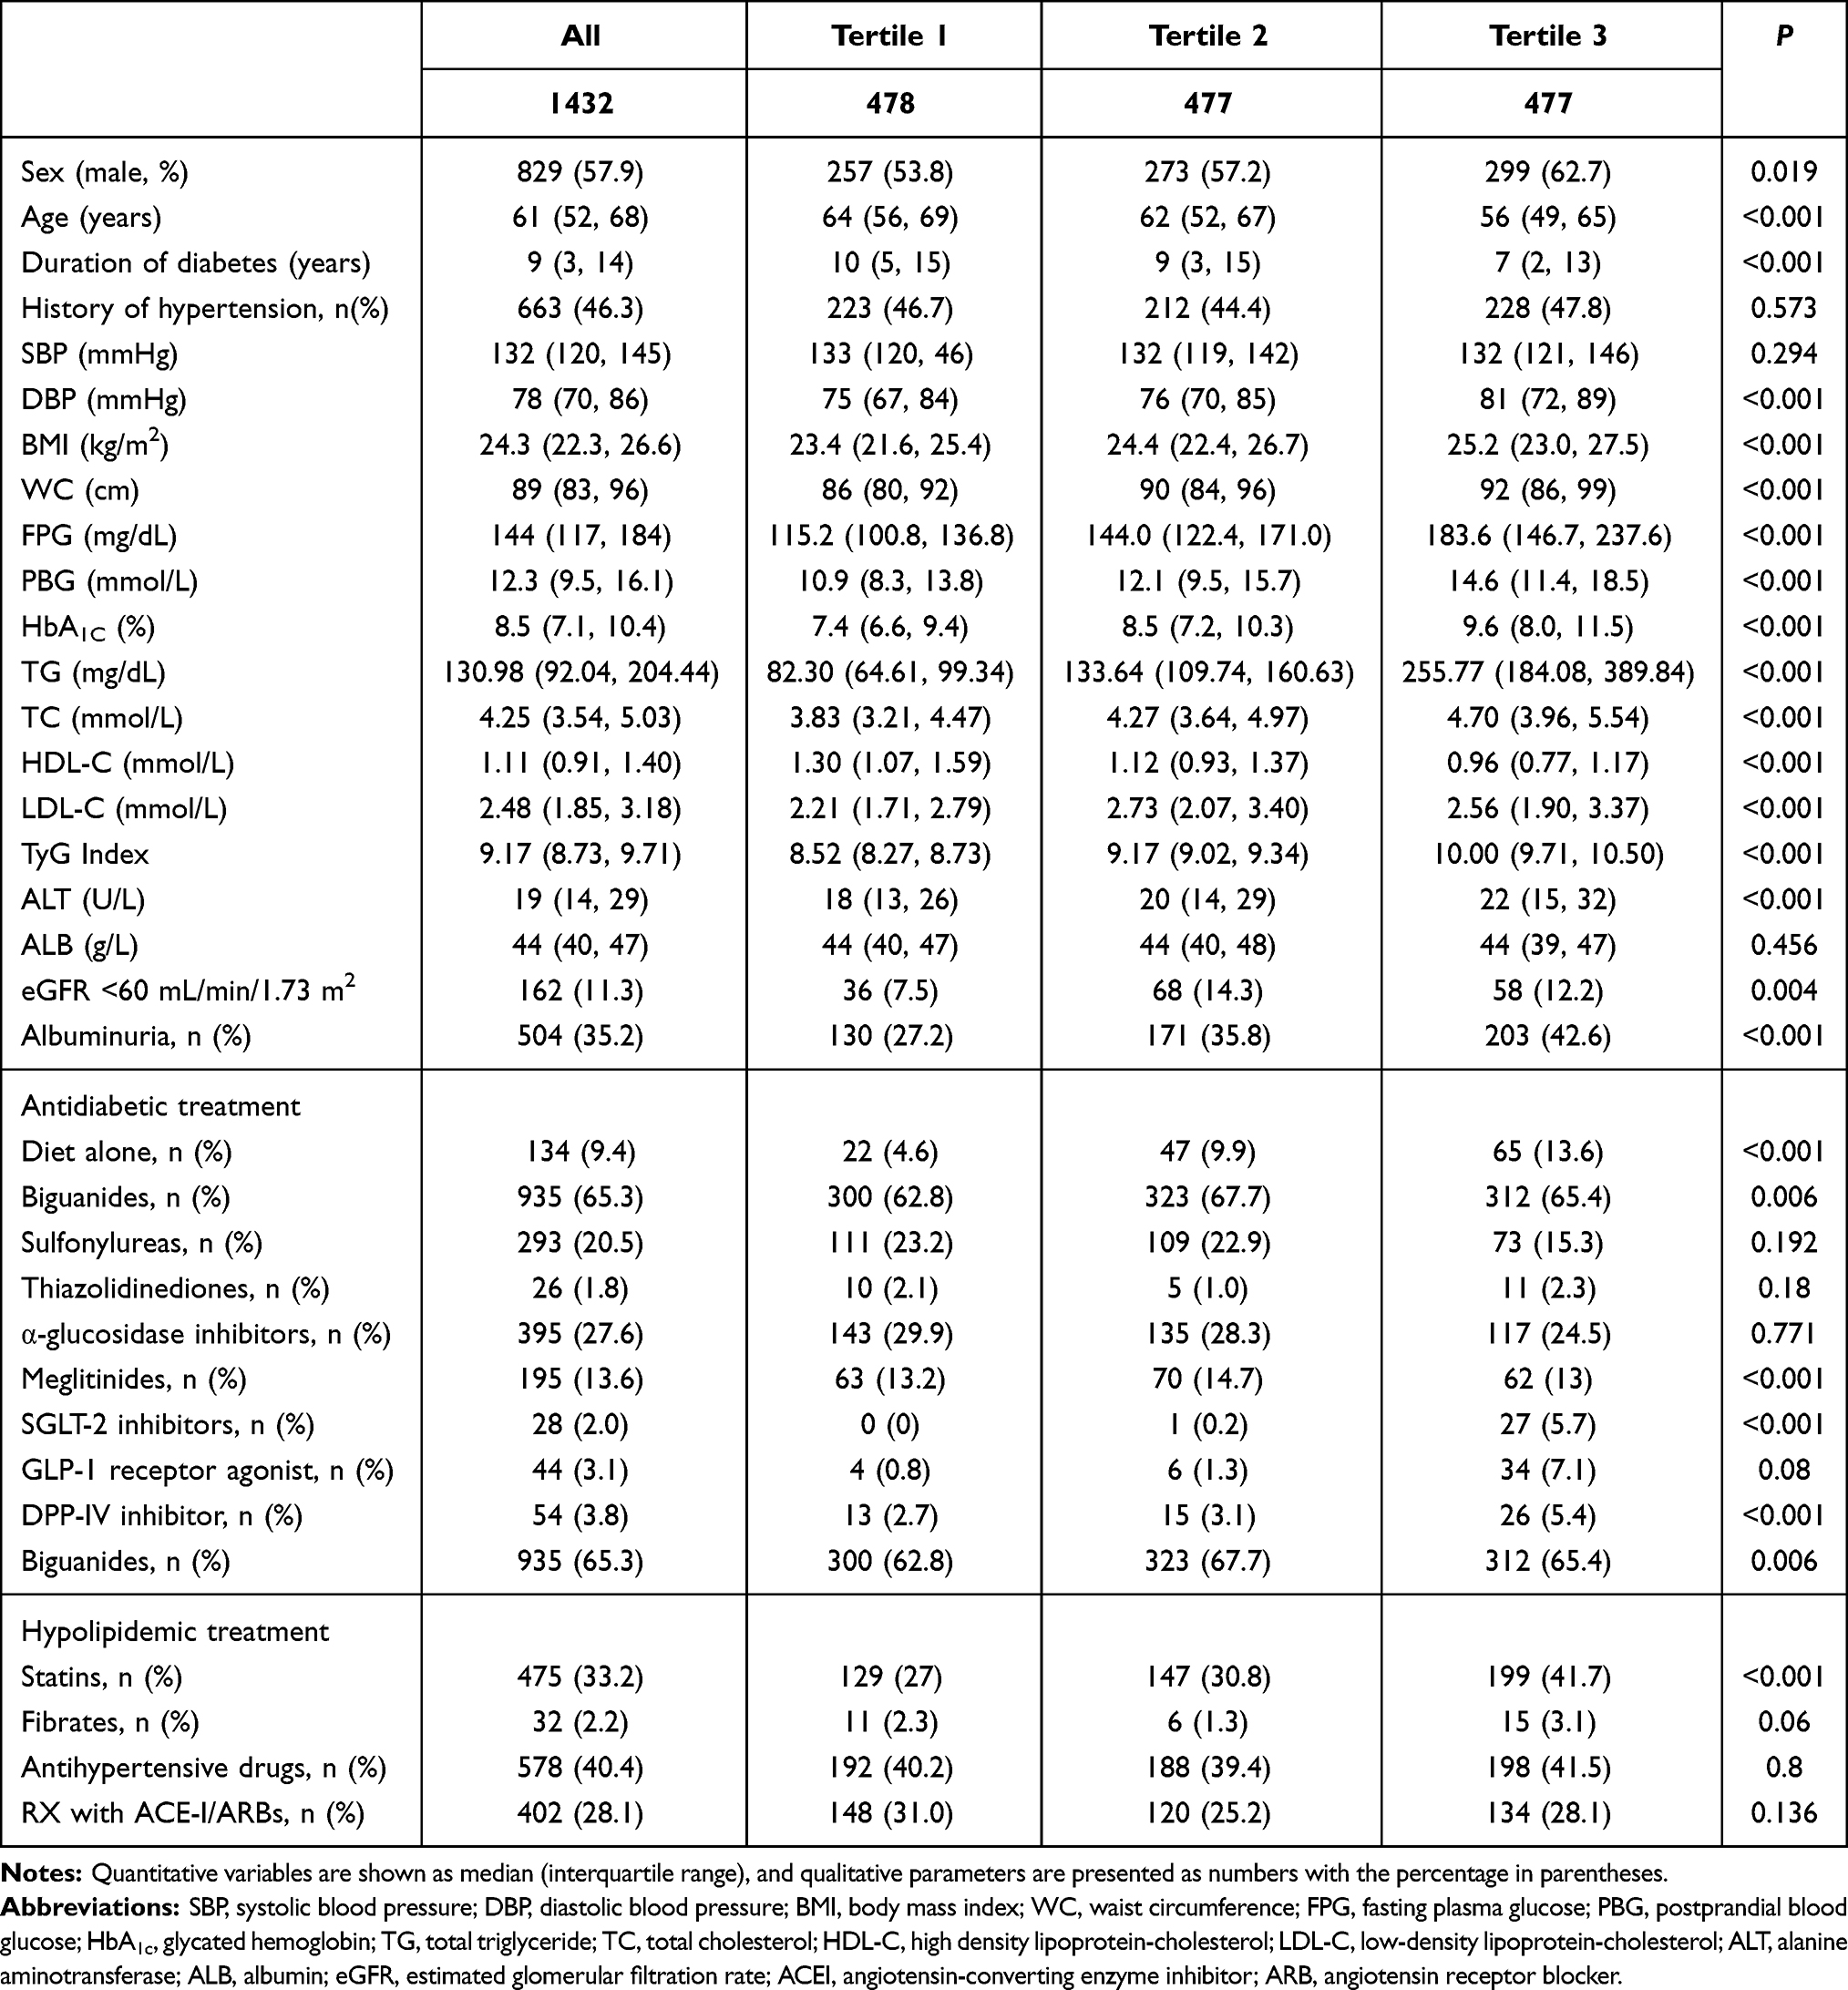 |
Table 2 Characteristics of Participants |
Correlation of the TyG Index with DKD
To assess the correlation of the TyG Index with DKD, we undertook binary logistic regression analysis of cross-sectional data. In model 1, with the low tertile of the TyG Index set as the reference, the TyG Index in the top tertile was associated with a higher OR for microalbuminuria (OR = 2.342, 95% CI =1.744–3.144, p < 0.001), eGFR (1.696, 1.096–2.625, 0.018) and DKD (2.728, 2.030–3.661, <0.001) after adjustment for sex and age (Table 1). After additional adjustment for DM duration, history of hypertension, and BMI (model 2), plus hypoglycemic therapy, hypolipidemic therapy and anti-hypertension drugs (model 3), this trend was retained (Table 1).
The TyG Index for Predicting Incident DKD
To demonstrate the effectiveness of the TyG Index in predicting incident DKD, 424 T2DM patients without DKD were included in the longitudinal study. We observed the value of the TyG Index for predicting DKD using binary logistic regression in four models. In model 1, we adjusted for age and sex and discovered that, compared with patients in low tertile of the TyG Index, participants in the high tertile had a significantly higher risk of DKD (HR = 1.665, 95% CI = 1.019–2.721, p = 0.042). In model 2, we also adjusted for DM duration and history of hypertension coupled with BMI, and found that incident DKD in the high tertile of the TyG Index was also increased. After adjusting for age, sex, DM duration, history of hypertension, BMI, hypoglycemic therapy, hypolipidemic therapy, and anti-hypertension drugs (model 3), participants in the high tertile of the TyG Index continued to have a higher prevalence of incident DKD compared with those in the low tertile (HR = 1.727, 95% CI = 1.042–2.863, p = 0.034) (Figure 2).The area under the ROC curve was 0.69 (range, 0.63–0.76), with sensitivity of 0.713 and specificity of 0.372 (Figure 3).
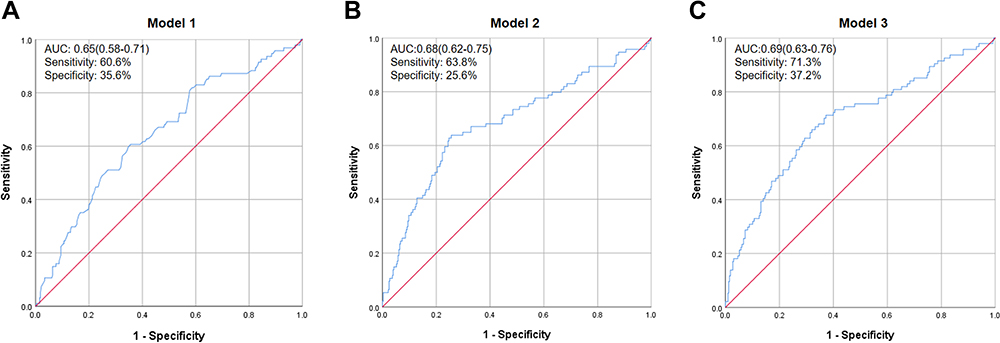 |
Figure 3 Receiver–operator characteristic (ROC) curves of the TyG Index adjusted for different variables to predict DKD in longitudinal data. ROC curves of the TyG Index adjusted for different variables to predict DKD in longitudinal data. (A) Model 1 was adjusted for age and sex. (B) Model 2 was adjusted for the duration of diabetes mellitus, history of hypertension, and BMI in addition to the variables in model 1. (C) Model 3 was adjusted for hypoglycemic therapy, hypolipidemic therapy, and anti-hypertension drugs in addition to the variables in model 2. Abbreviation: AUC, area under the curve. |
Discussion
The present study provides strong evidence that an increasing TyG Index is independently associated with an increased risk of microalbuminuria and decline in the eGFR. A subsequent longitudinal study demonstrated whether the TyG Index could predict DKD occurrence effectively.
Often, the TyG Index is dysregulated if IR occurs. Although the TyG Index is associated with IR measured by the hyperinsulinemic–euglycemic clamp17 or HOMA-IR,18 it performs better than both these measurement.16 Thus, the TyG Index is regarded as a surrogate marker for IR. Studies in non-DM patients have found that the TyG Index has a high positive linear correlation with UACR.23 In a study by Zhao et al, 22.96% of participants had DM.24 They found that an increasing TyG Index was associated with a higher risk of microalbuminuria and chronic kidney disease (CKD) with eGFR ≤60 mL/min/1.73 m2. In a study cohort in Japan, of which 22% had DM, the TyG Index was a predictive factor for CKD prevalence.25 Those studies suggested that the TyG Index is of great value for predicting CKD.
IR has a vital pathophysiologic role in T2DM.26,27 IR is associated with DKD development, but the mechanism of action has not been elucidated fully. Insulin is not only a hormone regulating the glucose level in blood, it is also a signaling molecule in many tissues and cells.28 The kidney has various insulin-sensitive cells (eg, podocytes) which can express insulin receptors (eg, glucose transporter type 4 [GLUT4], and GLUT1).29 If IR occurs, insulin signaling is impaired, and the glomerular filtration pressure increases, resulting in glomerular hyperfiltration.30 Cytoskeletal rearrangement,31 mitochondrial dysfunction,32 inflammation,29 lipid toxicity,33 and other mechanisms are also involved in DKD induced by IR.29
The TyG Index is a proxy of IR,16 therefore it is valuable to understand the association of the TyG Index and kidney disease in DM populations. However, the predictive value of the TyG Index for DKD is less certain. One cross-sectional study showed that the TyG Index is a better surrogate marker than HOMA2-IR for identification of diabetic nephropathy in T2DM patients.20 A recent nested case–control study enrolling >5000 patients with T2DM, 950 of whom had DKD, showed that the TyG Index was correlated with DKD.34 The population in that study was mostly hospital patients, and the eGFR of the case group was 35.79 (range, 14.35–53.42) mL/min/1.73 m2, which represented advanced kidney disease. In T2DM with a comprehensive and continuous spectrum of renal function, the correlation of the TyG Index with kidney disease is unclear, and a longitudinal study is needed to investigate the predictive value of the TyG Index for DKD.
Our cross-sectional study enrolled a relatively large sample with a wide range of eGFR of 94.44 (range, 74.59–113.85) mL/min/1.73 m2, and UACR of 13.0 (range, 4.3–63) mg/g Cr. We found that an increased TyG Index was associated with a high risk of microalbuminuria and reduced eGFR. Furthermore, we investigated the value of the TyG Index in predicting DKD prevalence in a cohort. This is the first longitudinal study to discover the association of the TyG Index with DKD. Furthermore, as a proxy for IR, the TyG Index has the advantage of being clinically applicable because TG and glucose concentrations are measured routinely in DM patients.
Our study had two main shortcomings. First, to avoid invasive injury, we did not take a renal biopsy—the gold standard for DKD measurement—for the definition of DKD. Instead, as recommended by American Diabetes Association guidelines, clinical features and biochemical indicators were used.4 Second, the sample size in the longitude study was relatively small and we failed to follow-up 18% of participants: validation of our data on a larger population is needed.
Conclusions
In T2DM patients, a higher TyG Index was associated with a higher probability of incident DKD. Our study both broadens the horizon on the association between IR and incident DKD, and shows that measurement of the TyG Index in patients with T2DM may be helpful in the early screening of DKD.
Data Sharing Statement
The data that support the findings of this study are available from the corresponding author (e-mail:[email protected]) upon reasonable request.
Acknowledgments
The authors thank nurses Fei Lian, Kun Liao, Xixiang Jiang, Jirong Deng and Xiurong Liu as well as investigators Kanran Wang, Qinyin Zhao and Zhixin Xu of the Chongqing Diabetes Registry group for excellent assistance.
Author Contributions
All authors made a significant contribution to the work reported, whether that is in the conception, study design, execution, acquisition of data, analysis and interpretation, or in all these areas; took part in drafting, revising or critically reviewing the article; gave final approval of the version to be published; have agreed on the journal to which the article has been submitted; and agree to be accountable for all aspects of the work.
Funding
This work was supported by The National Natural Science Foundation of China (81800757); Bethune Merck Diabetes Research Foundation (G2018030); Technological Innovation and Application Development Project of Chongqing (cstc2019jscx-msxmX0207); Chongqing Science and Health Joint Medical Research Project (2020FYYX141; 2018GDRC004); Innovative Funded Project of Chongqing Innovation and Retention Program (cx2019032).Young and Middle-aged Senior Medical Talents studio of Chongqing (yuweifa[2018]29).
Disclosure
Liangjing Lv, Yangmei Zhou, Xiangjun Chen, Lilin Gong, Jinshan Wu, Wenjin Luo, Yan Shen, Shichao Han, Jinbo Hu, Yue Wang, Qifu Li, Zhihong Wang, and Chongqing Diabetes Registry Group declare that they have no relevant conflicts of interest.
References
1. Pugliese G. Updating the natural history of diabetic nephropathy. Acta Diabetol. 2014;51(6):905–915. doi:10.1007/s00592-014-0650-7
2. Afkarian M, Zelnick LR, Hall YN, et al. Clinical manifestations of kidney disease among US adults with diabetes, 1988–2014. JAMA. 2016;316(6):602–610. doi:10.1001/jama.2016.10924
3. Zhang L, Zuo L. Current burden of end-stage kidney disease and its future trend in China. Clin Nephrol. 2016;86(7):27. doi:10.5414/CNP86S104
4. Standards of Medical Care in Diabetes – 2020. 11. Microvascular complications and foot care: standards of medical care in diabetes−2020. Diabetes Care. 2020;43:S135–S151. doi:10.2337/dc20-S011
5. Kidney Disease Outcomes Quality Initiative. KDOQI clinical practice guidelines and clinical practice recommendations for diabetes and chronic kidney disease. Am J Kidney Dis. 2007;49:S12–S154. doi:10.1053/j.ajkd.2006.12.005
6. Plantinga L, Boulware L, Coresh J, et al. Patient awareness of chronic kidney disease: trends and predictors. Arch Internal Med. 2008;168(20):2268–2275. doi:10.1001/archinte.168.20.2268
7. Westreich KD, Mottl AK. Is insulin resistance a useful predictor of outcomes in diabetic kidney disease? J Diabetes Complicat. 2015;29(8):971–973. doi:10.1016/j.jdiacomp.2015.07.024
8. Bjornstad P, Snell-Bergeon JK, Rewers M, et al. Early diabetic nephropathy: a complication of reduced insulin sensitivity in type 1 diabetes. Diabetes Care. 2013;36(11):3678–3683. doi:10.2337/dc13-0631
9. Mottl AK, Lauer A, Dabelea D, et al. Albuminuria according to status of autoimmunity and insulin sensitivity among youth with type 1 and type 2 diabetes. Diabetes Care. 2013;36(11):3633–3638. doi:10.2337/dc13-0568
10. Maahs DM, Snively BM, Bell RA, et al. Higher prevalence of elevated albumin excretion in youth with type 2 than type 1 diabetes: the SEARCH for Diabetes in Youth study. Diabetes Care. 2007;30(10):2593–2598. doi:10.2337/dc07-0450
11. Ahlqvist E, Storm P, Käräjämäki A, et al. Novel subgroups of adult-onset diabetes and their association with outcomes: a data-driven cluster analysis of six variables. Lancet Diabetes Endocrinol. 2018;6(5):361–369. doi:10.1016/S2213-8587(18)30051-2
12. Nerpin E, Riserus U, Ingelsson E, et al. Insulin sensitivity measured with euglycemic clamp is independently associated with glomerular filtration rate in a community-based cohort. Diabetes Care. 2008;31(8):1550–1555. doi:10.2337/dc08-0369
13. Otten J, Ahrén B, Olsson T. Surrogate measures of insulin sensitivity vs the hyperinsulinaemic-euglycaemic clamp: a meta-analysis. Diabetologia. 2014;57(9):1781–1788. doi:10.1007/s00125-014-3285-x
14. Bonora E, Targher G, Alberiche M, et al. Homeostasis model assessment closely mirrors the glucose clamp technique in the assessment of insulin sensitivity: studies in subjects with various degrees of glucose tolerance and insulin sensitivity. Diabetes Care. 2000;23(1):57–63. doi:10.2337/diacare.23.1.57
15. Matthews D, Hosker J, Rudenski A, Nayler B, Treacher D, Turner R. Homeostasis model assessment: insulin resistance and beta-cell function from fasting plasma glucose and insulin concentrations in man. Diabetologia. 1985;28(7):412–419. doi:10.1007/BF00280883
16. Simental-Mendia LE, Rodriguez-Moran M, Guerrero-Romero F. The product of fasting glucose and triglycerides as surrogate for identifying insulin resistance in apparently healthy subjects. Metab Syndr Relat Disord. 2008;6:299–304. doi:10.1089/met.2008.0034
17. Guerrero-Romero F, Simental-Mendia LE, Gonzalez-Ortiz M, et al. The product of triglycerides and glucose, a simple measure of insulin sensitivity. Comparison with the euglycemic-hyperinsulinemic clamp. J Clin Endocrinol Metab. 2010;95:3347–3351. doi:10.1210/jc.2010-0288
18. Kang B, Yang Y, Lee EY, et al. Triglycerides/glucose index is a useful surrogate marker of insulin resistance among adolescents. Int J Obes. 2017;41:789–792. doi:10.1038/ijo.2017.14
19. Fritz J, Brozek W, Concin H, et al. The triglyceride-glucose index and obesity-related risk of end-stage kidney disease in Austrian adults. JAMA Netw Open. 2021;4:e212612. doi:10.1001/jamanetworkopen.2021.2612
20. Liu L, Xia R, Song X, et al. Association between the triglyceride-glucose index and diabetic nephropathy in patients with type 2 diabetes: a cross-sectional study. J Diabetes Investig. 2021;12:557–565. doi:10.1111/jdi.13371
21. Chamroonkiadtikun P, Ananchaisarp T, Wanichanon W. The triglyceride-glucose index, a predictor of type 2 diabetes development: a retrospective cohort study. Prim Care Diabetes. 2020;14(2):161–167. doi:10.1016/j.pcd.2019.08.004
22. Sánchez-íñigo L, Navarro-González D, Fernández-Montero A, Pastrana-Delgado J, Martínez J. The TyG index may predict the development of cardiovascular events. Eur J Clin Invest. 2016;46(2):189–197. doi:10.1111/eci.12583
23. Khan S, Sobia F, Niazi N, Manzoor S, Fazal N, Ahmad F. Metabolic clustering of risk factors: evaluation of Triglyceride-glucose index (TyG index) for evaluation of insulin resistance. Diabetol Metab Syndr. 2018;10:74. doi:10.1186/s13098-018-0376-8
24. Zhao S, Yu S, Chi C, et al. Association between macro- and microvascular damage and the triglyceride glucose index in community-dwelling elderly individuals: the Northern Shanghai Study. Cardiovasc Diabetol. 2019;18(1):95. doi:10.1186/s12933-019-0898-x
25. Okamura T, Hashimoto Y, Hamaguchi M, Obora A, Kojima T, Fukui M. Triglyceride-glucose index is a predictor of incident chronic kidney disease: a population-based longitudinal study. Clin Exp Nephrol. 2019;23(7):948–955. doi:10.1007/s10157-019-01729-2
26. De Cosmo S, Menzaghi C, Prudente S, Trischitta V. Role of insulin resistance in kidney dysfunction: insights into the mechanism and epidemiological evidence. Nephrol Dial Transplant. 2013;28:29–36. doi:10.1093/ndt/gfs290
27. Karalliedde J, Gnudi L. Diabetes mellitus, a complex and heterogeneous disease, and the role of insulin resistance as a determinant of diabetic kidney disease. Nephrol Dial Transplant. 2016;31:206–213. doi:10.1093/ndt/gfu405
28. Gnudi L, Coward RJM, Long DA. Diabetic nephropathy: perspective on novel molecular mechanisms. Trends Endocrinol Metab. 2016;27:820–830. doi:10.1016/j.tem.2016.07.002
29. Coward RJM, Welsh GI, Yang J, et al. The human glomerular podocyte is a novel target for insulin action. Diabetes. 2005;54:3095–3102. doi:10.2337/diabetes.54.11.3095
30. Tiwari S, Sharma N, Gill PS, et al. Impaired sodium excretion and increased blood pressure in mice with targeted deletion of renal epithelial insulin receptor. Proc Natl Acad Sci U S A. 2008;105:6469–6474. doi:10.1073/pnas.0711283105
31. Welsh GI, Hale LJ, Eremina V, et al. Insulin signaling to the glomerular podocyte is critical for normal kidney function. Cell Metab. 2010;12:329–340. doi:10.1016/j.cmet.2010.08.015
32. Sharma K. Mitochondrial hormesis and diabetic complications. Diabetes. 2015;64:663–672. doi:10.2337/db14-0874
33. Opazo-Ríos L, Mas S, Marín-Royo G, et al. Lipotoxicity and diabetic nephropathy: novel mechanistic insights and therapeutic opportunities. Int J Mol Sci. 2020;21(7):2632. doi:10.3390/ijms21072632
34. Shang J, Yu D, Cai Y, et al. The triglyceride glucose index can predict newly diagnosed biopsy-proven diabetic nephropathy in type 2 diabetes: a nested case control study. Medicine. 2019;98(46):e17995. doi:10.1097/MD.0000000000017995
 © 2021 The Author(s). This work is published and licensed by Dove Medical Press Limited. The full terms of this license are available at https://www.dovepress.com/terms.php and incorporate the Creative Commons Attribution - Non Commercial (unported, v3.0) License.
By accessing the work you hereby accept the Terms. Non-commercial uses of the work are permitted without any further permission from Dove Medical Press Limited, provided the work is properly attributed. For permission for commercial use of this work, please see paragraphs 4.2 and 5 of our Terms.
© 2021 The Author(s). This work is published and licensed by Dove Medical Press Limited. The full terms of this license are available at https://www.dovepress.com/terms.php and incorporate the Creative Commons Attribution - Non Commercial (unported, v3.0) License.
By accessing the work you hereby accept the Terms. Non-commercial uses of the work are permitted without any further permission from Dove Medical Press Limited, provided the work is properly attributed. For permission for commercial use of this work, please see paragraphs 4.2 and 5 of our Terms.