")
Back to Journals » Patient Preference and Adherence » Volume 18
Reimagining Medication Adherence: A Novel Holistic Model for Hypertension Therapy
Authors Schäfer C
Received 26 October 2023
Accepted for publication 14 January 2024
Published 12 February 2024 Volume 2024:18 Pages 391—410
DOI https://doi.org/10.2147/PPA.S442645
Checked for plagiarism Yes
Review by Single anonymous peer review
Peer reviewer comments 4
Editor who approved publication: Dr Jongwha Chang
Christian Schäfer
Department of Business Administration and Health-Care, Baden-Württemberg Cooperative State University Mannheim (DHBW), Mannheim, Germany
Correspondence: Christian Schäfer, Department of Business Administration and Health-Care, Baden-Württemberg Cooperative State University Mannheim (DHBW), Coblitzallee 1-9, Mannheim, 68163, Germany, Tel +49 621 4105 1326, Email [email protected]
Purpose: Patients’ adherence to the prescribed therapy is influenced by several personal and social factors. However, existing studies have mostly focused on individual aspects. We took a holistic approach to develop a higher-level impact factor model.
Patients and Methods: In this independent, non-interventional, cross-sectional and anonymous study design the pharmacist recruited patients who entered the pharmacy and handed in a prescription for a blood pressure medication. The patients received a paper questionnaire with a stamped return envelope to volunteer participation. A total of 476 patients in Germany who reported having at least high normal blood pressure according to the Global Hypertension Practice Guidelines were surveyed. In this study, each patient received an average of 2.49 antihypertensive prescriptions and 7.9% of all patients received a fixed-dose combination. Partial least squares structural equation modeling was performed for model analytics since it enables robust analysis of complex relationships.
Results: Emotional attitude, behavioral control, and therapy satisfaction directly explained 65% of therapy adherence. The predictive power of the out-of-sample model for the Q2-statistic was significant. The patient’s overall therapy satisfaction determined medication adherence. The medication scheme’s complexity also influenced the adherence levels. Therapy satisfaction was significantly shaped by the complexity of the medication scheme, behavioral control, and emotional attitude. The results demonstrated the superior performance of fixed-dose combinations against combinations of mono-agents according to the adherence level. Additionally, patient-physician and patient-pharmacist relationships influenced behavioral control of medication therapy execution. According to the A14-scale to measure the level of adherence, 49.6% of patients were classified as adherent and the remainder as non-adherent.
Conclusion: The results enable healthcare stakeholders to target attractive variables for intervention to achieve maximum effectiveness. Moreover, the proven predictive power of the model framework enables clinicians to make predictions about the adherence levels of their hypertensive patients.
Keywords: compliance, hypertension, theory of planned behavior, PLS-SEM, mediation
Introduction
Medication adherence is defined as “the degree to which a person’s behavior corresponds with the agreed recommendations from a healthcare provider”.1 According to the World Health Organization, about 50% of patients with chronic diseases take their long-term medications regularly.2,3 In the United States, approximately 3–10% of annual healthcare costs ($100–300 billion) are attributable to medication non-adherence.4 With 40–45% of people in the Western world having at least one chronic disease, lack of adherence to treatment is not only costly to healthcare systems but also deeply embedded in society.5,6 These data stress the high unmet need for interventions to improve therapeutic adherence.
According to the literature, therapy adherence is a complex system with many interrelated and influencing factors.7 The following major factors impact adherence behavior:8–12 social peer groups, self-competence to execute the therapy, attitudes and emotions when coping with therapy, sociodemographic and economic factors, disease-related aspects, complexity of the therapy scheme, satisfaction with the therapy, and assistance from important stakeholders such as physicians or pharmacists.
Previous studies have mostly focused on analyzing individual aspects of adherence behavior to understand them. It is important to plan detailed interventions and understand the micro-setting as much as possible; however, this approach risks overseeing the overall positive or negative impacts of an intervention on other major variables in a patient’s global adherence decision-making process. This lack of understanding of the broader relationships7,10,13,14 was addressed in our interdisciplinary study. From a therapeutic area perspective, recently published broad multi-factor studies on medication adherence in various conditions include the context of stroke,15 type 2 diabetes mellitus,16,17 breast cancer,18 tuberculosis19 and medication, but not in the context of hypertension, which this study investigates.
According to Dima et al20 and Bergner et al,21 understanding adherence behavior from a bird’s-eye-view perspective for intervention planning is a
critical challenge for all stakeholders in the healthcare value chain. (patients, providers such as physicians, product intermediaries such as pharmacists, producers such as the life science industry, insurance companies, and the government).
We developed a holistic and higher-level patient adherence model to explain and predict overall patient adherence behavior.
This study is significant for the following reasons. First, healthcare professionals should have a holistic view of the major factors affecting therapy adherence within one model. Specific models that perfect certain effects in detail are often used to analyze isolated interventions. These models risk overseeing the feedback effects of the intervention on other key drivers. Second, to invest marketing resources effectively in an intervention and maximize return, it is critical to understand the key drivers of adherence from a big-picture perspective. Without knowing the relative and total effect sizes, informed investment allocations are difficult for healthcare professionals. The approach to validate our holistic and complex adherence behavior model is based on partial least square structural equation modeling (PLS-SEM).22
We analyzed adherence in German hypertensive patients because in Germany 55% of the population aged 35–64 is hypertensive, which is the highest rate worldwide.23 Furthermore, the estimated cost of uncontrolled hypertension in Germany is the highest in Europe.24,25
The following section discusses the theoretical arguments and elaborates on the conceptual framework of the holistic patient adherence behavior model. Then the empirical settings and testing procedures are presented, followed by the findings. The remaining two sections elaborate on the findings and conclude the study, respectively.
Conceptual Background
Therapy adherence or loyalty comprises both attitudinal and behavioral aspects7,10,26 that are affected by relational and evaluative factors. This attitudinal and behavioral framework represents the core of Ajzen’s27 theory of planned behavior (TPB) which has been successfully applied to multiple studies on health behavior.28–30 Following the TPB, human behavior is directed by three considerations: 1) evaluations of the likely consequences of the behavior; 2) beliefs about the normative expectations of others; and 3) belief in the control over their own capabilities.31 Subsequently, these considerations generate a favorable or unfavorable attitude towards the behavior (hypothesis H1a, see Figure 1); normative beliefs generate an apparent social pressure, and finally, belief about own control offers confidence in perceived behavioral control or self-competence (hypothesis H2a).32
The TPB is an extension of the theory of reasoned action (TRA).26 According to Harvey and Lawson,33 both theories consider the behavioral intention of a person as a function of two major aspects. First, the patient’s attitude toward the behavior and judgment of performing it. This mindset refers to expectations and assessments of the behavior’s outcomes. Second, the patient’s perception of social pressure to exhibit a behavior and if motivated enough, to comply with that pressure (ie, wants approval from important people such as family, friends, physician, or pharmacist).33 Considering this, both TPB and TRA are the theoretical foundations of our conceptual model for higher-level patient adherence behavior modeling. Consequently, the three aforementioned constructs of attitude, behavioral control, and social norms were assumed to be the core theoretical drivers of a patient’s adherence to the decision-making process. Furthermore, social norm-associated constructs such as the patient-physician and patient-pharmacist relationships were assumed to shape the patient’s adherence to the decision-making process.10,12,34
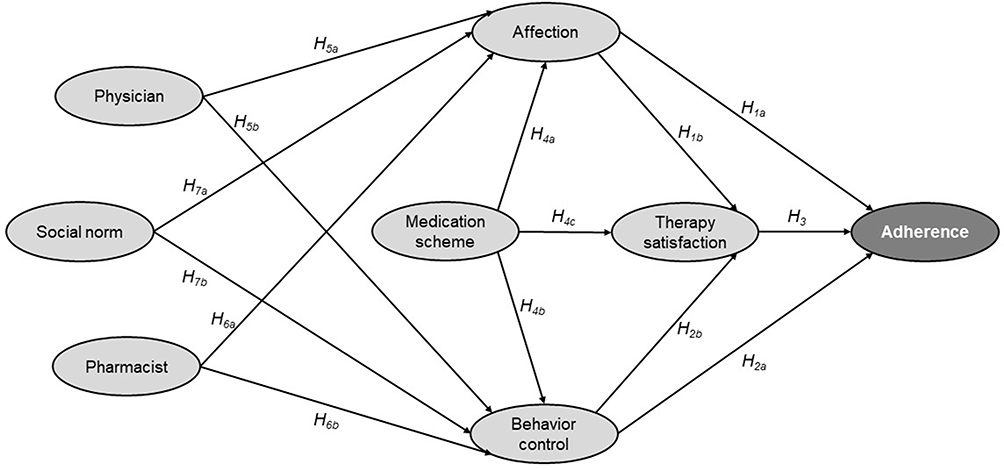 |
Figure 1 Overview of the conceptual framework model. |
Expansion of Framework to Include Therapy Satisfaction and Medication Scheme
We integrated the construct of therapy satisfaction into the conceptual framework model (Figure 1) based on the theories of customer loyalty research.35,36 There is evidence of a strong direct association between satisfaction and loyalty,37 which in our case, is loyalty to therapy or adherence (hypothesis H3).
Satisfaction is a multidimensional dependent construct,38 reflecting the overall satisfaction with therapy—a consequence of a patient’s experience with the medication prescribed by the doctor (hypothesis H4c), practical self-regulated therapy execution (hypothesis H2b), and emotional therapy experiences (hypothesis H1b).39 According to Bolton and Lemon,40 satisfaction develops, and it mediates customer experience with a product or service (behavioral control and attitude) as well as influences loyalty or adherence (hypothesis H8). Following the theoretical framework (Figure 1) and empirical findings, the prescribed medication,8,41,42 patients’ behavioral control, and their emotional attitude directly impact the latent construct of therapy satisfaction (hypothesis H9).
Ibrahim et al1 presented a foundation for the association between medication experience, patients’ beliefs (TPB and TRA), and medication adherence. Psarou et al43 argued in the same direction based on their empirical findings that stated that a patient’s medication scheme expresses their attitudes towards drug therapy behavior and emotions. Reflecting on these associations within the conceptual model framework, a direct connection between medication to attitude (hypothesis H4a) and behavioral control (hypothesis H4b) was modeled.
Social Norm, Patient-Physician and Patient-Pharmacist Relationships
The TPB and empirical findings show that social peers impact planned behavior. Empirical findings document that the patient–doctor relationship and opinions of the social norm impact therapy success, at least indirectly.10,44,45 Pharmacists are important stakeholders in the therapy process.46 The assumption holds that a proper relationship between pharmacists and patients should also increase the likelihood of therapy success and improve adherence.47 According to self-efficacy theory, self-efficacy is constantly related to the relationship between the patient and key therapy stakeholders.31,48 A proper and trustful relationship with the physician, the pharmacist, and the social peers enables the patient to improve their self-regulated therapy behavior (hypothesis H5b, H6b, H7b), attitude (hypothesis H5a, H6a, H7a) and manage expectations of the therapy outcome.10,49
Hypotheses
In line with the above-discussed prior research results and theories, the following hypotheses were developed and extracted from the cited literature.
H1a/b: Affection has a significant positive impact on adherence and therapy satisfaction. H2a/b: Behavioral control has a significant positive impact on adherence and therapy satisfaction. H3: Therapy satisfaction has a significant positive impact on adherence. H4a/b/c: The medication scheme has a significant positive impact on affection, behavioral control, and therapy satisfaction and an indirect impact on adherence. H5a/b: The patient–physician relationship has a significant positive impact on affection and behavioral control and an indirect effect on therapy satisfaction and adherence. H6a/b: The patient–pharmacist relationship has a significant positive impact on affection and behavior control and an indirect impact on therapy satisfaction and adherence. H7a/b: Social norms have a significant positive impact on affection and behavioral control and an indirect impact on therapy satisfaction and adherence. H8: Therapy satisfaction mediates the relationship between affection and adherence and between behavioral control and adherence. H9: Affection and behavioral control mediate the relationship between medication schemes and satisfaction with therapy.
Materials and Methods
Empirical Setting and Testing Procedure
This study focused on patient adherence to empirically evaluate the hypotheses. It is significant because not only is it relevant for physicians, care providers, health insurance companies, the pharmaceutical industry, and healthcare policymakers to understand why patients differ in their medication adherence, but it also allows an examination of the situational differences in the relationships of the relevant constructs with adherence. Additionally, the selected setting was unique because different medication schemes were integrated into a structural equation model to assess the overall compliance behavior. This model can be applied to other therapeutic areas in a similar manner.
Ethical Considerations
This independent study is a non-interventional survey. Accordingly, no ethics approval had to be gathered. Nevertheless, to ensure ethical standards, the design and questionnaire of our survey were discussed in detail with medical experts at our institution and participating pharmacists before the research project began. This study met the ethical requirements and standards of the Baden-Wuerttemberg Cooperative State University Mannheim (DHBW), which was confirmed. The paper-based and completely voluntary participation in the interviews guaranteed the anonymity of all participants. Prior to participating in our survey, participants were informed in detail, both in conversation with participating pharmacists and in the written detailed preamble to the paper-based survey, about the scope of the survey, the use of their anonymous data, that participation was completely voluntary, that they could opt-out at any time, and that the survey was compliant with European data protection law, thereby obtaining and ensuring informed consent to the extent possible given an anonymous study design in the context of the Declaration of Helsinki.
Sample and Data Description
Prior to conducting our sample, we conducted a pretest with a sample size of n=43 participants. Compared to the questionnaire used to draw the main sample, additional questions were included in this pretest to verify that the questionnaire captured the content of each construct of interest correctly. For all constructs, content validity was successfully established by the pretest.
The research design is based on a random sample of n=523 hypertension patients in Germany which might make the findings specific to this population. The samples were collected between September 2020 and May 2022. Data were collected with a paper-based questionnaire handed out by pharmacists to customers who purchased antihypertensive drugs in their stores.
When we established the inclusion criteria for this study, we defined patients as those who went to the pharmacy and handed in a prescription for hypertension treatment. No further sampling methods or guidelines were provided to the participating pharmacists. This study design could possibly have led to a selection bias by the pharmacist, who proactively presented the possibility of participating in our survey-based research project to the patient. Table 1 provides an overview of the general structure of our sample.
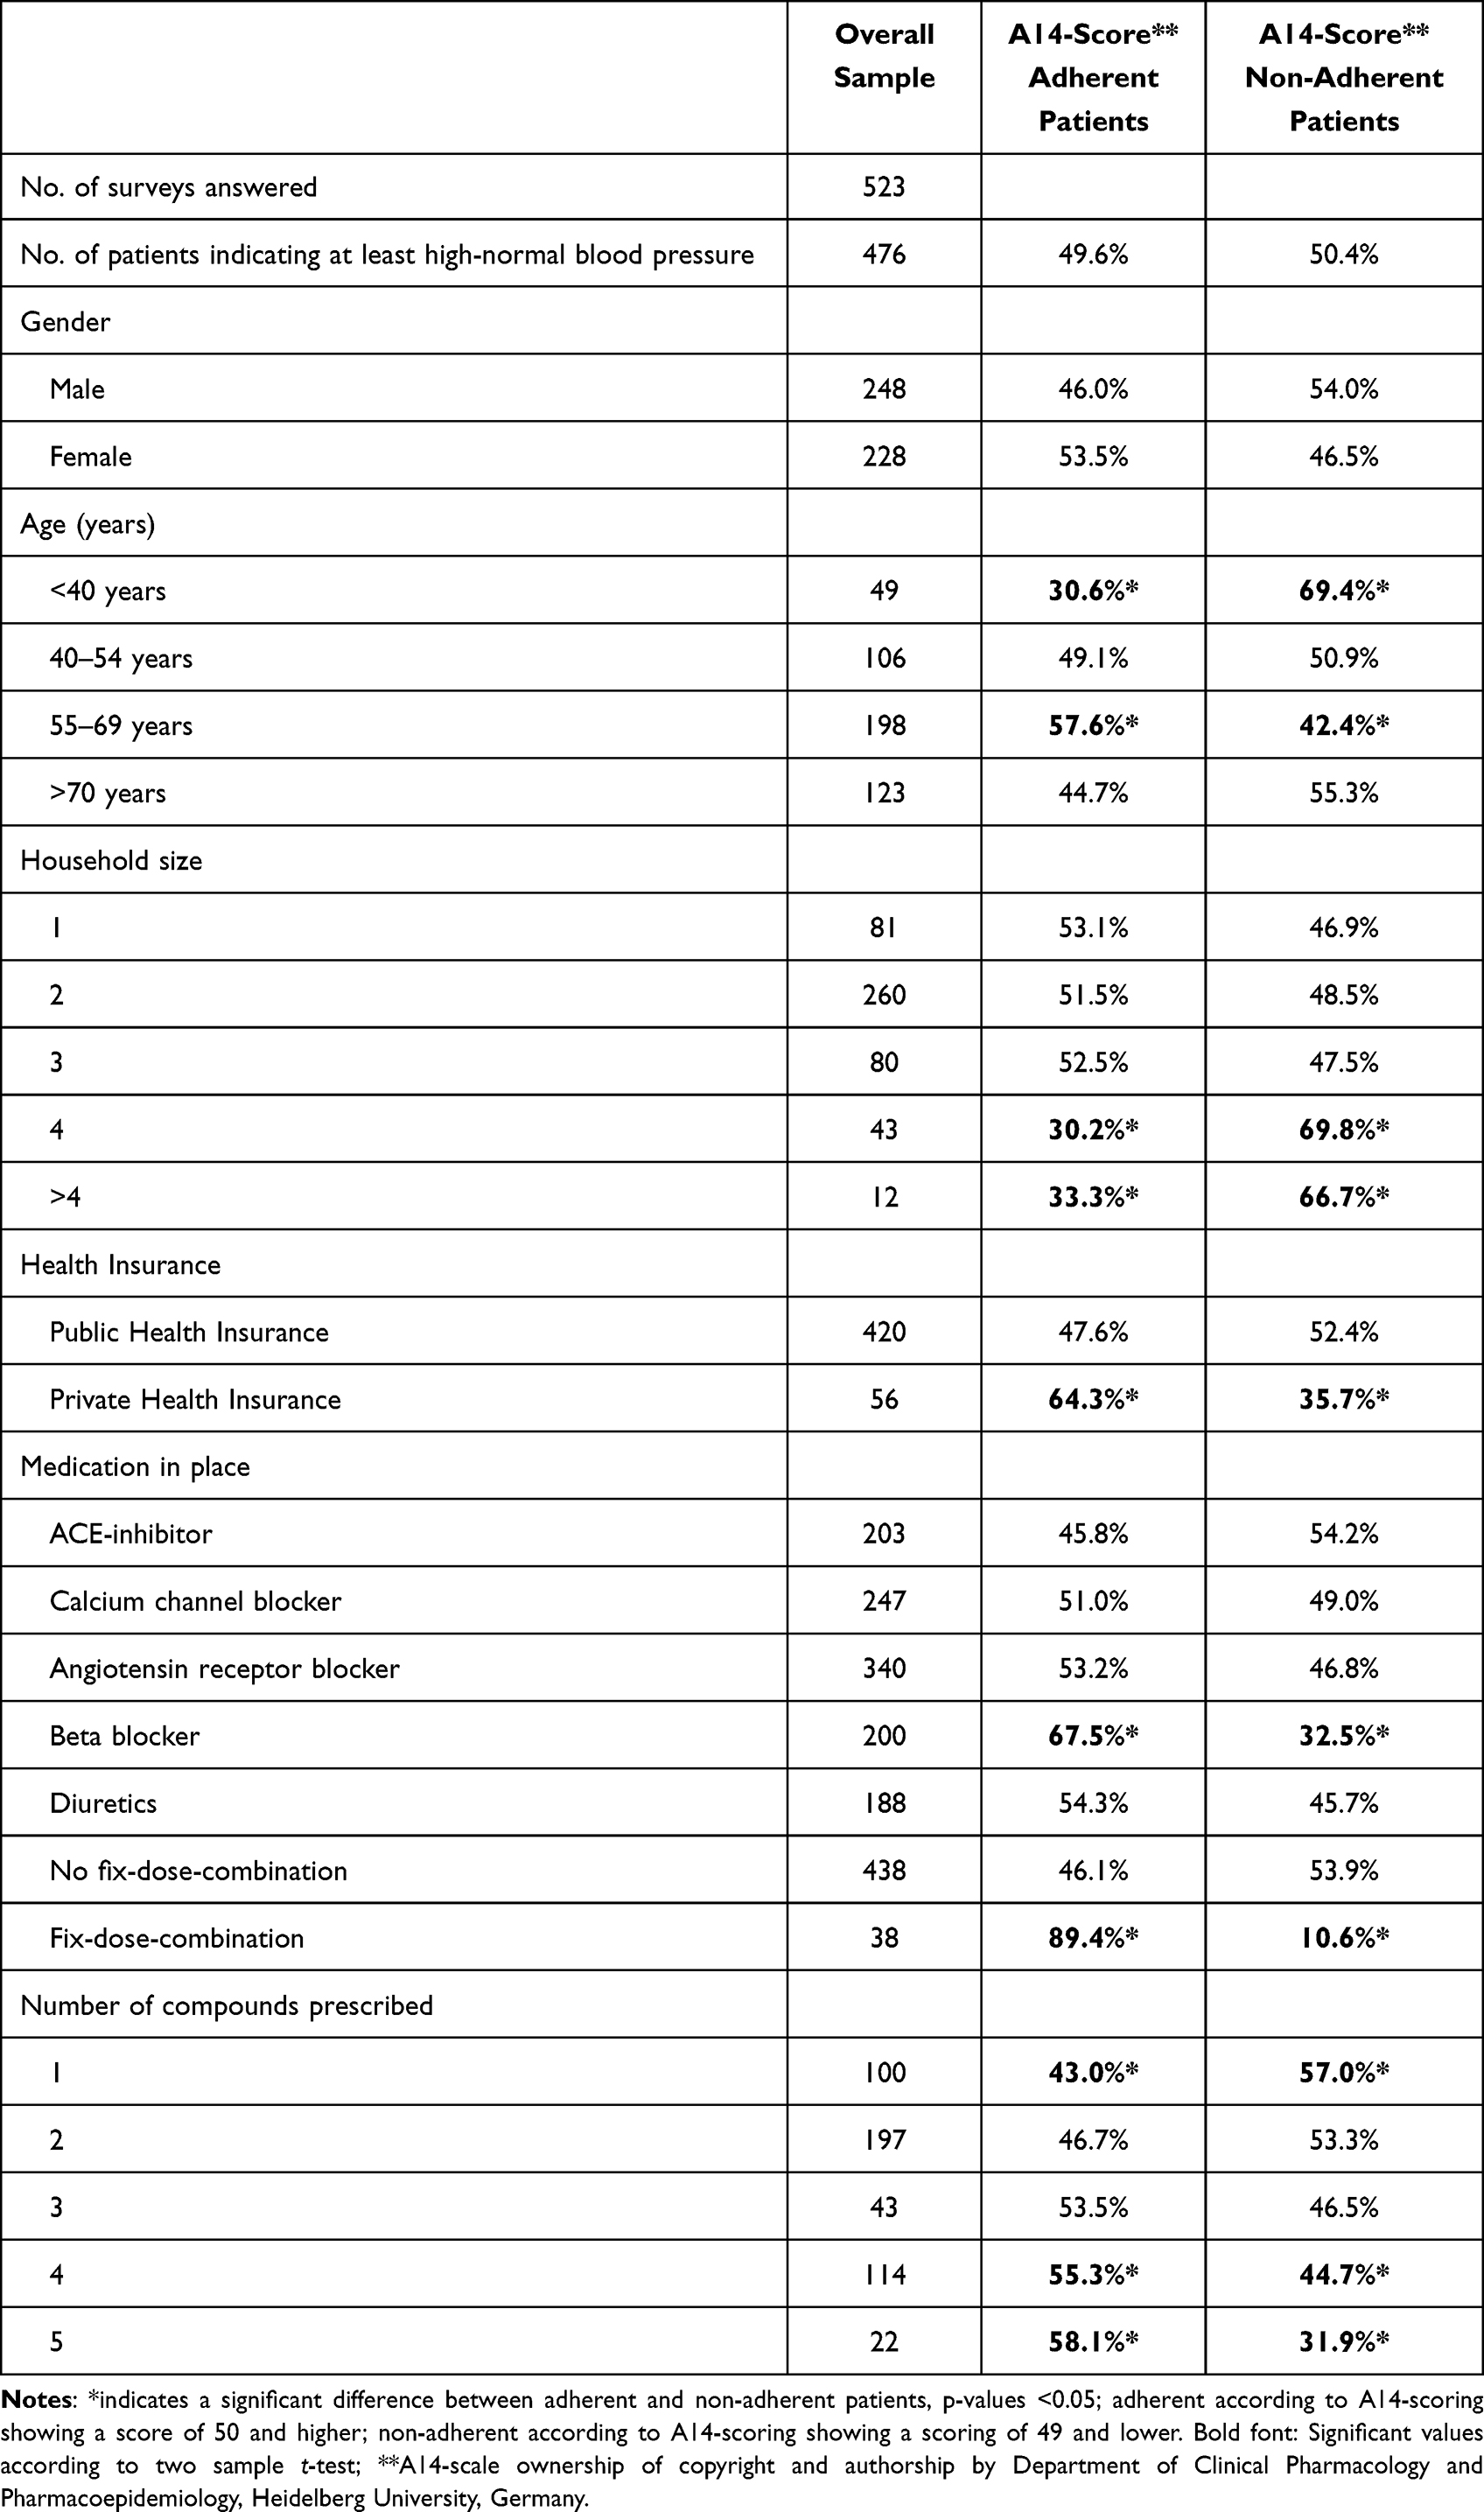 |
Table 1 Baseline Characteristics of the Study Sample Comparing A14-Scorings50 |
Patients received the questionnaire - including a data privacy notice - and a stamped return envelope to send anonymous answers directly to the DHBW. The patient then filled out the questionnaire at home, put it in the free return envelope, and sent it back to DHBW by mail. This procedure guaranteed the anonymity of the participants since no names, address data, or birth data were collected. Due to an initial screening process, this study only includes patients, with at least high normal blood pressure according to the latest Global Hypertension Practice Guidelines.41 This results in an effective data set of n=476 respondents for further analysis.
Therapy adherence was measured using the established A14-scale50 (see Table 2 for the individual items). Chatziefstratiou et al51 successfully validated this scale by comparing it with the eight-item Morisky Medicine Adherence Scale52 in a study on hypertension in Greece. We chose the broader A14-scale50 to obtain a detailed picture of the characteristics of patients’ adherence. The A14-scale50 ranges from 0 to 56. An A14-score50 of 50 or higher indicates adherent behavior. A14-scores50 of 49 and lower are considered non-adherent. Figure 2 provides an overview of the A14-adherence50 distribution of the n=476 sample used for further analysis. Approximately 49.6% of patients are classified as adherent and 50.4% as non-adherent. This proportion is very close to the figures reported by Ibrahim et al1 and WHO.2
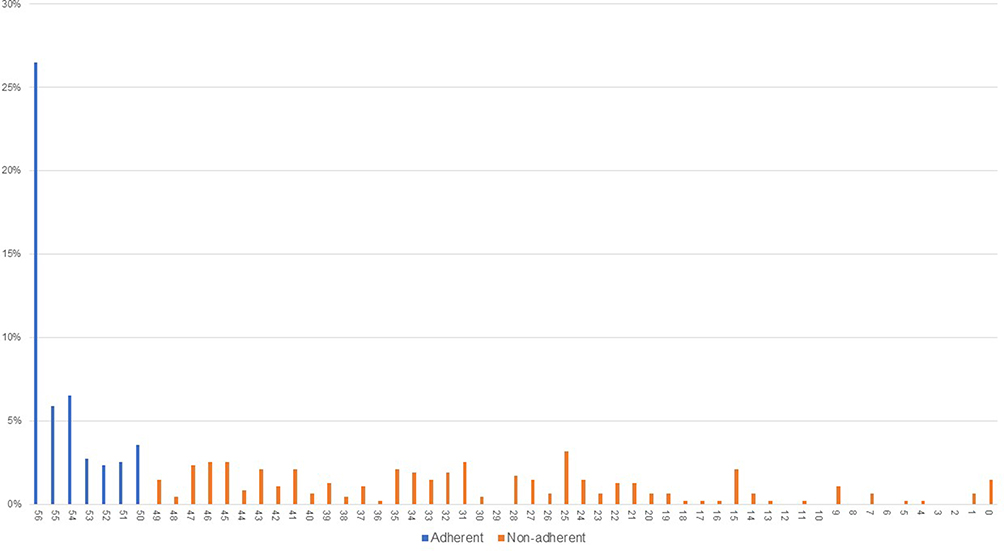 |
Figure 2 Adherence distribution of the sample according to the A14-scoring.50 |
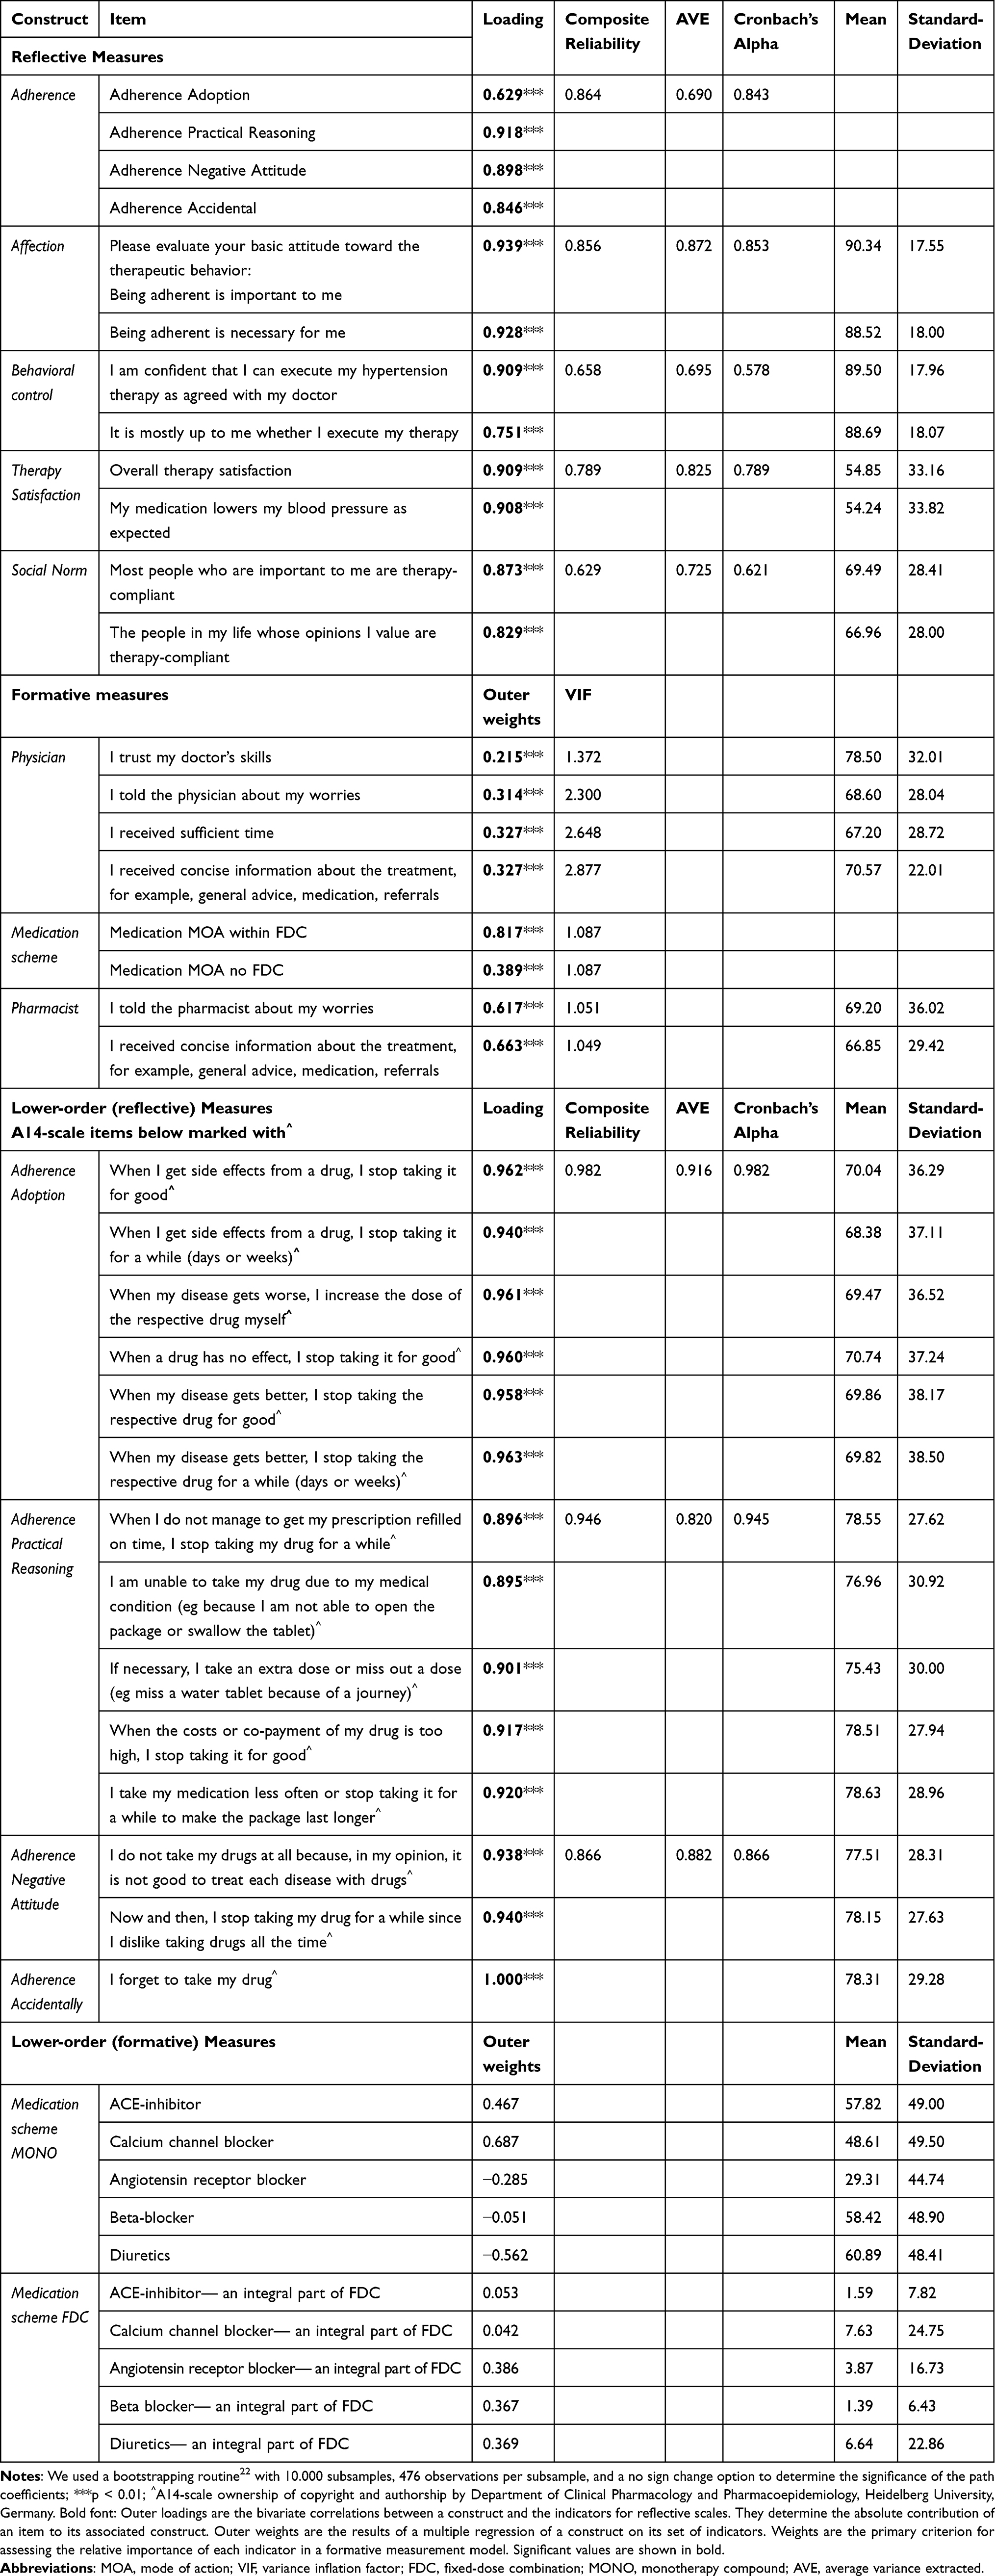 |
Table 2 Measurement Model Results |
To gauge the potential biases of this research, it is important to have a comparative understanding of the demographic variables of age and gender within the sample and hypertension patients in Germany. The respondents were aged between 18 and 87 years. The average age was 59.2 years compared with approximately 64 years in the overall population of German patients with hypertension. Regarding sex, 52.1% of the respondents were male compared with 58% in the overall population of German patients with hypertension (see Table 1). As the age and sex of our sample were quite similar to the total population of all German patients with hypertension, no further weighting scheme was applied to this analysis. In our sample, 7.9% of patients received a fixed-dose combination (FDC). In comparison, the market share of FDCs of all antihypertensive prescriptions in Germany in 2020 was 11%.8 On average, each patient in our sample was prescribed 2.49 different agents to control blood pressure.
For generalizability of our results, aspects such as different population characteristics, cultural factors,34 socioeconomic status, and educational level of patients in other countries, as well as different characteristics of health care systems,31 should be taken into account but were not within the scope of our model due to the limited number of questions asked to participants.
Measures
To gauge patients’ adherence, affection, behavioral control, therapy satisfaction, patient–physician relationships, patient–pharmacist relationships, and social norms, we adapted established and validated measures. Table 2 displays all constructs and their respective measurement items. The measures for affection, behavioral control, social norms, and the second item to measure therapy satisfaction refer to Ajzen’s validated TPB questionnaire.53 The first item to measure therapy satisfaction is taken from Johnson et al.54 The items 2 and 4 measuring the quality of patient-physician and both items measuring patient-pharmacist relationships are derived from the validated scales constructed by Ahlen et al.55 Items 1 and 3 to assess the physician-doctor relationships are taken from Landgraf et al.56 The measurement models for patient-physician- and patient-pharmacist relationships are both formatively measured constructs. All items were rescaled into a 1–100 scale for comparison.
To avoid response bias, some items were measured on different scales following the original developers’ recommendations. According to Diamantopoulos, the
general model specification rules for structural equation modeling require the use of reflective measurements for endogenous latent variables; in this case, the model contains formative exogenous variables to secure model identification.57
Consequently, we used a reflective measurement scale to capture the endogenous target variable adherence.
Therapy adherence was measured using the established reflective A14-scale50 (see Table 2 for the individual items). Chatziefstratiou et al51 successfully validated this scale by comparing it with the eight-item Morisky Medicine Adherence Scale52 in a study on hypertension in Greece. We chose the broader A14-scale50 to obtain a detailed picture of patients’ adherence behavior characteristics. Adherence is a hierarchical component in the PLS path model because it has four lower-order subcomponents.58 We used a reflective–reflective hierarchical-order model and a common two-stage approach for this construct and its lower-order components.59 According to Jarvis et al60 the chosen specification is a Type I model, which uses reflective first-order factors of adherence, as suggested by the authors of the A14-scale.50 Furthermore, reflective second-order factors were used to measure the respective constructs. Therefore, following Bagozzi and Heatherton61 we used a total disaggregation second-order factor model for the target construct adherence.
Behavioral control of therapy execution and affection toward hypertension therapy were measured reflectively using two items for each following Ajzen.53 The two items measuring emotional attitudes according to the therapy execution were introduced by the following statement at the very beginning of the questionnaire to grasp the spontaneous emotional attitude against therapy execution, “Please evaluate your general attitude toward therapeutic behavior” (see Table 2). This up-front positioning of the questions according to spontaneous emotional attitudes toward the course of therapy within the questionnaire is important for measuring affection optimally. The construct of therapy satisfaction was modeled reflectively with two items: 1) the overall satisfaction with therapy based on Johnson et al’s54 customer satisfaction index model, and 2) satisfaction with medication performance to control blood pressure according to Ajzen’s53 TPB questionnaire. The patient’s social norm was the final construct measured reflectively using two items from Ajzen’s62 questionnaire on TPB. The two constructs of patient-physician and patient-pharmacist relationships were formatively modeled. The former used four items, three of which were adapted from Ahlén et al55 and one from Landgraf et al.56 The patient-pharmacist relationship was measured by two items adapted from Ahlén et al55 (Table 2 for further details).
Similar to adherence, medication was a hierarchical component of the PLS path model because it had two lower-order subcomponents. Based on the study by Becker et al59 we used formative–formative hierarchical component PLS path models and a two-stage approach for the construct and its lower-order components. Following Jarvis et al,60 the chosen formative–formative specification is a Type IV model that uses formative first-order factors to assess the dimensions of medical treatment and formative second-order factors to measure the particular constructs. As the composition of the prescribed medicine mix determines the latent variables, a formative modeling approach was chosen. Studies have shown that it is important to differentiate whether medication is administered in a FDC or as a monotherapy (MONO).8,63–65 Accordingly, we reflected these findings in our setup and modeled the medication scheme as a higher-order construct with two arms of latent variables as lower-order subcomponents-MONO and FDC medication schemes. The lower-order constructs were measured dichotomously. According to the latest 2020 Global Hypertension Practice Guidelines,41 the following five modes of action (MOA) cover the standard of care for hypertension: angiotensin-converting enzyme inhibitors, calcium channel blockers, angiotensin receptor blockers, beta-blockers, and diuretics. They are available as MONO or in various combinations in FDC.
Testing Procedure, Method and Sample Size
The method to validate our holistic and complex adherence behavior model is based on partial least square structural equation modeling (PLS-SEM).66 The PLS-SEM was chosen because it achieves high levels of statistical power with small sample sizes, it does not assume the variable distribution as it is a non-parametric method, it incorporates reflective and formative measurement models, and it aims to maximize the explained variance in the dependent variables (R2) and enables testing of the predictive model power.22 The PLS-SEM is a standard approach for complex cause-effect modeling in the social sciences, as evidenced by the exponentially increasing number of PLS-SEM-citations in the literature.66 The estimation of the PLS-SEM model is followed by a measurement-model assessment—including higher and lower-order constructs—structural model assessment, valuation of the model’s predictive power, checking of the explanatory degree, and an analysis of mediation and total effect sizes.
To assess the hypotheses, we used the Software SmartPLS 4.67 First, the reliability and validity of the measurement instruments were verified. Second, a structural equation model analysis was conducted to test the direct effects of hypotheses H1–H7. Third, a mediation analysis was conducted to validate hypotheses H8 and H9.
PLS-SEM is a well-established research method for estimating complex cause-effect relationship models.68 It is particularly suitable to run early-stage theory development and testing and allows the examination of constructs and relationships within complex structural equation models. Compared to other studies, our model with seven constructs explains adherence behavior from a more holistic perspective. In addition, PLS-SEM does not require a large sample size, allows efficient estimation of complex models, and has no assumptions based on the data distributions.22 The guidelines for the PLS-SEM propose that the maximum number of arrows pointing to one construct multiplied by 10 should be the minimum sample size.22 In our study, this was calculated to be 5 × 10, whereas the sample size was n=476, well-above this threshold.
We also calculated the minimum sample size according to Cohen69 to ensure a certain level of test power for our model. To ensure an effect size of 0.15, an assumed significance level of 5%, and a power of 0.95, the sample size should be at least n=472. Our sample of n=476 participants is sufficient.
Results
The structural equation model shown in Figure 3 is an empirical evaluation of the hypotheses. In the subsequent sections, the reflective and formative measurement models are evaluated. Then, the direct effects between the latent variables and the predictive character of the overall model are examined. Finally, mediation, and total effects are investigated.
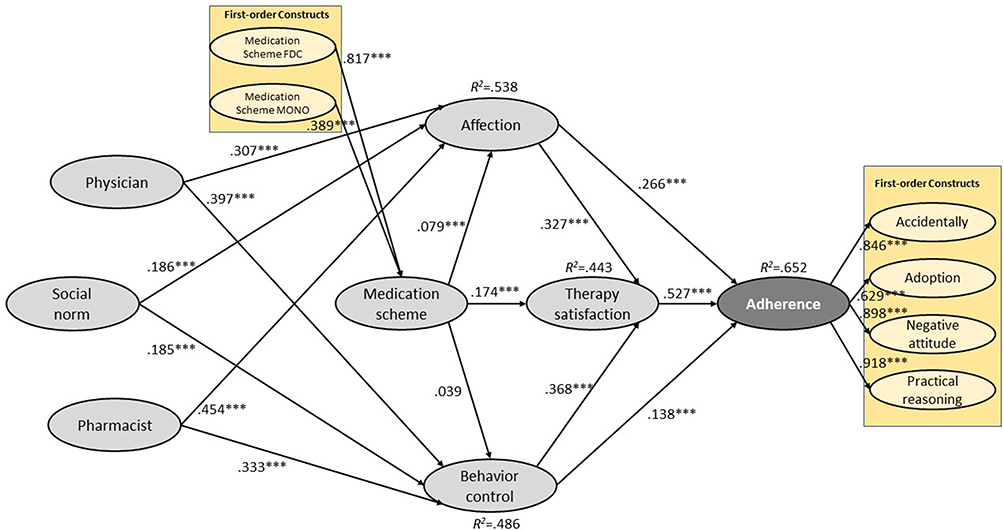 |
Figure 3 PLS path model and results. Abbreviations: FDC, fixed-dose combination; MONO, monotherapy compound. Notes: We used a bootstrapping routine22 with 10.000 subsamples, 476 observations per subsample, and a no sign change option to determine the significance of the path coefficients. ***p < 0.01. |
Measurement Model Evaluation
To assess the reflective measures, the loadings, average variance extracted (AVE), composite reliability, and Cronbach’s alpha were examined. Table 2 presents the results of the analysis. With one borderline exception of behavioral control with Cronbach’s alpha of 0.578 compared with the threshold value of 0.600,22 all other values satisfied the general robustness checks. Since Cronbach’s alpha is the lower bound to assess composite reliability, and results for ρA was 0.658 and ρC – the upper bound - was 0.695, composite reliability for behavioral control was assumed to be achieved.70 All other empirically established reflective constructs, such as social norms, affection, therapy satisfaction, and adherence were reliable and valid (Table 2). We used the heterotrait–monotrait ratio of correlations (HTMT)71 and the Fornell–Larcker criterion22 to assess the constructs’ discriminant validity. Table 3 shows that all HTMT values, except one (0.906), were below the critical values (ie, 0.85 or 0.90). Following Gudergan et al72 we performed an HTMT inference criterion test in this case, where conceptual similarities were likely (between constructs medication satisfaction and adherence) to confirm discriminant validity between these two reflective constructs (ie, the HTMT statistic was significantly below 0.900). The Fornell–Larcker criterion was suitable for all the reflective constructs in this study.
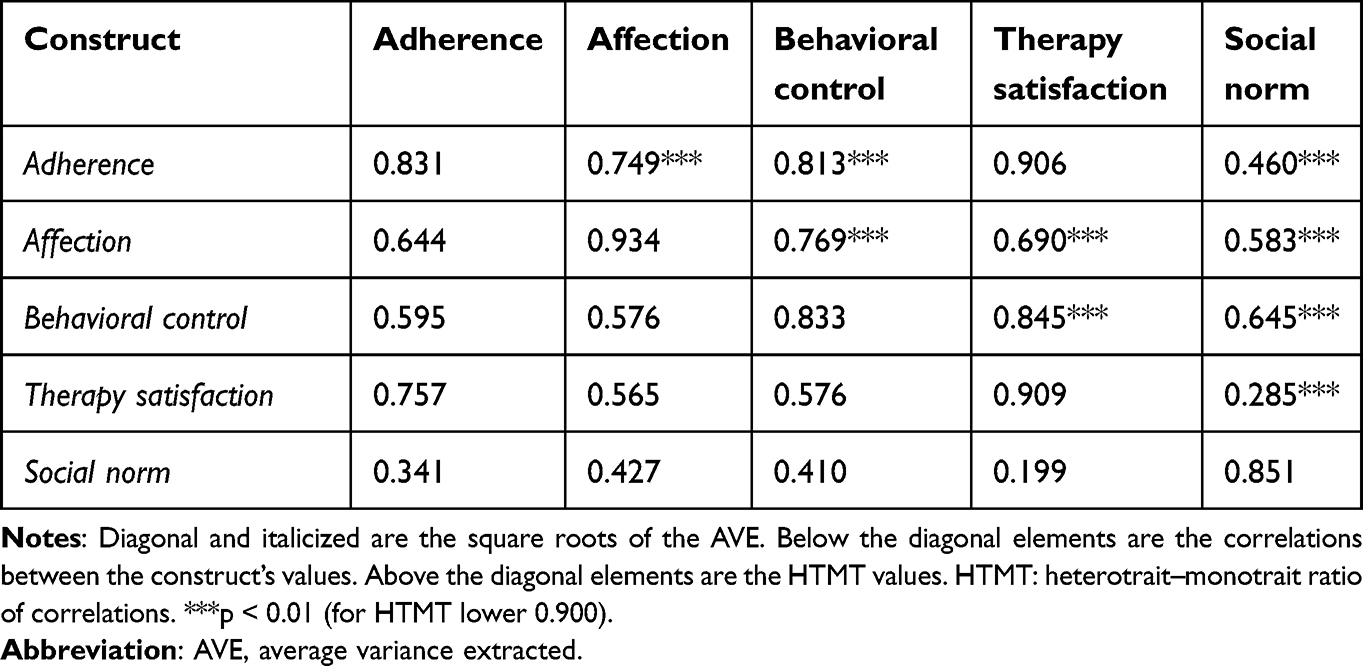 |
Table 3 Discriminant Validity: Fornell-Larcker Criterion and HTMT |
Formative measurement models were assessed by investigating the significance of the outer weight estimators and the collinearity of the different indicators.22 The results for the three formative constructs of medication scheme, doctor, and pharmacist were all significant, and the collinearity, measured by the variance inflation factor, was below the critical value of 5. For the lower-order formative construct medication schemes, MONO and FDC, some indicators were non-significant. However, following Hair et al68 these indicators remained within the measurement model as they belong to the construct’s domain, as different types of MOAs are available and are gold-standard in hypertension treatment; therefore, they shape the construct’s content.
The path coefficients within the higher order construct model for the medication scheme construct showed that the lower order construct of medication scheme FDC had a significant path coefficient at the level of 0.817, whereas the path coefficient of the lower order construct for the medication scheme MONO had only less than half the effect size with a value of 0.389 (see Figure 3). These two effects shape the attractiveness of the overall medication regimen in our framework. The observed delta in absolute path coefficients strongly supports the overall superiority and positive impact of FDC in the treatment of hypertensive patients.
Structural Model Evaluation
The structural equation model evaluation was divided into three steps. First, we evaluated the direct effects and predictive power; second, mediation; and finally, the total effects within the model.
Direct Effects and Predictive Power
Table 4 provides an overview of the relationships among the structural models. All direct relationships were significant and positive, supporting hypotheses H1–H7. Adherence had the strongest relationship with satisfaction with therapy (0.527), followed by affection (0.266) and behavioral control (0.138). These three constructs explained over 65% of the variability in adherence behavior (see Figure 3). The predictive power of the structural model was analyzed using the Q2-statistic; the effect sizes of f2and q222 are presented in Table 4. Finally, discriminant validity and model fit were assessed using standardized root mean square residuals (SRMR).73
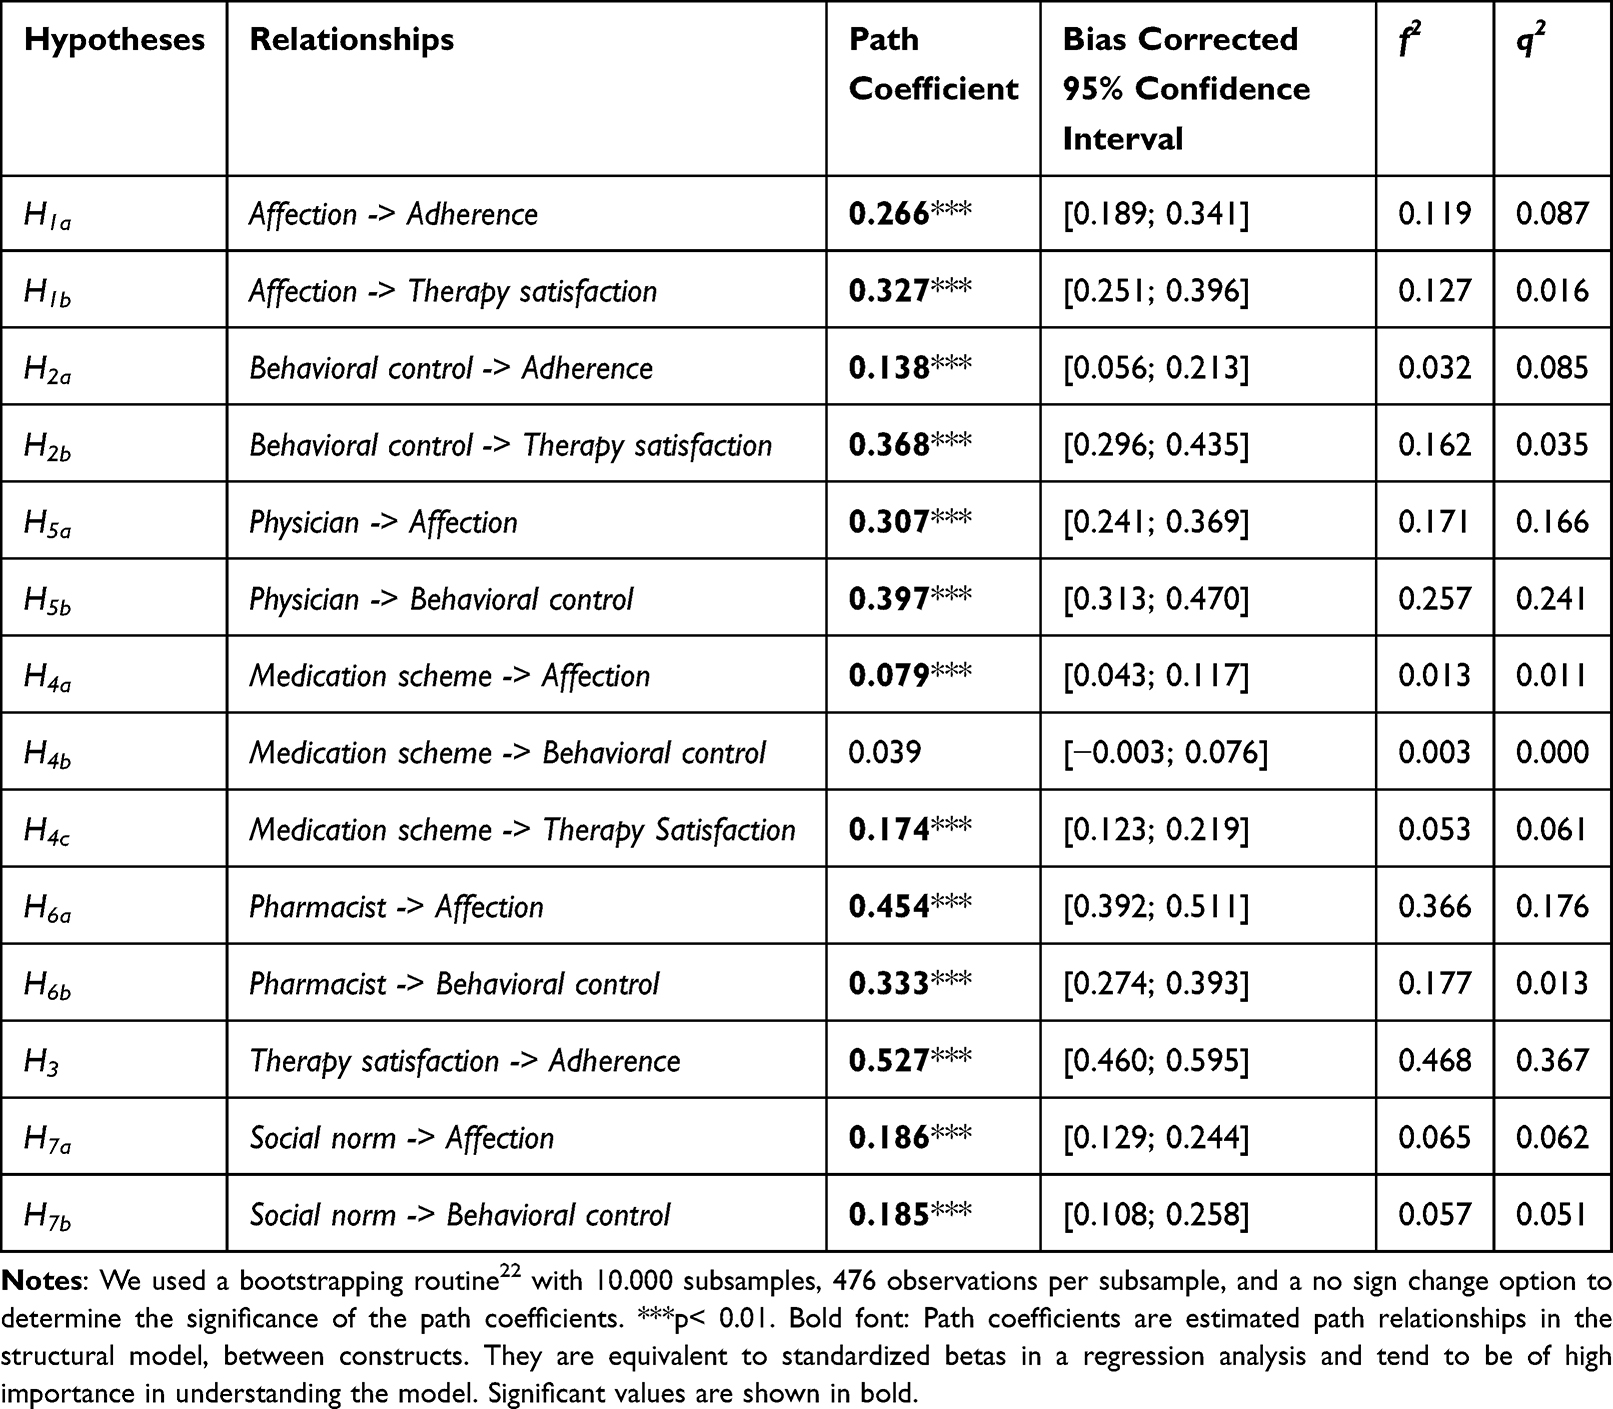 |
Table 4 Measurement Model Results - Direct Effects |
The blindfolding procedure was performed with a pre-specified spacing of 7 for cross-validated redundancy check to establish the Q2-statistic.74 The Q2-statistic of adherence was 0.449, clearly above zero. This result demonstrated the predictive relevance of the model. The effect sizes f2 and q2 showed the predictive accuracy of the chosen PLS path according to the target construct adherence behavior. Furthermore, the ranks of the PLS path coefficients and f2 and q2 effect sizes were similar, which also supported the model’s predictive power (ie, the relationship between satisfaction and adherence has the largest path coefficient and the largest f2 and q2 effect sizes).
To determine the total model fit, we used the SRMR, which should be zero for a perfect model fit and less than 0.080 for a good fit according to Hu and Bentler.75 Our model had an SRMR of 0.077, which implied a good overall fit.
The results showed that pharmacist (0.454) had the strongest direct effect on affection, followed by doctor (0.307), social norm (0.186), and medication scheme (0.079). All the effects were highly significant. These four constructs explained more than 54% of affection. Doctors had the highest influence on behavioral control (0.397), followed by pharmacists (0.333), social norms (0.185), and somewhat weakly an in-significantly by medication (0.039). These four constructs explained more than 48% of behavioral control. Therapy satisfaction had the strongest relationship with behavioral control (0.368), then with affection (0.327), and the medication scheme (0.174). Both behavioral control and affection were directly affected by medication. The three constructs explained more than 44% of patients’ satisfaction with therapy. All other predictive power measures for the target construct, as shown at the beginning of this section, were also positive for affection, behavioral control, and therapy satisfaction. Interestingly, the impact of medication on attitudinal emotions was almost double than that of behavioral control.
In summary, all hypotheses (H1-H7) postulating a direct effect, except hypotheses H4b, were confirmed by the results shown in Figure 3 and Table 4.
Mediator Analysis
A mediation analysis was performed to assess the mediating role of therapy satisfaction. The results (Table 5) revealed a significant partial mediation effect of satisfaction in the relationship between emotional affection and adherence. The indirect effect of affection via therapy satisfaction on adherence (0.172) and its direct effect on adherence (0.266) were significant. Consequently, satisfaction partially mediated the relationship between affection and adherence, with a variance accounted for (VAF) of 39.3%, which is larger than the critical value of 20.0% as mentioned by Hair et al,22 for partial mediation. These results partially support hypothesis H8.
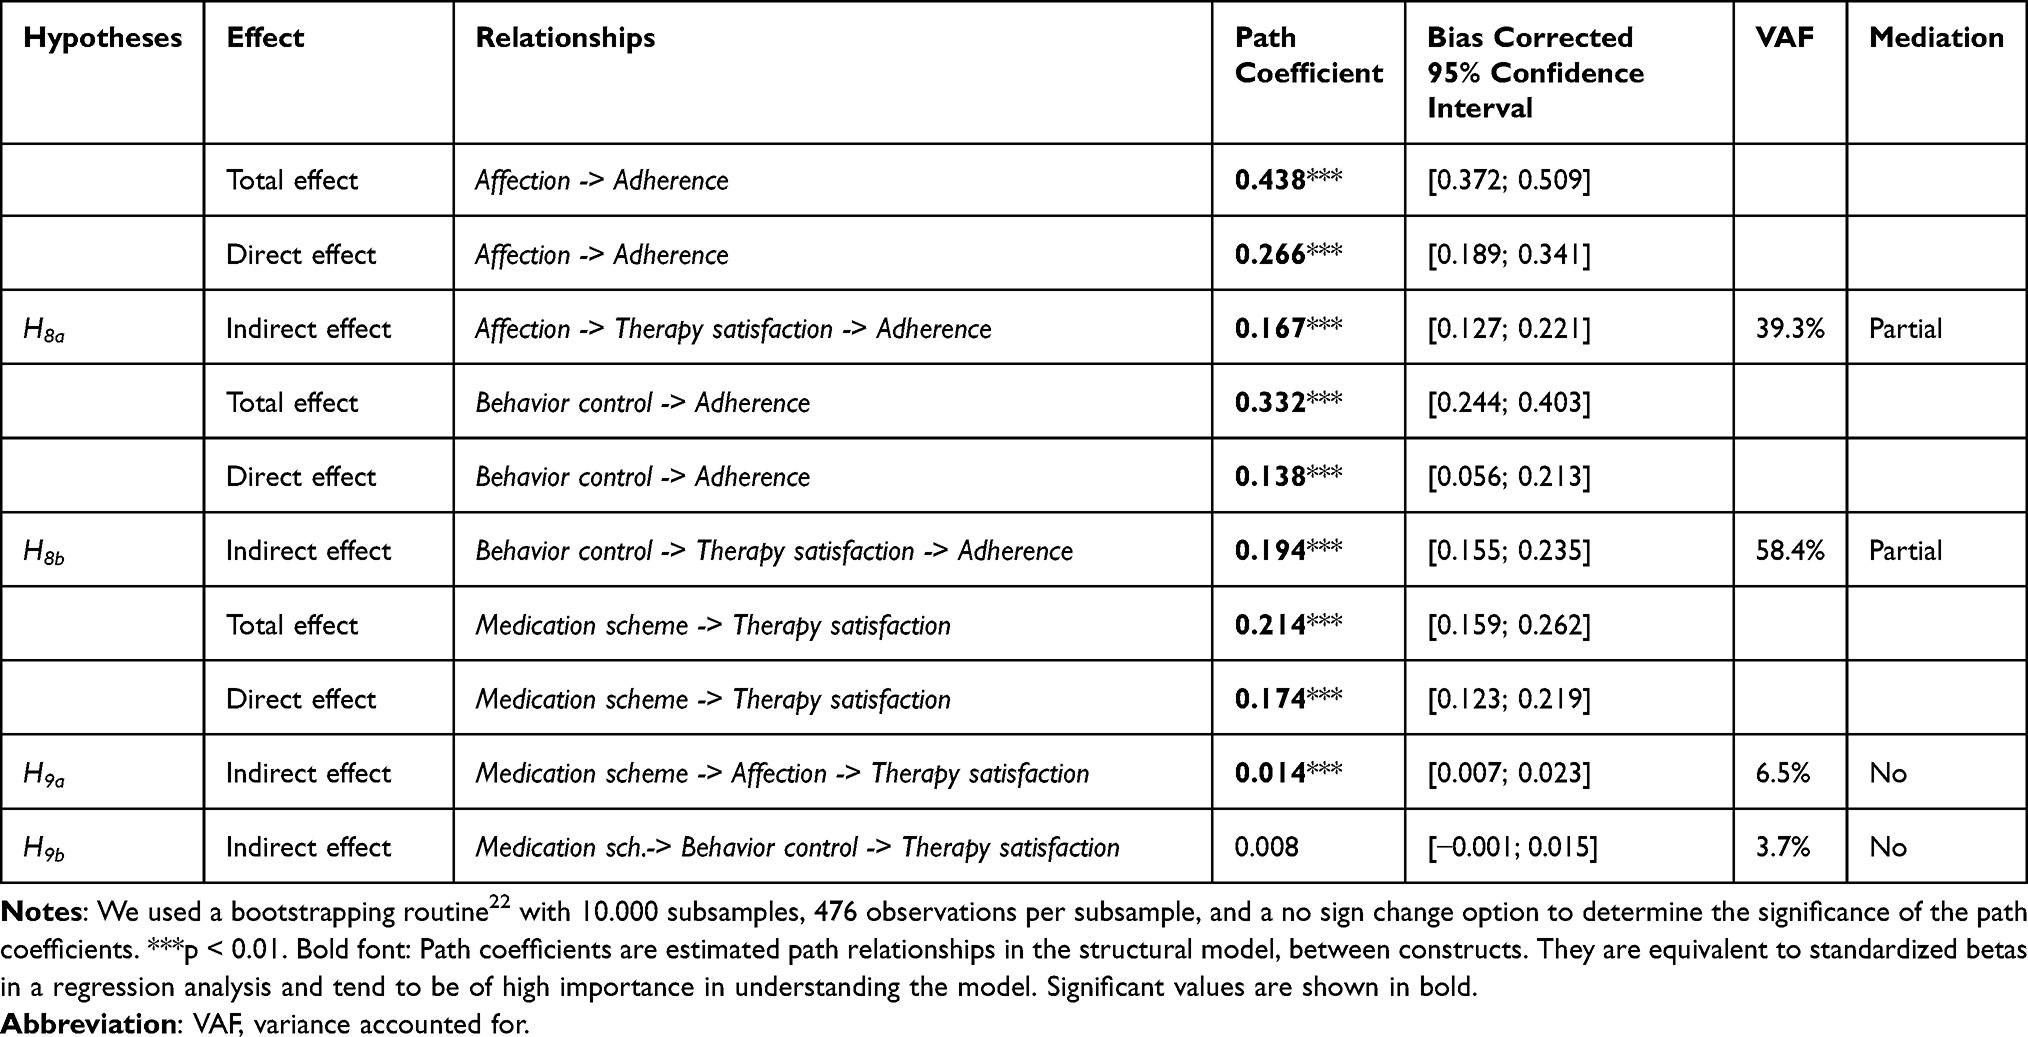 |
Table 5 Measurement Model Results – Mediation |
The same mediating circumstances were found for the mediating role of therapy satisfaction in the relationship between behavioral control and adherence. Therapy satisfaction had a significant indirect effect of 0.194, in which the direct effect between behavioral control and adherence (0.138) was smaller than the indirect effect. The VAF in this case was greater than 50%, supporting the significant effect and the strong mediating role of therapy satisfaction.
Finally, the mediating roles of affection and behavioral control in the relationship between medication schemes and therapy satisfaction were investigated. The indirect effect of medication via affection on satisfaction (0.014) was weak and insignificant, while its direct effect on satisfaction (0.174) was strong and significant. The effect size of affection’s partial mediation had a VAF of 6.5%, which is below the critical threshold of 20.0%; therefore, affection did not mediate the relationship. Regarding the mediating role of behavioral control, the indirect effect (0.008) was not significant and the VAF was 3.7%. The combined VAF of affection and behavioral control was below 20.0%. Therefore, neither construct mediated the relationship between medication schemes and therapy satisfaction.
In summary, hypothesis H8 postulating mediation, was partially supported, whereas hypothesis H9 - also postulating mediation - was not supported by the results presented in Table 5.
Total Effects
For total effects, we assessed which factors had the strongest total effect on therapy satisfaction having the strongest direct impact on adherence.68 Then, we investigated the total effects of all constructs on adherence. The total effect is the sum of direct and indirect effects. All effects discussed in this section were significant (see Table 6).
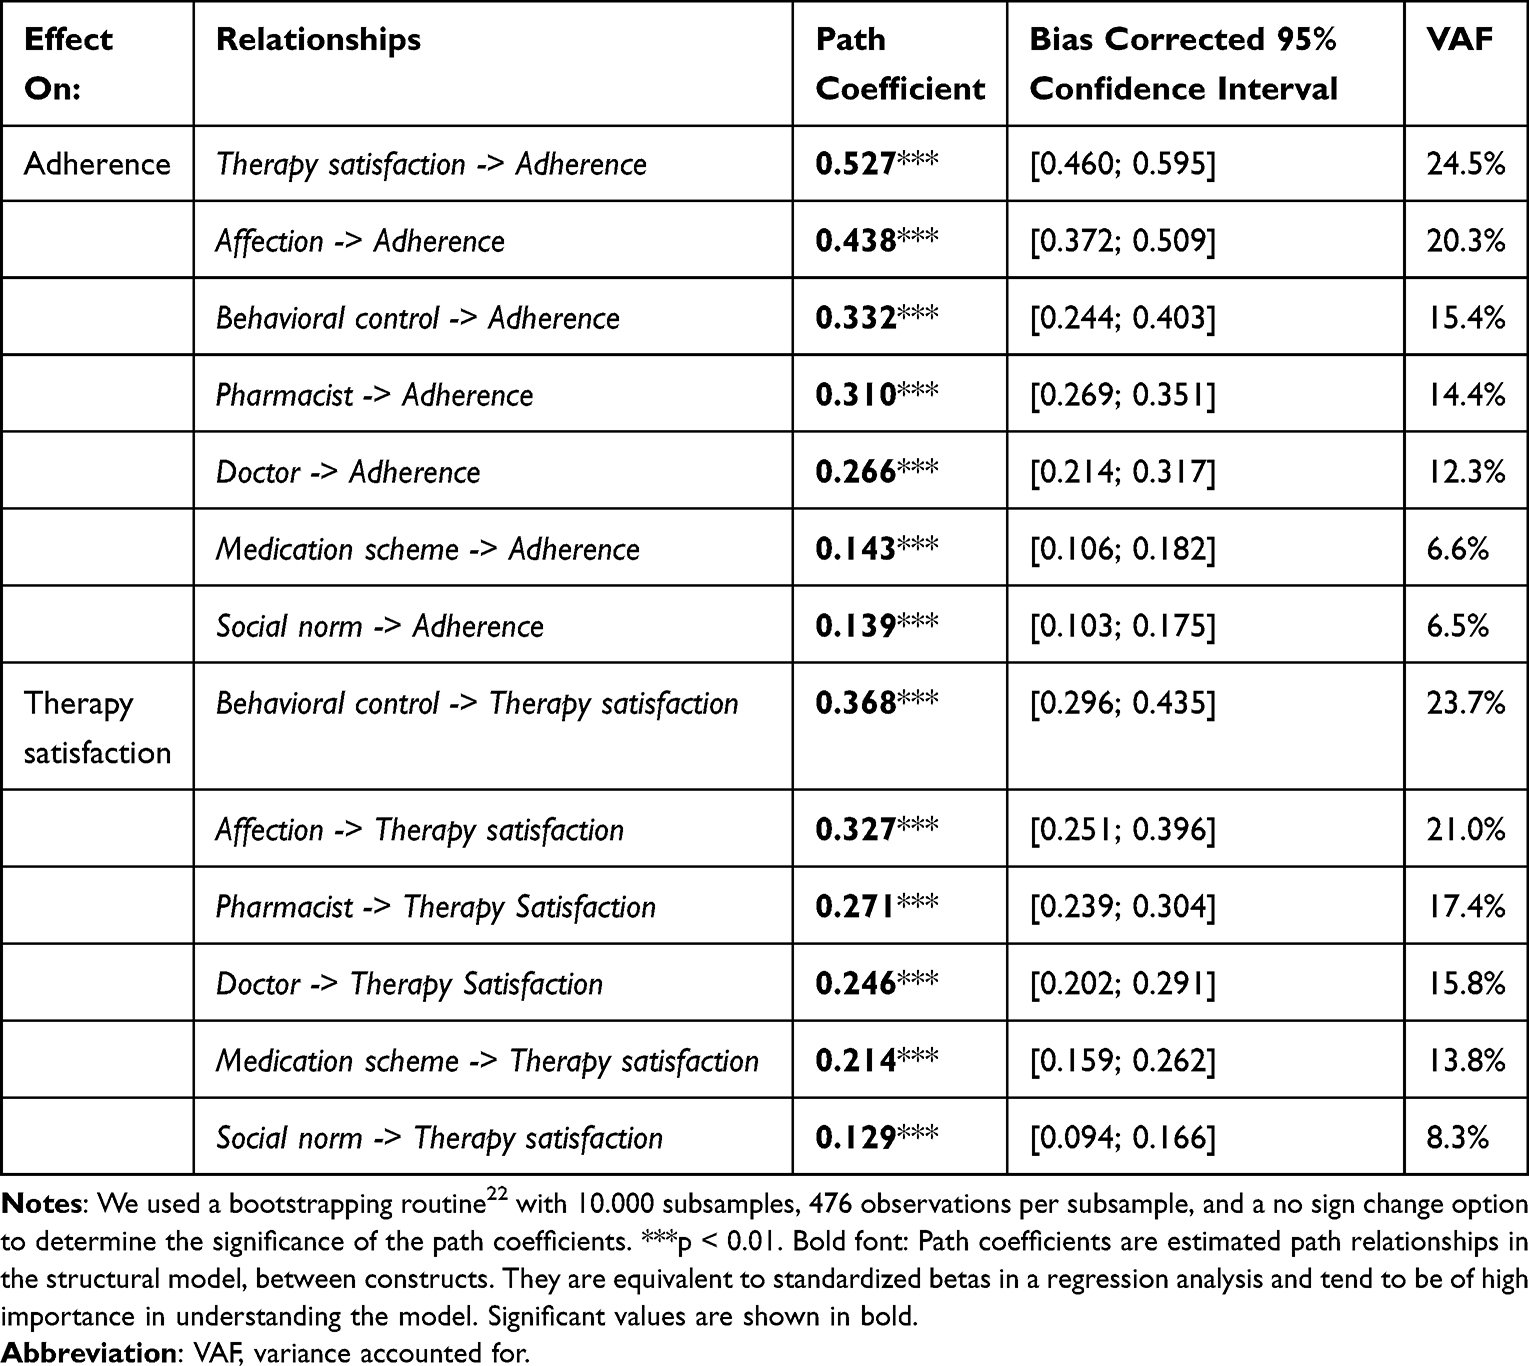 |
Table 6 Measurement Model Results – Total Effects |
Behavioral control had the strongest total effect on satisfaction (0.368), followed by affection (0.327). Both accounted for 44.0% of VAF, which was substantial. Interestingly, pharmacist (0.271) was the third most important construct to influence therapy satisfaction, accounting for 17.4% of VAF, followed by doctor (0.246), medication scheme (0.214), and social norms (0.129). Social norms accounted for only 8.3% of VAF. Because doctors dominate the decision-making on the medication scheme, the VAF of doctor and medication could be theoretically added, which resulted in a total VAF of 29.6%. It represented doctors’ dominant influence on therapy satisfaction and indirect influence on therapy adherence.
Regarding the total effects on adherence, therapy satisfaction (0.527) and affection (0.438) were the most relevant factors, accounting for 44.8% of the VAF of adherence. The third most important factor was behavioral control (0.332), followed by pharmacist (0.310), doctor (0.266), and social norm (0.143). The medication scheme was the least important, with a path coefficient of only 0.139, accounting for 6.5% of VAF.
Discussion
This study developed and examined a holistic higher-level model, including the major relationships and drivers of patients’ adherence behavior. It has three major aspects that address the gap in the literature.10 First, it explored to which extent the identified key variables—affection, behavioral control, therapy satisfaction, medication, social norm, patient–physician relationship, and patient-pharmacist relationships—influence the endogenous variable therapy adherence. Second, it assessed the degree to which the independent constructs explain therapy adherence and whether the model has good predictive power for therapy adherence. Third, the mediation effects within the model as well as the variable with the highest total effect on adherence, were analyzed. Furthermore, the construct of therapy satisfaction was discussed in detail as it is a key driver of therapy adherence.
All hypotheses (H1-H7) postulating a direct effect, except hypothesis H4b, were supported within the conceptual framework model, validating the theoretical framework for patients with hypertension as a chronic disease. Perceived therapy satisfaction had the most substantial direct effect size (f2=0.468) on therapy adherence, followed by affection and perceived behavioral therapy control. This strong association, according to the impact of therapy satisfaction, is consistent with recent studies in hypertensive patients from Saarti et al76 and Jneid et al.77 As our study was non-interventional, further studies are needed to determine which interventions to improve treatment satisfaction can also enhance adherence in hypertensive patients. Our findings regarding the direction of the association between anti-treatment emotions and adherence in hypertensive patients are in line with Tilea et al,78 Nabi et al,79 and Saleem et al.80 In the literature, the effects of the level of perceived behavioral control in following the prescribed treatment plan and the level of adherence were not as strong as in our study. However a positive association was reported by Stanton,81 Tilea et al,78 and Zugelj et al82 in a pediatric sample. In total, these three factors explained more than 65% of adherence, which perfectly fits the general scientific threshold for moderate to substantial explanation of the presented model.22
Furthermore, the out-of-sample predictive power of our model generated a significant Q2-statistic of 0.449, confirming the overall predictive character of our framework model. This documented predictive power of the model framework enables practitioners to use the underlying measures comprehensively to make predictions about the adherence of their hypertensive patients.
To summarize our findings so far, the study is consistent with Hamrahian et al,83 as non-adherence can be both intentional and unintentional and usually involves a number of interrelated factors.
Since therapy satisfaction partially mediated the relationships between affection and adherence and between behavioral control and adherence, its importance for the therapy outcome was pronounced. This mediating effect has not been explicitly tested in the literature in a patient behavior setting before. The closest finding to the mediation tested in our model comes from a study by Hawrilenko et al,84 who found that acceptance and intimacy of therapy mediated the treatment response. As discussed in the theory section of this paper, this mediating effect is well-known in consumer markets where, according to Bolton and Lemon,40 satisfaction mediates the customer’s experience with a product or service (behavioral control and emotions) and influences customer loyalty, which in our study corresponds to adherence to the hypertension therapy. The same effect is observed in our model, which emphasizes the importance of therapy satisfaction for the success of the treatment.
In addition to the drivers discussed so far, the medication scheme is significant for therapy satisfaction in patients with hypertension. The results showed that FDC had a significantly positive impact on therapy satisfaction, whereas the relative importance of MONO compounds had only half the effect size we found for FDCs direct effects on therapy satisfaction and indirect effects on adherence. These findings are consistent with a number of studies included in the meta-analysis by Du et al, which showed that “FDC therapy was associated with better medication adherence compared with free-equivalent combinations”.85
In this study, 7.9% of all patients received FDC and significantly benefited from the less complex medication scheme, as shown by the above-average therapy adherence. According the A14-scale50 used to measure the adherence level, 49.6% of all patients were classified as adherent and the remainder as non-adherent. In contrast, 89.4% of the 7.9% of patients on an FDC were classified as adherent, which is significant. Of the patients on MONO combinations only, 46.1% were classified as adherent and 53.9% as non-adherent. This difference is not significant. Our results support the recommendations of the 2020 International Society of Hypertension Global Treatment Guidelines and the 2018 European Society of Cardiology guidelines of reducing polypharmacy of a single pill combination in favor of FDC.8,41 According to the prescription of one or multiple MONO MOAs for a patient, our results show differing effect sizes by MOAs on the overall medication scoring of patients with a significant impact on therapy satisfaction. The observed tendency was that the higher the absolute number of MOAs a patient received in parallel with mono-agents, the lower the satisfaction with the therapy and, consequently, the lower the adherence. Furthermore, the specific choice of MOAs and the resulting medication complexity had a significant impact on adherence outcomes.
Finally, the results highlighted the triggering factors of a patient’s emotions associated with therapy execution and behavioral control. A supportive patient-physician relationship had the largest direct impact on perceived behavioral control, in line with the findings of Jones et al,86 Jneid et al,77 and Saarti et al.76 This shows the importance of considering the physician as a key stakeholder when planning an intervention to improve patients’ self-efficacy and maximize the impact.
Additionally, our results showed that the patient–pharmacist relationship, social norms, and medication have positive impacts on behavioral control. Moreover, the quality of patient-physician relationships, social norms, and medication significantly impact the emotional component for therapy execution and, consequently, adherence levels. The literature reports mixed results depending on the influence of the pharmacist. When comparing the effect sizes of the doctor-patient and pharmacist-patient relationships on general therapeutic behavior and adherence, the doctor’s effect was stronger overall in most studies.86 However, for effective intervention planning, differences in absolute and relative effect sizes within the model should be considered for optimal and targeted resource allocation. Rivera et al,87 Choe et al,88 and Urick et al89 documented the importance of a supportive pharmacist in improving behavioral control aspects in hypertensive patients.
Interestingly, the largest leverage, measured by effect size on affection, was associated with patient–pharmacist relationships. Therefore, a strong relationship with a pharmacist is a promising factor in controlling patients’ emotions for therapy execution. Carter et al90 revealed that a close collaboration between physicians and pharmacists had a significant impact on improving blood pressure control. This could be an interesting starting point for intervention planning. The impact of pharmacists may have been undervalued in intervention programs that aim to improve patients’ emotional stability regarding therapy and achieve good adherence outcomes. On the contrary, this study design, in which the pharmacist gave the questionnaire to the patient, may have led to some bias, overestimating the role of the pharmacist. By choosing a different study design in the future, this potential effect could be overcome.
Ethical considerations should always be kept in mind when planning interventions aimed at patient-physician and patient-pharmacist relationships, as these are very sensitive and confidential matters. Here, a rather conservative approach for such interventions planning and shaping should be considered, which is supported by the findings of Xu et al.91
This study had certain limitations. The survey design of patient recruitment through pharmacists could have skewed the effect estimates for the patient-pharmacist relationship. In subsequent studies, a different design (ie, internet-based) could be chosen to compare the effect sizes. Furthermore, despite our best efforts to include the most relevant factors that influence adherence behavior, we could explain 65% of adherence behaviors, and 35% remain unexplained. The same is true for the moderate levels of explanation (44–53%) of the three other endogenous constructs of our model.
Moreover, while this study analyzed adherence behavior in patients with hypertension, exploring the model’s application to other chronic or acute diseases and to other countries and cultural settings would be interesting. Finally, as the questionnaire used was already quite long, and we did not want to risk an increase in refusals, we had to make some choices and were not able to collect information according to the sociodemographic status,31 education, health-care systems, and cultural factors. This is certainly a limitation of our research, which will need to be addressed in future research.
Conclusion
The insights from this study are significant for health insurance companies, the life science industry, professional healthcare providers and governmental decision-makers to understand the triggers that may affect adherence behavior and their interaction with other components in patients’ decision-making process. The results can help healthcare managers assess the range of effectiveness ex-ante when addressing a certain higher-level construct of our adherence model. For further detailed intervention planning, an in-depth exploration of the intervention target construct is necessary. A combination of our higher-level model with existing specific, multi-fold, small-extract models may be supportive in managing optimal intervention planning and resource allocation. In addition, the proven predictive power of the framework allows healthcare professionals to make predictions about the adherence potential of their hypertensive patients.
Acknowledgments
I would like to thank all patients and pharmacists who participated in the study. Furthermore, I would like to thank Prof Dr Walter E. Haefeli for granting to use the A14-scale50 in our study. I am also very grateful to the anonymous reviewers and the editor for their invaluable comments on an earlier draft of this paper.
Disclosure
The author reports no conflicts of interest in this work.
References
1. Ibrahim KM, Schommer JC, Morisky DE, Rodriguez R, Gaither C, Snyder M. The association between medication experiences and beliefs and low medication adherence in patients with chronic disease from two different societies: the USA and the Sultanate of Oman. Pharmacy. 2021;9(1):31. doi:10.3390/pharmacy9010031
2. World Health Organization. Failure to Take Prescribed Medicine for Chronic Diseases is a Massive. World-Wide Problem; 2003.
3. Kronish IM, Ye S. Adherence to cardiovascular medications: lessons learned and future directions. Prog Cardiovasc Dis. 2013;55(6):590–600. doi:10.1016/j.pcad.2013.02.001
4. Iuga AO, McGuire MJ. Adherence and health care costs. Risk Manag Healthc Policy. 2014;7:35–44. doi:10.2147/RMHP.S19801
5. Raghupathi W, Raghupathi V. An empirical study of chronic diseases in the United States: a visual analytics approach. Int J Environ Res Public Health. 2018;15(3). doi:10.3390/ijerph15030431
6. Ebrahim S. Chronic diseases and calls to action. Int J Epidemiol. 2008;37(2):225–230. doi:10.1093/ije/dyn016
7. Elston Lafata J, Nguyen B, Staresinic C, Johnson M, Gratie D, Muluneh B. Interpersonal communication-, education- and counselling-based interventions to support adherence to oral anticancer therapy: a systematic review. J Oncol Pharm Pract. 2023;29(2):358–369. doi:10.1177/10781552211073576
8. Mahfoud F, Kieble M, Enners S, et al. Use of fixed-dose combination antihypertensives in Germany between 2016 and 2020: an example of guideline inertia. Clin Res Cardiol. 2023;112(2):197–202. doi:10.1007/s00392-022-01993-5
9. Kardas P, Lewek P, Matyjaszczyk M. Determinants of patient adherence: a review of systematic reviews. Front Pharmacol. 2013;4:91. doi:10.3389/fphar.2013.00091
10. Quaschning K, Koerner M, Wirtz MA. Analyzing the effects of barriers to and facilitators of medication adherence among patients with cardiometabolic diseases: a structural equation modeling approach. BMC Health Serv Res. 2022;22(1):588. doi:10.1186/s12913-022-07987-3
11. Rivis A, Sheeran P. Social influences and the theory of planned behaviour: evidence for a direct relationship between prototypes and young people’s exercise behaviour. Psychol Health. 2003;18(5):567–583. doi:10.1080/0887044032000069883
12. Schmieder RE, Högerl K, Jung S, Bramlage P, Veelken R, Ott C. Patient preference for therapies in hypertension: a cross-sectional survey of German patients. Clin Res Cardiol. 2019;108(12):1331–1342. doi:10.1007/s00392-019-01468-0
13. Prigge J-K, Dietz B, Homburg C, Hoyer WD, Burton JL. Patient empowerment: a cross-disease exploration of antecedents and consequences. Int J Res Mark. 2015;32(4):375–386. doi:10.1016/j.ijresmar.2015.05.009
14. Voehler D, Neumann PJ, Ollendorf DA. Patient and caregiver views on measures of the value of health interventions. Patient Preference Adherence. 2022;16:3383–3392. doi:10.2147/PPA.S390227
15. Ruksakulpiwat S, Benjasirisan C, Ding K, et al. Utilizing social determinants of health model to understand barriers to medication adherence in patients with ischemic stroke: a systematic review. Patient Preference Adherence. 2023;17:2161–2174. doi:10.2147/PPA.S420059
16. Sawaengsri N, Maneesriwongul W, Schorr EN, Wangpitipanit S. Effects of telephone-based brief motivational interviewing on self-management, medication adherence, and glycemic control in patients with uncontrolled type 2 diabetes mellitus in a Rural Community in Thailand. Patient Preference Adherence. 2023;17:2085–2096. doi:10.2147/PPA.S418514
17. Naidu V, Ganeshamoorthy A, Allwin C. The mediating effect of self-efficacy on the relationship between medication literacy and medication adherence among patients with Type 2 diabetes letter. Patient Preference Adherence. 2023;17:1907–1908. doi:10.2147/PPA.S432752
18. Smith SG, Green SMC, Ellison R, et al. Refining and optimising a behavioural intervention to support endocrine therapy adherence (ROSETA) in UK women with breast cancer: protocol for a pilot fractional factorial trial. BMJ Open. 2023;13(2):e069971. doi:10.1136/bmjopen-2022-069971
19. Garbrah BG, Abebrese J, Owusu-Marfo J. Factors associated with tuberculosis treatment adherence among tuberculosis patients in the Kumasi metropolis in the Ashanti Region of Ghana; A cross-sectional study. J Public Health. 2023;1–12. doi:10.1007/s10389-023-02002-3
20. Dima AL, Allemann SS, Dunbar-Jacob J, Hughes DA, Vrijens B, Wilson IB. Methodological considerations on estimating medication adherence from self-report, electronic monitoring and electronic healthcare databases using the TEOS framework. Br J Clin Pharmacol. 2023;89(7):1918–1927. doi:10.1111/bcp.15375
21. Bergner N, Falk T, Heinrich D, Hölzing D. The effects of DTCA on patient compliance. Int J Pharm Healthc Mark. 2013;7(4):391–409. doi:10.1108/IJPHM-05-2013-0031
22. Hair JF, Hult GTM, Ringle CM, Sarstedt M. A Primer on Partial Least Squares Structural Equation Modeling (PLS-SEM).
23. Wolf-Maier K, Cooper RS, Kramer H, et al. Hypertension treatment and control in five European countries, Canada, and the United States. Hypertension. 2004;43(1):10–17. doi:10.1161/01.HYP.0000103630.72812.10
24. Hansson L, Lloyd A, Anderson P, Kopp Z. Excess morbidity and cost of failure to achieve targets for blood pressure control in Europe. Blood Press. 2002;11(1):35–45. doi:10.1080/080370502753543945
25. Mahfoud F, Schmieder RE, Azizi M, et al. Proceedings from the 2nd European Clinical Consensus Conference for device-based therapies for hypertension: state of the art and considerations for the future. Eur Heart J. 2017;38(44):3272–3281. doi:10.1093/eurheartj/ehx215
26. Fishbein M, Ajzen I. Belief, attitude, intention and behaviour: an introduction to theory and research. Reading; 1975.
27. Ajzen I. The theory of planned behavior. Organ Behav Hum Decis Processes. 1991;50(2):179–211. doi:10.1016/0749-5978(91)90020-T
28. Guo R, Berkshire SD, Fulton LV, Hermanson PM. Predicting intention to use evidence-based management among U.S. healthcare administrators: application of the theory of planned behavior and structural equation modeling. Int J Healthc Manag. 2019;12(1):25–32. doi:10.1080/20479700.2017.1336856
29. Hagger MS, Hamilton K. Effects of socio-structural variables in the theory of planned behavior: a mediation model in multiple samples and behaviors. Psychol Health. 2021;36(3):307–333. doi:10.1080/08870446.2020.1784420
30. Horne J, Madill J, Gilliland J. Incorporating the “Theory of Planned Behavior” into personalized healthcare behavior change research: a call to action. Pers Med. 2017;14(6):521–529. doi:10.2217/pme-2017-0038
31. Al-Noumani H, Wu JR, Barksdale D, Sherwood G, AlKhasawneh E, Knafl G, Health beliefs and medication adherence in patients with hypertension: a systematic review of quantitative studies. Patient Educ Couns. 2019;1026:1045–1056. doi:10.1016/j.pec.2019.02.022
32. Shankar A, Conner M, Bodansky HJ. Can the theory of planned behaviour predict maintenance of a frequently repeated behaviour? Psychol Health Med. 2007;12(2):213–224. doi:10.1080/09540120500521327
33. Harvey JN, Lawson VL. The importance of health belief models in determining self-care behaviour in diabetes. Diabet Med. 2009;26(1):5–13. doi:10.1111/j.1464-5491.2008.02628.x
34. King-Shier KM, Singh S, Khan NA, et al. Ethno-cultural considerations in cardiac patients’ medication adherence. Clin Nurs Res. 2017;26(5):576–591. doi:10.1177/1054773816646078
35. Pollack MF, Purayidathil FW, Bolge SC, Williams SA. Patient-reported tolerability issues with oral antidiabetic agents: associations with adherence; treatment satisfaction and health-related quality of life. Diabet Res Clin Pract. 2010;87(2):204–210. doi:10.1016/j.diabres.2009.11.023
36. Meesala A, Paul J. Service Quality, consumer satisfaction and loyalty in hospitals: thinking for the future. J Retailing Con Serv. 2018;40:261–269. doi:10.1016/j.jretconser.2016.10.011
37. Fornell C, Mithas S, Morgeson FV, Krishnan MS. Customer satisfaction and stock prices: high returns, low risk. J Mark. 2006;70(1):3–14. doi:10.1509/jmkg.2006.70.1.3
38. Schirmer N, Ringle CM, Gudergan SP, Feistel MSG. The link between customer satisfaction and loyalty: the moderating role of customer characteristics. J Strateg Mark. 2018;26(4):298–317. doi:10.1080/0965254X.2016.1240214
39. Mittal V, Ross WT, Baldasare PM. The asymmetric impact of negative and positive attribute-level performance on overall satisfaction and repurchase intentions. J Mark. 1998;62(1):33–47. doi:10.1177/002224299806200104
40. Bolton RN, Lemon KN. A dynamic model of customers’ usage of services: usage as an antecedent and consequence of satisfaction. J Mark Res. 1999;36(2):171–186. doi:10.1177/002224379903600203
41. Unger T, Borghi C, Charchar F, et al. 2020 International Society of Hypertension global hypertension practice guidelines. J Hypertens. 2020;38(6):982–1004. doi:10.1097/HJH.0000000000002453
42. Montes Cardona JA, Hincapié Erira DA, Nati-Castillo HA, Sánchez-Vallejo J, Izquierdo-Condoy JS. Characteristics of inhaler technique in COPD patients in a Specialized Center in Armenia, Colombia: a cross-sectional study. Patient Prefer Adherence. 2023;17:2025–2038. doi:10.2147/PPA.S417375
43. Psarou A, Cooper H, Wilding JPH. Patients’ perspectives of oral and injectable Type 2 diabetes medicines, their body weight and medicine-taking behavior in the UK: a systematic review and meta-ethnography. Diabetes Ther. 2018;9(5):1791–1810. doi:10.1007/s13300-018-0490-5
44. Hausman A. Modelling the patient-physician service encounter: improving patient outcomes. J Acad Marking Sci. 2004;32(4):403–417. doi:10.1177/0092070304265627
45. Schoenthaler A, Cuffee Y. A systematic review of interventions to improve adherence to diabetes medications within the patient-practitioner interaction. J Clin Outcomes Manag. 2013;20(11):494–506.
46. Morgado MP, Morgado SR, Mendes LC, Pereira LJ, Castelo-Branco M. Pharmacist interventions to enhance blood pressure control and adherence to antihypertensive therapy: review and meta-analysis. Am J Health Syst Pharm. 2011;68(3):241–253. doi:10.2146/ajhp090656
47. Stewart K, George J, Mc Namara KP, et al. A multifaceted pharmacist intervention to improve antihypertensive adherence: a cluster-randomized, controlled trial (HAPPy trial). J Clin Pharm Ther. 2014;39(5):527–534. doi:10.1111/jcpt.12185
48. Connolly FR, Aitken LM, Tower M. An integrative review of self-efficacy and patient recovery post acute injury. J Adv Nurs. 2014;70(4):714–728. doi:10.1111/jan.12237
49. Singh J, Cuttler L, Silvers JB. Toward understanding consumers’ role in medical decisions for emerging treatments: issues, framework and hypotheses. J Bus Res. 2004;57:1054–1065.
50. Jank S, Bertsche T, Schellberg D, Herzog W, Haefeli WE. The A14-scale: development and evaluation of a questionnaire for assessment of adherence and individual barriers. Pharm World Sci. 2009;31(4):426–431. doi:10.1007/s11096-009-9296-x
51. Chatziefstratiou A, Giakoumidakis K, Fotos NV, Baltopoulos G, Brokalaki H. Scales for assessing medication adherence in patients with hypertension. Br J Nurs. 2019;28(21):1388–1392. doi:10.12968/bjon.2019.28.21.1388
52. Morisky DE, Ang A, Krousel-Wood M, Ward HJ. Predictive validity of a medication adherence measure in an outpatient setting. J Clin Hypertens. 2008;10(5):348–354. doi:10.1111/j.1751-7176.2008.07572.x
53. Ajzen I. Constructing a TpB questionnaire: conceptual and methodological considerations. Rev version; 2006. Available from: https://citeseerx.ist.psu.edu/document?repid=rep1&type=pdf&doi=0574b20bd58130dd5a961f1a2db10fd1fcbae95d.
54. Johnson MD, Gustafsson A, Andreassen TW, Lervik L, Cha J. The evolution and future of national customer satisfaction index models. J Econ Psychol. 2001;22(2):217–245. doi:10.1016/S0167-4870(01)00030-7
55. Ahlén GC, Mattsson B, Gunnarsson RK. Physician patient questionnaire to assess physician patient agreement at the consultation. Fam Pract. 2007;24(5):498–503. doi:10.1093/fampra/cmm043
56. Landgraf R, Huber F, Bartel R. Patient Als Partner. Wiesbaden; 2006.
57. Diamantopoulos A. The error term in formative measurement models: interpretation and modeling implications. J Modell Manag. 2006;1(1):7–17. doi:10.1108/17465660610667775
58. Ringle CM, Sarstedt M, Straub D. Editor’s comments: a critical look at the use of PLS-SEM in “MIS quarterly”. MIS Q. 2012;36(1):iii–xiv. doi:10.2307/41410402
59. Becker J-M, Klein K, Wetzels M. Hierarchical latent variable models in PLS-SEM: guidelines for using reflective-formative type models. Long Range Plann. 2012;45(5–6):359–394. doi:10.1016/j.lrp.2012.10.001
60. Jarvis CB, MacKenzie SB, Podsakoff PM. A critical review of construct indicators and measurement model misspecification in marketing and consumer research. J Consum Res. 2003;30(2):199–218. doi:10.1086/376806
61. Bagozzi RP, Heatherton TF. A general approach to representing multifaceted personality constructs: application to state self-esteem. Struct Equ Model Multidiscip J. 1994;1(1):35–67. doi:10.1080/10705519409539961
62. Ajzen I. Constructing a Theory of Planned Behavior Questionnaire; 2006.
63. Lerner SF, Park KH, Hubatsch DA, Erichev V, Paczka JA, Roberts TV. Efficacy and tolerability of travoprost 0.004%/timolol 0.5% fixed-dose combination for the treatment of primary open-angle glaucoma or ocular hypertension inadequately controlled with beta-blocker monotherapy. J Ophthalmol. 2017;2017:1917570. doi:10.1155/2017/1917570
64. Goyal J, Khan ZY, Upadhyaya P, Goyal B, Jain S. Comparative study of high dose mono-therapy of amlodipine or telmisartan, and their low dose combination in mild to moderate hypertension. J Clin Diagn Res. 2014;8(6):HC08–HC11. doi:10.7860/JCDR/2014/9352.4500
65. Corrao G, Parodi A, Zambon A, et al. Reduced discontinuation of antihypertensive treatment by two-drug combination as first step. Evidence from daily life practice. J Hypertens. 2010;28(7):1584–1590. doi:10.1097/HJH.0b013e328339f9fa
66. Legate AE, Ringle CM, Hair JF. PLS‐SEM: a method demonstration in the R statistical environment. Hum Resour Dev Q. 2023. doi:10.1002/hrdq.21517
67. Ringle CM, Wende S, Becker J-M. Smart PLS 4. Bönningstedt: SmartPLS; 2023.
68. Hair J, Sarstedt M, Ringle CM, Gudergan SP. Advanced Issues in Partial Least Squares Structural Equation Modeling. Thousand Oaks: SAGE Publications, Incorporated; 2018.
69. Cohen J. A power primer. Psychol Bull. 1992;112(1):155–159. doi:10.1037//0033-2909.112.1.155
70. Rigdon EE, Sarstedt M, Ringle CM. On comparing results from CB-SEM and PLS-SEM: five perspectives and five recommendations. MAR. 2017;39(3):4–16. doi:10.15358/0344-1369-2017-3-4
71. Roemer E, Schuberth F, Henseler J. HTMT2–an improved criterion for assessing discriminant validity in structural equation modeling. IMDS. 2021;121(12):2637–2650. doi:10.1108/IMDS-02-2021-0082
72. Gudergan SP, Ringle CM, Wende S, Will A. Confirmatory tetrad analysis in PLS path modeling. J Bus Res. 2008;61(12):1238–1249. doi:10.1016/j.jbusres.2008.01.012
73. Henseler J, Ringle CM, Sarstedt M. A new criterion for assessing discriminant validity in variance-based structural equation modeling. J Acad Marking Sci. 2015;43(1):115–135. doi:10.1007/s11747-014-0403-8
74. Hair JF, Risher JJ, Sarstedt M, Ringle CM. When to use and how to report the results of PLS-SEM. EBR. 2019;31(1):2–24. doi:10.1108/EBR-11-2018-0203
75. Hu L, Bentler PM. Fit indices in covariance structure modeling: sensitivity to underparameterized model misspecification. Psychol Methods. 1998;3(4):424–453. doi:10.1037/1082-989X.3.4.424
76. Saarti S, Hajj A, Karam L, et al. Association between adherence, treatment satisfaction and illness perception in hypertensive patients. J Hum Hypertens. 2016;30(5):341–345. doi:10.1038/jhh.2015.86
77. Jneid S, Jabbour H, Hajj A, et al. Quality of life and its association with treatment satisfaction, adherence to medication, and trust in physician among patients with hypertension: a cross-sectional designed study. J Cardiovasc Pharmacol Ther. 2018;23(6):532–542. doi:10.1177/1074248418784292
78. Tilea I, Petra D, Voidazan S, Ardeleanu E, Varga A. Treatment adherence among adult hypertensive patients: a cross-sectional retrospective study in primary care in Romania. Patient Preference Adherence. 2018;12:625–635. doi:10.2147/PPA.S162965
79. Nabi H, Vahtera J, Singh-Manoux A, et al. Do psychological attributes matter for adherence to antihypertensive medication? The Finnish public sector cohort study. J Hypertens. 2008;26(11):2236–2243. doi:10.1097/HJH.0b013e32830dfe5f
80. Saleem F, Hassali M, Shafie A, Atif M. Drug attitude and adherence: a qualitative insight of patients with hypertension. J Young Pharm. 2012;4(2):101–107. doi:10.4103/0975-1483.96624
81. Stanton AL. Determinants of adherence to medical regimens by hypertensive patients. J Behav Med. 1987;10(4):377–394. doi:10.1007/BF00846477
82. Zugelj U, Zupancic M, Komidar L, Kenda R, Varda NM, Gregoric A. Self-reported adherence behavior in adolescent hypertensive patients: the role of illness representations and personality. J Pediatr Psychol. 2010;35(9):1049–1060. doi:10.1093/jpepsy/jsq027
83. Hamrahian SM, Maarouf OH, Fülöp T. A critical review of medication adherence in hypertension: barriers and facilitators clinicians should consider. Patient Preference Adherence. 2022;16:2749–2757. doi:10.2147/PPA.S368784
84. Hawrilenko M, Gray TD, Córdova JV. The heart of change: acceptance and intimacy mediate treatment response in a brief couples intervention. J Fam Psychol. 2016;30(1):93–103. doi:10.1037/fam0000160
85. Du LP, Cheng ZW, Zhang YX, Li Y, Mei D. The impact of fixed-dose combination versus free-equivalent combination therapies on adherence for hypertension: a meta-analysis. J Clin Hypertens. 2018;20(5):902–907. doi:10.1111/jch.13272
86. Jones DE, Carson KA, Bleich SN, Cooper LA, Patient trust in physicians and adoption of lifestyle behaviors to control high blood pressure. Patient Educ Couns. 2012;891:57–62. doi:10.1016/j.pec.2012.06.003
87. Rivera MD, Johnson M, Choe HM, et al. Evaluation of a pharmacists’ Patient Care process approach for hypertension. Am J Prev Med. 2022;62(1):100–104. doi:10.1016/j.amepre.2021.06.012
88. Choe HM, Farris KB, Stevenson JG, et al. Patient-centered medical home: developing, expanding, and sustaining a role for pharmacists. Am J Health Syst Pharm. 2012;69(12):1063–1071. doi:10.2146/ajhp110470
89. Urick BY, Trygstad TK, Farley JF. Patient outcomes from implementing an enhanced services pharmacy network. J Am Pharm Assoc. 2020;60(6):843–852:843–852.e15. doi:10.1016/j.japh.2020.05.009
90. Carter BL, Ardery G, Dawson JD, et al. Physician and pharmacist collaboration to improve blood pressure control. Arch Intern Med. 2009;169(21):1996–2002. doi:10.1001/archinternmed.2009.358
91. Xu X, Guo T, Liu Z, et al. A systematic review of patient preferences, expectations, and values for the management and treatment of hypertension. Patient Preference Adherence. 2022;16:2867–2876. doi:10.2147/PPA.S388356
 © 2024 The Author(s). This work is published and licensed by Dove Medical Press Limited. The full terms of this license are available at https://www.dovepress.com/terms.php and incorporate the Creative Commons Attribution - Non Commercial (unported, v3.0) License.
By accessing the work you hereby accept the Terms. Non-commercial uses of the work are permitted without any further permission from Dove Medical Press Limited, provided the work is properly attributed. For permission for commercial use of this work, please see paragraphs 4.2 and 5 of our Terms.
© 2024 The Author(s). This work is published and licensed by Dove Medical Press Limited. The full terms of this license are available at https://www.dovepress.com/terms.php and incorporate the Creative Commons Attribution - Non Commercial (unported, v3.0) License.
By accessing the work you hereby accept the Terms. Non-commercial uses of the work are permitted without any further permission from Dove Medical Press Limited, provided the work is properly attributed. For permission for commercial use of this work, please see paragraphs 4.2 and 5 of our Terms.