")
Back to Journals » International Journal of Nanomedicine » Volume 12
Quantum dots modulate intracellular Ca2+ level in lung epithelial cells
Authors Yin HJ, Fontana JM, Solandt J, Jussi JI, Xu H , Brismar H, Fu Y
Received 13 December 2016
Accepted for publication 30 December 2016
Published 5 April 2017 Volume 2017:12 Pages 2781—2792
DOI https://doi.org/10.2147/IJN.S130136
Checked for plagiarism Yes
Review by Single anonymous peer review
Peer reviewer comments 2
Editor who approved publication: Dr Thomas Webster
Huijuan Yin,1 Jacopo M Fontana,1 Johan Solandt,1,2 Johnny Israelsson Jussi,1 Hao Xu,1 Hjalmar Brismar,1 Ying Fu1
1Section of Cellular Biophysics, Department of Applied Physics, Royal Institute of Technology (KTH), Science for Life Laboratory, Solna, 2AstraZeneca R&D, Mölndal, Sweden
Abstract: While adverse effects of nanoparticles on lung health have previously been proposed, few studies have addressed the direct effects of nanoparticle exposure on the airway epithelium. In this work, we examine the response of the pulmonary airway to nanoparticles by measuring intracellular Ca2+ concentration ([Ca2+]i) in the Calu-3 epithelial layer stimulated by 3-mercaptopropionic-acid (3MPA) coated CdSe-CdS/ZnS core-multishell quantum dots (QDs). Simultaneous transient transepithelial electrical resistance (TEER) decrease and global [Ca2+]i increase in Calu-3 epithelial layer, accompanied by cell displacements, contraction, and expansion, were observed under QD deposition. This suggests that a QD-induced global [Ca2+]i increase in the Calu-3 epithelial layer caused the transient TEER decrease. The [Ca2+]i increase was marked and rapid in the apical region, while [Ca2+]i decreased in the basolateral region of the epithelial layer. TEER transient response and extracellular Ca2+ entry induced by QD deposition were completely inhibited in cells treated with stretched-activated (SA) inhibitor GdCl3 and store-operated calcium entry (SOCE) inhibitor BTP2 and in cells immersed in Ca2+-free medium. The voltage-gated calcium channel (VGCC) inhibitor nifedipine decreased, stabilized, and suppressed the TEER response, but did not affect the [Ca2+]i increase, due to QD deposition. This demonstrates that the Ca2+ influx activated by QDs’ mechanical stretch occurs through activation of both SA and SOCE channels. QD-induced [Ca2+]i increase occurred in the Calu-3 epithelial layer after culturing for 15 days, while significant TEER drop only occurred after 23 days. This work provides a new perspective from which to study direct interactions between airway epithelium and nanoparticles and may help to reveal the pathologies of pulmonary disease.
Keywords: Calu-3 epithelial layer, quantum dot, intracellular Ca2+ concentration [Ca2+]i, transepithelial electrical resistance, cell movement
Introduction
Nanoparticles may enter the human body via the skin, the gastrointestinal tract, and the respiratory system, with the respiratory system considered the primary gateway. One of the most vulnerable situations in daily life is chronic exposure to airborne traffic particulate matters.1–3 While nanodrugs and their applications in medicine, particularly inhalation and respiratory drug delivery,4,5 and the cytotoxicity of nanomaterials6,7 have been extensively explored, few studies have addressed the direct effects of exposures to various particulate matters. The Calu-3 human lung adenocarcinoma cell line is commonly used to study the airway epithelial barrier because 1) it expresses the cystic fibrosis transmembrane conductance regulator (CFTR) and several acinar cell markers, 2) it forms polarized monolayers with tight junctions, 3) it has robust cAMP-stimulated anion transport, 4) it responds to secretagogues that regulate the glands in vivo, and 5) it secretes mucus.8 Calu-3 cells were recently shown to display a transient transepithelial electrical resistance (TEER) decrease in direct response to deposition of water-dispersible 3-mercaptopropionic-acid (3MPA) coated CdSe-CdS/ZnS core-multishell QDs, with the decrement proportional to the QD dose.9 TEER is generally known to be an indicator of the integrity of tight junctions, reflecting the ionic conductance of the paracellular pathway in the epithelial layer.10 The reported QD-induced transient TEER decrease may, therefore, indicate a loosening of the tight junctions. However, no detectable morphological modifications were found in Calu-3 epithelial layers after repeated QD depositions, once per 6 days for 60 days.9
Cytoplasmic Ca2+ concentration [Ca2+]i plays a key role in a variety of cellular functions and is a master regulator of airway physiology. It controls fluid, mucus, and antimicrobial peptide secretion, ciliary beating, and smooth muscle contraction. Changes in [Ca2+]i regulate transepithelial ion transport and fluid secretion, including Ca2+-activated K+ channels and Cl− channels. New evidence has arisen concerning correlations between Ca2+ signaling and other signaling pathways (cAMP, NO) that impinge upon different ion transport pathways, including cAMP/PKA-activated CFTR anion channels.11 It has been further shown that the polarity of a cell monolayer can be changed by ion transport, fluid secretion, and ciliary movement.12 Abnormality in Ca2+ homeostasis in the airway epithelium may, therefore, contribute to development of airway hyper-responsiveness and the exacerbation of chronic lung diseases, such as asthma, COPD, silicosis/fibrosis, and lung infections.
Nanoparticles have been reported to activate and stimulate cellular signaling pathways via mechanotransduction pathways, wherein integrin receptors, stretch activated (SA) ion channels, focal adhesions, and the cytoskeleton play key roles in activation.13 Recent evidence indicates that the mechanical force induced by magnetic nanoparticles can cause Ca2+ spikes in renal vascular smooth muscle cells and that the intensity of the Ca2+ spike depends upon the mechanical stimulation frequency.14 Tang et al have shown that unmodified CdSe-QDs elevated [Ca2+]i in primary cultures of rat hippocampal neurons, due to both extracellular Ca2+ influx and internal Ca2+ release from endoplasmic reticulum (ER).15 Yan et al showed CdTe quantum dots (QDs) induced the cytotoxicity of human umbilical vein endothelial cells via ER stress-mediated apoptosis pathways.16 The 3MPA-coated QDs used in our previous study9 had carboxyl surface ligands that could link the QDs to the cell membrane proteins/receptors to cause a series of cell pathophysiologic changes,17,18 even though QDs were not found in the Calu-3 cells after medium change (only small QD clusters were found in the extracellular junction areas after repeated QD depositions, once per 6 days for 60 days).
We speculate that the mechanical force of the QD deposition induced a global net Ca2+ influx in the Calu-3 epithelial layer, resulting in the macroscopically observed transient TEER decrease.9 In this work, we focused on studying the Ca2+ influx pathways in an effort to understand the cellular mechanism of QD-induced transient TEER decrease and unravel the early responses of Calu-3 epithelial layer to nanoparticles.
Materials and methods
Reagents
Oregon green 1,2-bis(o-aminophenoxy)ethane-N,N,N′,N′-tetraacetic acid, Acetoxymethyl (OGB-1, O6807) was purchased from Thermo Fisher Scientific ( Waltham, MA, USA); Pluronic® F-127 (P2443-250G), nifedipine (N7634-1G), and ATP (adenosine disalt-sodium hydrate; A2383-1G) from Sigma (St. Louis, MO, USA); GdCl3 (4741) from Bio Techne (Minneapolis, MN, USA); BTP2 (5 mg) from Santa Cruz Biotechnology (Delaware Ave Santa Cruz, CA, USA); Eagle’s Minimum Essential Medium (EMEM, 30-2003) from ATCC (Manassas, VA, USA).
Aqueous solution of 3MPA-coated CdSe-CdS/ZnS core-multishell QDs (8 μM) were prepared in house, as previously described in reference.19 The peak wavelength of the 3MPA-QD was 600 nm and the full width at half-maximum (FWHM) of the QD fluorescence peaks was ~25 nm. Their physiochemical properties have been carefully studied and reported, see previous reports.19,20 Moreover, no perceptible changes in the optical spectra of QDs in the QD-treated Calu-3 samples stored for 6 months were observed, indicating that these QDs are well surface-passivated and are very stable in the Calu-3 cell culture media.9 OGB-1 (50 μg/vial) was dissolved in 10 μL Pluronic F-127 (20%, w/v) to obtain a 4 mM stock solution. ATP solution of 100 mM was prepared fresh by dissolving 55.1 mg ATP powder into 1 mL deionized H2O. BTP2 solution of 50 mM was prepared by dissolving 5 mg BTP2 into 237 μL DMSO and stored at −20°C. Nifedipine solution of 10 mM was prepared by dissolving 3.5 mg into 1 mL DMSO and stored in the dark at 4°C for <1 week before use. GdCl3 inhibits stretched-activated calcium channels,21 so GdCl3 solution of 100 mM was prepared by dissolving 37 mg GdCl3 in 1 mL H2O. Ca2+-rich Krebs-Ringer Buffer (KRB) contained 110 mM NaCl, 4 mM KCl, 25 mM NaHCO3, 1 mM NaH2PO4·H2O, 1.2 mM MgCl2·6H2O, 10 mM D-glucose, 20 mM HEPES, and 1.0 mM CaCl2·6H2O. To prepare Ca2+-free KRB, CaCl2·6H2O in Ca2+-rich KRB was substituted with 2.5 mM EGTA. Both Ca2+-rich and Ca2+-free KRB were titrated to pH 7.4 with NaOH.
Cell culture
Human airway epithelial cells (Calu-3), purchased from ATCC (HTB-55TM), were cultured on Transwell-Clear inserts (6-well clusters, 24-mm inserts with polyester membrane, pore diameter 0.4 μm, Corning, NY, USA), as previously described.9,22 Calu-3 cells (passages 3–6) were seeded into Transwell inserts at a density of 0.4×10⁶ cells/insert, then cultured in EMEM supplemented with 10% fetal bovine serum (FBS), 100 units/mL penicillin, and 100 μg/mL streptomycin (all purchased from Thermo Fisher Scientific) in a humidified atmosphere (5% CO2 at 37°C). The cell culture mediums of both the inserts and the compartments under the inserts (the basolateral compartments) were changed every 2 days.
TEER measurement
TEER was measured using an EVOM2 volt-ohm meter (World Precision Instruments, Sarasota, FL, USA). A Transwell plate was placed on a heating plate with a surface temperature of 37°C. Chopstick electrodes (STX2), first sterilized in 99.5% ethanol, were gently placed into one of the three ports in the insert so that one electrode had contact with the medium above the cells, and the other had contact with the medium in the basolateral compartment. During cell growth, TEER was measured daily. In general, the TEER value reached a plateau (between 2.5 and 3.0 kΩ·cm2) after ca 18 culture days, indicating the formation of a tight epithelial cell layer.9
Under QD deposition (50 μL of 5 μM QD solution), TEER was measured once per 10 s, for a total time duration of ca 20 min. Since mechanical stretch can cause ATP release, which in turn stimulates surrounding cells and spreads the intracellular Ca2+ wave,23 administration of ATP (50 μL of 6 mM) was performed here as a positive control of Ca2+ release. Ca2+-rich KRB (50 μL) deposition was used as a negative control. In order to study their Ca2+ influx effects, KRB, KRB containing BTP2 (50 μM), nifedipine (1 μM), or GdCl3 (100 μM), and Ca2+-free KRB replaced the cell medium 20 min before TEER measurements.
[Ca2+]i measurement
Calu-3 cells grown in the Transwell insert were loaded (in both the apical and basolateral compartments) with OGB-1 (4 μM) for 1 hour at 37°C in FBS-free EMEM buffer. (Note that loading OGB-1 in only the insert did not result in a proper staining, likely due to the polarization of the Calu-3 epithelial layer. Moreover, loading OGB-1 in the basolateral compartment resulted in a large amount of OGB-1 signal in the substrate membrane of the insert, see more in “Results” section, Figure 2A.) After loading, the cells were washed and refilled with KRB, and the inserts were placed on a cover glass mounted in a stage-top incubator, maintained at the standard cell culture conditions (37°C, 5% CO2). [Ca2+]i was assessed by the fluorescence signal of OGB-1, which was excited by a laser of wavelength 488 nm. Two band pass filters were used to separately detect the emission signals from OGB-1 (490–545 nm) and QDs (588–642 nm).
The cells were preincubated with various mediums of different Ca2+ concentrations (Ca2+-rich or Ca2+-free KRB) or Ca2+ inhibitors (BTP2, nifedipine, or GdCl3) for 20 min. Imaging was acquired using z-stack and time-series scan modes for a total measurement time of ca 10 minutes, and the cells were stimulated with QDs, ATP, or KRB solutions at 2 and/or 6 minutes. The experiments were repeated four times on four independent Calu-3 cell culture batches.
Imaging and image analysis
Fluorescence signals and Calu-3 epithelial cells were studied by confocal and bright-field micrographs, using a Zeiss LSM 780 confocal microscope (Carl Zeiss, Jena, Germany). TIFF micrographs were exported from ZEN original image files, using software ZEN 2012 (Zeiss, Germany) without compression, and analyzed offline, using MATLAB. Fluorescence intensities fn(x,y,z,t) of OGB-1, QD, and bright-field signals (n=OGB1, n=QD, and n=BF) were calculated for each recorded time point and (x,y,z) position (MATLAB commands imread and im2double).
Results
TEER measurement
Figure 1 presents typical TEER responses of Calu-3 epithelial layer of different pretreatments and culture ages to the QD deposition. Similar to the previous report,9 QD deposition induced a significant transient TEER decrease in the Calu-3 epithelial layer in Ca2+-rich KRB (see red line in Figure 1A). ATP deposition also prompted a significant, but slow, TEER decrease without a clear recovery within the time duration of the TEER measurement. Administration of store-operated calcium entry (SOCE)-inhibitor BTP2 (50 μM) partially inhibited the TEER decrease in response to the QD deposition, suggesting an involvement of SOCE channels (ie, TRPC channels) in stretch-activated Ca2+ influx. Both VGCC-inhibitor nifedipine and SA-channel inhibitor GdCl3 reduced and stabilized TEER and totally disabled TEER response to QD deposition, probably a result of membrane depolarization caused by Ca2+ influx via SA channels. When Calu-3 cells were immersed in Ca2+-free KRB, their TEER value quickly dropped to the baseline (ca 0.5 kΩ.cm2). After 20 minutes incubation in a standard incubator, the TEER was slightly recovered. It dropped again when the cells were exposed to ambient air, and no TEER response to the QD deposition was detected. Changing back to Ca2+-rich KRB did not recover the TEER until 30 minutes had elapsed (data not shown). Since Ca2+ depletion in the extracellular medium significantly weakened the tight junctions that formed the Calu-3 epithelial monolayer, Ca2+-free KRB impaired the TEER (Figure 1A). Cumulatively, these results point to the important role of [Ca2+]i in understanding the transient TEER response of the Calu-3 epithelial layer to QD deposition.
 | Figure 1 TEER response of Calu-3 epithelial layer to QD deposition. |
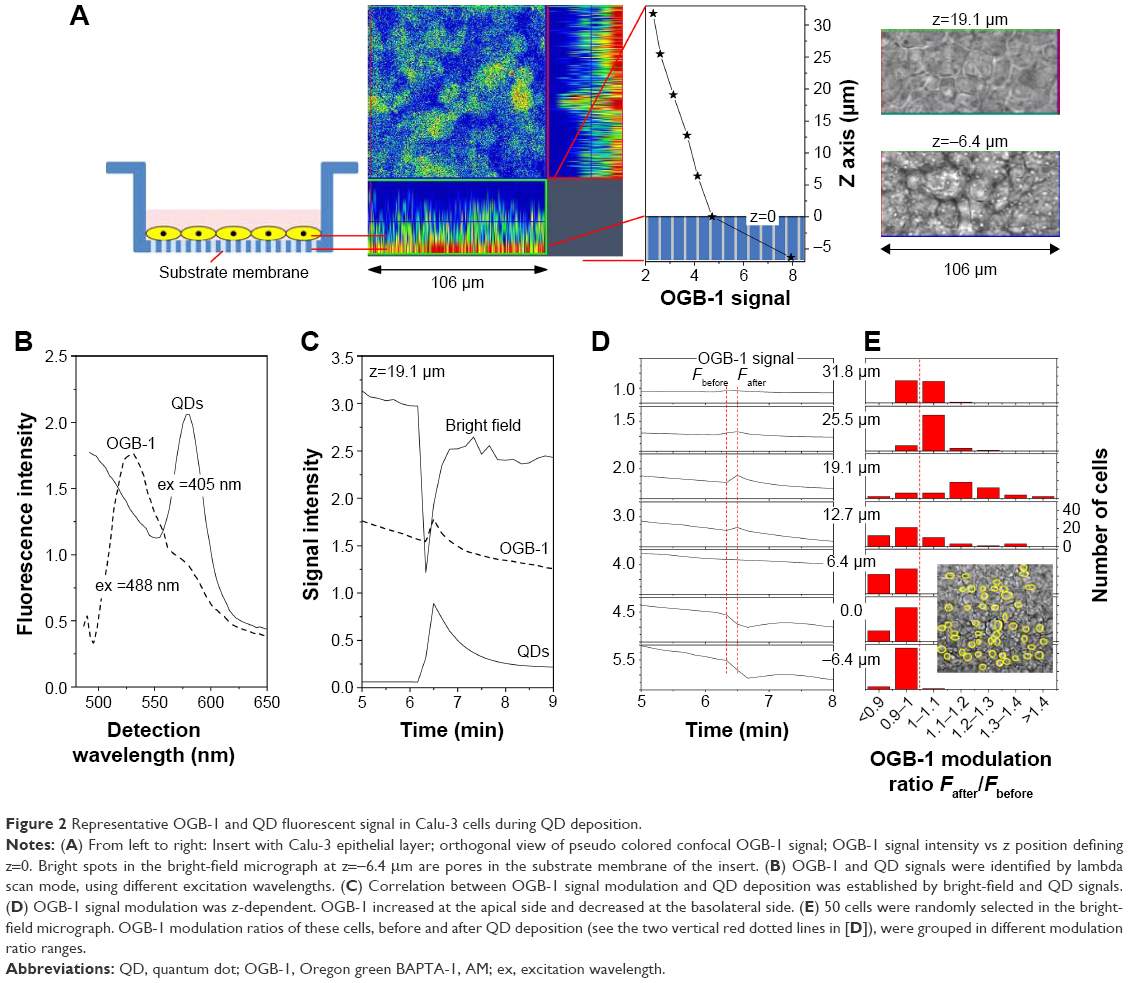 | Figure 2 Representative OGB-1 and QD fluorescent signal in Calu-3 cells during QD deposition. |
We performed further TEER studies on cells of different culture ages (days 8, 15, and 25) and found that the QD-induced transient TEER decrease occurred only in the cell layer grown for 25 days (Figure 1B). Weak TEER response to QD deposition was observed in 15-day-old cells whose TEER was a bit lower than 2.5 kΩ·cm2 (ca 2.2 kΩ·cm2), which is generally considered to be the indication of the tight junction formation. This evidence suggests that only mature epithelial layers displayed significant TEER response to QD deposition.
Effects of QD deposition on [Ca2+]i
To study the effects of QD deposition on [Ca2+]i directly, we loaded the Calu-3 epithelial layer with OGB-1 and imaged its fluorescent signal using a confocal laser-scanning microscope (Figure 2). Micrographs of the Calu-3 monolayer and QD distribution under QD deposition can be found in previous reports.9 The pixel intensity of either OGB-1, QDs, or bright-field was denoted as fn(x,y,z,t), where n=OGB1, QD, or bright-field, (x,y) denotes the spatial position on an observation plane at z position (z-stack mode), and t is the time (time series mode). As previously noted, the apical surface of the Calu-3 cell layer was uniform and intact, so OGB-1 was loaded both in the apical and basolateral compartments. This loading resulted in a very strong residual OGB-1 signal in the vicinity of the substrate membrane of the insert (Figure 2A, z<0; here, OGB-1 signal  , integrated over the whole observation plane, was presented as a function of z at one t). Discrimination of OGB-1 signals in Calu-3 cells and the substrate membrane was performed by z-stack scan mode (strong and uniform in the substrate membrane; more distributed in the epithelial layer) and bright-field micrograph, where the pores in the substrate membrane were clearly visible (Figure 2A). In the following experiment, we first fixed the z-scan step and localized the plane with clear pores in the bright-field micrograph, then moved up one z step, which was defined as the z=0 plane. The apical boundary of the Calu-3 epithelial layer was very difficult to identify (Figure 2A), and imaging the Calu-3 epithelial layer turned out to be quite challenging because of the rather thick cell layer (ca 25 μm). A trade-off was therefore made between spatial resolution and temporal resolution (see more below).
The identifications of the OGB-1 and QD fluorescence were confirmed by their optical spectra, using lambda scan mode, by which OGB-1 was efficiently excited by 488 nm light and QDs by 405 nm light (Figure 2B). The correlation of the OGB-1 signal modulation to the QD deposition was established by simultaneous bright-field brightness decrease (bright-field was partially blockaded by QDs) and the appearance of the QD signal at the apical side of the Calu-3 epithelial layer (Figure 2C). Figure 2D shows the OGB-1 signals at different z planes. Note that OGB-1 signal was strong in the basolateral compartment and weak in the apical side (vertical axes in Figure 2D).
The most notable result of this section of study was the transient OGB-1 increase at the apical side and the decrease at the basolateral side (Figure 2D). We also found that [Ca2+]i increase in the apical side was fast (ca 10–20 s after QD deposition), similar to the response time of the TEER to QD deposition (Figure 1), while Ca2+ decrease in the basolateral side was somewhat slower (30 s after QD deposition). This was attributed to the polarization of the Calu-3 epithelial layer.
With the monolayer formation, it was difficult to isolate the OGB-1 signals of individual cells, as the observed OGB-1 signal, distributed across the whole observation plane with peaks and depressions, did not always co-localize with cells in the bright-field micrograph. Moreover, cells in the Calu-3 epithelial layer displayed complicated movements in response to the QD deposition (see more below). In an effort to study the QD deposition effects at the individual cell level, fifty cells, well separated from each other, were identified and randomly chosen from the bright-field micrograph (Figure 2E). Their [Ca2+]i modifications were calculated as
|

at different z positions, where tafter =6 min 20 s was the time after QD deposition, and tbefore =6 min 10 s was the time before QD deposition (see the vertical dashed lines in Figure 2D). We then counted the number of cells whose Rcell (z) was in a certain range (data presented in Figure 2E), finding that OGB-1 signals in the basolateral side (z<6.4 μm) of cells were all decreased, while the OGB-1 signals at the apical side (z=19.1 and z=25.5 μm) increased in nearly all fifty cells. Similar results were observed in all independent experiments performed in this study, though the absolute values of Rcell (z) varied.
In order to assess the overall [Ca2+]i response of the Calu-3 epithelial layer, we normalized the time-dependent OGB-1 signal at each observation plane by its initial value, then integrated over z to obtain the global [Ca2+]i modulation. The rationale behind such a numerical analysis scheme is that, since our microscope was inverted, the light signal from the apical side was subjected to more absorption and scattering than the light from the basolateral side. The real [Ca2+]i increment in the apical side was therefore larger than shown in Figure 2D. Numerically, it is presented as
|
|

Results of four independent OGB-1 measurements are shown in Figure 3, clearly displaying the global transient [Ca2+]i increase in response to the QD deposition. Here, different cell batches, different xy observation areas, and different z steps and time steps were used to acquire the images. Moreover, a second QD deposition (Figure 3D) caused a similar transient [Ca2+]i increase. In general, the temporal development of the OGB-1 signals of individual inserts varied significantly, similar to the TEER vs time relationships reported previously.9 More specifically, a profound transient [Ca2+]i increase was displayed where the observation view happened to contain many cells that strongly responded to the QD deposition (Figure 3A). Notice that the exact xy location of the QD deposition, which was aimed to be the center of the scanning laser spot, varied in every experiment and was a strong, but uncontrollable, factor in determining the absolute amplitude of the OGB-1 signal modulation. (This differs significantly from the TEER measurement, which is always the value of the whole Calu-3 epithelial layer, as imaging is limited to a very small part of the Calu-3 epithelial layer.) The refined z scanning may have also helped reveal the strong OGB-1 signal modulation (Figure 3A). We reduced the spatial resolutions (Figure 3B–D) and observed that the response time of the OGB-1 signal to the QD deposition was about 10 s, matching the response time of the TEER previously shown in Figure 1. Since our early work did not find clear indication of any reduction in the integrity of the Calu-3 epithelial layer under QD deposition, the observed transient TEER decrease must imply a global [Ca2+]i increase in the whole Calu-3 epithelial layer (Figure 3).
 | Figure 3 Global OGB-1 fluorescence increase of four Calu-3 epithelial layers (different batches) under QD deposition. |
[Ca2+]i response induced by QD deposition when extracellular Ca2+ influx was inhibited
For further in-depth study of the [Ca2+]i cellular mechanisms’ response to QD deposition, we attempted to block Ca2+ release and/or influx by using Ca2+-free medium, SOCE channel inhibitor BTP2, VGCC blocker nifedipine, and SA channel inhibitor GdCl3.24 We performed fast time-series scanning on a single observation plane close to the apical surface of the Calu-3 epithelial layer. The contribution of the Ca2+ influx from the extracellular side to the QD deposition was confirmed. When QDs were applied to the cells in Ca2+-free solution, the Ca2+ signal quickly declined and no perceptible response to the QD deposition was detected (Figure 4A). In cells pretreated with either BTP2 (50 μM) or GdCl3 (10 μM), the [Ca2+]i signal did not show any response to QD deposition (Figure 4B, and D). However, VGCC inhibitor nifedipine did not play a definitive role in inhibiting [Ca2+]i response to the QD deposition (Figure 4C), despite the fact that it reduced and stabilized TEER (Figure 1). This clearly suggests that a stretched-induced Ca2+ influx, induced by QD deposition, occurred both via SA channels and SOCE channels and, in part, via a nifedipine-resistant pathway. Furthermore, ATP, an agonist of purinergic receptors used as a positive control of calcium release, triggered a transient Ca2+ increase, although the time duration of the increase was longer (Figure 4E), as was its TEER response (Figure 1). This result clearly demonstrates that [Ca2+]i causes membrane depolarization, and it is in agreement with previous results suggesting a release of ATP after mechanical-stress. A total of 50 μL KRB (same volume of QD deposition) was deposited as a negative control, showing that OGB-1 signal increased only when QDs were present in the solution given to the cells (Figure 4F).
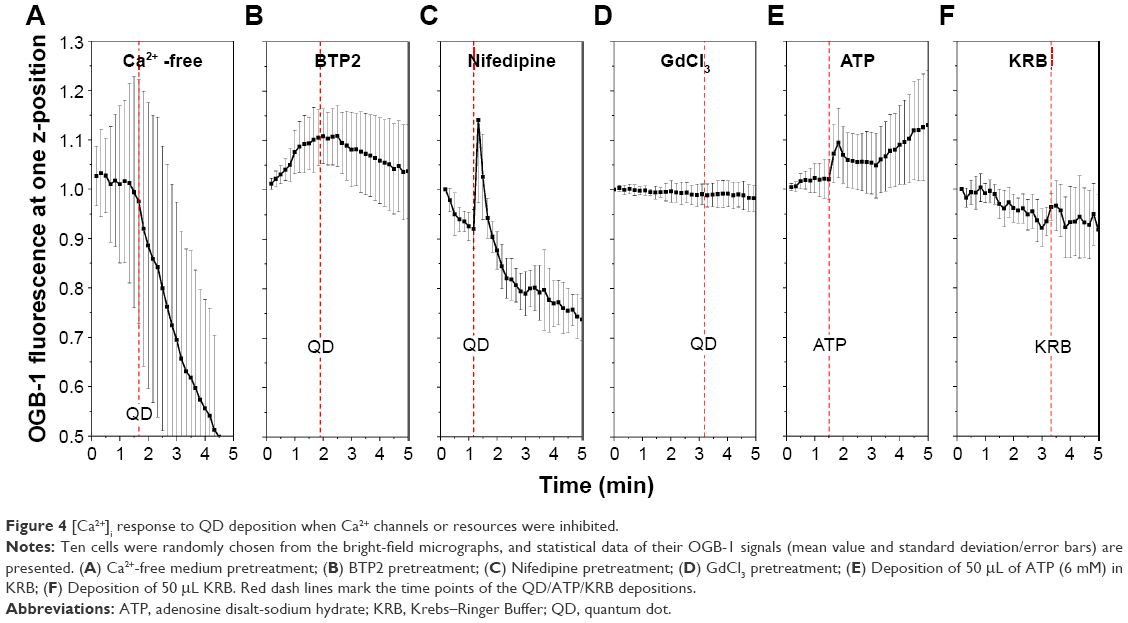 | Figure 4 [Ca2+]i response to QD deposition when Ca2+ channels or resources were inhibited. |
Cell movements
We noticed complicated cell movements (Figure 5A and B) in Calu-3 epithelial layer in response to the QD deposition, probably due to the fact that cells were closely inter-connected in the Calu-3 epithelial layer. To quantify the cell movements, we differentiated the bright-field micrographs of the time series.
 | Figure 5 QD deposition induced cell movements. |
|

We created a color scheme to depict the different cell movements (Figure 5C). The blue regions mark the negative values of δ (x,y,z,t), the red regions denote positive δ (x,y,z,t), and zero is green. To avoid possible cancelation of the blue (δ (x,y,z,t)<0) and red (δ (x,y,z,t)>0) strips in quantifying the cell movements (Figure 5E), two differentiation-summation schemes were employed, as per Figure 5D
|

for z=12.7 μm. The transient movement of cells induced by the QD deposition was thus clearly demonstrated. Many paired blue-red strips in Figure 5C are clearly visible in the D(t) spectrum of Figure 5D, indicating that a majority of cells displaced themselves after QD deposition. The d(t) spectrum shows a net contraction of all cells under observation directly after QD deposition (d<0), followed by a net cell expansion (d>0). The contraction–expansion cycles occurred several times, lasting ca 2 min, probably due to the continuous sedimentation of QDs after their administration. This was consistent with the finding that QD deposition induced mechanical stretch and Ca2+ influx, which, in turn, stimulated surrounding cells and spread the intracellular calcium wave. Since cells were closely inter-connected in the Calu-3 epithelial layer, such a collective cell displacement movement was anticipated.
We further analyzed the cell movements of various pretreated cells under QD/ATP/KRB administration and realized that the majority of the cells either contracted or expanded (Figure 5F–J) without apparent cell displacement. Cells placed in Ca2+-free medium and pretreated with BTP2 underwent two to three cell contraction–expansion cycles, while cells pretreated with nifedipine displayed only one contraction–expansion cycle, after which they remained basically motionless. Note that the amplitude of the contraction–expansion in nifedipine-treated cells was 4–5 times higher than in other cases. This suggests that VGCC may interact with structural proteins involved in contraction–expansion processes and/or that nifedipine might directly inhibit some structural proteins. GdCl3-pretreated cells displayed very little cell movement (and no TEER or [Ca2+]i modulation). ATP deposition induced one contraction–expansion cycle, while KRB deposition induced very small cell movements (Figure 5K).
[Ca2+]i response to QD deposition in Calu-3 layers of different culture ages
Next, we studied the [Ca2+]i response of Calu-3 cells of different culture ages to the QD deposition. Calu-3 cell layers cultured for 8, 15, and 23 days were subjected to the identical QD deposition (50 μL QDs of 8 μM), and the results are reported in Figure 6. The cells cultured for 8 days displayed little OGB-1 response to the QD depositions (confirmed by the small, but still perceptible, cell movements, see Figure 6D and G), while the cells cultured for 15 (Figure 6E and H) and 23 days (Figure 6F and I) showed clear [Ca2+]i increase in response to the QD deposition. The orthogonal micrographs of the Calu-3 cell cultures (Figure 6A–C) demonstrate that the thickness of cells/cell layers increased over time (green signal). Most importantly, QDs did not penetrate to the basolateral region of the cell layer cultured for 23 days, while sporadic holes could be observed in the OGB-1/QD merged micrograph of the cell culture of 15 days, explaining its low TEER value and insignificant TEER response to QD deposition in Figure 1.
 | Figure 6 [Ca2+]i response of Calu-3 cells of different culture ages under QD deposition. |
Discussion
Airway epithelial cells create an efficient defense barrier against inhaled environmental pathogens, toxic agents, and particulates. The cells connect to each other via intercellular junctions. The tight junction regulates diffusions and allows the cell layer to form selectively permeable cellular barriers that separate the apical (luminal) and basolateral (abluminal) sides of the lung, thereby controlling transport processes and maintaining homeostasis. Such barrier integrity is vital to the physiological activities of the lung.25 In our previous work,9 we reported a transient TEER decrease in the Calu-3 monolayer caused by periodic QD depositions every 6 days for 60 days. It was further demonstrated that the cells did not show clear morphological changes and that there was a very limited number of QDs in the cell monolayer. Note that our QDs were well passivated and stable in Calu-3 cell monolayer, possibly (partially) explaining the limited QD uptake by Calu-3 monolayer, even though they still caused a significant TEER response. These results point to the efficacy of the defense mechanisms of the airway epithelial barrier against QD deposition. From this conclusion, two questions arose. The first question concerns the observed transient TEER decrease. How did the QDs’ deposition induce the transient TEER decrease while allowing the integrity of the epithelial layer to remain intact? Second, the study was limited to only 60 days of repeated QD depositions. How do we correlate this study to the lung health issues induced by chronic exposure to various nanoparticles?
The first question is now answered by the conclusion that [Ca2+]i in the epithelial layer was transiently increased in response to the QD deposition. The increase of free ions and their polarized distribution decreased the electrical resistivity of the epithelial monolayer, resulting in the observed transient TEER decrease. These results were confirmed by the precise temporal correlation between the transient TEER decrease and [Ca2+]i increase.
The answer to the second question proves far more complicated. [Ca2+]i is believed to be one of the key regulatory secondary messengers in secretory cells with regards to anion secretion and ciliary beating.11,26 An increased [Ca2+]i is known to trigger and increase ciliary beating and stimulate ion and mucus secretion, all of which is believed to protect the epithelial layer from repeated QD invasions, as previously reported.9 Here, we found that QD deposition elevated the [Ca2+]i in the Calu-3 epithelial layer with a polarized spatial distribution. This clearly implies that the QD deposition has a significant impact on the lung barrier.
The Ca2+ permeable, nonselective SA cation channels have already been shown to be crucial for the mechanical stretch elevation of [Ca2+]i in airway smooth muscle cells.27–29 In this study, we found that mechanical stretch induced by nanoparticles, in this case QDs, elevated [Ca2+]i in the Calu-3 epithelial cell layer and that this elevation was suppressed by removal of extracellular Ca2+. This demonstrates that the [Ca2+]i increase triggered by mechanical stress is mainly a result of Ca2+ influx from the extracellular side, rather than from the intracellular Ca2+ stores. Moreover, the stretched-activated increase in [Ca2+]i was also blocked by GdCl3, suggesting that mechanical stress causes Ca2+ influx through SA channels.
In metazoans, one primary source of [Ca2+]i signals in both excitable and nonexcitable cells is the family of store-operated Ca2+ channels, which responds to the reduction of ER intraluminal Ca2+ entry.30 The SOCE has been shown to play an important role in the ciliary beating and ion transport of airway epithelial cells.11,26 Our study indicated that SOCE inhibitor BTP2 could inhibit the [Ca2+]i increase in response to QD deposition in Calu-3 layer. This suggests not only that Ca2+ release from ER was involved in the response of airway epithelial cells to the QD deposition, but also that, as previously hypothesized, SOCE channels are involved in mechanotransduction.31
Ca2+ ions in extracellular matrix are the main source of exchange between intra- and extracellular compartments. A direct relationship between Ca2+ transport across the plasma membrane and the TEER has been reported.32,33 When Ca2+ ions were removed from the culture medium, the TEER of the epithelial layer quickly dropped down to the TEER values of the blank insert (devoid of any cells, ca 0.5 kΩ·cm2). Fifteen minutes incubation at 37°C, 5% CO2 and humidified atmosphere increased the TEER slightly (Figure 1A). [Ca2+]i signal in cells fell rapidly under microscopic measurement and no response to the QD deposition was observed (Figure 4A). This demonstrated, once more, that extracellular Ca2+ influx is an important resource to support [Ca2+]i activities in the Calu-3 epithelial layer.
In addition, several different voltage dependent Ca2+ (CaV) channels have been identified in mammal cells. CaV channels are the key signal transducers of electrical signaling, converting depolarization of the cell membrane to an influx of Ca2+ ions that initiates contraction, secretion, neuro transmission, and other intracellular regulatory events. CaV1 channels conduct L-type Ca2+ currents, which are important in excitation–contraction coupling, endocrine secretion, sensory transduction, and regulation of enzyme activity and gene expression.34 Calu-3 cells are shown to express CaV1 channel.35 However, we found that blocking VGCC using nifedipine did not significantly inhibit the [Ca2+]i response to a QD deposition (Figure 4C), implying that VGCC plays a minor role in the response of Calu-3 monolayer to QD deposition. Interestingly, nifedipine decreased and stabilized TEER significantly (Figure 1A). The most likely explanation for this result is that nifedipine can act as an antagonist to the mineralocorticoid receptor, as previously reported,36 and inhibit some excitation-triggered responses, such as ion secretion.
Many studies use the plateau TEER value between 2.5 and 3.0 kΩ·cm2 as an indicator of the formation of a tight epithelial cell monolayer. In the present work, liquid-covered Calu-3 cells cultured for 15 days and having a TEER of 2.0 kΩ·cm2 did not show a significant TEER response to a QD deposition (Figure 1B). However, they did show a clear [Ca2+]i response, similar to cells cultured for 23 days (Figure 5). This indicates that the observed [Ca2+]i increase in response to the QD deposition occurred before the formation of the tight epithelial cell layer and, consequently, implies that Calu-3 cells had already developed a defense against the QD deposition before the formation of a tight intracellular structure. The faster and more marked change in the [Ca2+]i increase at the apical side of the epithelial layer points to the significant defensive role, partially confirmed by the cell movements, of cilia beating.
In conclusion, the 3MPA-coated core-multishell QDs studied in this work are well passivated and very stable in the Calu-3 cell monolayer.9 Their deposition, however, induced significant, simultaneous [Ca2+]i increase and TEER decrease in the Calu-3 epithelial layer in vitro, here blockaded by SA and SOCE channel inhibitors. This clearly implies that the QD deposition induces mechanical stress, known to affect proliferation, migration, synthesis ability, or cytokine production via altered Ca2+ homeostasis, thus significantly impacting the lung barrier. Cells within tissues are constantly subjected to mechanical forces, including hydrostatic pressure, pressure, shear stress, and tension. Cells can dynamically adapt to these nanoscale forces by modifying their behavior and reshaping their microenvironments, but loss of tissue homeostasis can contribute to disease.37,38 Once pushed beyond capability, the defense barrier will be damaged by the QD attack. This work presents a new perspective for examining the effect of excessive mechanical stress during nanoparticle deposition on the airway epithelium. Through such study, we hope to reveal and elucidate factors that contribute to pulmonary disease.
Disclosure
The authors report no conflicts of interest in this work.
References
Badyda AJ, Dabrowiecki P, Czechowski PO, Majewski G, Doboszynska A. Traffic-related air pollution and respiratory tract efficiency. Adv Exp Med Biol. 2015;834:31–38. | ||
Oudin A, Forsberg B, Adolfsson AN, et al. Traffic-related air pollution and dementia incidence in northern Sweden: a longitudinal study. Environ Health Perspect. 2016;124(3):306–312. | ||
World health Organization. World health report 2013: Research for universal health coverage. Geneva: World health Organization; 2013 Available from: http://www.who.int/whr/en/. Accessed August 15, 2013. | ||
Sung JC, Pulliam BL, Edwards DA. Nanoparticles for drug delivery to the lungs. Trends Biotechnol. 2007;25(12):563–570. | ||
Smola M, Vandamme T, Sokolowski A. Nanocarriers as pulmonary drug delivery systems to treat and to diagnose respiratory and non respiratory diseases. Int J Nanomed. 2008;3(1):1–19. | ||
Choi HS, Ashitate Y, Lee JH, et al. Rapid translocation of nanoparticles from the lung airspaces to the body. Nat Biotechnol. 2010;28(12):1300–1303. | ||
De Jong WH, Borm PJ. Drug delivery and nanoparticles: applications and hazards. Int J Nanomed. 2008;3(2):133–149. | ||
Shan J, Huang J, Liao J, Robert R, Hanrahan JW. Anion secretion by a model epithelium: more lessons from Calu-3. Acta physiol. 2011;202(3):523–531. | ||
Turdalieva A, Solandt J, Shambetova N, et al. Bioelectric and morphological response of liquid-covered human airway epithelial Calu-3 cell monolayer to periodic deposition of colloidal 3-Mercaptopropionic-Acid coated CdSe-CdS/ZnS core-multishell quantum dots. PLoS One. 2016;11(2):e0149915. | ||
Srinivasan B, Kolli AR, Esch MB, Abaci HE, Shuler ML, Hickman JJ. TEER measurement techniques for in vitro barrier model systems. J Lab Autom. 2015;20(2):107–126. | ||
Lee RJ, Foskett JK. Ca(2)(+) signaling and fluid secretion by secretory cells of the airway epithelium. Cell calcium. 2014;55(6):325–336. | ||
Wang D, Sun Y, Zhang W, Huang P. Apical adenosine regulates basolateral Ca2+-activated potassium channels in human airway Calu-3 epithelial cells. Am J Physiol Cell Physiol. 2008;294(6):C1443–C1453. | ||
Sniadecki NJ. A tiny touch: activation of cell signaling pathways with magnetic nanoparticles. Endocrinology. 2010;151(2):451–457. | ||
Balasubramanian L, Ahmed A, Lo CM, Sham JS, Yip KP. Integrin-mediated mechanotransduction in renal vascular smooth muscle cells: activation of calcium sparks. Am J Physiol Regul Integr Comp Physiol. 2007;293(4):R1586–1594. | ||
Tang M, Xing T, Zeng J, et al. Unmodified CdSe quantum dots induce elevation of cytoplasmic calcium levels and impairment of functional properties of sodium channels in rat primary cultured hippocampal neurons. Environl Health Perspect. 2008;116(7):915–922. | ||
Yan M, Zhang Y, Qin H, et al. Cytotoxicity of CdTe quantum dots in human umbilical vein endothelial cells: the involvement of cellular uptake and induction of pro-apoptotic endoplasmic reticulum stress. Int J Nanomed. 2016;11:529–542. | ||
Akerman ME, Chan WC, Laakkonen P, Bhatia SN, Ruoslahti E. Nanocrystal targeting in vivo. Proc Natl Acad Sci U S A. 2002;99(20):12617–12621. | ||
Dahan M, Levi S, Luccardini C, Rostaing P, Riveau B, Triller A. Diffusion dynamics of glycine receptors revealed by single-quantum dot tracking. Science. 2003;302(5644):442–445. | ||
Shambetova N, Chen Y, Xu H, et al. Acid dissociation of 3-Mercaptopropionic acid coated CdSe–CdS/Cd0.5Zn0.5S/ZnS core–multishell quantum dot and strong ionic interaction with Ca2+ion. J Phys Chem C. 2016;120(6):3519–3529. | ||
Ning Z, Molnar M, Chen Y, et al. Role of surface ligands in optical properties of colloidal CdSe/CdS quantum dots. Phys Chem Chem Phys. 2011;13(13):5848–5854. | ||
Franco A Jr, Winegar BD, Lansman JB. Open channel block by gadolinium ion of the stretch-inactivated ion channel in mdx myotubes. Biophysl J. 1991;59(6):1164–1170. | ||
Harcourt JL, Haynes LM. Establishing a liquid-covered culture of polarized human airway epithelial Calu-3 cells to study host cell response to respiratory pathogens in vitro. J Vis Exp. 2013;72:pii 50157. | ||
Murata N, Ito S, Furuya K, et al. Ca2+ influx and ATP release mediated by mechanical stretch in human lung fibroblasts. Biochem Biophys Res Comm. 2014;453(1):101–105. | ||
Sanchez-Hernandez Y, Laforenza U, Bonetti E, et al. Store-operated Ca(2+) entry is expressed in human endothelial progenitor cells. Stem Cells Dev. 2010;19(12):1967–1981. | ||
Matter K, Balda MS. Functional analysis of tight junctions. Methods. 2003;30(3):228–234. | ||
Schmid A, Salathe M. Ciliary beat co-ordination by calcium. Biol Cell. 2011;103(4):159–169. | ||
Davis MJ, Meininger GA, Zawieja DC. Stretch-induced increases in intracellular calcium of isolated vascular smooth muscle cells. Am J Physiol. 1992;263(4 Pt 2):H1292–H1299. | ||
Beech DJ, Muraki K, Flemming R. Non-selective cationic channels of smooth muscle and the mammalian homologues of Drosophila TRP. J Physiol. 2004;559(Pt 3):685–706. | ||
Ito S, Kume H, Naruse K, et al. A novel Ca2+ influx pathway activated by mechanical stretch in human airway smooth muscle cells. Am J Respir Cell Mol Biol. 2008;38(4):407–413. | ||
Prakriya M, Lewis RS. Store-operated calcium channels. Physiol Rev. 2015;95(4):1383–1436. | ||
Yin J, Kuebler WM. Mechanotransduction by TRP channels: general concepts and specific role in the vasculature. Cell Biochem Biophys. 2010;56(1):1–18. | ||
Deli MA. Potential use of tight junction modulators to reversibly open membranous barriers and improve drug delivery. Biochim Biophys Acta. 2009;1788(4):892–910. | ||
Suzuki T, Hara H. Various nondigestible saccharides open a paracellular calcium transport pathway with the induction of intracellular calcium signaling in human intestinal Caco-2 cells. J Nutr. 2004;134(8):1935–1941. | ||
Yu FH, Catterall WA. The VGL-chanome: a protein superfamily specialized for electrical signaling and ionic homeostasis. Sci STKE. 2004;2004(253):re15. | ||
Boitano S, Sanderson MJ, Dirksen ER. A role for Ca(2+)-conducting ion channels in mechanically-induced signal transduction of airway epithelial cells. J Cell Sci. 1994;107(Pt 11):3037–3044. | ||
Luther JM. Is there a new dawn for selective mineralocorticoid receptor antagonism? Curr Opin Nephrol Hypertens. 2014;23(5):456–461. | ||
Davies PF, Spaan JA, Krams R. Shear stress biology of the endothelium. Ann Biomed Engg. 2005;33(12):1714–1718. | ||
Butcher DT, Alliston T, Weaver VM. A tense situation: forcing tumour progression. Nat Rev Cancer. 2009;9(2):108–122. |
 © 2017 The Author(s). This work is published and licensed by Dove Medical Press Limited. The full terms of this license are available at https://www.dovepress.com/terms.php and incorporate the Creative Commons Attribution - Non Commercial (unported, v3.0) License.
By accessing the work you hereby accept the Terms. Non-commercial uses of the work are permitted without any further permission from Dove Medical Press Limited, provided the work is properly attributed. For permission for commercial use of this work, please see paragraphs 4.2 and 5 of our Terms.
© 2017 The Author(s). This work is published and licensed by Dove Medical Press Limited. The full terms of this license are available at https://www.dovepress.com/terms.php and incorporate the Creative Commons Attribution - Non Commercial (unported, v3.0) License.
By accessing the work you hereby accept the Terms. Non-commercial uses of the work are permitted without any further permission from Dove Medical Press Limited, provided the work is properly attributed. For permission for commercial use of this work, please see paragraphs 4.2 and 5 of our Terms.