")
Back to Journals » Drug Design, Development and Therapy » Volume 11
Preliminary study of nanonized lamotrigine containing products for nasal powder formulation
Authors Gieszinger P , Csóka I , Pallagi E, Katona G, Jójárt-Laczkovich O, Szabó-Révész P , Ambrus R
Received 1 April 2017
Accepted for publication 31 May 2017
Published 23 August 2017 Volume 2017:11 Pages 2453—2466
DOI https://doi.org/10.2147/DDDT.S138559
Checked for plagiarism Yes
Review by Single anonymous peer review
Peer reviewer comments 2
Editor who approved publication: Professor Manfred Ogris
Péter Gieszinger, Ildikó Csóka, Edina Pallagi, Gábor Katona, Orsolya Jójárt-Laczkovich, Piroska Szabó-Révész, Rita Ambrus
Faculty of Pharmacy, Institute of Pharmaceutical Technology and Regulatory Affairs, University of Szeged, Szeged, Hungary
Abstract: The nasal delivery of drugs offers a great alternative route to avoid adverse events and to increase patient compliance due to its advantageous properties. Besides nasal application, topical, systemic and central effects are also available. Nasal powders (NPs) have better adhesion due to the additive polymers that may be, eg, gelling or good wettability agents; thus, their bioavailability is better compared to the liquid formulations. Using nanoparticles, innovative and more efficient products can be achieved, which may lead to the improvement of different therapies. The aim of this study was to produce NP formulations containing lamotrigine (LAM) as interactive physical mixtures and nanosized LAM-based formulations. After risk assessment of the preliminary tests, the micrometric properties (particle size and morphology) and the structural properties (differential scanning calorimetry [DSC], X-ray powder diffraction [XRPD]) were investigated; thereafter, physicochemical properties (solubility, polarity) and in vitro dissolution and diffusion profiles were also examined. These product samples showed an appropriate particle size ranging 10–25 µm, while the particle size of LAM in the products was between 120 and 230 nm and the dissolved amount of drug was >60% after 5 minutes in these cases.
Keywords: nanonization, nasal powder, lamotrigine, co-milling, risk assessment
Introduction
The nasal cavity as an alternative route of drug administration became very important in the past years. By formulating nanoparticles for nasal application, the unpleasant effects can be reduced or eliminated due to the advantages of this alternative route and the increased specific surface area of the particles.1 Local, systemic and central nervous system (CNS) effects are also available through nasal application.2–4 This kind of drug administration could be useful in the therapy of CNS diseases;5 therefore, eg, carbamazepine, morphine or olanzapine was applied in the present study.6 Our research group investigated nasal liquid formulations previously;1,7–9 in our present study, this is the first time when powder formulations for intranasal application were investigated.
Nasal powders (NPs) are formulated to have favorable physicochemical and microbiological qualities and stability; thus, preservatives are not needed. They have high adhesion ability and rapid onset of action;10 therefore, innovative products can be generated by using modern applicators and formulating nanoparticles. The quality recommendations and quality requirements concerning NPs are included in regulations and guidelines about the nasal and inhalation products of the international authorization bodies.11–14 From a regulatory point of view, nasal products as powerful drug delivery systems are special because they are recommended to be planned, developed and optimized parallel with the delivery device (eg, NP inhaler, NP sprayer, NP insufflators) in order to assure proper dosing.15,16 For dry powders, the related European Medicines Agency (EMA) and US Food and Drug Administration (FDA) guidelines recommend special attention and critical thinking about the following: 1) drug substance specifications, such as particle size (in related literature, it is recommended to be >20 μm), particle size distribution, crystalline form, shape and crystallinity, which could be critical for product and aerodynamic performance; 2) excipient specifications and 3) sensitivity testing of humidity and temperature.11,12,17,18 Most of the currently used active pharmaceutical ingredients (APIs) are poorly water soluble; thus, property repair technologies, eg, dry milling, are required considering the technological parameters (applied excipients and procedures) based on preliminary design as a part of the Quality by Design (QbD) method.
The additives used in powder formulations have a great influence on nasal absorption because residence time on the nasal mucosa is increased and they hold cells together; thus, the API can penetrate through the membranes more effectively. The most commonly used types of additives are mucoadhesive polymers, such as sodium hyaluronate (NaHA) and hydroxypropyl cellulose (HPC),1,10 which aim to increase the residence time of API on the nasal mucosa, which leads to improved penetration. Polyvinyl alcohol (PVA) and polyvinylpyrrolidone K25 (PVP_K25) are often used polymers to preserve the individuality of the particles and to open the tight junctions.19,20
Particle size reduction to the nano range is a promising way to improve the dissolution rate properties of poorly water-soluble drugs.21 Top–down processes such as co-grinding produce micro- or nanoparticles by using mechanical stresses. These technologies are environmentally and economically advantageous because they are organic solvent free, simple and well reproducible.22–24 In this case, nanoparticles are produced by grinding the drug together with one or two additives, which are responsible for the stability and maintenance of the uniqueness of the particles.25
QbD is a holistic and systematic quality management method,26 where the development design is risk and knowledge based; thus, the experiments in practice can be planned more efficiently.27 In a QbD-based development, the first step is the prior definition of the quality target product profile (QTPP; essential parameters from the point of view of the patient and the clinical setting). The next step is the selection of the parameters that influence the QTPPs critically. These are the critical quality attributes (CQAs) related to the materials and product and the critical process parameters (CPPs) related to the selected production method. The key element of a QbD-guided development is risk assessment (RA), which can be initial, updated or final. Good RA results are essential for designing the studies in practice. The RA-based development and screening could be more effective and can be used successfully even in the early development of pharmaceutical products.28,29
The previous studies of our research group focused on the nasal delivery of nanonized nonsteroidal anti-inflammatory drugs (NSAIDs) using QbD approach.28,29 In the present article, the aims of the authors were to produce and investigate nanonized API containing NP compared to its interactive physical mixtures (PMs). The QbD method-based initial RA was also performed to predict the factors that have the highest influence on the quality of the product. During the study, we applied a poorly water-soluble drug called lamotrigine (LAM; 0.17 mg/mL in water at 25°C) as a model drug and PVP_K25, PVA and NaHA as additives for the NP formulation.30 The nose as an alternative and effective route of administration and the nanonized particles together could be beneficial in the therapy of different diseases.
Materials and methods
Materials
LAM, a second-generation antiepileptic drug of the phenyltriazine class, was purchased from Teva Ltd. (Budapest, Hungary). PVP_K25 and PVA, both water-soluble synthetic polymers, were supplied by ISP Customer Service GmBH (Cologne, Germany). Sodium hyaluronate (NaHA) polymer was purchased from Gedeon Richter Ltd. (Budapest, Hungary).
Methods
Initial RA
To perform the QbD-based initial RA, the first step was the determination of the QTPP of the aimed product. After that, the CQAs and the CPPs of the selected production method were identified. To this identification, a knowledge space development was executed as part of the QbD methodology and an Ishikawa diagram was set up. For performing the RA, the LeanQbD® software (QbD Works LLC, Fremont, CA, USA) was used as a technical tool. The first step of RA was to carry out an interdependence rating among the QTPPs and CQAs and also among the CQAs and CPPs. A three-level scale was used to describe the relation between the parameters. Accordingly, the interaction between the elements was described as “high” (H), “medium” (M) or “low” (L). The dynamism of this interdependence rating is presented in tables generated by the software. This was followed by the probability rating step, in which CPPs were estimated and categorized on a 10-point scale. Finally, Pareto charts were generated by the software, presenting the numeric data and the ranking of the CQAs and CPPs.
Preparation of the samples
PVP_K25, PVA and NaHA were used for sample preparation as additives to maintain the stability and individuality of nanonized LAM particles. Figure 1 shows the process of sample preparation, where 1–1 g of LAM and additives (1:1 ratio) were placed in a Turbula mixer (Turbula System Schatz; Willy A. Bachofen AG Maschinenfabrik, Basel, Switzerland) using 60 rpm for 10 minutes; thus, interactive PMs were prepared.
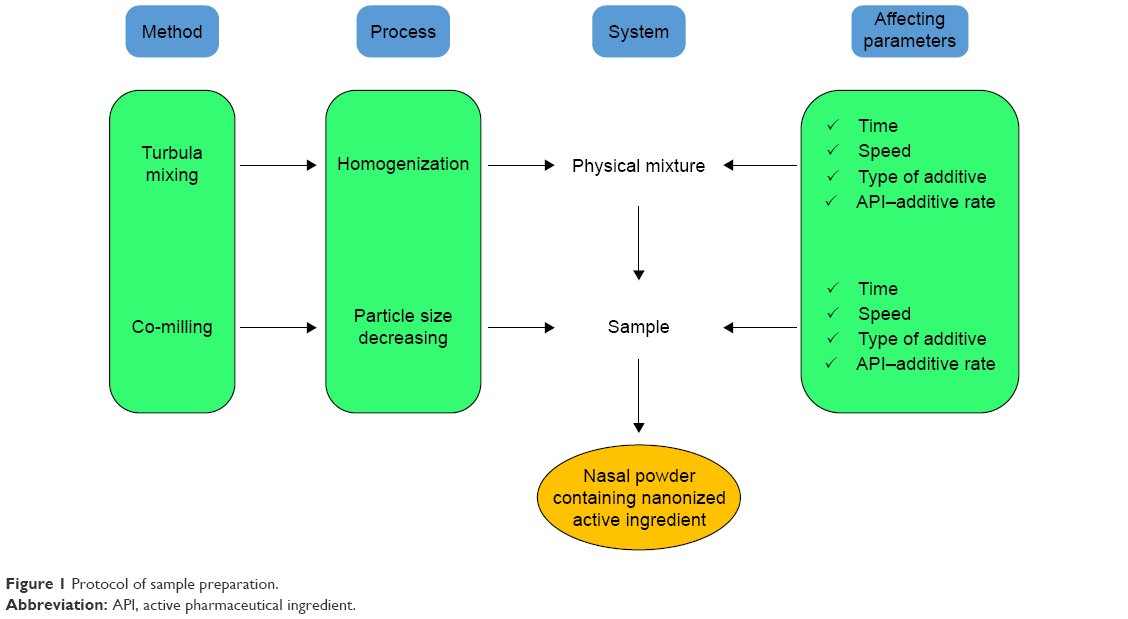 | Figure 1 Protocol of sample preparation. |
During the preliminary experiments, the effects of three ratios of APIs, additive (1:1, 1:2 and 2:1), milling time (2, 4 and 6 hours) and speed (200, 400 and 600 rpm), were investigated. The optimal parameters of dry milling were selected on the basis of these experiments and can be found in Table 1.
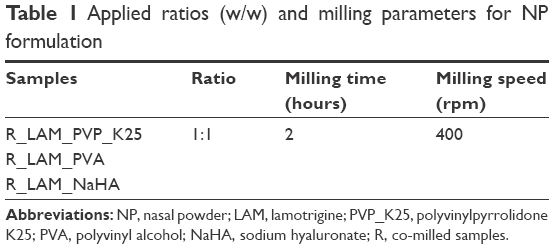 | Table 1 Applied ratios (w/w) and milling parameters for NP formulation |
After mixing, the PM samples – which were the first state of sample preparation and were used for comparison to the co-milled products – were placed into a planetary ball mill (Retsch PM 100; Retsch, Neuhausen, Germany), where they were milled for 2 hours at 400 rpm in a 50 mL capacity milling chamber. For milling, 10 steel balls (diameter 10 mm, weight of each ball 4.02 g) were used to get the co-milled samples (R).
Particle size analysis
Particle size was characterized by using Leica Image Processing and Analysis System device (Leica Q500MC; Leica Microsystems, Wetzlar, Germany). The test parameters of >300 particles were their length, width, area and district/convex perimeter.
Scanning electron microscopy (SEM)
The morphology of the powder microparticles was investigated by SEM (Hitachi S4700; Hitachi Ltd., Tokyo, Japan) at 10 kV. The samples were gold–palladium coated (90 seconds) with a sputter coater (Bio-Rad SC502; VG Microtech, Uckfield, UK) using an electric potential of 2.0 kV at 10 mA for 10 minutes. The air pressure was 1.3–13.0 mPa. Distributions of LAM particle diameter were obtained by analyzing SEM images with the ImageJ software environment using ~500 particles.
Raman spectroscopy
In this article, dispersive Raman spectrometer was used to confirm the relatively uniform distribution of API. Transmission Raman spectroscopy is used for the non-invasive and fast, qualitative investigation of pharmaceutical dosage forms and powder mixtures. In our method, the distribution of LAM was analyzed by Raman surface mapping. To investigate the distribution of API, Raman spectra were acquired with a Thermo Fisher DXR Dispersive Raman (Thermo Fisher Scientific, Waltham, MA, USA) equipped with a charge-coupled device (CCD) camera and a diode laser operating at a wavelength of 532 nm. Raman measurements were carried out with a laser power of 4 and 8 mW at a 25 μm slit aperture size on a 2 μm spot size. Spectra of the individual substances as PVA and LAM were collected using 6 second exposure time, a total of 48 scans in the spectral range of 1,700–200 cm-1 with cosmic ray and fluorescence corrections.
Differential scanning calorimetry (DSC)
The thermal response of each product was measured using a differential scanning calorimeter (Mettler Toledo TG 821e DSC; Mettler Inc., Schwerzenbach, Switzerland). About 3–5 mg of powder was precisely weighed into DSC sample pans, which were hermetically sealed and lid pierced. Each sample was measured in the temperature interval of 25°C–230°C at a heating rate of 5°C/min and at a rate of 5°C/min under constant argon flow of 150 mL/min. Data analysis was performed using the STARe software (Mettler Toledo; Mettler Inc., Schwerzenbach, Switzerland).
X-ray powder diffraction (XRPD)
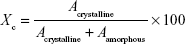
The XRPD measurement was carried out with a BRUKER D8 advance X-ray powder diffractometer (Bruker AXS GmbH, Karlsruhe, Germany) with Cu·K λI radiation (λ=1.5406 Å) and a VÅNTEC-1 detector (Bruker AXS GmbH, Karlsruhe, Germany). The powder samples were loaded in contact with a plane quartz glass sample slide with an etched square and measured. Samples were scanned at 40 kV and 40 mA. The angular range was 3°–40° 2θ, at a step time of 0.1 seconds and a step size of 0.007°. All manipulations, including Kα2 stripping, background removal and smoothing of the area under the peaks of the diffractograms, were performed using the DIFFRACplus EVA software. The crystallinity index (Xc) values were calculated based on the following formula, where A marks the area under the whole curve:
|
Solubility test
The thermodynamic solubility of LAM was determined in distilled water at 25°C (pH 5.5) and in phosphate buffer (pH 5.6) at 30°C presented the conditions of the nasal mucosa. In all, 10 mg of LAM or LAM-containing sample in 5 mL distilled water or phosphate buffer was stirred with a magnetic stirrer for 6 hours. After 2 hours, they were filtrated (0.22 mm, FilterBio PES Syringe Filter; Labex Ltd., Budapest, Hungary) and the content of the dissolved drug was measured spectrophotometrically at 362 and 267 nm in the case of water and pH 5.6 buffer, respectively (Unicam UV/Vis Spectrophotometer; Unicam, Cambridge, UK).
Surface free energy and polarity investigation
To determine the contact angle, surface free energy and polarity, 0.15 g of sample on 1 ton hydraulic press (PerkinElmer Hydraulic Press; PerkinElmer Inc., Waltham, MA, USA) was forcibly pressed to pastille. Then, the surface of the pastilles was dripped with polar and non-polar solvents. The contact angle was detected for 30 seconds with DataPhysics OCA 20 device (DataPhysics Inc. GmbH, Filderstadt, Germany), and then, Wu correlation was used. The solvents were distilled water (γp=50.2 mN/m, γd=22.6 mN/m) and diiodomethane (γp=1.8 mN/m, γd=49 mN/m).
Dissolution test
The modified paddle method (USP dissolution apparatus, type II; Pharma Test, Hainburg, Germany) was used to examine the rates of dissolution of poorly water-soluble LAM-containing samples and determine the drug release profile from the samples. The test was carried out under nasal conditions; thus, the medium was 100 mL phosphate buffer (PBS of pH 5.60 at 30°C), in which 120 mg of the samples were put. The paddle was rotated at 50 rpm, and the sampling was performed up to 60 minutes. After filtration, the drug contents of the aliquots were determined using spectrophotometry (Unicam UV/VIS Spectrophotometer) at 364 nm.
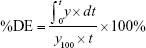
Statistical analysis of LAM dissolution profile
The percentage dissolution efficiency (%DE) for each sample was calculated as the percentage ratio of the area under the dissolution curve up to time t to that of the area of the rectangle described by 100% dissolution at the same time as follows:
|
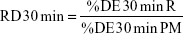
The relative dissolution (RD) time at 30 minutes (RD30 min) in the case of co-milled samples was calculated using the formula:
|
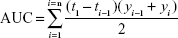
A well-known method is the trapezoidal method. The area under the curve (AUC) is the sum of all the trapezia defined by:
|
where ti is the time point and yi is the percentage of product dissolved at time ti. The mean dissolution time (MDT) was calculated via the following expression:
|
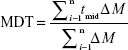
where i is the dissolution sample number, n is the number of dissolution times, tmid is the time at the midpoint between times ti and ti-1 and ΔM is the amount of LAM dissolved (mg) between times ti and ti-1.
Side-Bi-Side™ horizontal diffusion studies
The Side-Bi-Side™ (Crown Glass, USA) diffusion test was carried out in nasal conditions. The cellulose ester membrane with 0.45 μm pore diameter was soaked in isopropyl myristate, and the donor phase was tempered to 30°C at pH 5.6. The acceptor phase was pH 7.4, and the content of the diffused drug was measured spectrophotometrically at 362 nm (Unicam UV/Vis Spectrophotometer).
Results and discussion
Knowledge space development and RA
The first step was setting up an Ishikawa (fishbone) diagram including all the parameters influencing the desired NP product containing LAM as the active agent. The parameters were ranked into four groups (Figure 2), namely, 1) material characteristics; 2) production method; 3) product characteristics and 4) therapeutical expectations. This process gave a collection of preliminary knowledge and information, which helped to design the experiments and to select the appropriate CQAs and CPPs of the drug development procedure.
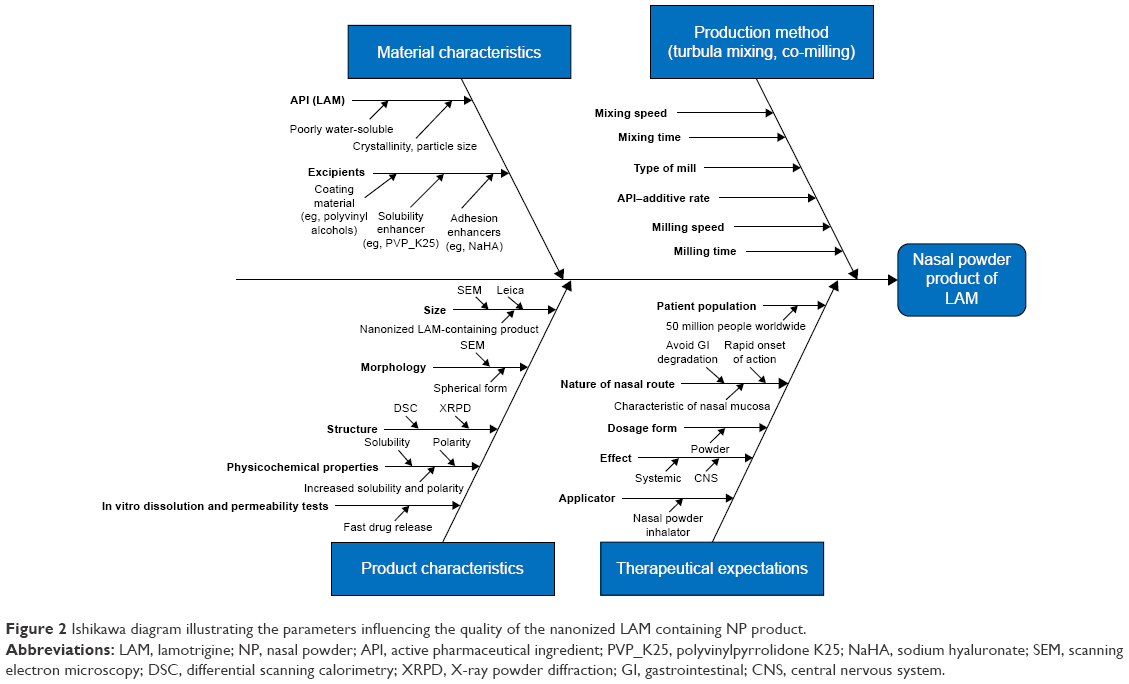 | Figure 2 Ishikawa diagram illustrating the parameters influencing the quality of the nanonized LAM containing NP product. |
First of all, the QTPPs that describe the desired NP-containing nanosized LAM were defined, and the CQAs and the CPPs were also identified. The results of interdependence rating made by the research group members and the selected target and critical parameters are presented in the tables of Figure 3. Below them, Pareto charts can be seen, as the result of the RA generated by the software. The Pareto charts show the relative effect of the CQAs and the CPPs on the QTPPs, namely, the numeric data of the critical factors and their ranking. In the diagrams, the same colors were used as in the tables; the factors that have the minimal effect on the final product quality were marked with green, the factors with the medium effect were marked with yellow and the factors with great impact were marked with red. As a result, it was found that theoretically among the CQAs, the particle size and its distribution can be predicted to have the greatest effect on the quality of the targeted and desired NP product. The analog diagram shows that among the CPPs, milling time and speed had to be expected to have the highest influence on the quality of the aimed product (Figure 3). According to the RA results, the studies of the practical development (screening studies and product preparation) were focused on the selected CQAs (particle size and distribution of LAM and dissolution, as investigated outputs) and CPPs (milling time, milling speed and the API:additive ratio).
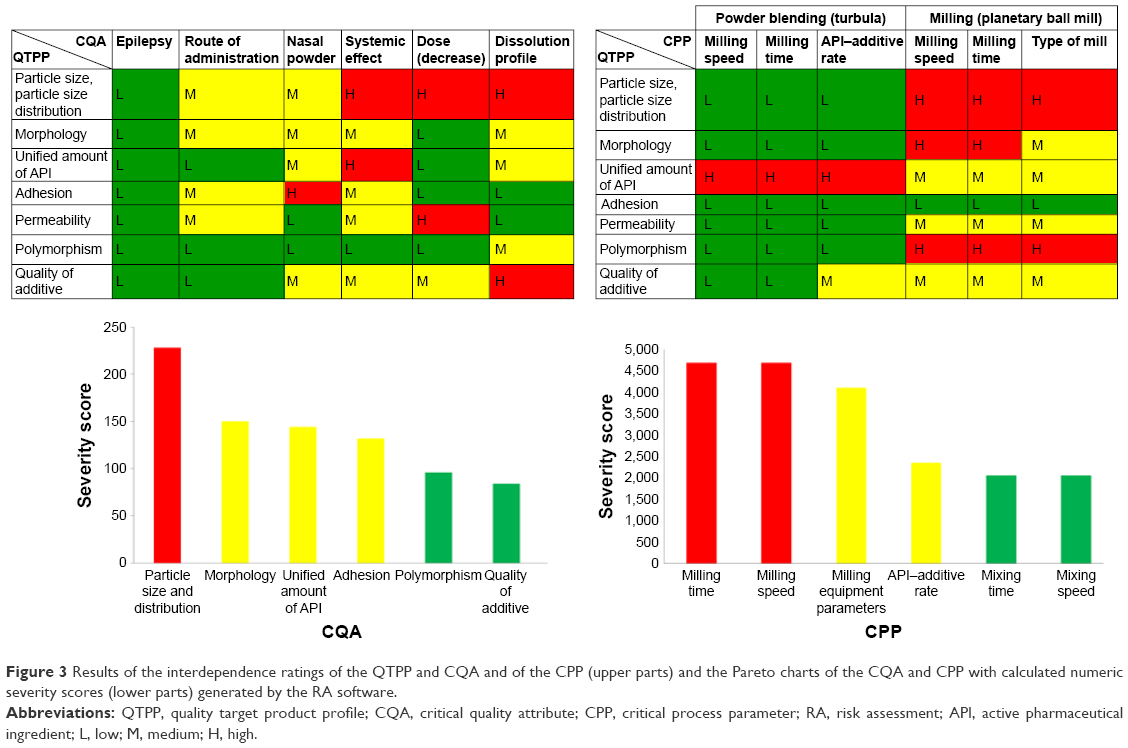 | Figure 3 Results of the interdependence ratings of the QTPP and CQA and of the CPP (upper parts) and the Pareto charts of the CQA and CPP with calculated numeric severity scores (lower parts) generated by the RA software. |
According to the results of the initial RA, the ratio of API and additives was found to be critical. In this meaning, in all additives, a ratio of 1:1 was selected for production; the milling time and milling speed were also constant (Table 1), and the LAM size in the product, distribution and dissolution as responses were investigated afterward.
Effect of milling on the properties of the raw materials
Preliminary experiments were carried out to collect information about the impact of grinding on raw materials (LAM and excipients), and they were required because adhesion, aggregation and amorphization may occur due to grinding.
Micrometric properties (particle size and morphology)
After 2 hours of milling, the particle size of LAM increased (from 8.28 to 14.26 μm) because of the aggregation of the particles caused by the adhesion forces. The particle size of NaHA (from 8.96 to 26 μm) also increased after milling; its sponge-like structure and surface became smooth. However, the PVA (from 124.97 to 49.96 μm) and PVP_K25 (from 21.26 to 13.06 μm) particles became smaller. This particle size reduction is associated with the cataract and cascade effects that occur during milling. The temperature rise during milling is not remarkable because the measured temperatures (25°C–37°C) do not reach the glass transition temperatures of the polymers. The morphology of initial LAM crystals was large, mainly columned, and they had a rough surface compared to the ground LAM, because those particles were nearly spherical and aggregated, which are factors responsible for the particle size increasing. The surface of the additives remained uneven after milling – except for PVP_K25 (because its surface in the beginning was nearly spherical) – but as their particle size decreased, due to the higher specific and uneven surface, they could offer an optimal polymer matrix, where the individual LAM particles can adhere.
Structural investigations (DSC and XRPD)
The initial materials were measured for DSC. The structure of LAM did not change significantly after 2 hours of milling because the melting point remained between 216°C and 217°C, and the crystallinity based on normalized integral (−136.62 Jg-1 in the case of raw LAM and −135.09 Jg-1 in the case of milled LAM) did not show any changes. Based on the thermoanalytical results, it can be said that most likely decomposition or any changes in the crystal structure did not happen due to grinding.
XRPD investigation was carried out to confirm the results of DSC measurements. The diffractogram of LAM shows many characteristic peaks detected at 12.57, 27.04, 27.19 and 28.92 2θ°. The intensity and location of these peaks did not change after milling, so the material maintained its crystallinity. The same can be said for the additives because the PVA retained its semi-crystalline nature after milling and PVA_K25 and NaHA also kept their amorphous property.
Investigation of NP formulations
Micrometric properties
Particle size analysis
The particle size of PM samples was much higher than that of the co-milled samples, and they were out of the desired range of NPs. Nevertheless, the particle size of the co-milled samples (Table 2) was 10–25 μm, which is in the desired range. The particles are small enough to reach the nasal mucosa but not too small to be inhaled into the lungs. The smallest particle size was measured for the powder containing PVP_K25 and the largest one for the sample that contained PVA, particle size of which hardly decreased. In the table, it is also seen that the particle size of LAM was between 120 and 230 nm; it is in the target range. Compared to PM samples, it can be observed that in all three cases, the polymers could prevent the adhesion of the LAM particles, while the particle size of the polymers and LAM decreased due to co-milling, mostly in the samples that contained NaHA.
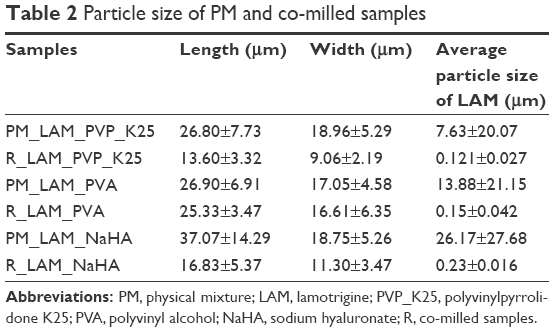 | Table 2 Particle size of PM and co-milled samples |
Particle size and morphology (SEM)
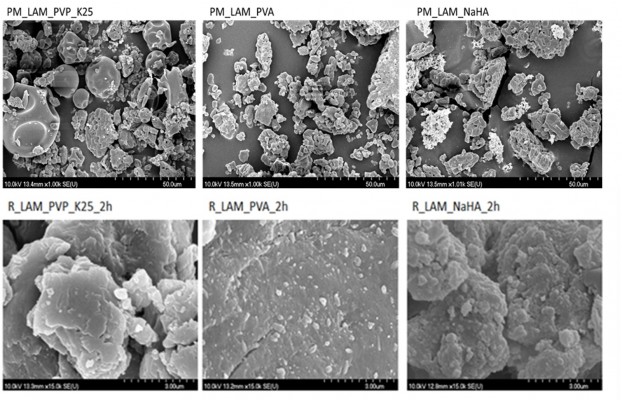
Figure 4 shows the SEM pictures of the samples. It can be seen that LAM particles aggregated in the case of PM samples, which explains the large particle size. On the other hand, LAM particles adhered to the surface of the polymers and their size was in the nanorange. In the case of the PVA-containing sample, uniformly dispersed, individual LAM particles can be observed as well. The increase in the temperature level due to grinding (30°C–36°C) was not even in this case high enough to reach the glass transition temperature of the polymers (PVP_K25: 130°C, PVA: −30°C, NaHA: 244°C); hence, as a result, no relevant change occurred. It can be concluded that the applied polymers offer great matrix to the LAM particles, where their individuality and stability, which have great influence on the dissolution, are ensured.
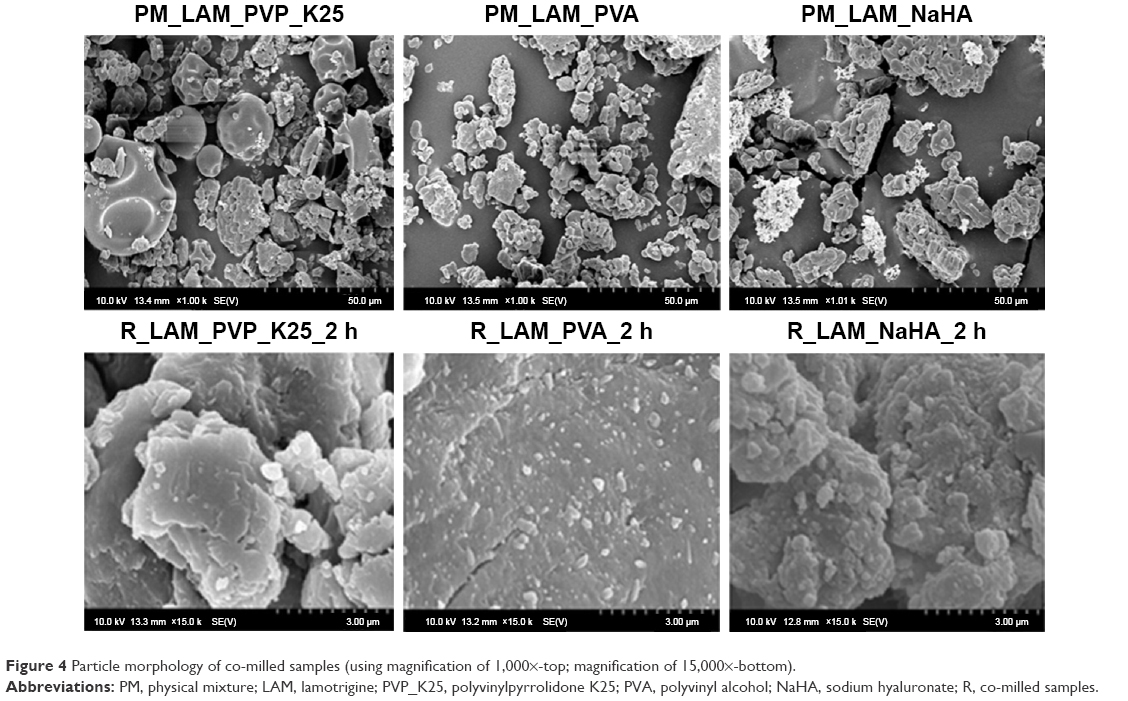 | Figure 4 Particle morphology of co-milled samples (using magnification of 1,000×-top; magnification of 15,000×-bottom). |
Raman spectroscopy
In the PM, the distribution of PVA particles is heterogeneous. Polymer particles can be seen as the red area in Figure 5A, and in the blue area their presence is <10%. In the ground sample, the presence of PVA is completely homogeneous (in the blue area, it is >90%; Figure 5C). It can be concluded that in the PM, the distribution of LAM is homogenous; it is presumable that LAM adhered to the PVA particles during physical mixing (Figure 5B). In the ground sample, the presence of API is almost homogeneous (relatively >50% and <80%; Figure 5D).
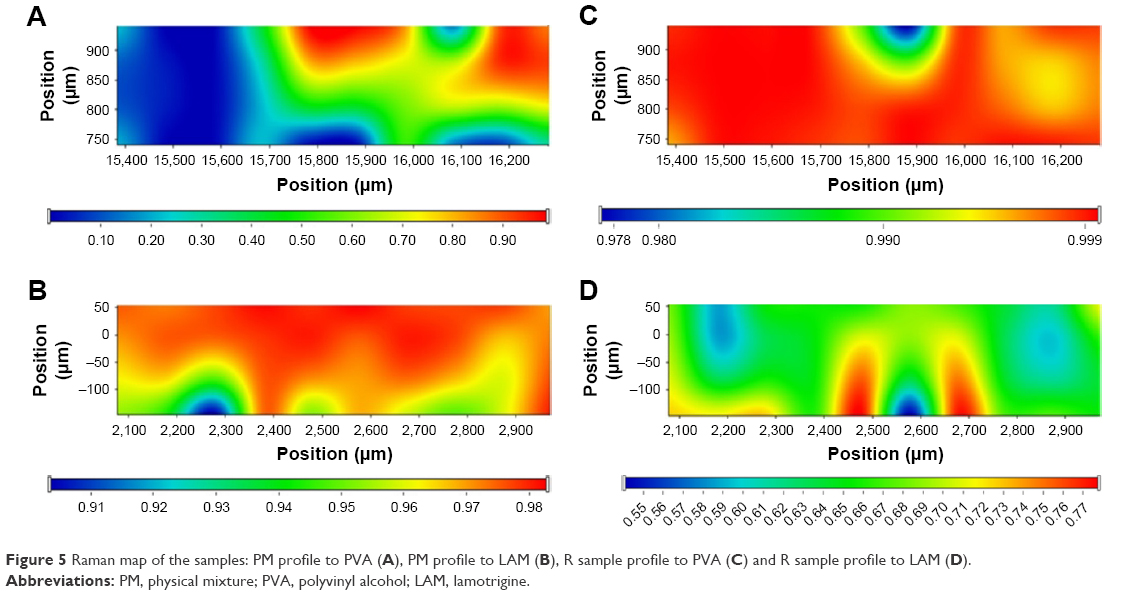 | Figure 5 Raman map of the samples: PM profile to PVA (A), PM profile to LAM (B), R sample profile to PVA (C) and R sample profile to LAM (D). |
Structural investigations
DSC
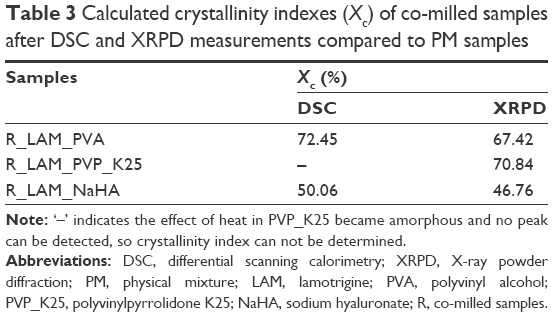
Figure 6 depicts the DSC curves of the PMs and the co-milled samples. On the curve of the sample containing LAM and PVP_K25, no endothermic peak can be detected because the particles merged into the polymer particles. This is what we experienced in our previous studies. In the case of the product containing NaHA, the melting point was not significantly different from the one in the case of the PM, but the sample that contained PVA showed a significant decrease in melting point. Based on the crystallinity index values (Table 3), it can be concluded that the crystallinity of LAM significantly decreased after adding PVA and NaHA.
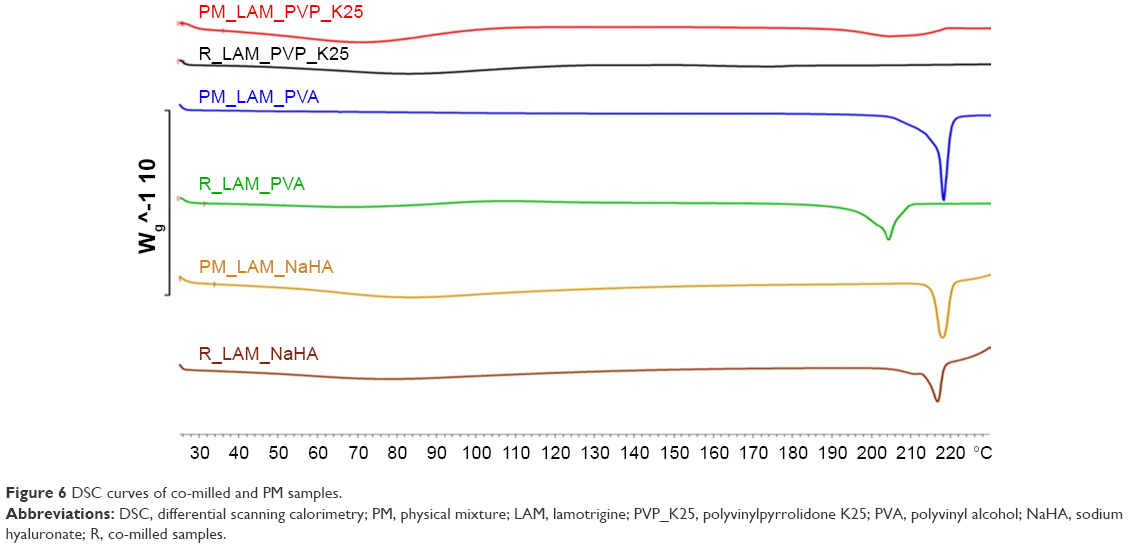 | Figure 6 DSC curves of co-milled and PM samples. |
 | Table 3 Calculated crystallinity indexes (Xc) of co-milled samples after DSC and XRPD measurements compared to PM samples |
XRPD
The intensity of the peaks decreased in each co-milled sample, which indicates a reduced degree of crystallinity. In the product containing PVP_K25, the nearly amorphous polymer covers the crystalline LAM; thus, the characteristic 2θ values are not visible on the chart compared to the PM. A similar process took place in the sample containing PVA because the PM shows characteristic peaks, but the intensity of these peaks decreases after milling. When the sample contained NaHA, the amorphous property of the polymer is more dominant; therefore, the characteristic peaks of the active substance are present; however, their intensity is not so high as in the case of the PM (Figure 7).
 | Figure 7 XRPD diffractograms of the products. |
The crystallinity index values were calculated after the investigation of the DSC curves and the XRPD diffractograms to reveal changes in the degree of crystallinity in the milled samples compared to the PMs (Table 3). It can be seen that the values are correlating, as similar results were obtained in both cases when the samples contained PVA or NaHA. In the case of the samples that contained PVP, the polymer coated the LAM crystals and at the same time protected them from amorphization. That is why no peak can be seen in the DSC curve, but the crystallinity index increased based on the XRPD diffractograms. The investigations were important to identify the crystallinity of the samples because a decrease in the degree of crystallinity usually leads to an increase in solubility.
Physicochemical analyses
Solubility test
The solubility test (Table 4) shows that the solubility values are higher in the case of co-milled samples compared to the PM samples and raw LAM, regardless of whether the solvent was distilled water or pH 5.4 buffer. The samples that contained NaHA showed the best solubility in both media and the lowest when the additive was PVA; however, the PVA containing samples showed the highest improvement in the case of water due to the additive and the effect of milling. Compared to the pH 5.4 buffer, the increase in solubility of water was much higher, the explanation of which is that the weakly basic API’s solubility is higher in the weakly acidic environment. The results can be explained by the particle size decrease and the maintained individuality of the particles because of the effect of additives. These solubility results could predict the higher dissolution rate of LAM from the co-milled samples.
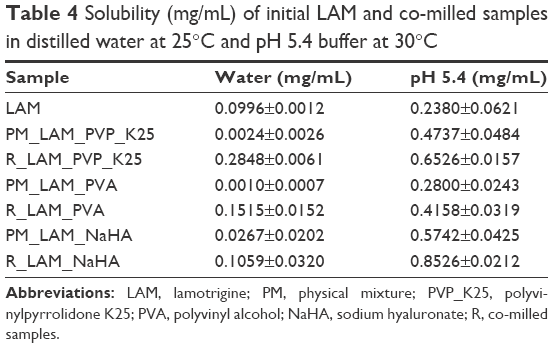 | Table 4 Solubility (mg/mL) of initial LAM and co-milled samples in distilled water at 25°C and pH 5.4 buffer at 30°C |
Surface free energy and polarity investigation
The hydrophilic and lipophilic properties of the samples were investigated with contact angle and polarization characterization, which have great importance in passing through membranes for drugs. After milling, hydrophilicity improved because the co-milled samples wetted with water better and less with diiodomethane than the PMs.
The sample containing NaHA showed the most increased hydrophilicity, while the PM sample that contained PVA was unmeasurable because the mixture absorbed the drop instantaneously. The polarity of the PVP_K25-containing sample did not change appreciably. The contact angles of the milled samples decreased while using water compared to the PMs, so the polarity and the wetting ability of the samples increased. This means that the more polar the sample, the more it wets with water, which can increase the absorption of the product. The results shown in Table 5 correlate with the results of the solubility test mentioned earlier, because higher polarity presumes higher solubility in water.
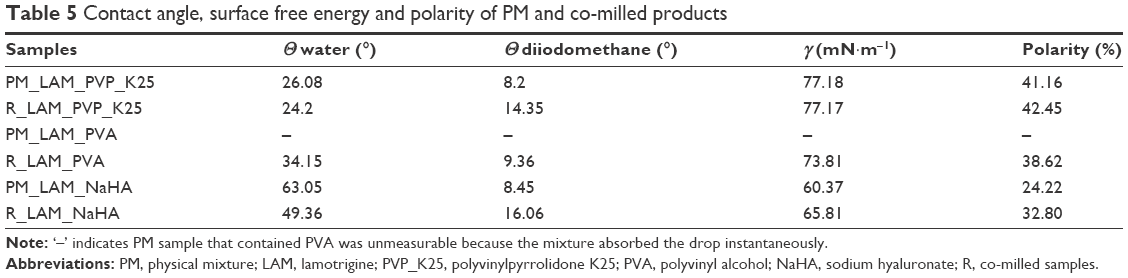 | Table 5 Contact angle, surface free energy and polarity of PM and co-milled products |
In vitro characteristics
Dissolution test
The in vitro dissolution test shows (Figure 8) that the dissolution of the co-milled samples is higher than that of the PMs because the dissolved amount of LAM increased in all cases. The dissolution rate increased the most where the sample contained PVA and LAM. In the co-milled sample, the percentage of dissolved LAM was 100% after 5 minutes. This means that the dissolution was the fastest for this sample, which can lead to a rapid onset of action. However, it can be said generally that dissolution rate improved due to the additives and the increased particle surface as a result of particle size reduction, because the samples containing NaHA and PVP_K25 also showed a significantly increased dissolution rate compared to PM samples.
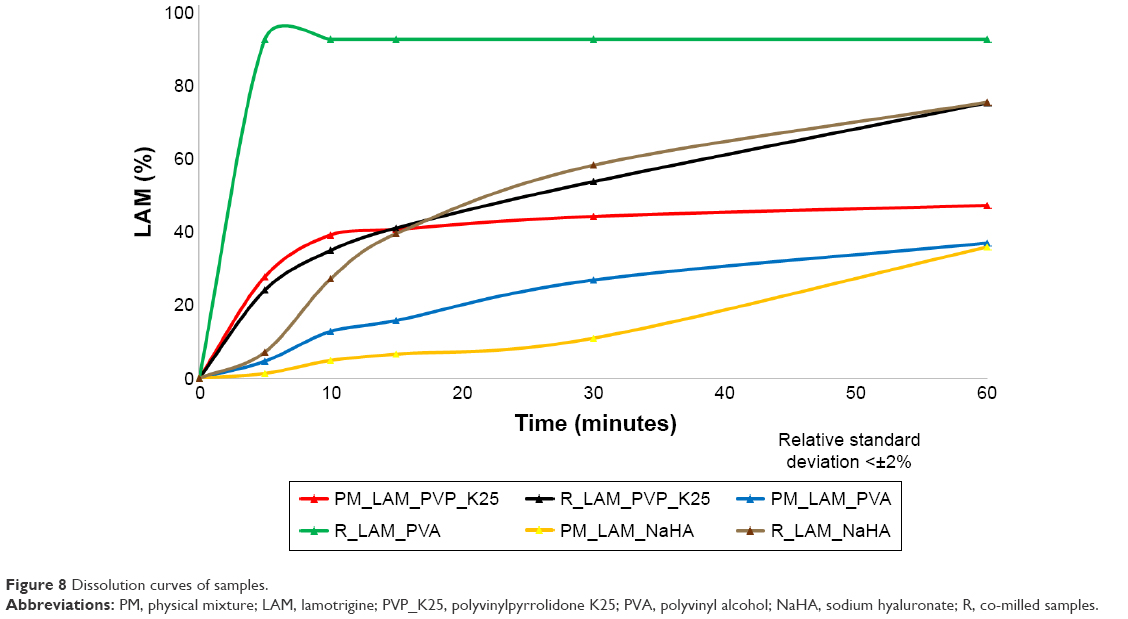 | Figure 8 Dissolution curves of samples. |
It can be seen in Table 6 that the dissolution efficiency at 30 minutes (DE30 min) was enhanced due to milling, and the same increase could be observed in the case of RD values. Similarly, the MDT values decreased, which means that the dissolution became faster due to the additives, particle size reduction and maintained individuality.
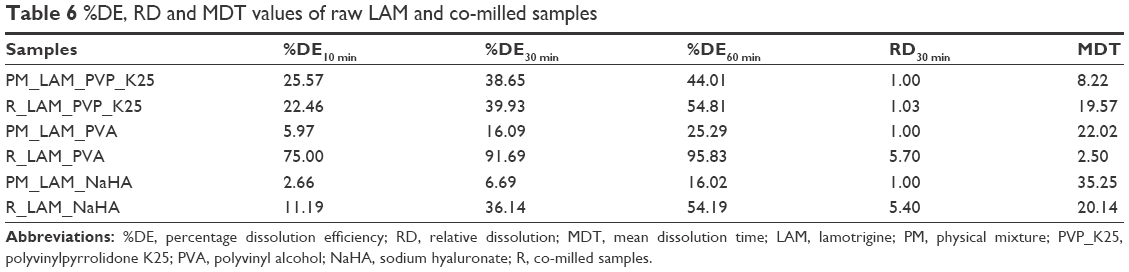 | Table 6 %DE, RD and MDT values of raw LAM and co-milled samples |
Side-Bi-Side™ horizontal diffusion studies
The horizontal diffusion test was carried out to investigate the in vitro permeability of the samples (Figure 9). It can be concluded that the concentration of LAM was much lower in the acceptor phase in PMs than in the co-milled samples. At the end of the test, there was no significant difference between the PVP_K25- and NaHA-containing samples, but the highest LAM concentration per square centimeter after 60 minutes was detected from the sample that contained PVA. It can be seen that the results correlate with the results of the dissolution test because the fastest dissolution and the highest amount of LAM release occurred from the PVA-containing sample.
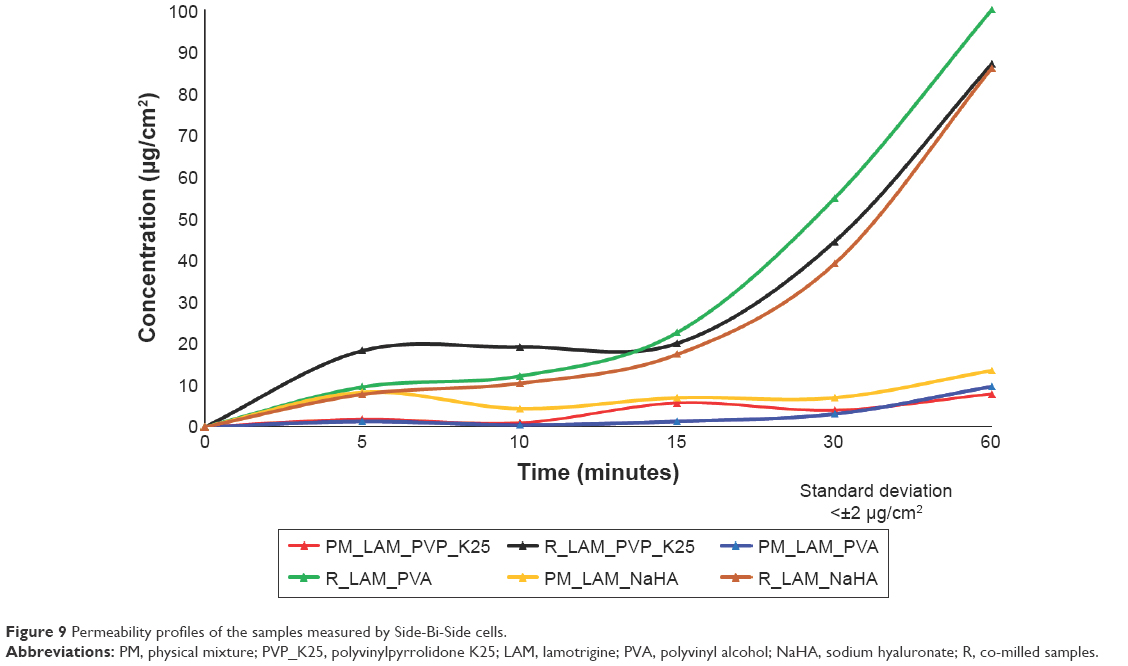 | Figure 9 Permeability profiles of the samples measured by Side-Bi-Side cells. |
Table 7 shows the calculated flux and permeability coefficient values. It can be seen that the values of PMs are lower than the values of the co-milled samples. The sample containing PVA had the best permeability, whereupon 100% of active substance passes through the membrane to the acceptor phase after 60 minutes. The reason of this high permeability can be explained by the function of PVA – which can preserve the uniqueness of the particles – and the liberation of nanoparticles. The liberation increases the diffusion pressure due to the increased concentration gradient. In the case of PVA-K25 and NaHA, there was no significant difference.
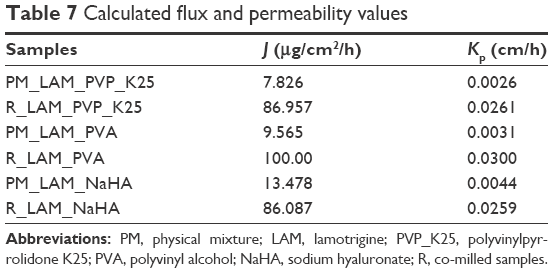 | Table 7 Calculated flux and permeability values |
Conclusion
In this study, nanonized antiepileptic drug-containing powders were prepared for investigation and nasal administration by the co-grinding technology. This method is important when interactive PMs do not comply with the requirements of NPs.
An initial RA was performed in order to identify the factors that affect the quality of the desired NP product. The results of the RA showed that among the CQAs, particle size has theoretically the highest effect on the final product and it is influenced the most by milling time, milling speed and LAM:additive ratio among the CPPs. According to the RA, knowledge from the literature and previous experimental findings, 2 hours milling at 400 rpm and 1:1 LAM:additive ratio were chosen as optimal parameters for the production process.
Co-milling was chosen as the production method to prepare the powder formulations because it is a simple, cheap, well-reproducible, environmental and economical method to decrease the particle size of active ingredients. The results showed that the changes due to milling, such as the decreased particle size attributed to growth surface and decreased crystallinity, caused better physicochemical properties and in vitro drug release in co-milled samples compared to the PM samples. By combining the advantages of nasal route and powder form, as well as by selecting the appropriate NP inhalator, the therapeutical expectations of different systemic and CNS diseases can be available in the future.
The particle size of LAM was the smallest in the sample that contained PVP_K25, and its solubility in water was the best; however, the PVA-containing powder had the most promising dissolution and permeability rate due to the outstanding uniformity of LAM particles on the surface of the polymer. This study confirmed that nanoparticles can be produced by using co-milling and applying additives, and these powders can be promising starting points to a late development, which may improve the efficiency of the therapy of epilepsy.
Acknowledgment
This project was supported by GINOP 2.3.2_15_2016_00060 project.
Disclosure
The authors report no conflicts of interest in this work.
References
Bartos C, Ambrus R, Sipos P, et al. Study of sodium hyaluronate-based intranasal formulations containing micro- or nanosized meloxicam particles. Int J Pharm. 2015;491(1–2):198–207. | ||
Gavini E, Hegge AB, Rassu G, et al. Nasal administration of carbamazepine using chitosan microspheres: in vitro/in vivo studies. Int J Pharm. 2006;307(1):9–15. | ||
Mistry A, Stolnik S, Illum L. Nanoparticles for direct nose-to-brain delivery of drugs. Int J Pharm. 2009;379(1):146–157. | ||
Liu JS, Wang JH, Zhou J, et al. Enhanced brain delivery of lamotrigine with Pluronic((R)) P123-based nanocarrier. Int J Nanomed. 2014;9:3923–3935. | ||
Kapoor M, Cloyd JC, Siegel RA. A review of intranasal formulations for the treatment of seizure emergencies. J Control Release. 2016;237:147–159. | ||
Warnken ZN, Smyth HDC, Watts AB, Weitman S, Kuhn JG, Williams RO. Formulation and device design to increase nose to brain drug delivery. J Drug Deliv Sci Tec. 2016;35:213–222. | ||
Horvath T, Ambrus R, Szabone RP. Nazális gyógyszerformák permeabilitási vizsgálata Side-Bi-Side™ horizontális cella alkalmazásával. [Investigation of permeability of intranasal formulations using Side-Bi-Side horizontal diffusion cell]. Acta Pharm Hun. 2015;85(1):19–28. | ||
Horvat S, Feher A, Wolburg H, et al. Sodium hyaluronate as a mucoadhesive component in nasal formulation enhances delivery of molecules to brain tissue. Eur J Pharm Biopharm. 2009;72(1):252–259. | ||
Kurti L, Gaspar R, Marki A, et al. In vitro and in vivo characterization of meloxicam nanoparticles designed for nasal administration. Eur J Pharm Sci. 2013;50(1):86–92. | ||
Tanaka A, Furubayashi T, Tomisaki M, et al. Nasal drug absorption from powder formulations: the effect of three types of hydroxypropyl cellulose (HPC). Eur J Pharm Sci. 2017;96:284–289. | ||
FDA Guidance for Industry. Nasal Spray and Inhalation Solution, Suspension, and Spray Drug Products – Chemistry, Manufacturing, and Controls Documentation. Available from: https://www.fda.gov/downloads/drugs/guidancecomplianceregulatoryinformation/guidances/ucm070575.pdf. Accessed July 18, 2017. | ||
EMEA. Guideline on the Pharmaceutical Quality of Inhalation and Nasal Products. Available from: http://www.ema.europa.eu/docs/en_GB/document_library/Scientific_guideline/2009/09/WC500003568.pdf. Accessed July 18, 2017. | ||
Pharmacopoeia E. Preparations for Inhalation (General Chapter) and 2.9.18 Preparations for Inhalation: Aerodynamic Assessment of Fine Particles. European Pharmacopoeia 5.1. 2799–2811. | ||
Pharmacopeia US. (USP) chapter 601 – Aerosols, Nasal Sprays, Metered Dose Inhalers, and Dry Powder Inhalers. Available from: http://www.pharmacopeia.cn/v29240/usp29nf24s0_c601_viewall.html. Accessed July 18, 2017. | ||
Atkins PJ. Dry powder inhalers: an overview. Resp Care. 2005;50(10):1304–1312. discussion 1312. | ||
Djupesland PG. Nasal drug delivery devices: characteristics and performance in a clinical perspective-a review. Drug Deliv Transl Res. 2013;3(1):42–62. | ||
FDA Guidance for Industry Metered Dose Inhaler (MDI) and Dry Powder Inhaler (DPI) Drug Products, Chemistry, Manufacturing, and Controls Documentation (CMC), Draft Guidance. Available from: https://www.fda.gov/downloads/drugs/guidances/ucm070573.pdf. Accessed July 18, 2017. | ||
Pozzoli M, Rogueda P, Zhu B, et al. Dry powder nasal drug delivery: challenges, opportunities and a study of the commercial Teijin Puvlizer Rhinocort device and formulation. Drug Dev Ind Pharm. 2016;42(10):1660–1668. | ||
Isaac J, Ganguly S, Ghosh A. Co-milling of telmisartan with poly(vinyl alcohol) – an alkalinizer free green approach to ensure its bioavailability. Eur J Pharm Biopharm. 2016;101:43–52. | ||
Knopp MM, Olesen NE, Holm P, Langguth P, Holm R, Rades T. Influence of polymer molecular weight on drug-polymer solubility: a comparison between experimentally determined solubility in PVP and prediction derived from solubility in monomer. J Pharm Sci. 2015;104(9):2905–2912. | ||
Ueda K, Higashi K, Yamamoto K, Moribe K. In situ molecular elucidation of drug supersaturation achieved by nano-sizing and amorphization of poorly water-soluble drug. Eur J Pharm Sci. 2015;77:79–89. | ||
Muller RH, Gohla S, Keck CM. State of the art of nanocrystals – special features, production, nanotoxicology aspects and intracellular delivery. Eur J Pharm Biopharm. 2011;78(1):1–9. | ||
Kurti L, Kukovecz A, Kozma G, Ambrus R, Deli MA, Szabo-Revesz P. Study of the parameters influencing the co-grinding process for the production of meloxicam nanoparticles. Powder Technol. 2011;212(1):210–217. | ||
Garg A, Singh S, Rao VU, Bindu K, Balasubramaniam J. Solid state interaction of raloxifene HCl with different hydrophilic carriers during co-grinding and its effect on dissolution rate. Drug Dev Ind Pharm. 2009;35(4):455–470. | ||
Loh ZH, Samanta AK, Heng PWS. Overview of milling techniques for improving the solubility of poorly water-soluble drugs. Asian J Pharm Sci. 2015;10(4):255–274. | ||
Yu LX. Pharmaceutical quality by design: product and process development, understanding, and control. Pharm Res. 2008;25(4):781–791. | ||
Karimi K, Pallagi E, Szabo-Revesz P, Csoka I, Ambrus R. Development of a microparticle-based dry powder inhalation formulation of ciprofloxacin hydrochloride applying the quality by design approach. Drug Des Devel Ther. 2016;10:3331–3343. | ||
Pallagi E, Ambrus R, Szabo-Revesz P, Csoka I. Adaptation of the quality by design concept in early pharmaceutical development of an intranasal nanosized formulation. Int J Pharm. 2015;491(1–2):384–392. | ||
Pallagi E, Csóka I. A Quality by Design (QbD) bemutatása és alkalmazási lehetőségeinek ismertetése a nano-rendszerű gyógyszertechnológiai fejlesztésekben. [Presentation of the quality by design concept and its application possibilities in the pharmaceutical technological development of nano-systems]. Gyógyszerészet. 2015;59:387–395. | ||
Mohana Raghava Srivalli K, Lakshmi PK, Balasubramaniam J. Design of a novel bilayered gastric mucoadhesive system for localized and unidirectional release of lamotrigine. Saudi Pharm J. 2013;21(1):45–52. |
 © 2017 The Author(s). This work is published and licensed by Dove Medical Press Limited. The full terms of this license are available at https://www.dovepress.com/terms.php and incorporate the Creative Commons Attribution - Non Commercial (unported, v3.0) License.
By accessing the work you hereby accept the Terms. Non-commercial uses of the work are permitted without any further permission from Dove Medical Press Limited, provided the work is properly attributed. For permission for commercial use of this work, please see paragraphs 4.2 and 5 of our Terms.
© 2017 The Author(s). This work is published and licensed by Dove Medical Press Limited. The full terms of this license are available at https://www.dovepress.com/terms.php and incorporate the Creative Commons Attribution - Non Commercial (unported, v3.0) License.
By accessing the work you hereby accept the Terms. Non-commercial uses of the work are permitted without any further permission from Dove Medical Press Limited, provided the work is properly attributed. For permission for commercial use of this work, please see paragraphs 4.2 and 5 of our Terms.