")
Back to Journals » Infection and Drug Resistance » Volume 15
Omics Biomarkers for Monitoring Tuberculosis Treatment: A Mini-Review of Recent Insights and Future Approaches
Authors Pitaloka DAE , Syamsunarno MRAA, Abdulah R , Chaidir L
Received 15 March 2022
Accepted for publication 20 May 2022
Published 28 May 2022 Volume 2022:15 Pages 2703—2711
DOI https://doi.org/10.2147/IDR.S366580
Checked for plagiarism Yes
Review by Single anonymous peer review
Peer reviewer comments 3
Editor who approved publication: Professor Suresh Antony
Dian Ayu Eka Pitaloka,1,2 Mas Rizky Anggun AA Syamsunarno,2,3 Rizky Abdulah,1,4 Lidya Chaidir2,3
1Department of Pharmacology and Clinical Pharmacy, Faculty of Pharmacy, Universitas Padjadjaran, Sumedang, West Java, 45363, Indonesia; 2Center for Translational Biomarker Research, Universitas Padjadjaran, Bandung, West Java, 40132, Indonesia; 3Department of Biomedical Sciences, Faculty of Medicine, Universitas Padjadjaran, Sumedang, West Java, 45363, Indonesia; 4Center of Excellence in Higher Education for Pharmaceutical Care Innovation, Universitas Padjadjaran, Sumedang, West Java, 45363, Indonesia
Correspondence: Lidya Chaidir, Department of Biomedical Sciences, Faculty of Medicine, Universitas Padjadjaran, Sumedang, West Java, 45363, Indonesia, Tel +62-22-84288812, Email [email protected]
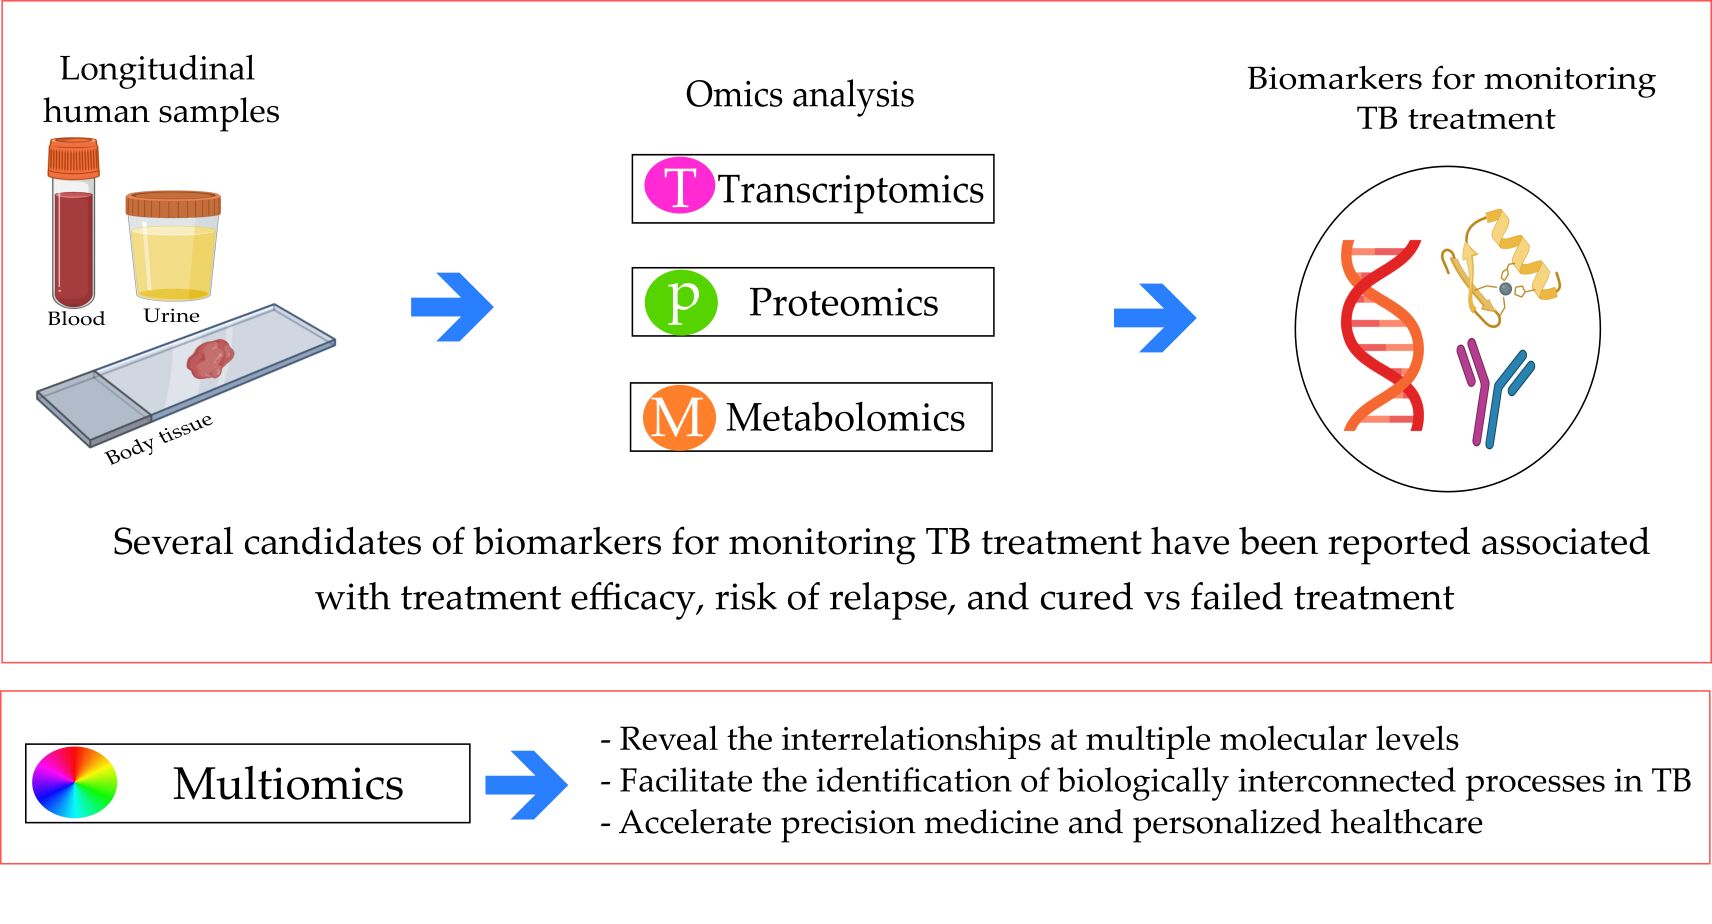
Abstract: Poor sensitivity of sputum conversion for monitoring tuberculosis (TB) treatment that makes identification of a non-sputum-based biomarker is urgently needed. Monitoring biomarkers in TB treatment is used to decide whether critical thresholds have been reached and helps clinicians to conclude the therapeutic success. In this mini review, we highlight recent studies on omics-related contributes to identifying of a novel biomarker as surrogate markers for the cure and predicting future reactivation risk following TB treatment. We catalogue the studies published to seek the progress made in transcriptomics, proteomics, and metabolomics in pulmonary TB. We also discuss how integrative multi-omics data will provide further understanding and effective TB treatment, such as revealing the interrelationships at multiple molecular levels, facilitating the identification of biologically interconnected processes, and accelerating precision medicine in TB treatment. However, proper validation in prospective longitudinal studies with long-term follow-up and outcome assessment must be conducted before the biomarkers are utilized in clinical practice.
Keywords: biomarker, omics, tuberculosis, monitoring treatment
Graphical Abstract:
Introduction
Tuberculosis (TB) continues to be one of the most important infectious diseases that lead to high mortality worldwide. Substantial investments and progress in expanding the directly observed therapy, short-course strategy, and improved treatment completion rates remain significant obstacles to global TB control.1,2 The emergence of multidrug-resistance TB (MDR-TB) and extensively drug-resistant (XDR-TB) strains requires extended period of treatment with the second-line anti-TB drugs, which are more toxic and costly. Unfavorable outcomes (eg, treatment failure or disease recurrence after chemotherapy discontinuation) may occur during and after curative therapy.3 Therefore, it is crucial to monitor treatment response and ensure its success.
Current guideline recommends conversion of sputum by culture or microscopy, in conjunction with radiological evaluation to monitor treatment response.3 However, sputum examinations for treatment monitoring have limitations. Sputum production declines rapidly during treatment which results in a poor predictive ability of the tests. High bacterial load at diagnosis as measured by a short time-to-positive in bacterial culture is associated with the risk of TB relapse.4,5 Hence, there is a call for the development of non-sputum-based assays that rely on biomarkers and the need is described as target product profiles (TPPs) that have been published by the World Health Organization.6
Biomarkers, defined as biological molecules found in the blood, other body fluids, or tissues, serve as quantifiable indicators to measure normal biological processes, the presence or progression of the disease (pathogenesis), or the effects of treatment.7 Recent advances in omics technologies have led to remarkable efforts characterizing the molecular changes that guide the development and progression of a wide array of complex human diseases. Analyses of multiple datasets from different omics techniques are crucial in elucidating the molecular dynamics underlying TB treatment.8 They may also provide a framework where the complexity of the interactive molecular networks leads to the individual variation of each component separately.
This review provides an overview of various biomarker findings using omics approaches for monitoring TB treatment and outcomes. We focus on the progress made in transcriptomics, proteomics, and metabolomics in pulmonary TB, and discuss how these data integrations will further identify biomarkers in therapeutic response. Diverse and heterogeneous forms of biomarkers are identified which require different types of clinical specimen and utilized diverse techniques and laboratory assays for identification.
Methods
The selection for recent omics biomarker articles for monitoring TB treatment was conducted in the PubMed, EMBASE and Web of Science from 2011 to 2021. For each database, the search term used as follows: “biomarker” AND “tuberculosis treatment” AND “omics” OR “genomic” OR “transcriptomic” OR “proteomic” OR “metabolomic”. Only studies of humans or that used human biological samples were eligible for inclusion. We focused on the evidence reported in in/ex vivo study, clinical trials, and randomized controlled trials (RCTs) on the omics approach for biomarker finding in monitoring TB treatment. Study reporting biomarkers for extrapulmonary TB was excluded. Before full-text screening, title and abstract were screened to determine appropriateness of all selected articles (Figure 1).
 |
Figure 1 Flow diagram of inclusion and exclusion of studies. Reasons for exclusion are: conference abstract; technique (imaging-based, ELISA, XPERT MTB/RIF, sputum conversion); reviews (narrative review, systematic review, meta-analysis); or target of paper (biomarkers for detection of LTBI, biomarkers for diagnosis of TB). Studies reporting biomarkers for extrapulmonary TB was excluded. |
Current Studies of Omics Biomarker in TB Treatment
A total of 250 records were identified through database search for studies published between 2011 and 2021. All the records were screened using titles and abstracts; 30 full text articles were assessed for eligibility and 14 studies were eventually included in the review (Figure 1). Table 1 summarizes the characteristic of 14 studies in the review, stratified by study design, including the omic approaches used in the study, biomarker candidates, reported association, study type, and sample size. Most of the studies (11/14) [78.6%] were published between 2016 and 2020. Eleven of the published studies were cohort studies, while the others used either a case control (n = 1) or in vitro/ex vivo (n = 2) study design. The 14 studies reported diverse and heterogeneous forms of biomarkers, which require different types of clinical specimen and utilized diverse techniques and laboratory assays for identifying biomarkers. The biomarkers include transcriptomic (n = 7), proteomic (n = 4), and metabolomic (n = 3).
 |
Table 1 Potential Monitoring Biomarkers for TB Treatment |
Transcriptomic Analysis
Many transcriptomic analyses have conducted studies on the role of different immune products as biomarkers during TB therapy (Table 1). These immune products are included in the innate immune process and interferon (IFN) signaling. A few are associated with disease severity and TB treatment response.
Cliff et al9 conducted an ex vivo transcriptomic study on peripheral blood samples obtained from pulmonary TB patients focused on changes after treatment initiation. They reported that downregulated expression of 1261 genes was observed within week 1 after TB treatment. C1q, C2, BF, and serpin G1 were the only genes strongly upregulated in most of the diagnosed patients and downregulated at week 1. Another report by Cliff et al10 focused on gene signature in TB relapse and found that the expression of 668-gene signature at diagnosis was significantly different in the samples from the relapse compared with the cured group with 356 genes more highly expressed in the cured group. Eight of the genes within the 18-gene significantly differentially expressed gene signature were more highly expressed in the cured group. These included Pragmin, a regulator of the Src family kinases, which facilitates immune cells by sequestering the negative regulator C-terminal Src kinase in the cytoplasm. The transcription factor RUNX2 was also downregulated in patients with relapse, potentially inhibiting PI3K/AKT cell signaling.
A study was designed for transcriptional analysis in whole-blood active TB to establish early changes in blood transcriptional response during standard anti-TB treatment after 2 weeks of therapy. An active and treatment-specific TB 664- and 320-transcript signatures, respectively, significantly diminished after 2 weeks of treatment and continued to decline until 6 months. The transcriptional signature is dominated by IFN signaling genes, including type I and II IFN.11 Another comprehensive whole-blood transcriptomic analysis of a well-characterized TB treatment cohort revealed that the UCP2 gene is highly downregulated in treatment failures compared with cures at pretreatment baseline. UCP is involved in fatty acid metabolism that promotes NLRP3 inflammasome activation during sepsis.12
IFN network domination in TB treatment was also performed by Ottenhoff et al13 in longitudinal samples. They identified IL15RA, UBE2L6, and GBP4 as molecular signatures involved in the IFN-α signaling. The IL15Ra expression on macrophages supports the early transition of antigen-specific effector CD8+ T cells to memory cells, which is critical in the early immune response against microbial infection. The second gene, UBE2L6, is a member of the ubiquitin family and targets abnormal or short-lived proteins for degradation. GBP4, which is commonly found in all study models, is exclusively regulated by IFN-α production through macrophages.
Sweeney et al14 used an integrated multicohort analysis of samples from publicly available datasets to derive a diagnostic gene set in the peripheral blood of patients with active TB. Three datasets (GSE19491, GSE37250, and GSE42834; N = 1023) were utilized to discover a set of three genes (GBP5, DUSP3, and KLF2), and the TB score was then calculated as (GBP5 + DUSP3/2 − KLF2) and directly tested and validated. Furthermore, they examined four datasets (Cliff combined dataset, GSE40553, GSE56153, and GSE62147) that profiled patients with active TB longitudinally during treatment. The TB score in each dataset exhibited a significantly decreasing trend as the treatment progressed. Furthermore, most patients exhibited individual trends of decreasing scores over time. However, this study was conducted on an actual lymph node tissue, not on peripheral blood.
Furthermore, Warsinske et al15 prospectively assessed the validity of the three-gene TB (GBP5, DUSP3, and KLF2) score that was previously reported by Sweeney et al14 in an independent cohort for association of these genes with active TB (ATB) severity and treatment response. In addition, they defined the patients with ATB in the catalysis treatment response cohort with a total glycolytic activity index (TGAI) score of ≤400 at 6 months as radiologically clear. Those with a TGAI score >400 at 6 months were defined as having radiologically persistent lung inflammation. The three-gene TB score at diagnosis was significantly lower in the radiologically clear patients than those with persistent lung inflammation after 6 months of treatment.15
The three-gene TB score at the end of treatment (EOT) continued to be higher in those with persistent lung inflammation than those who were radiologically clear at EOT. Patients with ATB with a three-gene TB score above the median had a significantly higher likelihood of prolonged lung pathology, as measured via positron emission tomography–computed tomography (PET-CT). Finally, the three-gene TB score during diagnosis was correlated with ongoing inflammation in the lungs of patients with ATB, as measured by PET-CT.15
Wang et al16 also reported a potential transcriptomic biomarker for TB treatment also screened in serum miRNA. They found that the miR-21-5p, miR-92a-3p, and miR-148b-3p expression levels were significantly reduced in cured TB patients than in untreated TB patients. A significantly increased miR-125a-5p level was observed between 2-month-treated and untreated TB patients. The researcher believed that these three miRNAs play a role in mycobacteria–host interactions and their declined level after anti-TB treatment, which may be due to the downregulation of innate host defense after anti-TB therapy. In addition, the higher miR-125a-5p level after the 2 months treatment of TB patients was probably caused by the continuous antibacterial status of the host in the present study.
Proteomic Analysis
The discovery of proteomic Mycobacterium tuberculosis (MTB) clearance markers that can be used for TB treatment monitoring is complex because of the difficulty of confirming MTB clearance from patient’s tissues. The result of the proteomic analysis indicated that differentially expressed proteins were mainly focused on metabolism, biological regulation, and immune system process. A diagnostic model consisting of apolipoprotein C-II, complement component C7 (CO7), and angiotensinogen (ANGT) was established to distinguish intensively treated TB patients from untreated TB patients. Furthermore, CO7 and ANGT were used to identify sputum-negative and sputum-positive TB patients after intensive treatment.17 Phosphoseryl-tRNA kinase (PSTK) was also found as a potential clearance marker during anti-TB treatment. PSTK was suppressed during the MTB infection stage and reexpressed after bacillary clearance.18
Some studies identified many proteins involved in innate and adaptive immunity and have predictive capabilities of the biomarker discoveries, as reported by Nahid et al and Choi et al. ECM1, YES, IGFBP1, CATZ, coagulation factor V, and serum amyloid study A are stable markers that are most highly associated with treatment response.19 The eotaxin concentration, a key mediator in eosinophil trafficking into inflamed tissue, was significantly higher in those with good treatment response, indicating a positive predictor for therapy response in pulmonary TB.20
Metabolomic Analysis
TB can affect multiple host metabolic pathways, and a study identified drug-induced host–metabolomic variations: (1) an overall reduction in the oxidative stress levels throughout the TB treatment; (2) a time-dependent induction and inhibition of several enzymes in response to the drugs (CYP2E1, CYP3A4, alcohol dehydrogenase, and amino carboxy muconate-semialdehyde decarboxylase) and altered oxidative stress levels (aconitase, formylglycine-generating enzyme, α-ketoglutarate dehydrogenase, and succinic semialdehyde dehydrogenase); (3) an upregulated urea cycle; and (4) altered insulin production.21
The main carbon and nitrogen sources are compensated by various amino acid metabolisms after MTB has consumed a large amount of glycogen in the body. Yi et al22 reported that four differential metabolites in combination (L-histidine, arachidonic acid, biliverdin, and L-cysteine–glutathione disulfide) could be used as potential biomarkers for cured TB.
Antibiotic treatment led to the normalization of healthy control levels for most TB-associated metabolites, including low citrulline, ornithine, histidine, and phenylalanine concentrations. However, the levels of methionine sulfoxide were not affected by anti-TB treatment.23 Multiple metabolomic and transcriptomic data analyses identified that antibiotic treatment involves immunoregulatory interaction between lymphoid and nonlymphoid cells by normalizing the N-acetylneuraminate concentration. Moreover, the concentration of pyridoxate was reduced after treatment completion and correlated with p53-regulated metabolic genes and mitochondrial translation response.24
In addition, Qian et al25 found that bradykinin (BK) and metabolite desArg9-bradykinin (DABK) can be used as potential biomarkers for anti-TB treatment. They reported that the serum BK levels declined from the pretreatment baseline levels and remained low after the completion of the therapy. Contrarily, the DABK levels increased during the induction phase and decreased at the post-therapy time point. The BK levels were consistent with the induction phase of sputum culture conversions, indicating reduced MTB burden reflecting good treatment responses. However, the elevated levels of BK and DABK after treatment completion may be related to the subsequent recurrent TB.
Multi-Omics: Future Approaches for Biomarker Discovery
The progress of all omics technologies has required tools for facilitating the analysis and interpretation of the generated multidimensional data. Many statistical methods have been developed for an independent analysis of large-scale, high-quality data from each omics level. Individual performances may still overlook the interactions between molecular entities and miss biologically relevant factors. Thus, integrated data analysis obtained by using various omics approaches (integromics) is vital in providing a deep understanding of the pathological processes in their biological context.26 Integromics is expected to provide new insights into biological systems and reveal the interrelationships between processes at multiple molecular levels. Integromics-based biomarker candidates would be biologically relevant regardless of whether the changes at each single omics level are large or small.27 The biomarker candidates for which the differences are enormous are likely to be used as TB biomarkers in clinical practice because their significant changes can establish a cutoff point and distinguish between conditions.28
Few integromics approaches are known in exploring biomarkers for TB treatment, but multivariate statistical analyses of other diseases have already been developed. Most of these methods include data normalization and dimension-reduction approaches (eg, principal component analysis). Principal component analysis (PCA) breaks down data into a few variables to facilitate the identification of those that best explain the phenotypic differences between patients with diseases. Other multivariate analysis methods have been developed to investigate the overall correlations between variables and identify the factors that best contribute to a specific biological condition. Other integromics frameworks include partial least squares regression29 or multiple factor analyses,30 which identify the primary sources of phenotypic variability between conditions. However, difficulties can arise in discerning between biologically relevant and irrelevant molecules in all cases due to the combination of multiple factors and high variability present in individual dataset-leading artifacts.30
TB is a multifactorial disease in which many biological processes are simultaneously disrupted. Modulating just one molecular factor is unlikely to have a sufficient effect on attenuating or reversing TB progression during treatment.31 Integromics is expected to facilitate the identification of biologically interconnected processes in TB that can be simultaneously modulated with combinational analysis or therapy (Figure 2). Furthermore, integromics may play a role in personalized treatment development. The alignment of clinical phenotypes with underlying, multilevel molecular networks could facilitate the comparisons of the biological signatures of clinical manifestations.32
 |
Figure 2 Schematic representation of a multi-omics approach to the discovery of monitoring biomarker for TB treatment. WGS, whole genome sequencing; NGS, next-generation sequencing, RNA-Seq, RNA sequencing; NMR, nuclear magnetic resonance. |
Molecular subtyping with multi-omics approaches is already employed in cancer treatment to identify subtypes and disease mechanisms and to make prognoses in order to identify and administer effective personalized treatments.25,33 Multi-omics integration with clinical data is also being investigated to accelerate precision medicine and personalized healthcare in autism spectrum disorders.34 Multi-omics analysis in TB was already conducted to see the downstream effect of MTB serine/threonine protein kinase, PknA and PknB, which was correlated with the MTB ability to adapt to its host environment.35 The integromics data analysis is also performed to reveal the MTB resistance mechanism due to p-aminosalicylic acid for MDR-TB and XDR-TB treatment.36
Conclusion and Future Perspective
It is reasonable to assume that essential and informative biomarkers will emerge from new large-scale omic approaches in studies of TB treatment to give better predictive value. To date, the use of omics technology in the discovery of biomarkers for monitoring TB treatment is currently limited to transcriptomics, metabolomics, and proteomics as recorded in clinical trials and RCTs. These omics biomarkers have been reported associated with treatment efficacy, risk of relapse, and cured vs failed TB treatment. We also identified how multi-omics data will provide further understanding and effective TB treatment, such as revealing the interrelationships at multiple molecular levels, facilitating the identification of biologically interconnected processes, and accelerating precision medicine in TB treatment. However, further research must be done to validate findings before integrating them into clinical practice. In the case of TB treatment, validation must take place within prospective longitudinal studies with long-term follow-up to assess the outcome. It is also critical to evaluate the biomarker in patient populations with various subgroups. Commonly TB in children and patients with HIV coinfection as well as diabetes if the novel biomarkers of TB want to be widely clinically applicable.
Limitations
We do not provide other omics approaches such as genomics, metagenomics, or lipidomics in monitoring TB treatment because of limited data found in literature review processes.
Ethics Statement
This review does not need ethical approval.
Acknowledgment
This study was supported by Internal Grant from Directorate of Research and Community Service Universitas Padjadjaran.
Disclosure
The authors report no conflicts of interest in relation to this work.
References
1. Padayatchi N, Daftary A, Naidu N, Naidoo K, Pai M. Tuberculosis: treatment failure, or failure to treat? Lessons from India and South Africa. BMJ Glob Health. 2019;4(1):e001097. doi:10.1136/bmjgh-2018-001097
2. Nezenega ZS, Perimal-Lewis L, Maeder AJ. Factors influencing patient adherence to tuberculosis treatment in Ethiopia: a literature review. Int J Environ Res Public Health. 2020;17(15):5626. doi:10.3390/ijerph17155626
3. World Health Organization. Tuberculosis (TB) | WHO; 2021. Available from: https://www.who.int/news-room/fact-sheets/detail/tuberculosis.
4. Magombedze G, Pasipanodya JG, Gumbo T. Bacterial load slopes represent biomarkers of tuberculosis therapy success, failure, and relapse. Commun Biol. 2021;4(1):664. doi:10.1038/s42003-021-02184-0
5. Rockwood N, du Bruyn E, Morris T, Wilkinson RJ. Assessment of treatment response in tuberculosis. Expert Rev Respir Med. 2016;10(6):643–654. doi:10.1586/17476348.2016.1166960
6. World Health Organization. High-priority target product profiles for new tuberculosis diagnostics | WHO; 2014. Available from: https://www.who.int/publications-detail-redirect/WHO-HTM-TB-2014.18.
7. Namuganga AR, Chegou NN, Mayanja-Kizza H. Past and present approaches to diagnosis of active pulmonary tuberculosis. Front Med. 2021;8:709793. doi:10.3389/fmed.2021.709793
8. Subramanian I, Verma S, Kumar S, Jere A, Anamika K. Multi-omics data integration, interpretation, and its application. Bioinform Biol Insights. 2020;14:1177932219899051. doi:10.1177/1177932219899051
9. Cliff JM, Lee JS, Constantinou N, et al. Distinct phases of blood gene expression pattern through tuberculosis treatment reflect modulation of the humoral immune response. J Infect Dis. 2012;207(1):18–29. doi:10.1093/infdis/jis499
10. Cliff JM, Cho J-E, Lee J-S, et al. Excessive cytolytic responses predict tuberculosis relapse after apparently successful treatment. J Infect Dis. 2016;213(3):485–495. doi:10.1093/infdis/jiv447
11. Bloom CI, Graham CM, Beery MPR, et al. Detectable changes in the blood transcriptome are present after two weeks of antituberculosis therapy. PLoS One. 2012;7(10):e46191. doi:10.1371/journal.pone.0046191
12. Thompson EG, Du Y, Malherbe ST, et al. Host blood RNA signatures predict the outcome of tuberculosis treatment. Tuberculosis. 2017;107:48–58. doi:10.1016/j.tube.2017.08.004
13. Ottenhoff THM, Dass RH, Yang N, Zhang MM, Wong HEE, Sahiratmadja E. Genome-wide expression profiling identifies type 1 interferon response pathways in active tuberculosis. PLoS One. 2012;7(9):e45839. doi:10.1371/journal.pone.0045839
14. Sweeney TE, Braviak L, Tato CM, Khatri P. Genome-wide expression for diagnosis of pulmonary tuberculosis: a multicohort analysis. Lancet Respir Med. 2016;4(3):213–224. doi:10.1016/S2213-2600(16)00048-5
15. Warsinske HC, Rao AM, Moreira FM, et al. Assessment of validity of a blood-based 3-gene signature score for progression and diagnosis of tuberculosis, disease severity, and treatment response. JAMA Netw Open. 2018;1(6):e183779. doi:10.1001/jamanetworkopen.2018.3779
16. Wang C, Yang S, Liu C-M, et al. Screening and identification of four serum miRNAs as novel potential biomarkers for cured pulmonary tuberculosis. Tuberculosis. 2018;108:26–34. doi:10.1016/j.tube.2017.08.010
17. Jiang -T-T, Shi L-Y, Chen J, et al. Screening and identification of potential protein biomarkers for evaluating the efficacy of intensive therapy in pulmonary tuberculosis. Biochem Biophys Res Commun. 2018;503(4):2263–2270. doi:10.1016/j.bbrc.2018.06.147
18. Kaewseekhao B, Roytrakul S, Yingchutrakul Y, Salao K, Reechaipichitkul W, Faksri K. Proteomic analysis of infected primary human leucocytes revealed PSTK as potential treatment-monitoring marker for active and latent tuberculosis. PLoS One. 2020;15(4):e0231834. doi:10.1371/journal.pone.0231834
19. Nahid P, Bliven-Sizemore E, Jarlsberg LG, et al. Aptamer-based proteomic signature of intensive phase treatment response in pulmonary tuberculosis. Tuberculosis. 2014;94(3):187–196. doi:10.1016/j.tube.2014.01.006
20. Choi R, Kim K, Kim M-J, et al. Serum inflammatory profiles in pulmonary tuberculosis and their association with treatment response. J Proteomics. 2016;149:23–30. doi:10.1016/j.jprot.2016.06.016
21. Combrink M, du Preez I, Ronacher K, Walzl G, Loots DT. Time-dependent changes in urinary metabolome before and after intensive phase tuberculosis therapy: a pharmacometabolomics study. OMICS. 2019;23(11):560–572. doi:10.1089/omi.2019.0140
22. Yi W-J, Han Y-S, Wei -L-L, et al. l-Histidine, arachidonic acid, biliverdin, and l-cysteine-glutathione disulfide as potential biomarkers for cured pulmonary tuberculosis. Biomed Pharmacother. 2019;116:108980. doi:10.1016/j.biopha.2019.108980
23. Vrieling F, Alisjahbana B, Sahiratmadja E, et al. Plasma metabolomics in tuberculosis patients with and without concurrent type 2 diabetes at diagnosis and during antibiotic treatment. Sci Rep. 2019;9(1):18669. doi:10.1038/s41598-019-54983-5
24. Dutta NK, Tornheim JA, Fukutani KF, et al. Integration of metabolomics and transcriptomics reveals novel biomarkers in the blood for tuberculosis diagnosis in children. Sci Rep. 2020;10(1):19527. doi:10.1038/s41598-020-75513-8
25. Qian X, Nguyen DTM, Li Y, Lyu J, Graviss E, Hu TY. Predictive value of serum bradykinin and desArg9-bradykinin levels for chemotherapeutic responses in active tuberculosis patients: a retrospective case series. Tuberc Tuberculosis. 2016;101S:S109-S118. doi:10.1016/j.tube.2016.09.022
26. Wu C, Zhou F, Ren J, et al. A selective review of multi-level omics data integration using variable selection. High Throughput. 2019;8(1):4. doi:10.3390/ht8010004
27. Montaner J, Ramiro L, Simats A, et al. Multilevel omics for the discovery of biomarkers and therapeutic targets for stroke. Nat Rev Neurol. 2020;16(5):247–264. doi:10.1038/s41582-020-0350-6
28. Misra BB, Langefeld C, Olivier M, Cox LA. Integrated omics: tools, advances and future approaches. J Mol Endocrinol. 2018. doi:10.1530/JME-18-0055
29. Land WH, Ford W, Park J-W, et al. Partial Least Squares (PLS) applied to medical bioinformatics. Procedia Comput Sci. 2011;6:273–278. doi:10.1016/j.procs.2011.08.051
30. de Tayrac M, Lê S, Aubry M, Mosser J, Husson F. Simultaneous analysis of distinct Omics data sets with integration of biological knowledge: multiple factor analysis approach. BMC Genomics. 2009;10(1):32. doi:10.1186/1471-2164-10-32
31. Klassert TE, Goyal S, Stock M, et al. AmpliSeq screening of genes encoding the C-type lectin receptors and their signaling components reveals a common variant in MASP1 associated with pulmonary tuberculosis in an Indian population. Front Immunol. 2018;9:242. doi:10.3389/fimmu.2018.00242
32. Özdemir V, Dove ES, Gürsoy UK; Özdemir V, Dov ES, Gursoy UK, Sardas S, Yildirim A, Yilmaz SG, et al. Personalized medicine beyond genomics: alternative futures in big data-proteomics, environtome and the social proteome. J. Neural Transm. Vienna Austria. 2017;124(1):25–32. doi:10.1007/s00702-015-1489-y
33. West L, Vidwans SJ, Nicholas PC, et al. A novel classification of lung cancer into molecular subtypes. PLoS One. 2012;7(2):e31906. doi:10.1371/journal.pone.0031906
34. Higdon R, Earl RK, Stanberry L, et al. The promise of multi-omics and clinical data integration to identify and target personalized healthcare approaches in autism spectrum disorders. Omics J Integr Biol. 2014;19(4):197–208. doi:10.1089/omi.2015.0020
35. Young AT, Carette X, Helmel M, et al. Multi-omic regulatory networks capture downstream effects of kinase inhibition in Mycobacterium tuberculosis. NPJ Syst Biol Appl. 2021;7(1):8. doi:10.1038/s41540-020-00164-4
36. Wei W, Yan H, Zhao J, et al. Multi-omics comparisons of p-aminosalicylic acid (PAS) resistance in folC mutated and un-mutated Mycobacterium tuberculosis strains. Emerg Microbes Infect. 2019;8(1):248–261. doi:10.1080/22221751.2019.1568179
 © 2022 The Author(s). This work is published and licensed by Dove Medical Press Limited. The full terms of this license are available at https://www.dovepress.com/terms.php and incorporate the Creative Commons Attribution - Non Commercial (unported, v3.0) License.
By accessing the work you hereby accept the Terms. Non-commercial uses of the work are permitted without any further permission from Dove Medical Press Limited, provided the work is properly attributed. For permission for commercial use of this work, please see paragraphs 4.2 and 5 of our Terms.
© 2022 The Author(s). This work is published and licensed by Dove Medical Press Limited. The full terms of this license are available at https://www.dovepress.com/terms.php and incorporate the Creative Commons Attribution - Non Commercial (unported, v3.0) License.
By accessing the work you hereby accept the Terms. Non-commercial uses of the work are permitted without any further permission from Dove Medical Press Limited, provided the work is properly attributed. For permission for commercial use of this work, please see paragraphs 4.2 and 5 of our Terms.