")
Back to Journals » Breast Cancer: Targets and Therapy » Volume 15
Nomogram Based on Super-Resolution Ultrasound Images Outperforms in Predicting Benign and Malignant Breast Lesions
Received 15 September 2023
Accepted for publication 24 November 2023
Published 2 December 2023 Volume 2023:15 Pages 867—878
DOI https://doi.org/10.2147/BCTT.S435510
Checked for plagiarism Yes
Review by Single anonymous peer review
Peer reviewer comments 2
Editor who approved publication: Professor Pranela Rameshwar
Liu Yang, Zhe Ma
Department of Medical Ultrasound, The First Affiliated Hospital of Shandong First Medical University & Shandong Provincial Qianfoshan Hospital, Jinan City, Shandong Province, People’s Republic of China
Correspondence: Zhe Ma, Department of Medical Ultrasound, The First Affiliated Hospital of Shandong First Medical University & Shandong Provincial Qianfoshan Hospital, No. 16766, Jingshi Road, Jinan City, Shandong Province, 250014, People’s Republic of China, Tel +86-13969033555, Email [email protected]
Objective: To establish a good predictive model using a deep-learning (DL)-based three-dimensional (3D) super-resolution ultrasound images for the diagnosis of benign and malignant breast lesions.
Methods: This retrospective study included 333 patients with histopathologically confirmed breast lesions, randomly split into training (N=266) and testing (N=67) datasets. Eight models, including four deep learning models (ORResNet101, ORMobileNet_v2, SRResNet101, SRMobileNet_v2) and four machine learning models (OR_LR, OR_SVM, SR_LR, SR_SVM), were developed based on original and super-resolution images. The best performing model was SRMobileNet_v2, which was used to construct a nomogram integrating clinical factors. The performance of nomogram was evaluated using receiver operating characteristic (ROC) analysis, decision curve analysis (DCA), and calibration curves.
Results: SRMobileNet_v2, MobileNet_V2 based on super-resolution ultrasound images, had the best predictive performance in four traditional machine learning models and four deep learning models, with AUC improvements of 0.089 and 0.031 in the training and testing sets, relative to the ORMobileNet_v2 model based on original ultrasound images. The deep-learning nomogram was constructed using the SRMobileNet_v2 model score, tumor size, and patient age, resulting in superior predictive efficacy compared to the nomogram without the SRMobileNet_v2 model score. Furthermore, it demonstrated favorable calibration, discrimination, and clinical utility in both cohorts.
Conclusion: The diagnostic prediction model utilizing super-resolution reconstructed ultrasound images outperforms the model based on original images in distinguishing between benign and malignant breast lesions. The nomogram based on super-resolution ultrasound images has the potential to serve as a reliable auxiliary diagnostic tool for clinicians, exhibiting superior predictive performance in distinguishing between benign and malignant breast lesions.
Keywords: deep learning, radiomics, machine learning, breast lesion, super-resolution
Introduction
Ultrasound (US) has become an important tool in assessing breast lesions, with various indications for female patients. It can be used to detect palpable lumps, serve as the first diagnostic option for patients under 40 years old, and evaluate suspicious findings from mammography or magnetic resonance imaging.1 Breast cancer, the most prevalent malignant disease among women, carries a high mortality rate. In 2010 alone, there were over 1.6 million cases reported worldwide with an estimated projection of 2.1 million by the year 2030.1–4 Therefore, timely detection of breast masses is crucial for patients.
During ultrasonic imaging diagnosis, doctors rely on assessing microcalcifications, orientation, margin, shape, and echogenicity to identify malignancy prediction in clinical practice. However, despite its high sensitivity,5 this method exhibits poor specificity in characterization.6 Ultrasonic images are commonly affected by several factors, including speckle noise, low contrast, attenuation, shadow, and signal loss. Image resolution refers to the number of pixels in an image, which directly reflects the information contained within. The higher the resolution, the more vivid and detailed the appearance becomes, allowing for a greater amount of information to be extracted from it.7
While good-quality ultrasound images can enhance diagnostic accuracy, subjective evaluations have limitations.8–10 To overcome these limitations, objective evaluation using computer-based image processing is necessary.11–13 Radiomics has been shown in previous studies to have the potential to enhance patient management and clinical decision-making by revealing disease characteristics that may not be discernible to the human eye.14,15 Additionally, the limited spatial resolution of ultrasonic images is frequently encountered due to a range of factors, including constraints imposed by hardware capabilities and the duration required for image acquisition. This constraint can pose challenges in achieving precise diagnosis and formulating effective treatment strategies.
Recently, significant advancements have been made in super-resolution reconstruction techniques, which offer great potential for improving the spatial resolution of medical images without requiring hardware upgrades. Super-resolution reconstruction techniques can be broadly classified into two categories: interpolation-based and learning-based. Interpolation-based techniques use mathematical models to estimate high-resolution images from low-resolution ones, but often yield blurry images with limited improvement in spatial resolution. On the other hand, learning-based techniques employ deep learning models to learn the mapping between low-resolution and high-resolution images. The application of deep learning algorithms in super-resolution reconstruction has led to promising outcomes. These techniques have the ability to significantly improve the level of detail and clarity in medical images, resulting in enhanced spatial resolution.
Therefore, in this retrospective study, we employed a 3D super-resolution reconstruction technique for ultrasound images that employs a generative adversarial network (GAN) as its fundamental architecture.
We attempted to establish various models utilizing diverse machine learning and deep learning algorithms based on the original ultrasound images and super-resolution images, respectively. Ultimately, we developed an effective tool for determining benign and malignant nodules based on the optimal model.
Materials and Methods
Patients
The retrospective study was conducted in accordance with the declaration of Helsinki and received approval from the Institutional Review Boards at The First Affiliated Hospital of Shandong First Medical University & Shandong Provincial Qianfoshan Hospital (YXLL-KY-2023(045)).
A total of 550 patients with 550 breast lesions underwent breast ultrasound examinations at our hospital from January 2020 to July 2022, and ultimately, after screening and selection criteria were applied, a cohort of 333 patients was included for analysis. The inclusion criteria were as follows: (1) Breast US examinations within 2 weeks before surgery or biopsy. (2) All breast lesions with definite pathological diagnosis (3) and no preoperative treatment. (4) Female patients diagnosed with breast lesions. The exclusion criteria were as follows: (1) Patients with biopsy, neoadjuvant chemotherapy, ablation, or radiotherapy before US examination. (2) Incomplete clinical or pathological information. (3) Insufficient image quality for feature extraction. (4) Male patients diagnosed with breast lesions. Study patients recruitment flowchart is shown in Figure 1.
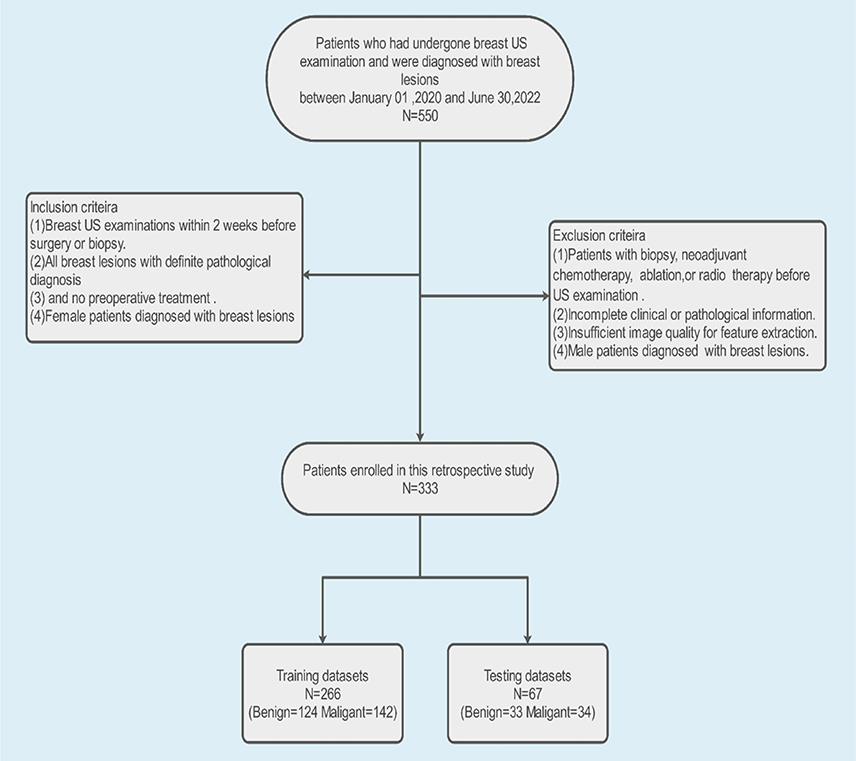 |
Figure 1 Flowchart illustrating the process of study patients. |
Ultrasound Image Acquisition and Processing
Breast ultrasounds were conducted at our hospital using GE machines with identical settings. The patient was positioned supine and instructed to breathe gently, while the instrument sequentially scanned the median, lateral, and medial positions of each breast along with other planes as needed. The maximum diameter of any detected masses was recorded, and then the original images of breast masses were obtained. In this study, we utilized a generative adversarial network (GAN) as the fundamental architecture for our 3D super-resolution reconstruction technique of US images. The objective is to enhance spatial resolution by a factor of two while preserving the original image dimensions. First, Gaussian noise was introduced to the US images in order to downsample the out-plane resolution by a factor of 2, resulting in the generation of novel low-resolution images. Subsequently, these low-resolution images were paired with synthetic high-resolution counterparts and utilized for training a lightweight GAN model. Finally, transfer learning was applied to original images using the trained model. As a result of improved z-resolution, the sagittal GAN-super-resolution images exhibited visual similarity to the original images while displaying reduced blurriness and enhanced texture details as well as sharper edges.
Construction of Machine Learning Model
The overall process of this study is summarized in Figure 2. The training set consisted of 266 patients resulting in a total of 266 images and the testing sets consisted of 67 images, respectively, from the slice that showed the maximum diameter of the tumor. The regions of interest (ROIs) for tumor segmentation were manually delineated on all US images by a radiologist with 5 years of experience using ITK-SNAP version 3.8.0 and subsequently reviewed by another radiologist with 10 years of experience to ensure accuracy. Any discrepancies identified by the two raters were resolved through a process of discussion and consensus-building. A total of 107 handcrafted radiomics features were extracted for each tumor from both the original image and its super-resolution counterpart using PyRadiomics version 3.0.1, respectively. The radiomics features consist of 18 first-order statistics features, 24 gray-level co-occurrence matrix (GLCM) features, 14 gray-level dependence matrix (GLDM) features, 16 gray-level run-length matrix (GLRLM) features, 16 gray-level size-zone matrix (GLSZM) features, 5 neighbouring gray-tone difference matrix (NGTDM) features, and 14 shape features. The radiomic features are described in detail in Table S1, while a comprehensive explanation of all image features can be found on the online platform (http://pyradiomics.readthedocs.io/en/latest/features.html).
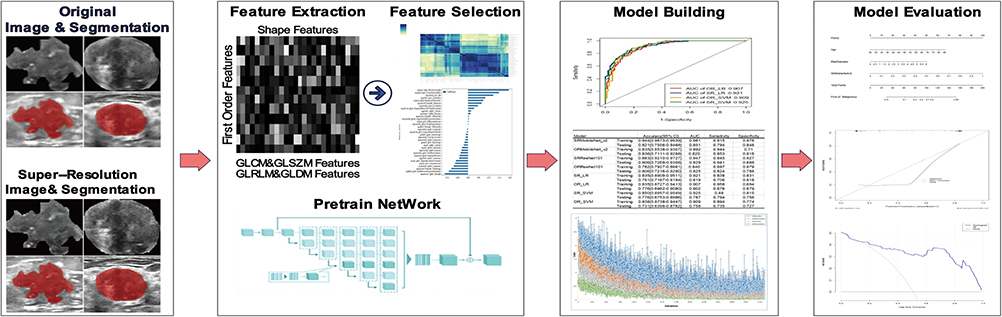 |
Figure 2 The overall procedure of this investigation. |
We conducted Mann–Whitney U-test and feature screening on all features, selecting only those with a p-value < 0.05. Subsequently, we standardized all feature lines using the z-score method. In cases where Pearson correlation coefficient > 0.9 existed between two features, one of them was chosen for retention. We used selected radiomics features to develop four models with Logistic Regression (LR) and Support Vector Machine (SVM) algorithms, including two based on original image features and two based on super-resolution image features. The patients were stratified randomly sampled and divided into a training set and a testing set at an 8:2 ratio. The model’s predictive performance was evaluated using sensitivity, specificity, accuracy, negative predictive value (NPV), positive predictive value (PPV), and the area under the receiver operating characteristic curve (AUC).
Development and Interpretability of Deep Learning Models
The dataset was divided into a training set and a testing set using the same splitting strategy as that used for constructing the machine learning model. The transfer learning models utilized in this study comprised ResNet 101 and MobileNet V2, the latter of which is a lightweight convolutional neural network (CNN). The initial weight values were obtained by pretraining all models on the ImageNet dataset. The entire process consisted of two essential steps: the forward computation and the backward propagation. To prepare for training, we extracted rectangular regions of interest (ROIs) from US images using tumor segmentation masks. Subsequently, the deep learning model predicted the malignant probability of the breast lesion image through sequential activation of convolution and pooling layers.
Furthermore, real-time data augmentation was implemented through random horizontal flipping and cropping. The model parameters were updated using the stochastic gradient descent (SGD) optimizer with an initial learning rate of 0.005, which decayed according to the cosine annealing algorithm over a total of 200 epochs consisting of 3400 iteration steps and a batch size of 16. Finally, four deep-learning models were developed: ORResNet101, ORMobileNet_v2, SRResNet101, and SRMobileNet_v2.
Gradient-weighted class activation mapping (Grad-CAM) was applied to visualize the models to make the decision-making process more transparent and investigating its interpretability. The gradient information of the last convolutional layer of CNNs is used for weighted fusion to obtain a class activation map that highlights important regions of the classification target image.16
Construction of Nomogram
In order to identify the optimal base model for diagnosing benign and malignant breast lesions, we compared the performance of ORResNet101, ORMobileNet_v2, SRResNet101, SRMobileNet_v2, OR_LR, OR_SVM, SR_LR, and SR_SVM models. Upon selecting SRMobileNet_v2 as the most effective basic model, clinical information was subsequently incorporated into the diagnostic model. The result of SRMobileNet_v2 was used deep-learning score for each breast lesion. To construct nomogram, we first evaluated the preoperative clinical characteristics through univariate logistic analysis to identify predictors associated with distinguishing between benign and malignant breast lesions. We then conducted multivariate logistic regression analysis on all statistically significant variables from the univariate analysis. Univariate and multivariate regression analyses of clinical characteristics was shown in Table S2. The findings indicate that both the age of patients and the maximum diameter of tumors are statistically significant variables (all P< 0.05). Finally, we developed a clinical nomogram based on statistically significant clinical variables and subsequently constructed a deep-learning nomogram by integrating the deep-learning score with these variables.
Statistical Analysis
The clinical characteristics of benign and malignant breast lesions were compared using t-tests or Chi-square tests. Machine learning models and deep learning models were evaluated using AUC scores, as well as other metrics such as accuracy, sensitivity, specificity, PPV, and NPV. The deep-learning nomogram was evaluated using ROC curve for discrimination, calibration curve with 1000 resamples for calibration, and Hosmer–Lemeshow (HL) test for goodness-of-fit. The clinical usefulness of the model was assessed through DCA by calculating net benefits. All statistical analyses were conducted using R version 4.2.0 and Python 3.0.1, with all statistics being two-sided and a P-value less than 0.05 deemed to be of significant statistical importance.
Results
Baseline Characters
The clinical characteristics are listed in Table 1, indicating significant differences in age and menopause status between benign and malignant breast lesions in both the training and testing sets. Categorical variables are represented by numbers (n), and p values were calculated using either Student’s t-test or Mann–Whitney U-test. Continuous variables are presented as mean ± standard deviation or median, and p values were calculated using either chi-square test or Fisher’s exact test.
 |
Table 1 The Baseline Clinical Factors of Datasets |
Assessment of Traditional Machine Learning Model and the Deep Learning Model
The performance of four traditional machine learning models and four deep learning models is presented in Table 2 and Figure 3 respectively. The models’ performance, based on super-resolution images, generally exceeded that of the original image-based models. Additionally, SRMobileNet_v2 exhibits superior performance among the eight models.
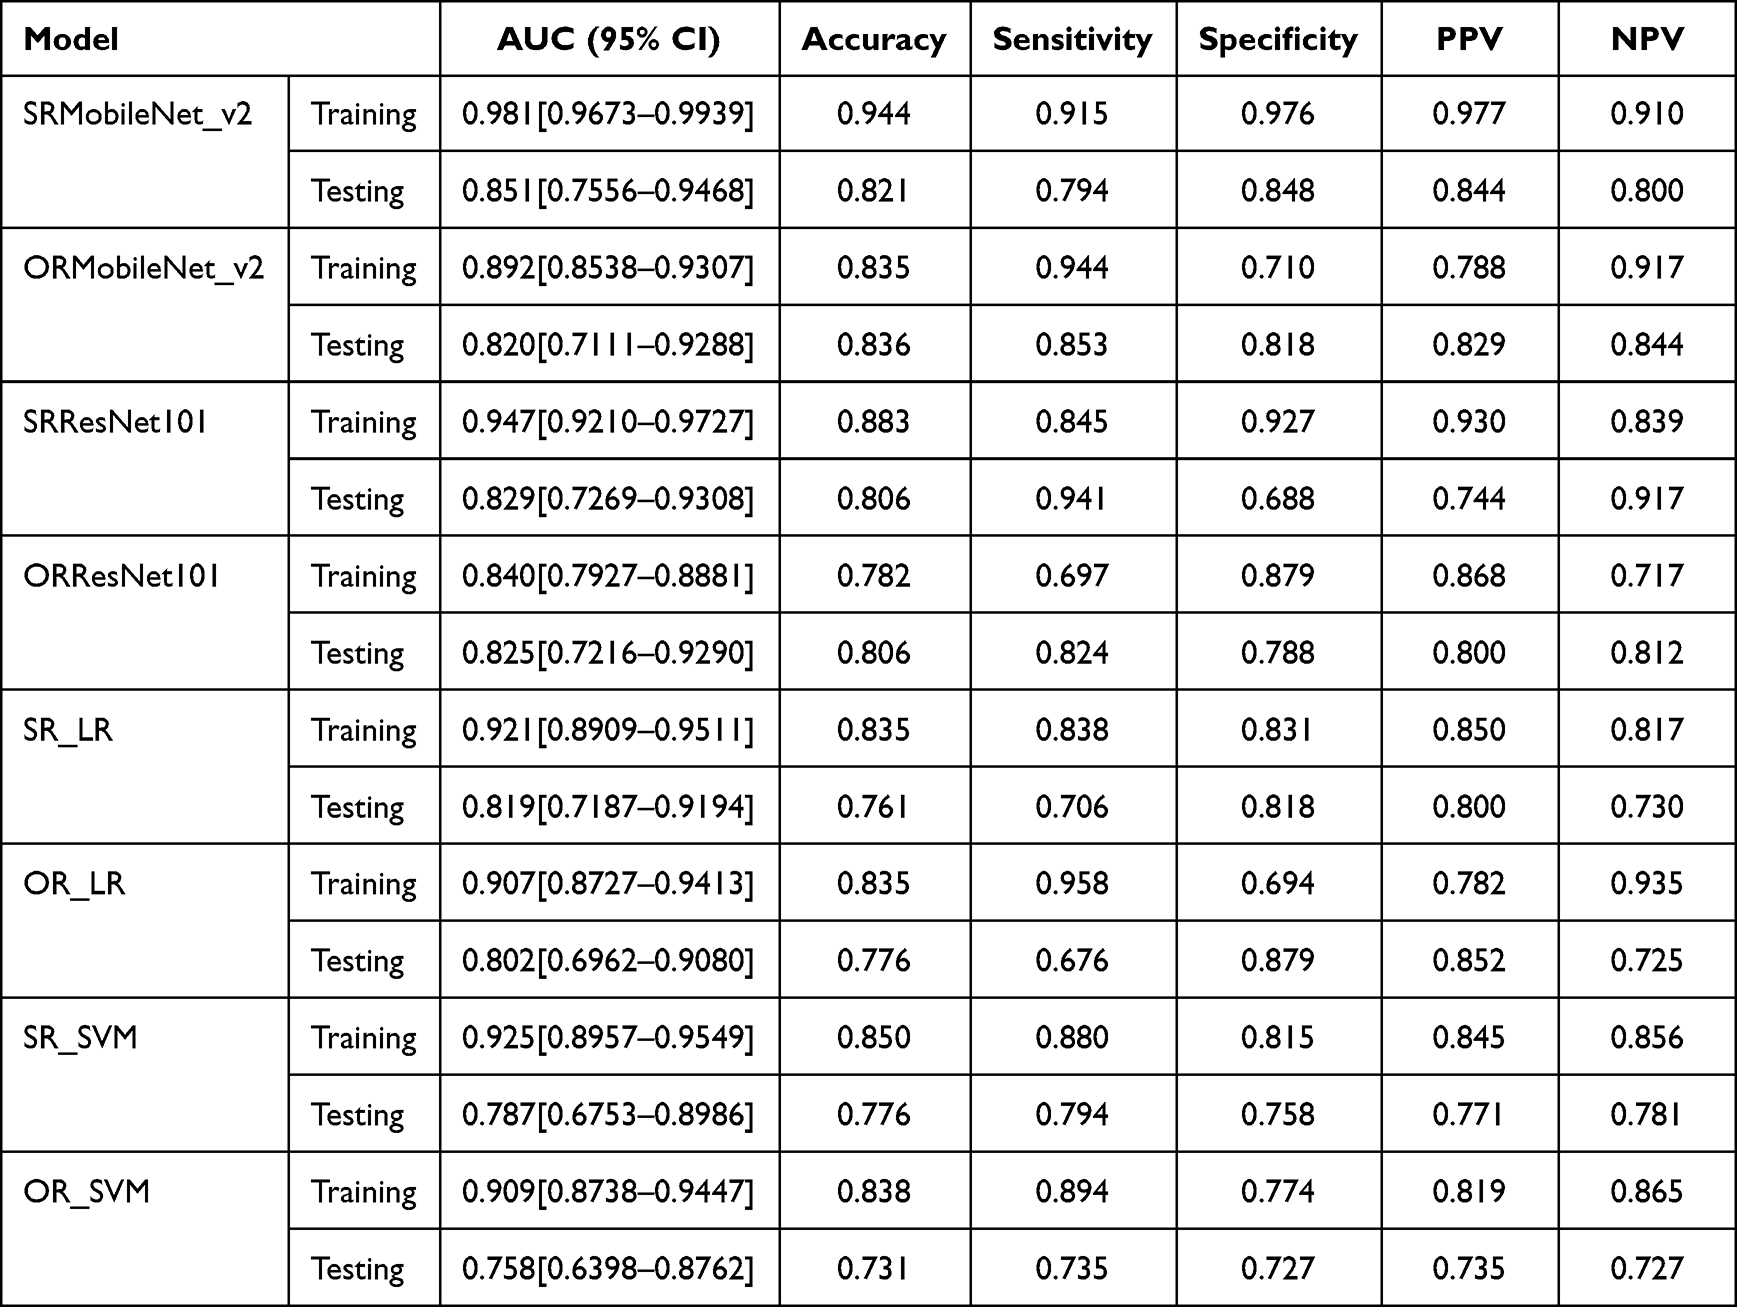 |
Table 2 The Performance of Different Models |
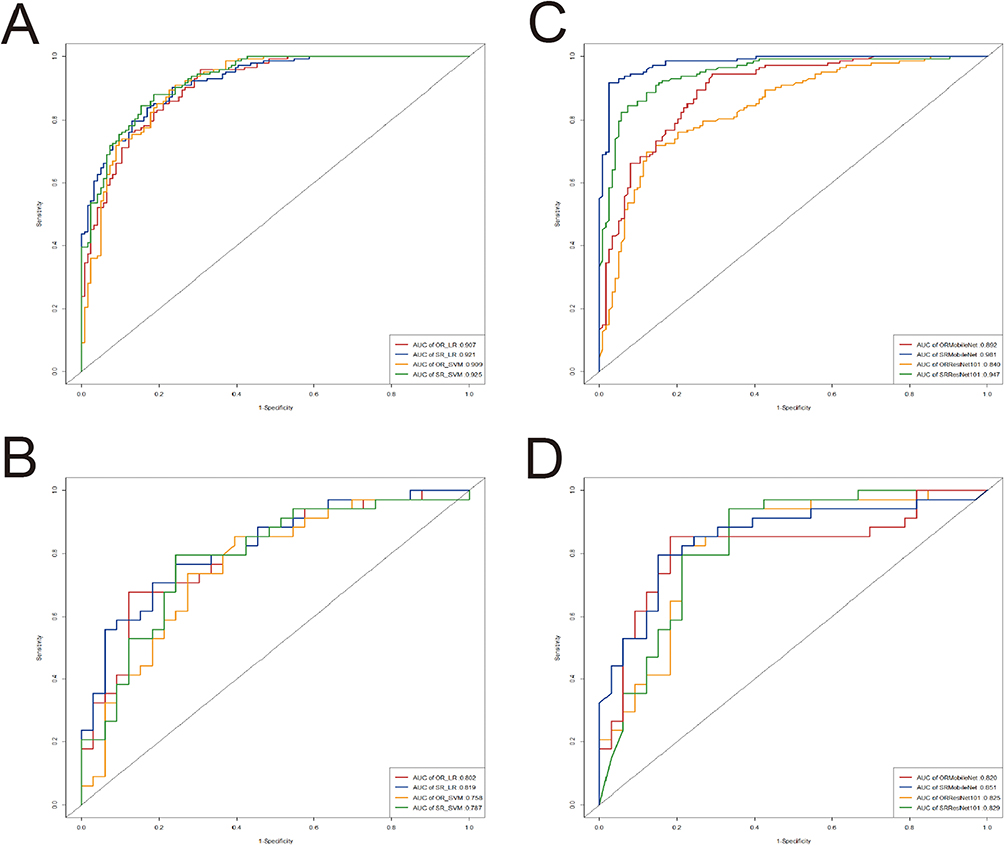 |
Figure 3 The ROC curves for machine learning models and deep learning models in both training and testing set. (A) ROC curves of machine learning models in training set. (B) ROC curves of machine learning models in testing set. (C) ROC curves of deep learning models in training set. (D) ROC curves of deep learning models in testing set. |
ROC curves of machine learning models in training set and testing set are shown in Figure 3A and B. Among the four traditional machine learning models, the logistic regression model based on super-resolution images (SR_LR) exhibits superior performance. The SR_LR model achieved an AUC of 0.921 (95% CI: 0.8909–0.9511), accuracy of 0.835, sensitivity of 0.838, specificity of 0.831, PPV of 0.850, and NPV of 0.817 in the training set; and an AUC of 0.819 (95% CI: 0.7187–0.9194), accuracy of 0.761, sensitivity of 0.706, specificity of 0.818 PPV of 0.800, and NPV of 0.730 in the testing set.
ROC curves of deep learning models in training set and testing set are illustrated in Figure 3C and D. In the four deep learning models, SRMobileNet_v2 s using MobileNet_v2 on super-resolution image had the best prediction performance in distinguishing between benign and malignant breast lesions. In the training set, SRMobileNet_v2 had an AUC of 0.981 (95% CI: 0.9673–0.9939), accuracy of 0.944, sensitivity of 0.915, specificity of 0.976, PPV of 0.977, and NPV of 0.910; while in the testing set, it demonstrated an AUC of 0.851 (95% CI: 0.7556–0.9468), accuracy of 0.821, sensitivity of 0.794, specificity of 0.848 PPV of 0.844, and NPV of 0.800.
SRMobileNet_v2 achieved the minimum loss value, indicating its superior performance in terms of error reduction during training process,17 and demonstrated faster convergence than any other three deep learning models (Figure 4). To enhance the interpretability of our deep learning model, we made the final convolutional layer transparent, allowing us to gain insights into the diagnosis of benign and malignant breast lesions, as illustrated in Figure 5.
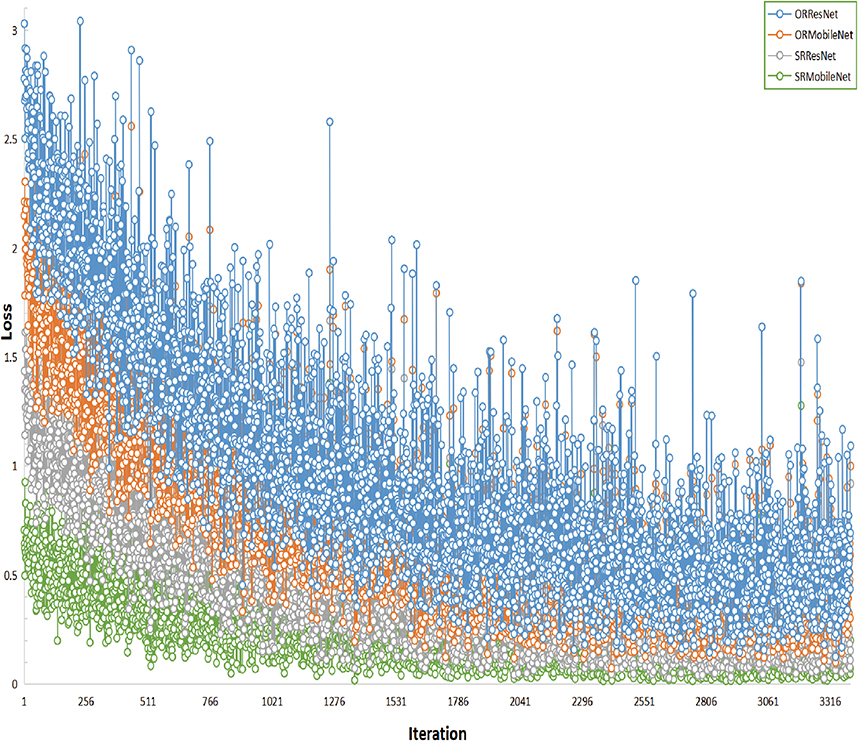 |
Figure 4 The loss values of various deep learning models exhibited variation across iteration steps in the training set. |
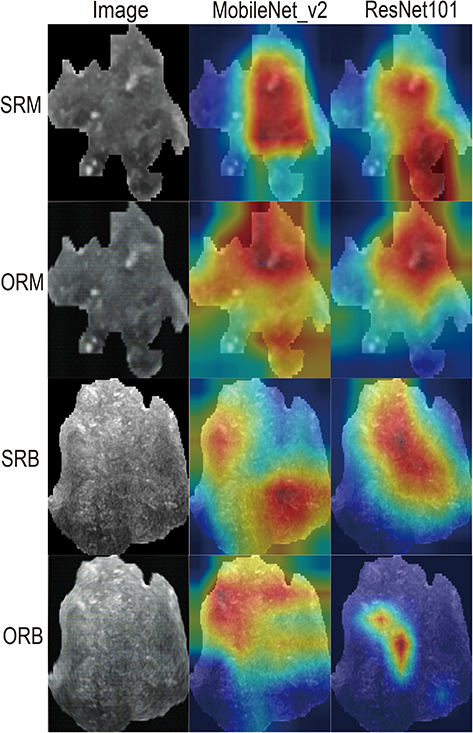 |
Figure 5 Attention regions of diverse deep learning models in ultrasound images of benign and malignant breast lesions: analysis of original and super-resolution images. ORM & SRM, original image & super-resolution image of malignant breast lesions; ORB & SRB, original image and super-resolution image of benign breast lesions. |
When examining the attention regions generated by the SRMobileNet_v2 model, we found that they were clear and focused mainly on the boundary and internal regions of the tumor. Interestingly, these attention regions did not show activation in areas adjacent to blood vessels, normal breast tissue, or other soft tissue. This suggests that the SRMobileNet_v2 model effectively narrows its focus to areas directly associated with tumors while excluding surrounding structures that may not be significant indicators of malignancy. By doing so, the model increases its specificity and accuracy in identifying malignant breast lesions.
Performance of Nomogram
The diagnostic performance of the deep-learning nomogram (shown in Figure 6) and the clinical model (constructed without incorporating the deep-learning score using Logistic Regression) were evaluated using ROC curves, as depicted in Figure 7A and B. In the training set, the deep-learning nomogram demonstrated excellent discrimination performance with an AUC of 0.986 (95% CI: 0.9747–0.9964). Even when applied to the testing set, the original model still displayed strong discrimination ability with a slightly reduced AUC of 0.894 (95% CI: 0.8167–0.9712).
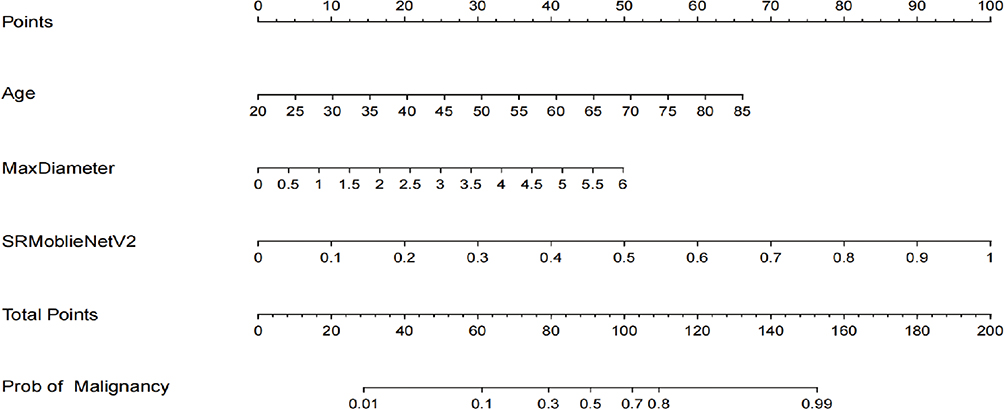 |
Figure 6 The deep-learning nomogram. |
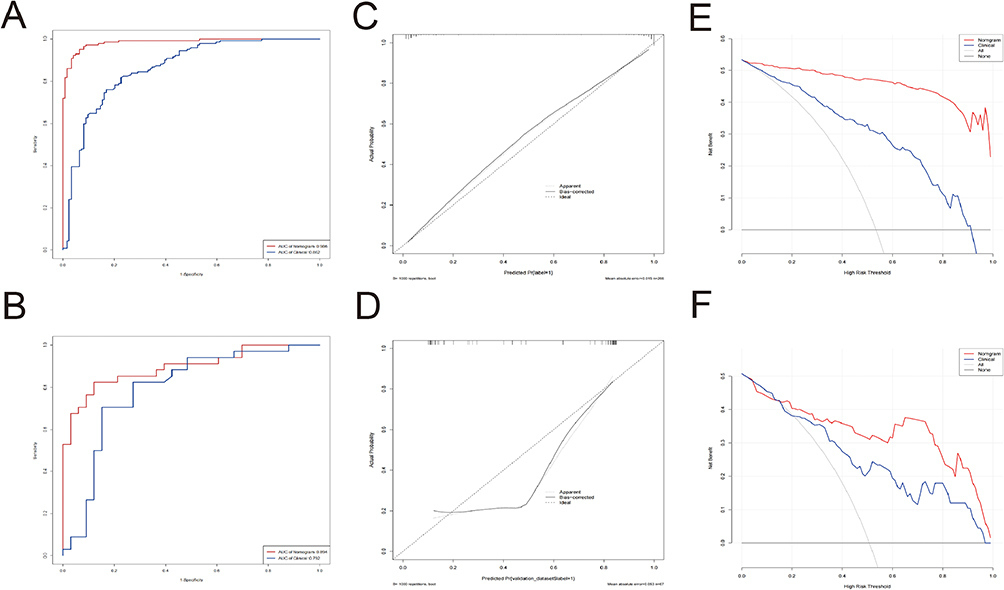 |
Figure 7 The diagnostic performance of the deep learning nomogram and the clinical model. (A) ROC curves of deep Learning nomogram and the clinical model in training set. (B) ROC curves of deep Learning nomogram and the clinical model in testing set. (C) The deep learning nomogram’s calibration curves in training set. (D) The deep learning nomogram’s calibration curves in testing set. (E) DCAs of deep learning nomogram and the clinical model in training set. (F) DCAs of deep learning nomogram and the clinical model in testing set. |
On the other hand, in both the training and testing sets, the clinical model had significantly lower discrimination compared to the deep-learning nomogram. In the training set, the clinical model achieved an AUC of 0.862 (95% CI: 0.8174–0.9070), while in the testing set, the AUC was 0.792 (95% CI: 0.6769–0.9069). The deep-learning nomogram outperformed the clinical model in both sets, indicating better predictive efficacy.
The deep-learning nomogram’s calibration curves showed that the predicted and observed malignancy of breast lesions had good agreement in both the training and testing groups (refer to Figure 7C and D). The HL test resulted in a non-significant P value of 0.668 and 0.285 for both cohorts, indicating that the deep-learning nomogram has excellent calibration capability. The DCAs demonstrated that the deep-learning nomogram yields a greater net benefit than the clinical model across the most threshold probability ranges in both training and testing sets (refer to Figure 7E and F).
Discussion
In our current investigation, we have developed an exceedingly precise nomogram for diagnosing benign and malignant breast nodules using deep-learning scores based on 3D super-resolution B-mode US images combined with clinical characteristics. The performance of our nomogram is exceptional, with AUC values of 0.986 in the training set and 0.894 in the testing set.
The efficiency of ultrasound diagnosis depends on the operator’s skill.18,19 Artificial intelligence is anticipated to enhance the diagnostic performance of breast ultrasound and reduce interobserver variability. Artificial intelligence plays a crucial role in breast cancer screening and detection, alleviating the workload of radiologists while compensating for inexperienced individuals’ lack of experience and skills. Several studies have explored the efficacy of different AI models in the diagnosis of breast nodules.20–26 Most of these studies have focused on two-dimensional grayscale ultrasound images, ultrasound elastography, and other multimodal images. However, there is a relatively limited number of studies that have specifically utilized super-resolution ultrasound images. Among them, Romeo’s B-ultrasound radiomics approach26 and Zhang’s B-mode ultrasound deep learning method24 have demonstrated high performance in diagnosing benign and malignant breast diseases. In the testing set, they achieved AUC values of 0.82 and 0.846, respectively. Our developed nomogram, based on B-mode ultrasound images, outperforms the previous studies with an AUC of 0.894 in the testing set. This signifies its superiority in diagnosing benign and malignant breast nodules.
In addition, we employed both deep learning and traditional machine learning techniques to construct diagnostic models. Eight diagnostic models were developed, and their performance was compared (showed in Table 2). Remarkably, the top-performing deep learning model surpassed the performance of the best traditional machine learning models in our dataset. The logistic regression model based on super-resolution images (SR_LR) achieved an AUC of 0.921 in the training set and an AUC of 0.819 in the testing set, while SRMobileNet_v2 utilizing. MobileNet_v2 on super-resolution image obtained an AUC of 0.981 in the training set and an AUC of 0.851 in the testing set.
To better demonstrate the performance of various deep learning models, we utilized heatmaps. These heatmaps have revolutionized medical diagnosis by providing invaluable insights into the nature of malignant lesions and highlighting salient regions that help clinicians make informed decisions about patient care.
The development of medical image clarity is crucial as it serves as the fundamental basis for experts to diagnose patients’ conditions. Super-resolution techniques have demonstrated their efficacy in improving image resolution and quality in various medical imaging modalities.27 Super-resolution reconstruction is mainly widely used in practical medical applications for MR and CT images,28–31 but it is rarely used for US images.32,33 In the present study, we applied super-resolution reconstruction to B-mode ultrasound images with the expectation of achieving finer details and improved visualization of breast nodules. This has the potential to lead to more accurate and reliable diagnoses. In line with the current trend, researchers will continue to propose more effective super-resolution reconstruction algorithms in order to enhance the quality of medical images. Looking ahead, it may become feasible to directly acquire high-definition medical images through low-cost software algorithms. With the increasing prevalence of super-resolution technology in clinical practice, a greater number of radiologists will reap its benefits.
Our research is subject to certain limitations. First, as this study is retrospective in nature, further prospective studies are necessary to validate its findings before they can be translated into clinical practice. Second, the 3D super-resolution reconstruction technique we provided can increase the spatial resolution by 2 times while maintaining the original image size. In future studies, we aim to increase the spatial resolution even further for comparative studies. Third, the primary objective of this study was solely focused on super-resolution reconstruction of B-mode ultrasound images. Our aim is to fully implement super-resolution techniques on ultrasound images acquired in various modes, with the ultimate goal of establishing a universal diagnostic model for distinguishing between benign and malignant breast lesions. This will enhance the applicability of our tool and assist clinicians in their discrimination tasks. Fourth, due to the retrospective design of this study, we did not establish such a combined model based on US, Mammography, and MR images of patients with breast nodules. However, exploring such a comprehensive model will be an important direction for our future research endeavors.
Conclusion
We have successfully developed a nomogram by integrating clinical parameters with the Deep Learning Radiomics technique, based on high-resolution ultrasound images of breast nodules. This innovative approach offers a noninvasive and highly practical solution for accurately predicting the benign or malignant nature of these nodules before surgery. Our nomogram not only enhances diagnostic accuracy but also provides clinicians with an advanced tool to make informed decisions regarding patient care.
Abbreviations
OR, Original images; SR, Super-Resolution.
Data Confidentiality Statement
This study complied with ethical standards, and all patient data was anonymized and properly protected, including encrypted storage of patient information, strict control of access, and timely destruction of unnecessary information.
Data Sharing Statement
The datasets utilized and analyzed in this study are not publicly available due to patient privacy requirements and ethical restriction.
Ethical Approval and Informed Consent Statement
Ethical approvals for the study were obtained from the Institutional Review Boards of the First Affiliated Hospital of Shandong First Medical University & Shandong Provincial Qianfoshan Hospital (YXLL-KY-2023(045)). Patient consent was waived due to the retrospective nature of the study and the analysis used anonymous clinical data. The study was conducted according to the guidelines of the Declaration of Helsinki (2013 revision).
Funding
This study was supported by the Provincial Key Research and Development Fund of Shandong Province, China (Grant #:2016GSF201141).
Disclosure
The authors declare that the research was conducted in the absence of any commercial or financial relationships that could be construed as a potential conflict of interest.
References
1. Evans A, Trimboli RM, Athanasiou A, et al. Breast ultrasound: recommendations for information to women and referring physicians by the European Society of Breast Imaging. Insights Imaging. 2018;9(4):449–461. doi:10.1007/s13244-018-0636-z
2. Sammut S-J, Crispin-Ortuzar M, Chin S-F, et al. Multi-omic machine learning predictor of breast cancer therapy response. Nature. 2022;601(7894):623–629. doi:10.1038/s41586-021-04278-5
3. Harbeck N, Penault-Llorca F, Cortes J, et al. Breast cancer. Nat Rev Dis Primers. 2019;5(1):66. doi:10.1038/s41572-019-0111-2
4. Forouzanfar MH, Foreman KJ, Delossantos AM, et al. Breast and cervical cancer in 187 countries between 1980 and 2010: a systematic analysis. Lancet. 2011;378(9801):1461–1484. doi:10.1016/S0140-6736(11)61351-2
5. Madjar H. Role of breast ultrasound for the detection and differentiation of breast lesions. Breast Care (Basel). 2010;5(2):109–114. doi:10.1159/000297775
6. Ricci P, Maggini E, Mancuso E, Lodise P, Cantisani V, Catalano C. Clinical application of breast elastography: state of the art. Eur J Radiol. 2014;83(3):429–437. doi:10.1016/j.ejrad.2013.05.007
7. Qiu D, Zheng L, Zhu J, Huang D. Multiple improved residual networks for medical image super-resolution. Future Gen Comput Syst. 2021;116:200–208. doi:10.1016/j.future.2020.11.001
8. Kim J, Lee JK, Lee KM. Deeply-recursive convolutional network for image super-resolution; 2016:1637–1645.
9. Tai Y, Yang J, Liu X. Image super-resolution via deep recursive residual network; 2017:2790–2798.
10. Hu J, Shen L, Sun G. Squeeze-and-Excitation Networks; 2018:7132–7141.
11. Dai T, Cai J, Zhang Y, Xia ST, Zhang L. Second-order attention network for single image super-resolution; 2019:11057–11066.
12. Lim B, Son S, Kim H, Nah S, Lee KM. Enhanced deep residual networks for single image super-resolution; 2017:1132–1140.
13. Kim J, Lee JK, Lee KM. Accurate image super-resolution using very deep convolutional networks; 2016:1646–1654.
14. Khorrami M, Bera K, Leo P, et al. Stable and discriminating radiomic predictor of recurrence in early stage non-small cell lung cancer: multi-site study. Lung Cancer. 2020;142:90–97. doi:10.1016/j.lungcan.2020.02.018
15. Zheng J, Kong J, Wu S, et al. Development of a noninvasive tool to preoperatively evaluate the muscular invasiveness of bladder cancer using a radiomics approach. Cancer. 2019;125(24):4388–4398. doi:10.1002/cncr.32490
16. Selvaraju RR, Cogswell M, Das A, Vedantam R, Parikh D, Batra D. Grad-CAM: visual explanations from deep networks via gradient-based localization; 2017:618–626.
17. Zhang H, Lai H, Wang Y, et al. Research on the classification of benign and malignant parotid tumors based on transfer learning and a convolutional neural network. IEEE Access. 2021;9:40360–40371. doi:10.1109/ACCESS.2021.3064752
18. Giess CS, Frost EP, Birdwell RL. Difficulties and errors in diagnosis of breast neoplasms. Semin Ultrasound CT MR. 2012;33(4):288–299. doi:10.1053/j.sult.2012.01.007
19. Park JM, Yang L, Laroia A, Franken EA, Fajardo LL. Missed and/or misinterpreted lesions in breast ultrasound: reasons and solutions. Can Assoc Radiol J. 2011;62(1):41–49. doi:10.1016/j.carj.2010.09.002
20. Li J, Bu Y, Lu S, et al. Development of a deep learning-based model for diagnosing breast nodules with ultrasound. J Ultrasound Med. 2021;40(3):513–520. doi:10.1002/jum.15427
21. Berg WA, Cosgrove DO, Doré CJ, et al. Shear-wave elastography improves the specificity of breast US: the BE1 multinational study of 939 masses. Radiology. 2012;262(2):435–449. doi:10.1148/radiol.11110640
22. Lee SH, Chung J, Choi HY, et al. Evaluation of screening US-detected breast masses by combined use of elastography and color Doppler US with B-Mode US in women with dense breasts: a multicenter prospective study. Radiology. 2017;285(2):660–669. doi:10.1148/radiol.2017162424
23. Cho N, Jang M, Lyou CY, Park JS, Choi HY, Moon WK. Distinguishing benign from malignant masses at breast US: combined US elastography and color Doppler US--influence on radiologist accuracy. Radiology. 2012;262(1):80–90. doi:10.1148/radiol.11110886
24. Zhang N, Li X-T, Ma L, Fan Z-Q, Sun Y-S. Application of deep learning to establish a diagnostic model of breast lesions using two-dimensional grayscale ultrasound imaging. Clin Imaging. 2021;79:56–63. doi:10.1016/j.clinimag.2021.03.024
25. Liao J, Gui Y, Li Z, et al. Artificial intelligence-assisted ultrasound image analysis to discriminate early breast cancer in Chinese population: a retrospective, multicentre, cohort study. EClinicalMedicine. 2023;60:102001. doi:10.1016/j.eclinm.2023.102001
26. Romeo V, Cuocolo R, Apolito R, et al. Clinical value of radiomics and machine learning in breast ultrasound: a multicenter study for differential diagnosis of benign and malignant lesions. Eur Radiol. 2021;31(12):9511–9519. doi:10.1007/s00330-021-08009-2
27. Qiu D, Cheng Y, Wang X. Medical image super-resolution reconstruction algorithms based on deep learning: a survey. Comput Methods Programs Biomed. 2023;238:107590. doi:10.1016/j.cmpb.2023.107590
28. Zhou Z, Ma A, Feng Q, et al. Super-resolution of brain tumor MRI images based on deep learning. J Appl Clin Med Phys. 2022;23(11):e13758. doi:10.1002/acm2.13758
29. Kobayashi H, Nakayama R, Hizukuri A, Ishida M, Kitagawa K, Sakuma H. Improving image resolution of whole-heart coronary MRA using convolutional neural network. J Digit Imaging Apr. 2020;33(2):497–503. doi:10.1007/s10278-019-00264-6
30. Hou M, Zhou L, Sun J. Deep-learning-based 3D super-resolution MRI radiomics model: superior predictive performance in preoperative T-staging of rectal cancer. Eur Radiol. 2023;33(1):1–10. doi:10.1007/s00330-022-08952-8
31. Xie H, Zhang T, Song W, et al. Super-resolution of Pneumocystis carinii pneumonia CT via self-attention GAN. Comput Methods Programs Biomed. 2021;212:106467. doi:10.1016/j.cmpb.2021.106467
32. Kang TW, Jeong WK, Kim -Y-Y, et al. Comparison of super-resolution US and contrast material-enhanced US in detection of the spoke wheel sign in patients with focal nodular hyperplasia. Radiology. 2021;298(1):82–90. doi:10.1148/radiol.2020200885
33. Lin X, Zhou X, Tong T, et al. A super-resolution guided network for improving automated thyroid nodule segmentation. Comput Methods Programs Biomed. 2022;227:107186. doi:10.1016/j.cmpb.2022.107186
 © 2023 The Author(s). This work is published and licensed by Dove Medical Press Limited. The full terms of this license are available at https://www.dovepress.com/terms.php and incorporate the Creative Commons Attribution - Non Commercial (unported, v3.0) License.
By accessing the work you hereby accept the Terms. Non-commercial uses of the work are permitted without any further permission from Dove Medical Press Limited, provided the work is properly attributed. For permission for commercial use of this work, please see paragraphs 4.2 and 5 of our Terms.
© 2023 The Author(s). This work is published and licensed by Dove Medical Press Limited. The full terms of this license are available at https://www.dovepress.com/terms.php and incorporate the Creative Commons Attribution - Non Commercial (unported, v3.0) License.
By accessing the work you hereby accept the Terms. Non-commercial uses of the work are permitted without any further permission from Dove Medical Press Limited, provided the work is properly attributed. For permission for commercial use of this work, please see paragraphs 4.2 and 5 of our Terms.