")
Back to Journals » Journal of Inflammation Research » Volume 14
Nomogram Based on Lactate Dehydrogenase-to-Albumin Ratio (LAR) and Platelet-to-Lymphocyte Ratio (PLR) for Predicting Survival in Nasopharyngeal Carcinoma
Authors Peng RR , Liang ZG, Chen KH, Li L, Qu S, Zhu XD
Received 7 June 2021
Accepted for publication 28 July 2021
Published 20 August 2021 Volume 2021:14 Pages 4019—4033
DOI https://doi.org/10.2147/JIR.S322475
Checked for plagiarism Yes
Review by Single anonymous peer review
Peer reviewer comments 3
Editor who approved publication: Professor Ning Quan
Ru-Rong Peng,1 Zhong-Guo Liang,1 Kai-Hua Chen,1 Ling Li,1 Song Qu,1 Xiao-Dong Zhu1,2
1Department of Radiation Oncology, Guangxi Medical University Cancer Hospital, Nanning, People’s Republic of China; 2Department of Oncology, Affiliated Wu-Ming Hospital of Guangxi Medical University, Nanning, People’s Republic of China
Correspondence: Xiao-Dong Zhu
Department of Radiation Oncology, Guangxi Medical University Cancer Hospital, 71 He-di Road, Nanning, 530021, People’s Republic of China
Tel +86 15778028340
Email [email protected]
Purpose: The prognosis of inflammation-related indicators like lactate dehydrogenase/albumin ratio (LAR) and the platelet/lymphocyte ratio (PLR) in nasopharyngeal carcinoma (NPC) is not yet clear. Our objective is to establish and verify the nomogram using LAR and PLR ratio for the first time to explore the prognostic value in NPC.
Patients and Methods: This was a retrospective collection of 1661 patients with non-metastatic NPC admitted to our hospital from 2010 to 2017. The final variables of overall survival (OS) and progression-free survival (PFS) were selected by Cox regression analysis to establish nomograms, and the methods to verify the prediction precision and discriminative ability of the nomograms were concordance index (C index), the receiver operating characteristic (ROC) curve and calibration curve. The risk stratification was carried out through the nomograms and compared with the current staging system by the Kaplan–Meier methods.
Results: Multivariate Cox analysis resulted that age, plasma Epstein–Barr Virus (EBV) DNA, T stage, N stage, white blood cells (WBC), PLR and LAR were independent prognostic risk factors for OS and PFS, and sex is an independent prognostic risk factor for OS. The C-indexes of OS nomogram were 0.722 (95% CI: 0.706– 0.738) and 0.747 (95% CI: 0.717– 0.777) in the training cohort and validation cohort, which were statistically higher than the current 8th AJCC staging system (0.646 and 0.688). The C-indexes of PFS nomogram were 0.696 (95% CI: 0.680– 0.713) and 0.690 (95% CI: 0.660– 0.720), which were also statistically higher than the current 8th AJCC staging system (0.632 and 0.666). Otherwise, ROC curves and the calibration curve for probability also confirmed satisfied consistency with actual observations.
Conclusion: LAR is a novel useful independent factor in NPC. The proposed nomogram LAR and PLR resulted in more accurate prognostic prediction than current staging system for NPC patients.
Keywords: intensity-modulated radiotherapy, nasopharyngeal carcinoma, lactate dehydrogenase to albumin ratio, platelet-to-lymphocyte ratio, tumor–node–metastasis staging system
Introduction
Nasopharyngeal carcinoma (NPC) is one of the malignant head and neck cancers that mainly originates from the epithelium of the top and side walls of the nasopharyngeal cavity. The high morbidity rates are observed in Southeast Asia and some provinces in southeastern China, such as Guangdong and Guangxi, and had reached a peak incidence of 50 cases per 100,000.1 Radiotherapy has always been the cornerstone of nasopharyngeal carcinoma treatment due to its outstanding radiosensitivity. With the rapid advancement of imaging and radiology (RT) technology in the past decades, radiotherapy technology has stepped the era of two-dimensional radiotherapy (2DRT) into the era of intensity-modulated radiotherapy (IMRT).2,3 In addition, multiple meta-analysis and randomized trials have proved that concurrent chemoradiation with or without sequential chemotherapy can significantly improve the 5-year OS and PFS for stage II–IVA NPC.4,5
At present, the staging of NPC mainly adopts the tumor–node–metastasis (TNM) staging system of the Union of International Cancer Control and the eighth American Joint Committee on Cancer (UICC/AJCC). However, it has been continuously clinically confirmed that even patients with the same TNM stage have prognostic heterogeneity. This is because NPC is increasingly recognized as a local tissue and systemic disease. Extensive research revealed that inflammatory cells promote the proliferation and metastasis of tumor cells by creating tumor microenvironment.6–8 Studies have shown that large numbers of infiltrating white blood cells that persist in nasopharyngeal cancer lesions can promote the growth of nasopharyngeal cancer cells.9 In addition, a large-scale study from Hong Kong found that even a small tumor load can release a sufficient amount of EBV DNA into the circulation, demonstrating the potential of circulating EBV DNA analysis in the screening of early asymptomatic nasopharyngeal carcinoma.10 Thus, as a molecular-based decision, bring inflammation-related parameters into TNM staging system to make the prognosis model more personalized is recommended. The systemic inflammatory biomarkers such as pre-treatment platelet count to lymphocyte count ratio (PLR), neutrophil to lymphocyte ratio (NLR), systemic immune inflammation index (SII) and systemic inflammatory response index (SIRI) were suggested as effective prognostic factors of NPC.11–14 Moreover, lactate dehydrogenase (LDH) is a significant enzyme which has been reported to be involved in energy production in different cancer species and shows good predictability in prognosis of NPC.15,16 As an indicator of nutritional status, albumin (ALB) also reflects good prognosis.17 However, the joint effect of inflammation and nutrition like lactate dehydrogenase to albumin ratio (LAR) in NPC is still unclear.
By integrating various prognosis and determinants, the nomogram makes the ability to predict the possibility of clinical events in individual patients more precise, and it has advantages over traditional staging systems utilized to predict the prognosis of numerous cancer patients.18 Hence, we initially explore LAR in this study. We constructed nomograms involving clinicopathologic factors, plasma EBV DNA, LAR and inflammation indicators to predict the OS and PFS of NPC.
Patients and Methods
Patients
We retrospectively reviewed 1661 patients completely treated at our cancer center between January 2010 and December 2017. A total of 1162 patients were selected as the training cohort from January 2010 to December 2015, and 499 patients were selected as the validation cohort from January 2016 to December 2017. The inclusion criteria of our study were (a) histopathology confirmed NPC; (b) TNM stage II–IVA; (c) received concurrent chemoradiation combined with induction or adjuvant chemotherapy; (d) received IMRI technical radiotherapy; (e) completed the entire treatment. The exclusion criteria were (a) multiple cancers at diagnosis; (b) distant metastasis in initial treatment; (c) serious complications; (d) inability to complete the treatment phase; (e) lost to follow-up. The 8th edition of AJCC staging system was applied as the basis for staging classification. The Ethics Committee of Guangxi Medical University Cancer Hospital approved the study protocol, and the committee gave up the written informed consent. The data has been analyzed anonymously and all personal information of the participants was confidential.
Hematological Examination
The hematology specimens were gathered within 1 week before treatment. The blood of patients on an empty stomach for 8–12 hours was collected into an anticoagulation vacuum tube and completed analyzed within 30 minutes. Routine peripheral blood cells were analyzed by Sysmex XT-1800i (Sysmex, Kobe, Japan) automated hematology analyzer. Lactate dehydrogenase-to-albumin ratio (LAR), platelet-to-lymphocyte ratio (PLR), neutrophil-to-lymphocyte ratio (NLR), systemic immune inflammation index (SII), and systemic inflammatory response index (SIRI) were included in the study. Their calculation formula is as follows:
LAR= lactate dehydrogenase (U/L)/serum albumin (g/L);
PLR= platelet count (109 /L)/lymphocyte count (109 /L);
NLR = neutrophil count (109 /L)/lymphocyte count (109 /L);
SII=platelet count (109 /L) × neutrophil count/lymphocyte count (109 /L);
SIRI=monocyte count (109 /L) × neutrophil count/lymphocyte count (109 /L).
Treatment
TNM staging is still the guideline for treatment planning. According to the recommendations of the National Comprehensive Cancer Network (NCCN) guidelines, CCRT is a level I recommendation for stage II patients, while a combination of CCRT and IC/AC for stage III or IV patients is a level I recommendation. All patients received CCRT, with or without IC/AC and underwent IMRI with 6 megavoltage photons (6 MV) in this study. Regarding the total prescribed dose, the primary nasopharyngeal tumor (GTVnx) was 70~75.9Gy/31~32 f, and the cervical metastatic lymph node (GTVnd) was 60~73.6Gy/30~32 f. The extension of GTVnx by 5mm, and the surrounding subclinical area (clinical target volume 1, CTV1) was 60~68Gy/30~31 f. Considering the nasopharyngeal anatomy and the biological characteristics of the tumor, the expansion of CTV1 by 5mm, including the GTVnd and the cervical lymphatic drainage area (clinical target volume 2, CTV2) that needs preventive irradiation was 54~57.6Gy/30~31 f. Concurrent chemotherapy was mainly cisplatin, and some intolerant patients were nedaplatin at a dose of 80–100 mg/m2, delivered over three 21-day cycles. Induction chemotherapy was TPF regimen (The dose of docetaxel on day 1 was 60mg/m2, the dose of cisplatin on day 1 was 60mg/m2 and the dose of 5-fluorouracil was 600mg/m2, 120h continuous intravenous drip) or GP regimen (The dose of gemcitabine was 1000 mg/m2 on days 1 and 8, and the dose of cisplatin was 60 mg/m2 on days 1). Adjuvant chemotherapy was the PF regimen (cisplatin 80mg/m2, 5-fluorouracil 600mg/m2, 120h continuous intravenous drip). Induction or adjuvant chemotherapy looped 2–3 cycles, performed in 21-day. Among them, 827 patients received concurrent chemoradiation (CC), 529 received induction chemotherapy plus concurrent chemoradiation (IC+CC), and 305 received concurrent chemoradiation plus adjuvant chemotherapy (CC+AC).
Follow-Up
After the first complete treatment, the patient underwent physical examination, indirect nasopharyngoscope and related imaging examinations every 3–6 months, every 6–12 months for 3 to 5 years, and once a year thereafter. In this retrospective study, our follow-up time range 4–123 months, and the median follow-up time was 63.4 months. For patients diagnosed with local recurrence or distant metastasis, rescue treatment such as surgery, re-radiotherapy or systemic chemotherapy will be given. The endpoints of our study were the primary endpoint of OS and the secondary endpoint of PFS. OS was defined as the time between the start of treatment and death from any cause. PFS was defined as the time from the start of treatment to the first occurrence of disease progression or death from any cause. For patients who did not have a study endpoint, we recorded the latest follow-up date.
Statistical Analysis
All statistical analysis steps are carried out in R, version 3.6.0 (http://www.r-project.org/). Firstly, the Mann–Whitney U-test was used to compare continuous variables, while the chi-square test was used to compare categorical variables. Through receiver operating characteristic (ROC) curve analysis, the cut-off values of the research indicators based on OS were obtained, and then those continuous variables were converted into binary variables according to the cut-off value. In addition to the body mass index (BMI), we converted into ≤18kg/m2, 18–24kg/m2, ≥24kg/m2, which is based on Asian standards. In the training cohort, univariate cox regression analysis was used to select factors which P <0.1 to enter multivariate analysis, and select factors which P <0.05 in multivariate analysis to determine risk factors independent prognosis for NPC. The association between LDH and LAR was assessed using the Spearman’s rank correlation coefficient test. OS and PFS nomograms based on the final variables obtained from the results of multivariate Cox regression analysis. To estimate the discriminant performance of the nomogram, we use Harrell’s C-index and ROC analysis. The calibration curve can quantify the predictive accuracy of the nomogram, which is measured by bootstrap verification with 1000 resamples. After the risk score was determined by the nomogram, the best cut-off value of the scores of the patients in the training cohort was obtained in the X-tile, version 3.6.1. According to the cut-off value, patients were divided into low-risk group and high-risk group. The Log rank test was used to analyze the survival difference between risk groups. Finally, the Kaplan–Meier method was used to analyze different groups and TNM stages.
Results
Patient Characteristics
What we found in research results are followed: the median age was 45 years (range 12–78 years) of 1661 patients with NPC, 1239 (74.6%) were male, 422 (25.4%) were female (Table 1). In the light of TNM staging, there were 351 (21.1%) in stage II, 780 (47.0%) in stage III and 530 (32.0%) in stage IV. Among these treated patients, 827 (49.8%) patients who received chemoradiotherapy, 529 (31.9%) patients who received induction chemotherapy plus concurrent chemoradiotherapy and 305 (18.4%) patients who received concurrent chemoradiotherapy plus adjuvant chemotherapy. The median values of the pre-treatment white blood cell, hemoglobin, platelet count, neutrophil count, monocyte count, lymphocyte count, albumin, alkaline phosphatase and lactate dehydrogenase were 6.70×10⁹ /L, 140.00g/L, 262.59×10⁹ /L, 4.04×10⁹ /L, 0.44×10⁹ /L, 1.85×10⁹ /L, 42.40g/L, 65.00U/L and 176.00U/L, respectively.
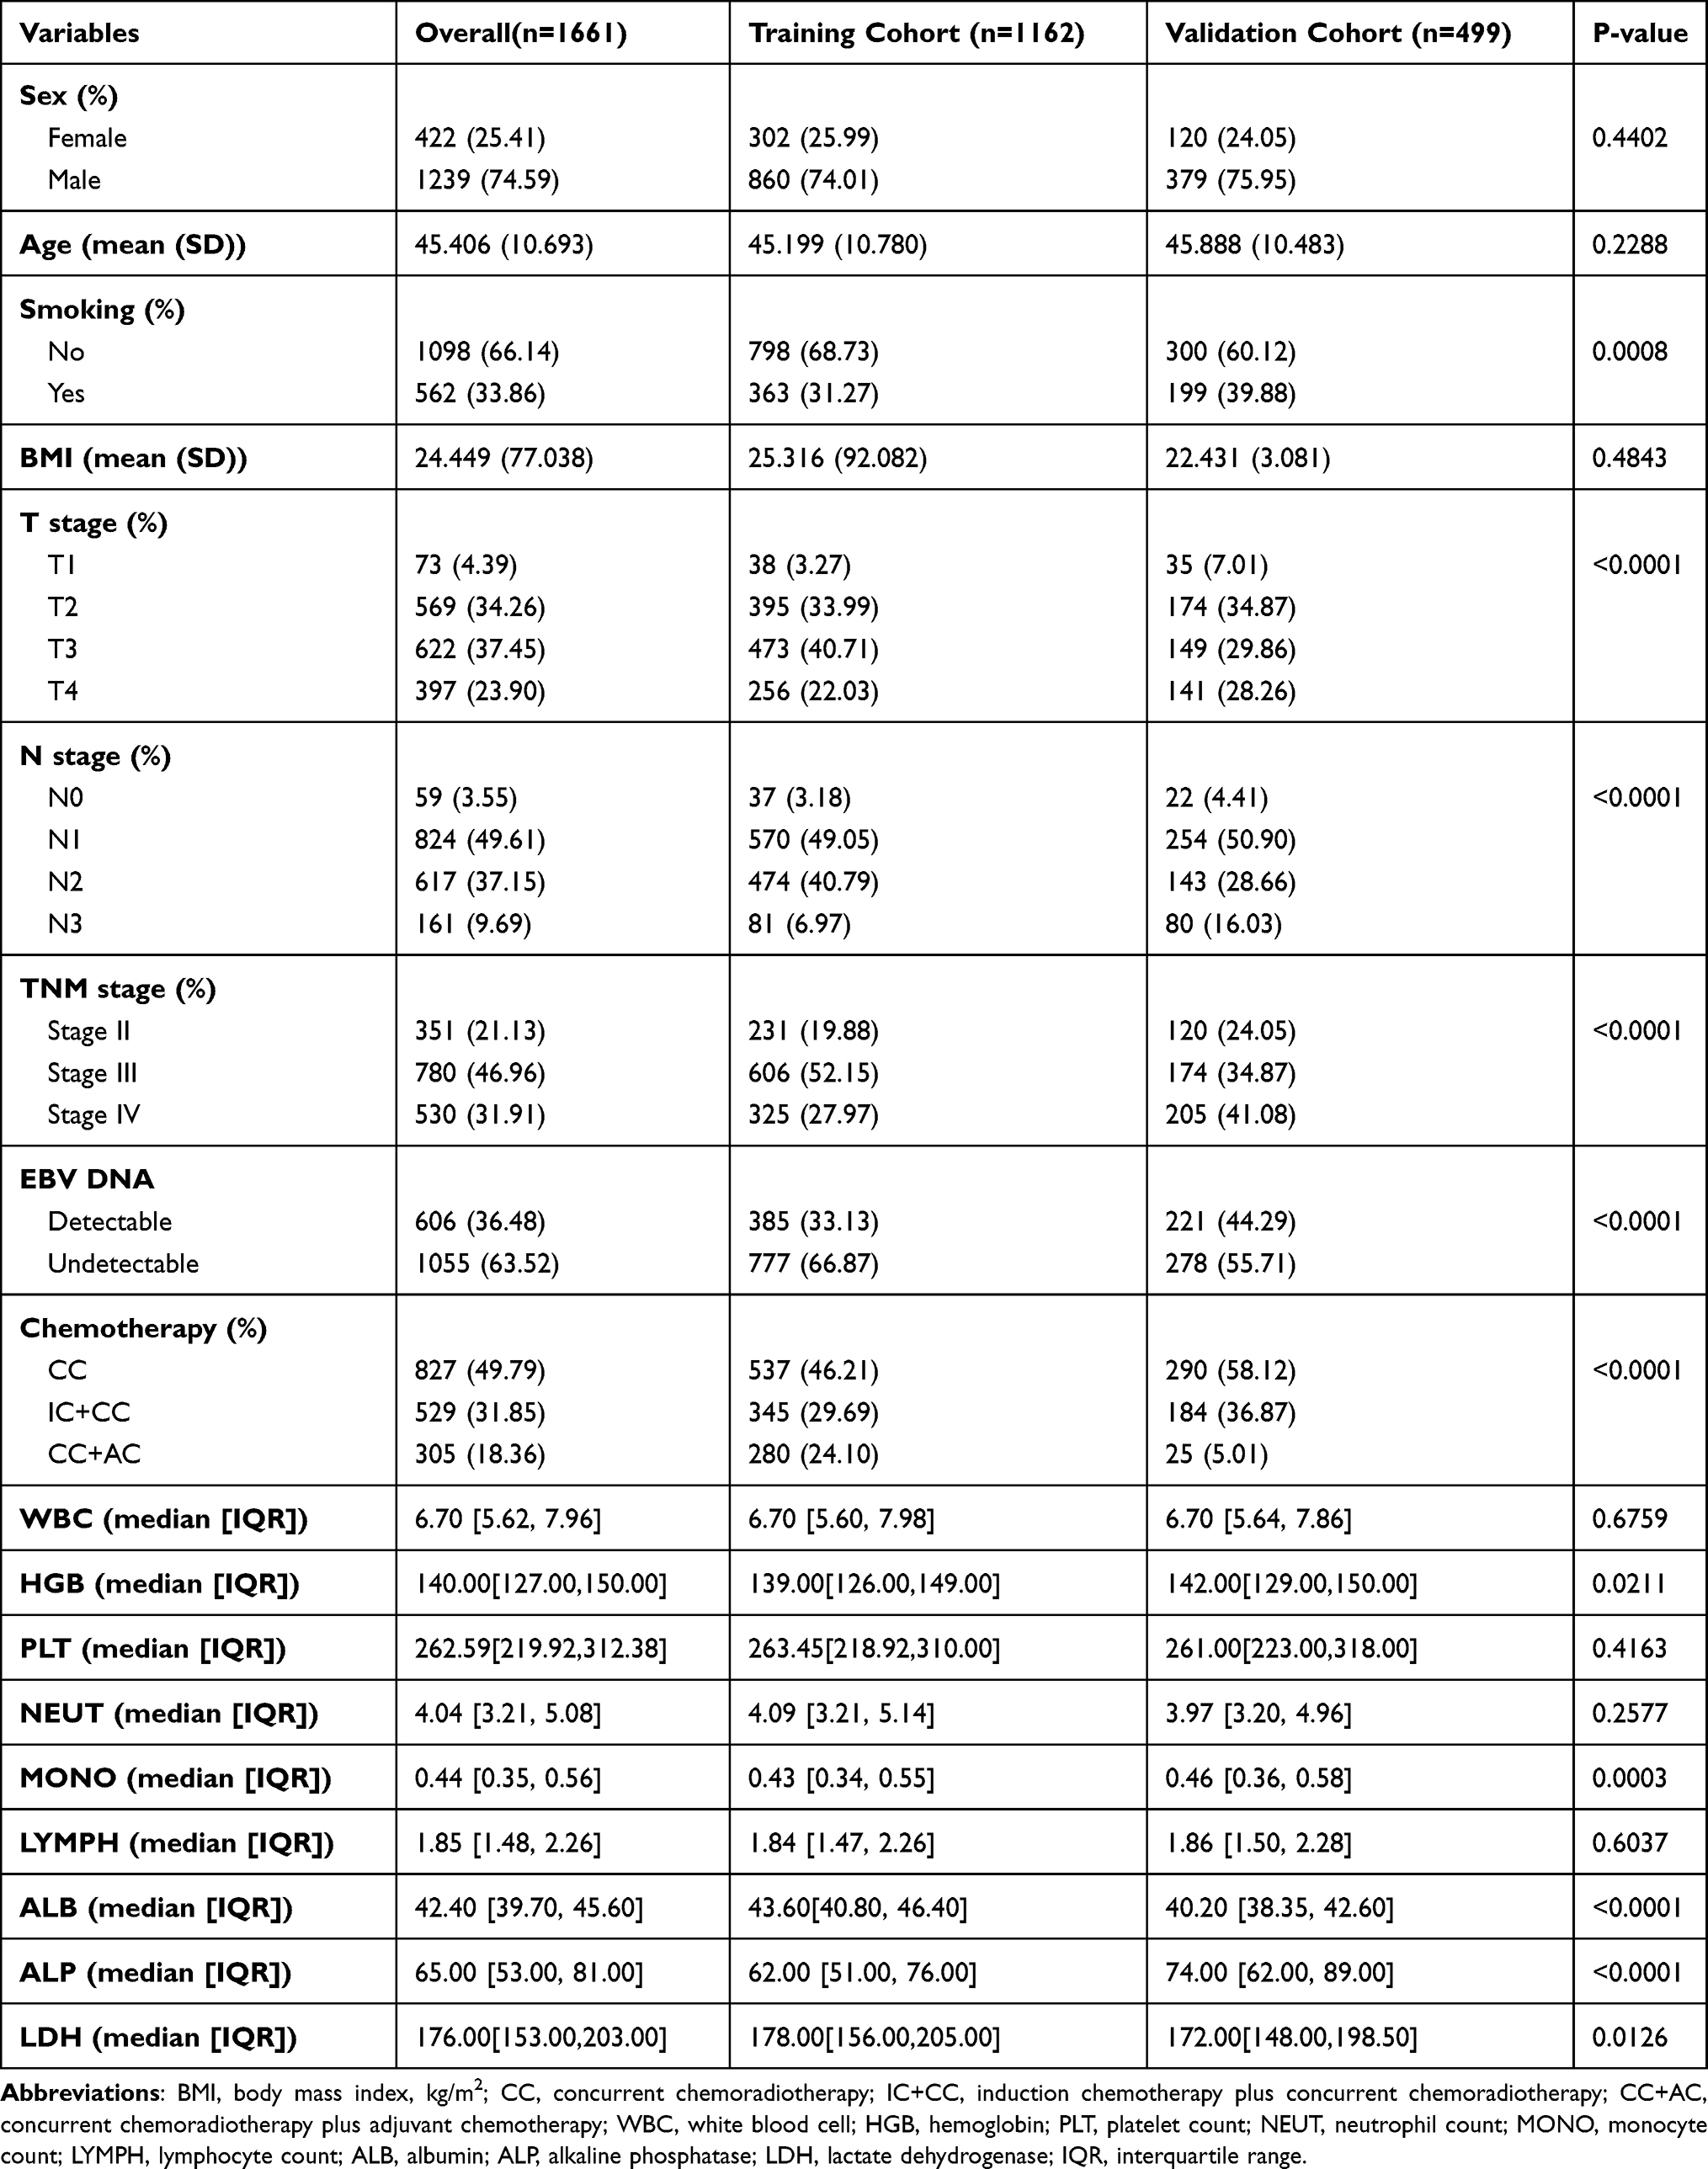 |
Table 1 NPC Patients Characteristics |
Factors Associated with OS and PFS in the Training Cohort
As per the ROC curves in the training cohort (Supplementary Figure), the optimal truncation values for age, WBC, ALP, LDH, LAR, NLR, PLR, SII and SIRI (The deleted variables are in the Supplementary Table) were identified to be 49 years, 4.94×10⁹/L, 59U/L, 174U/L,4.04, 2.56, 157.14, 634.28 and 0.95, respectively. For OS model after univariable analysis, the variables of sex, age, smoking, BMI, T stage, N stage, plasma EBV DNA, chemotherapy, WBC, ALP, LAR, NLR, PLR, SII, SIRI were entered into the multivariable Cox regression analysis. For PFS model after univariable analysis, the variables of sex, age, smoking, T stage, N stage, plasma EBV DNA, chemotherapy, WBC, ALP, LAR, NLR, PLR, SII, SIRI were entered into the multivariable Cox regression analysis (Table 2). Considering the strong correlation between LDH and LAR (Spearman’s rho = 0.893; P < 0.001), in order to avoid overfitting, we did not include LDH into the multivariate analysis. The multivariable analyses demonstrated that the OS of NPC was significantly correlated with sex (P=0.030), age (P < 0.001), T stage (P =0.035), N stage (P=0.039), plasma EBV.DNA (P < 0.001), WBC (P =0.014), PLR (P=0.030), and LAR (P =0.001). The multivariable analyses demonstrated that the PFS of NPC was significantly correlated with age (P < 0.001), T stage (P =0.020), N stage (P=0.016), plasma EBV.DNA (P < 0.001), WBC (P =0.015), PLR (P=0.038), and LAR (P=0.008) (Table 2).
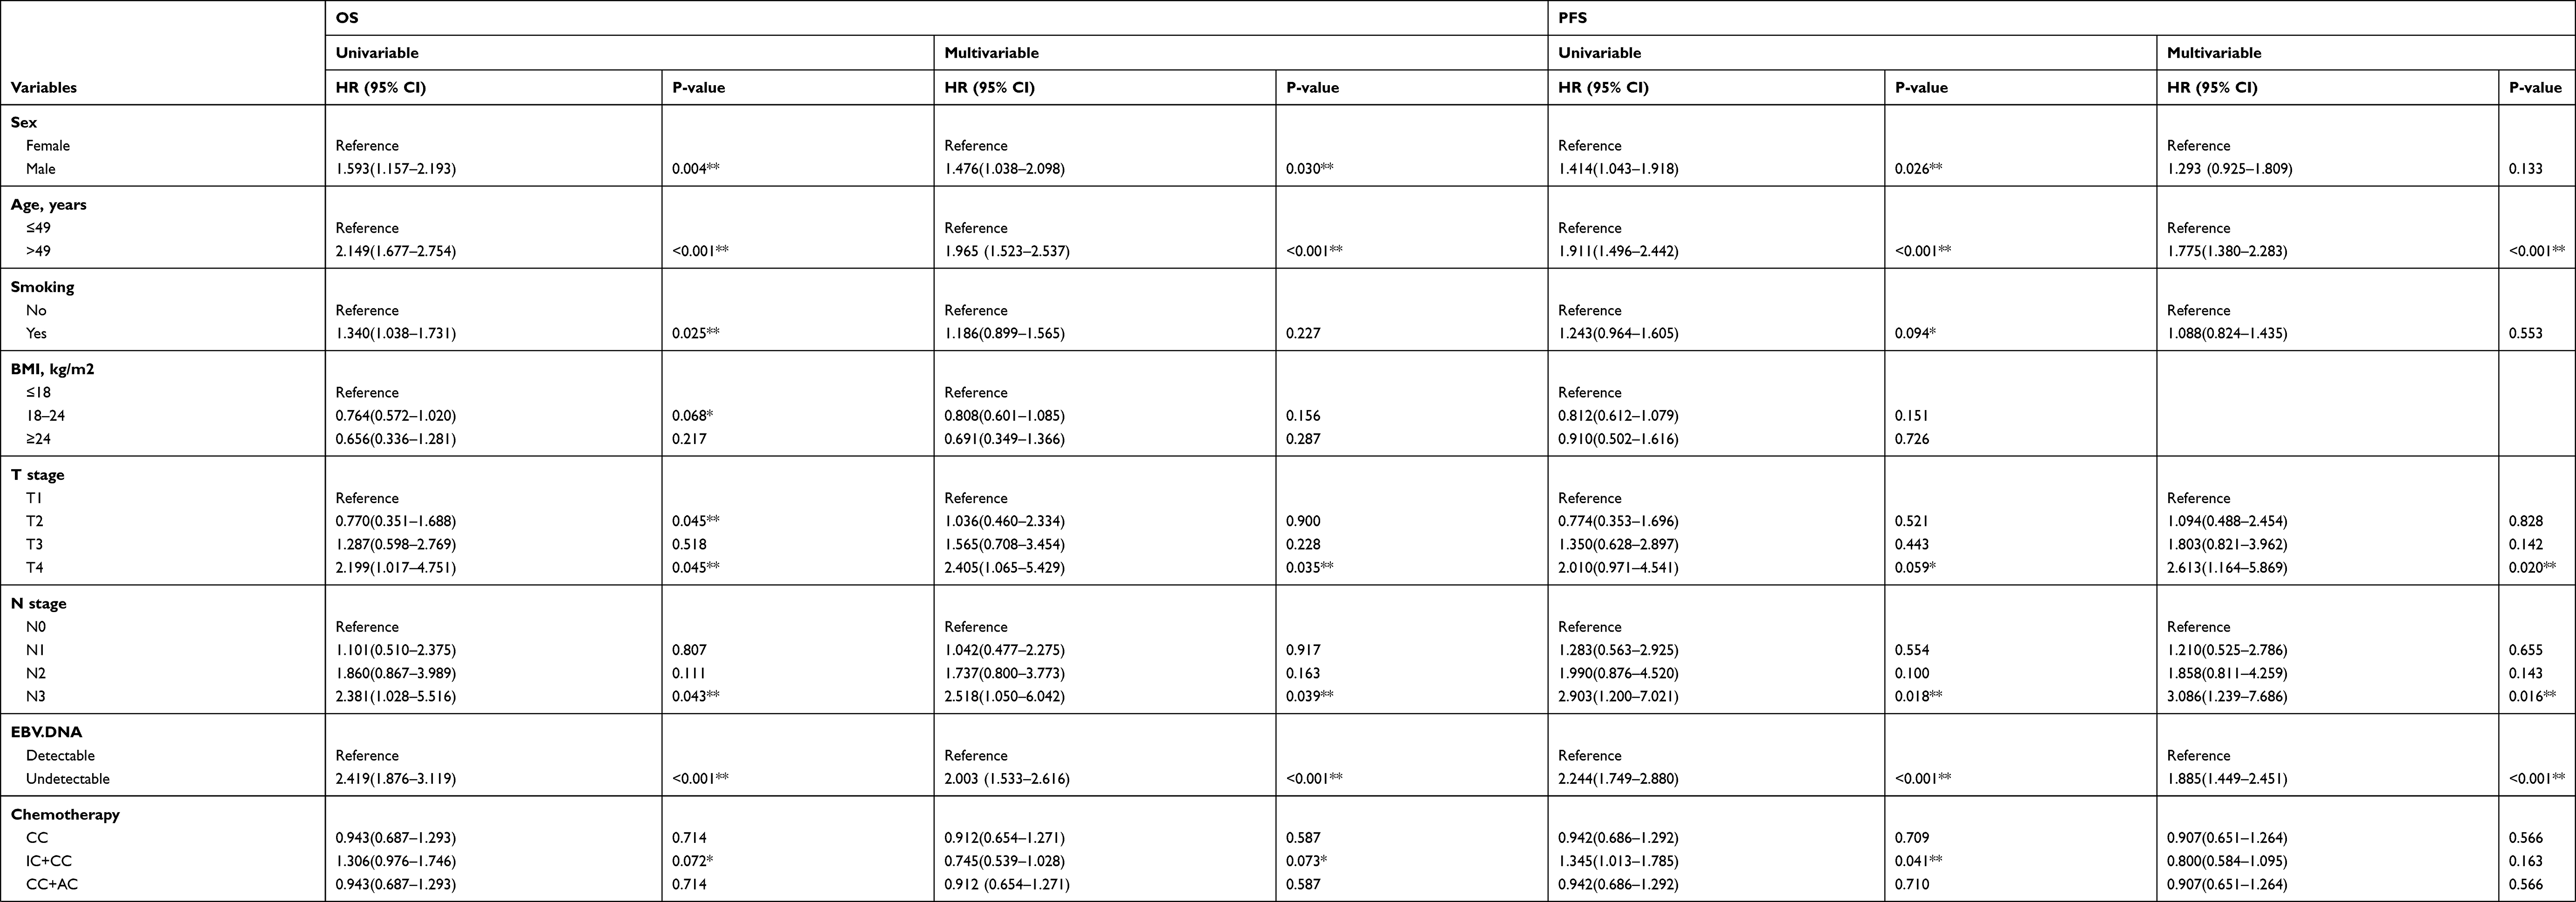 |
Table 2 Univariable and Multivariable Cox Regression Analysis in the Training Cohort |
Establishing and Validating Nomograms
From the multivariable Cox regression analysis results, age, sex, T stage, N stage, plasma EBV.DNA, WBC, PLR, and LAR were aggregated and used to build the OS nomogram, which also show that age, T stage, N stage, plasma EBV.DNA, WBC, PLR, and LAR were integrated and used to construct the PFS nomogram. Nomograms were established to predict the 3- and 5-year OS (Figure 1), PFS (Figure 2) in the training cohort. The value range of each variable is marked on the corresponding line segment. The length of the line segment reflects the contribution of the variable to the resulting event. The score includes individual scores, namely the Point in the figure, which represents the individual scores of each variable under different values; the total score, namely the Total Point, represents the total score of the sum of the corresponding individual scores after taking all the variables. According to the calculated total score, the corresponding survival probability of 3 or 5 years can be obtained.
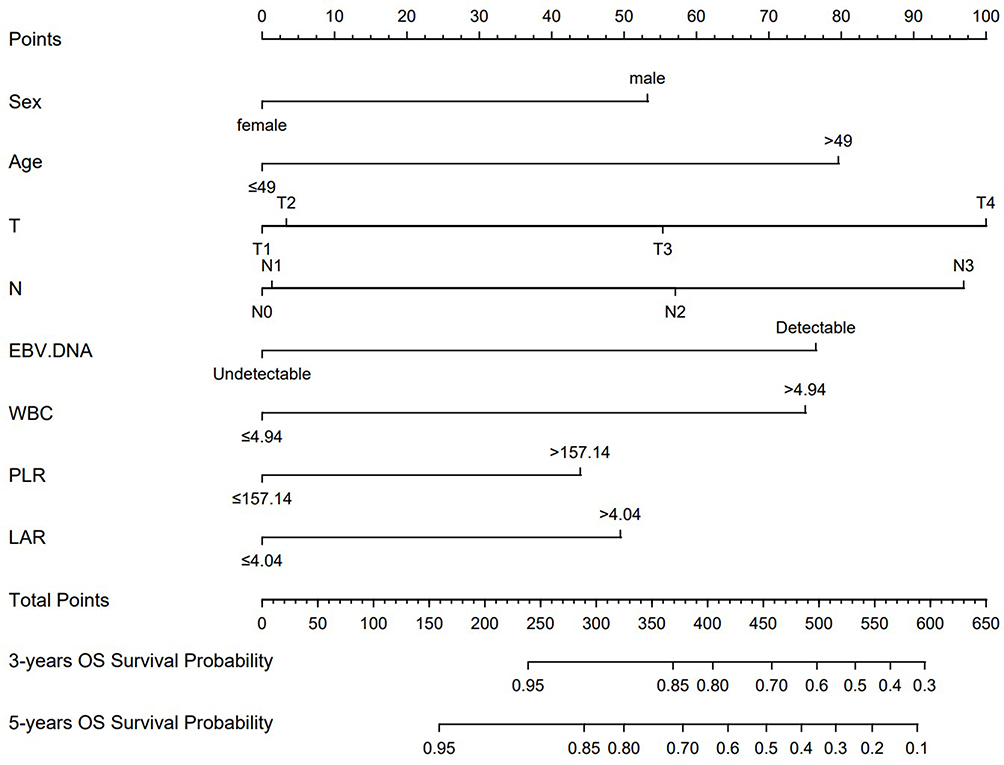 |
Figure 1 OS nomogram in the training cohort. Abbreviations: OS, overall survival; WBC, white blood cell; LAR, lactic dehydrogenase-to-albumin ratio; PLR, platelet-to-lymphocyte ratio. Notes: The line segment corresponding to each variable is marked with a scale, which represents the range of possible values of the variable and draws a vertical line upward to get the corresponding score. Add all the variables to get the total score and draw a vertical line downward to get the probability of survival of OS at 3 or 5 years. |
 |
Figure 2 PFS nomogram in the training cohort. Abbreviations: PFS, progression-free survival; WBC, white blood cell; LAR, lactic dehydrogenase-to-albumin ratio; PLR, platelet-to-lymphocyte ratio. Notes: The line segment corresponding to each variable is marked with a scale, which represents the range of possible values of the variable and draws a vertical line upward to get the corresponding score. Add all the variables to get the total score and draw a vertical line downward to get the probability of survival of PFS at 3 or 5 years. |
The discriminative ability of the models was evaluated applying the consistency index (C index). A C-index of 1 indicates complete agreement which is closer to 1, the better consistency reached between the model and the actual survival. In these nomograms model, the C-indexes for predicting OS is 0.722, PFS is 0.696 in the training cohort, and OS is 0.747, PFS is 0.690 in the validation cohort (Table 3). Both OS and PFS showed satisfactory model performance. TNM stage +LAR c-index (0.667) showed good performance in OS compared with TNM stage +LDH (0.659). In the calibration curve diagram, the abscissa represented the predicted survival rate, the ordinate represented the actual survival rate, and the diagonal represented the predicted probability was equal to the actual probability. The closer the nomogram curve is to the diagonal line, the more closely the predicted probability matches the actual probability. The calibration graphs for the probability of the 3-year and 5-year OS (Figure 3A, B, D and E) and the 3-year PFS (Figure 3C and F) basically agreed with the diagonal.
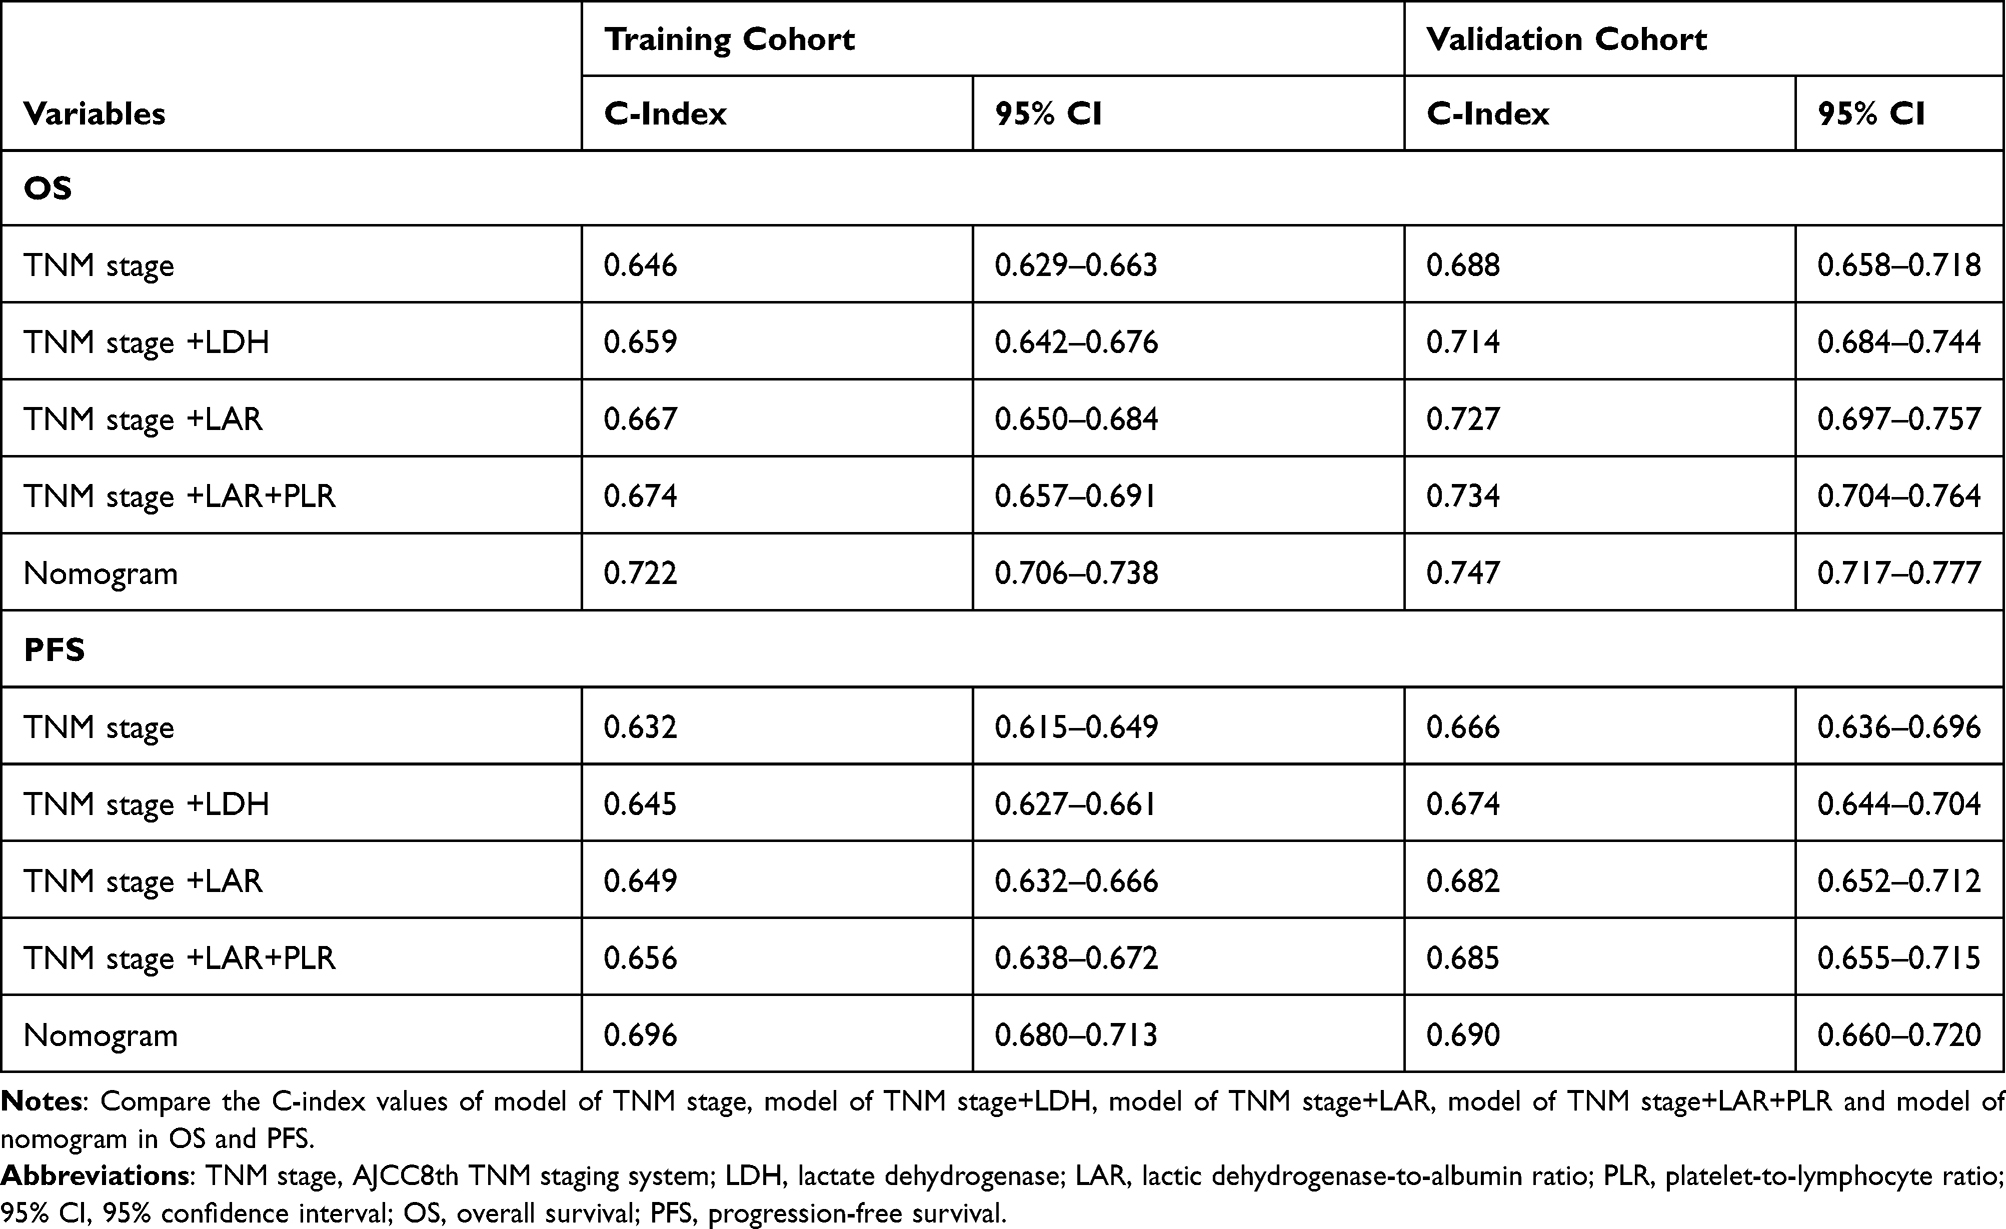 |
Table 3 Comparison of the C-Index of Different Models |
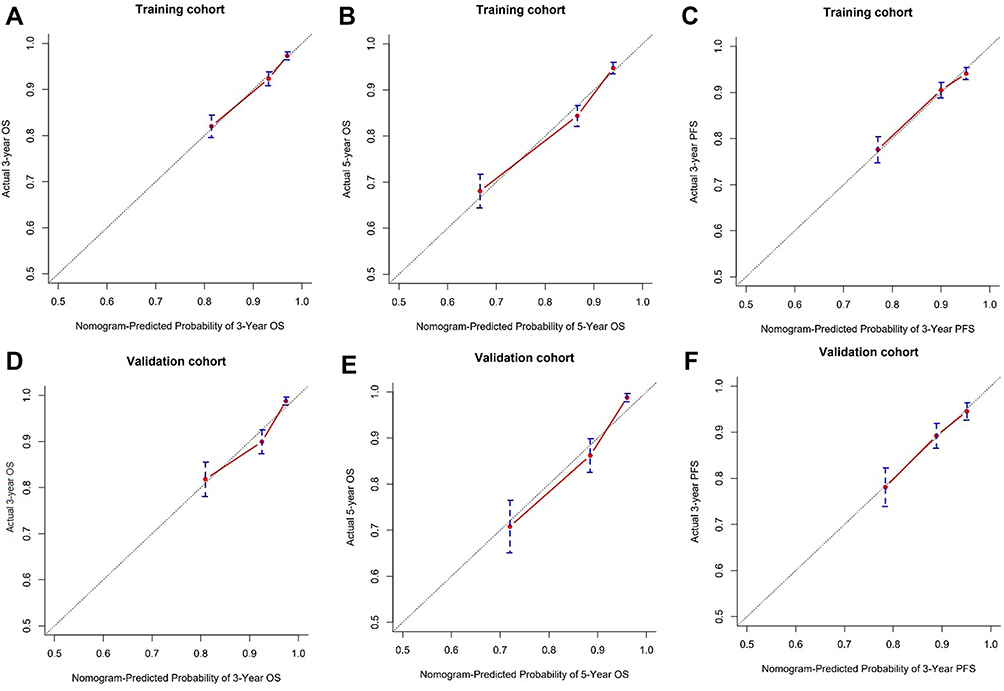 |
Figure 3 Calibration curve graphs for nomograms of OS and PFS. Abbreviations: OS, overall survival; PFS, progression-free survival. Notes: Calibration curve graphs to predict the 3- and 5-year OS of the nomogram in the training cohort (A and B) and validation cohort (D and E). And 3-year PFS of the nomogram in the training cohort and validation cohort (C and F). Nomogram-estimated OS (A, B, D and E) and PFS (C and F) were drawn on the abscissa; the observed OS and PFS were drawn on the ordinate. The predicted probability equals the actual probability expressed on the dotted line along the 45-degree line. |
ROC curve analysis was also used to evaluate the predictive ability of nomograms. In the ROC curve, the closer the curve to the upper left corner, the better forecast result reached. The score of the ROC curve depends on the area under the ROC curve (AUC), which we hope to be closer to 1 due to the accuracy of the prediction. The AUC of the nomograms for predicting the 3-year and 5-year OS attained 0.732 and 0.733 in the training cohort (Figure 4A and B), and reached 0.704 and 0.743 in the validation cohort (Figure 4D and E). The ROC curve of the 3-year PFS also showed strong predictive values in the training cohort and validation cohort (Figure 4C and F). The results of C-index, Calibration curve and ROC curve indicated that the nomograms for predicting OS and PFS could availability screen out NPC patients with relatively poor survival.
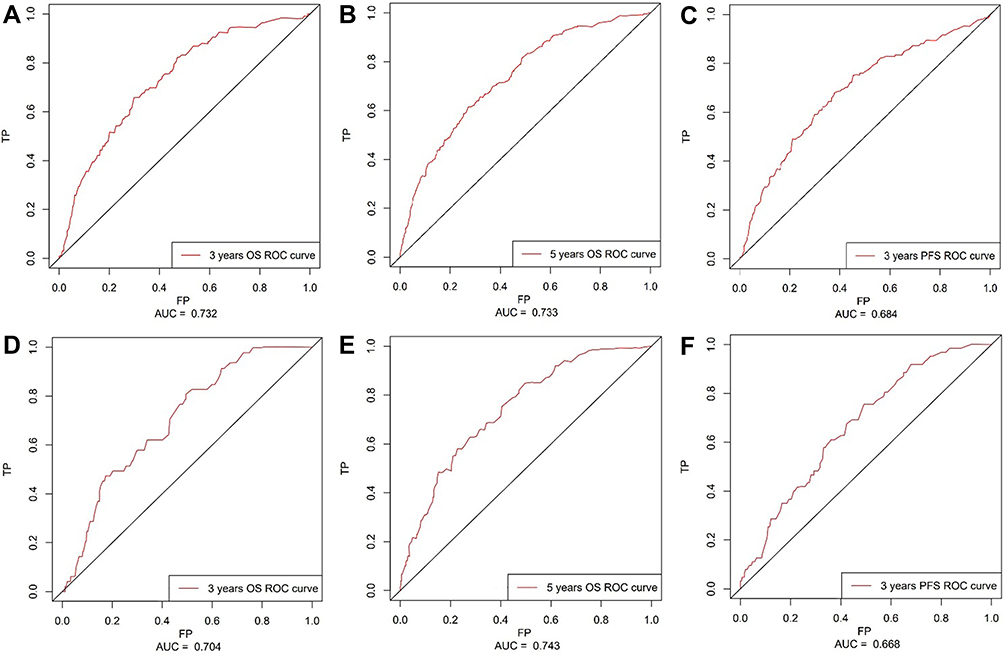 |
Figure 4 ROC curve for nomograms of OS and PFS. Abbreviations: ROC, receiver operating characteristic; FP, false positive; TP, true positive. Notes: ROC curve to predict the 3- and 5-year OS of the nomogram in the training cohort (A and B) and validation cohort (D and E). And 3-year PFS of the nomogram in the training cohort and validation cohort (C and F). Nomogram-estimated FP was drawn on the abscissa; the TP was drawn on the ordinate. The predicted probability equals the actual probability expressed on the dotted line along the 45-degree line. |
Nomogram for Risk Stratification and Comparison the Nomogram with Current Staging Systems
As a result, based on the total score calculated by the OS nomogram (358.7 points) and PFS nomogram (224.6 points), we established the risk stratification in the OS and PFS nomograms of the training and validation cohort, divided into low-risk and high-risk groups. According to the Kaplan–Meier graphs, patients with NPC in the high-risk group showed worse OS and PFS both in the training cohort (Figure 5A and C) and the validation cohort (Figure 6A and C) than those patients in the low-risk group. Meanwhile, the AJCC8th staging system used the same statistical method, and OS and PFS survival probability differed significantly (P-values <0.001) between stages both in the training cohort (Figure 5B and D) and in the validation cohort (Figure 6B and D). By calculating C-index, their predictive abilities were compared (Table 3). For OS survival probability, the nomogram C-index performance (0.722; 95% CI: 0.706–0.738) was exceeded than that of the current staging system (0.646; 95% CI: 0.629–0.663) in the training cohort, and the C-index of nomogram (0.747; 95% CI: 0.717–0.777) was also superior to the current staging system (0.688; 95% CI: 0.658–0.718) in the validation cohort. For PFS survival probability, the nomogram C-index performance (0.696; 95% CI: 0.680–0.713) was exceeded than that the current staging system (0.632; 95% CI: 0.615–0.649) in the training cohort, and the C-index of nomogram (C-index: 0.690; 95% CI: 0.660–0.720) was also superior to the current staging system (0.666; 95% CI: 0.636–0.696) in the validation cohort. Therefore, our nomograms demonstrated better predictive power of the OS and PFS for NPC patients.
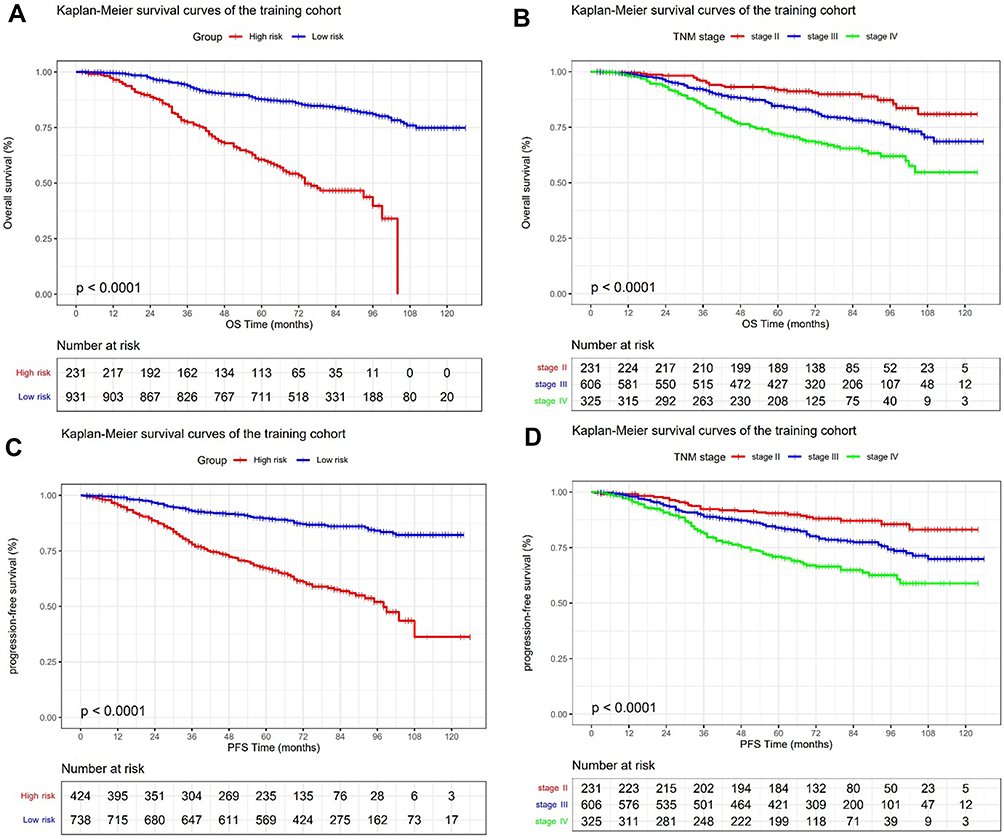 |
Figure 5 Kaplan-Meier survival curves of the training cohort. Abbreviations: OS, overall survival; PFS, progression-free survival. Notes: Kaplan–Meier survival curves for OS (A and B) and PFS (C and D) of the training cohort in different models. The nomogram is divided into high-risk group and low-risk group comparison (A and C); AJCC8th staging system is divided into stage II, stage III and stage IV comparison (B and D). |
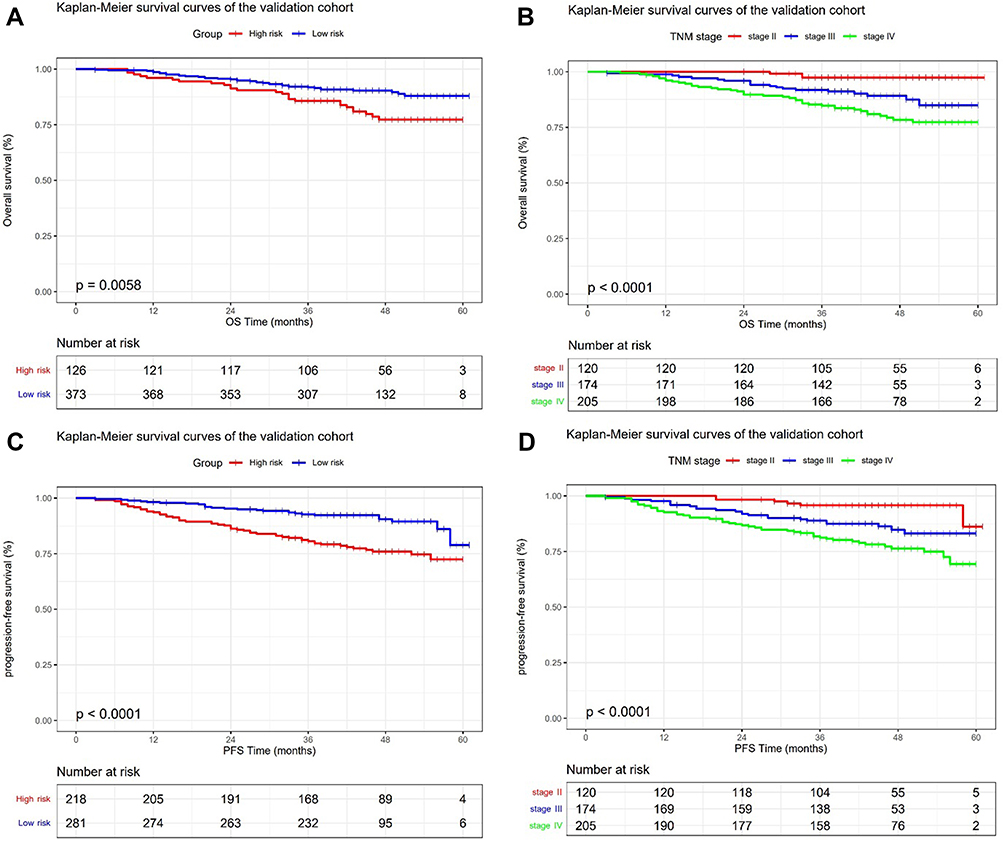 |
Figure 6 Kaplan-Meier survival curves of the validation cohort. Abbreviations: OS, overall survival; PFS, progression-free survival. Notes: Kaplan–Meier survival curves for OS (A and B) and PFS (C and D) of the validation cohort in different models. The nomogram is divided into high-risk group and low-risk group comparison (A and C); AJCC8th staging system is divided into stage II, stage III and stage IV comparison (B and D). |
Discussion
For patients with NPC of TNM II-IVA stage, concurrent chemoradiation combined with induction chemotherapy or adjuvant chemtherapy is currently the standard therapeutic regimen which NCCN recommended. However, the prognosis of different patients in the same TNM stage was heterogeneous, and recurrence and metastasis are still important reasons that affect NPC patients’ long-term survival rate.19 In our study, the OS of patients at 3 and 5 years with NPC in the training cohort was 85.0% and 70.9%, respectively; PFS was 81.8% and 69.2%, respectively. Therefore, for NPC patients, the risk stratification and early intervention for high-risk group will help improve the prognosis. The current staging of patients with NPC is primarily the eighth edition of AJCC, and plasma EBV DNA to be a useful biomarker of NPC has also been confirmed. Tang et al20 also demonstrated that compared with the current staging system, nomogram developed with EBV DNA showed higher predictive accuracy. However, TNM stage combined with plasma EBV DNA alone is still far from sufficient and lack of personalization to predict the prognosis. Inflammation index and nutrition index can also affect the prognosis. Therefore, we established a nomogram incorporated clinicopathologic factors, EBV DNA levels, WBC, PLR and LAR into the TNM staging system. The nomogram showed good prognostic performance, such as C index, calibration curve, ROC curve and internal cohort verification. There is a tendency for statistically significant differences in the validation cohort, which may be attributed to the follow-up time not long enough for these patients.
To the best of our knowledge, we have applied LAR in NPC for the first time and observed significant prognosis correlations. We can explain this as follows: First, LDH is a metal protein containing zinc ions. As one of the important enzyme lines of anaerobic glycolysis and gluconeogenesis (GNG), LDH catalyzes the reduction and oxidation reaction between propylene acid and L-lactic acid, and also catalyzes the associated α-ketone acid. It is widely distributed in the heart, liver, kidneys, skeletal muscles, etc. As a result, when cardiovascular, liver, and kidney disease occurs, serum LDH increases. In malignant tumors, LDH plays a key role in the Warburg effect.21 In the Warburg effect, even with enough oxygen and plenty of functional mitochondria, cancer cells will significantly increase glucose absorption and produce lactic acid. Secondly, cultured malignant cells or lymphocytes from patients with cancer are kind of different from healthy people, and they show obvious membrane damage, thereby increasing the permeability and leakage of intracellular enzymes, including LDH.22 Compared to all other enzymes, tumor cells make them ideal for clinical monitoring. In addition, ALB maintains the body’s nutrition and osmotic pressure as the most important protein in human plasma. In malignant tumors, low serum albumin levels are a sign of malnutrition and have been exploited to predict the survival rate for those cancer patients receiving chemotherapy or radiation therapy. Low levels of circulating albumin in cancer patients can be attributed to increased permeability leading to decreased synthesis and lateral leakage.23 As one of the common head and neck tumors, patients with NPC can show ALB reduction in serology due to mucosal toxic effects, dysphagia, and weight loss undergoing radiotherapy or chemoradiotherapy. LDH and ALB are easily monitored clinically and inexpensively. We combined LDH and ALB for the first time, and observed that the C index of the model of LAR (0.667) is better than the model of LDH (0.659), the effects of LAR may be higher than either LDH or ALB. Therefore, LAR may act as a new prognostic factor for nasopharyngeal carcinoma. In some other tumors, such as pancreatic cancer patients, LAR can also be observed as an independent indicator of prognosis.24 LAR is not only an indicator of inflammation but may also reflect nutritional status. This is expected to become a new prognostic factor that combines inflammation and nutritional status.25
It is well known that systemic inflammatory responses can predict the survival rate of patients with cancer because of their involvement in key steps in tumor formation.26 Experimental studies have shown that cancer interacts with inflammatory cells to promote the formation of new blood vessels, extracellular matrix remodeling and persistent inflammatory micro-environment promoted the metastasis. Inflammation can be evaluated by calculating the change of the parameters of different clinical blood test count (such as neutrophils, platelets, lymphocytes and mononucleosis cells), reflecting the dynamic balance between the anti-tumor function of the body’s immune system and the function of the tumor itself.27
The total white blood cell (WBC) count usually increases during infection, is one of the nonspecific signs of inflammation, and may be associated with some types of cancer.26 In addition, some novel inflammatory markers such as PLR, NLR, SII, and SIRI, are confirmed to be strong factors in some cancers. Jiang et al11 demonstrated that pretreatment PLR can help predict cancer-specific survival (CSS), OS, and distant metastasis-free survival (DMFS), independent of other established prognostic factors for NPC patients. As our research shows, inflammatory biomarkers (such as WBC and PLR) have great predictive power of survival for NPC patients receiving IMRT-based treatment. Nuclear factor-kB (NF-kB), transcription 3 (STAT3) signal sensors and activators, and hypoxia-inducing factor 1a (HIF1a) play a crucial part in the promotion of inflammation-related cancers in which elevated PLRs indicate activation of those transcription factors.28–30 These transcription factors coordinate to produce a large number of important cytokines that promote tumor growth, including TNF-a, IL-1β, and IL-6.31 This highlights the important role of inflammatory biomarkers in the control of clinical risks.
In summary, inflammation and nutrition are closely related to nasopharyngeal carcinoma and should be considered as an adjunct to TNM stage in the prognosis of NPC. Nomogram is widely used in cancer prognosis, mainly because one of its greatest advantages is the ability to quantify the predictive model of the integration of determinant variables as a numerical estimate of the probability of an event, which is tailored to the characteristics of a single patient.18 In addition, its practicality can be transformed into a network-friendly interface and easy to operate, and to maximize the transformation of complex regression equations into visual graphics, the results of the prediction model are more readable and convenient for patient evaluation. In view of the above advantages, we established nomograms that incorporate the clinical features of pre-treatment clinicopathologic factors, WBC, LAR, PLR, plasma EBV.DNA, and TNM stages to make the prognosis prediction of patients with nasopharyngeal cancer more accurate and allow clinicians to customize the individual treatment plan for the patients. Clinicians can consider whether need to take more aggressive treatments for patients in the high-risk group, such as adding targeted therapy or immunotherapy.
However, there are several limitations of this study. First, LAR is currently less relevant in research, and large-scale prospective cohort studies are needed in more patients with different cancer species to determine the broader independent predictive effects of LAR. Secondly, this nomogram is only verified internally, and a large number of multicenter external verification are still required. The third limitation is that the determination of EBV DNA in plasma has not yet reached a consensus and uniformity. The fourth limitation is that longer follow-up data needs to be established due to the relatively short follow-up time of the validation cohort.
Conclusion
Consequently, our study first demonstrated that LAR seems to be a promising indicator of survival outcomes in NPC. Nomogram based on LAR and PLR for predicting OS and PFS in NPC may serve as a clinically personalized tool to provide reliable prognostic information for the greatest survival benefits for NPC patients through layered management.
Acknowledgments
For improving the final version of the manuscript, we are grateful to the comments provided by reviewers and the editor, which were of great value.
Funding
This work was sponsored by grants from the National Natural Science Foundation of China (No. 81760544), Key R&D Program of Guangxi (AB18221007), Project of Guangxi Medical and Health Appropriate Technology Development and Extension Application (No. S2018001), Guangxi Natural Science Foundation (No. 2020GXNSFBA159002), the Health Commission of Guangxi Zhuang Autonomous Region (No. Z20200333). The funders had no role in study design, data collection and analysis, decision to publish, or preparation of the manuscript.
Disclosure
The authors report no conflicts of interest in this work.
References
1. Wee JT, Ha TC, Loong SL, Qian CN. Is nasopharyngeal cancer really a “Cantonese cancer”? Chin J Cancer. 2010;29(5):517–526. doi:10.5732/cjc.009.10329
2. Zhang MX, Li J, Shen GP, et al. Intensity-modulated radiotherapy prolongs the survival of patients with nasopharyngeal carcinoma compared with conventional two-dimensional radiotherapy: a 10-year experience with a large cohort and long follow-up. Eur J Cancer. 2015;51(17):2587–2595. doi:10.1016/j.ejca.2015.08.006
3. Chen YP, Chan ATC, Le QT, Blanchard P, Sun Y, Ma J. Nasopharyngeal carcinoma. Lancet. 2019;394(10192):64–80. doi:10.1016/S0140-6736(19)30956-0
4. Zhang Y, Chen L, Hu GQ, et al. Gemcitabine and cisplatin induction chemotherapy in nasopharyngeal carcinoma. N Engl J Med. 2019;381(12):1124–1135. doi:10.1056/NEJMoa1905287
5. You R, Liu YP, Huang PY, et al. Efficacy and safety of locoregional radiotherapy with chemotherapy vs chemotherapy alone in de novo metastatic nasopharyngeal carcinoma: a multicenter phase 3 randomized clinical trial. JAMA Oncol. 2020;6(9):1345–1352. doi:10.1001/jamaoncol.2020.1808
6. Hirahara N, Matsubara T, Fujii Y, et al. Comparison of the prognostic value of immunoinflammation-based biomarkers in patients with gastric cancer. Oncotarget. 2020;11(27):2625–2635. doi:10.18632/oncotarget.27653
7. Zeng X, Liu G, Pan Y, Li Y. Development and validation of immune inflammation-based index for predicting the clinical outcome in patients with nasopharyngeal carcinoma. J Cell Mol Med. 2020;24(15):8326–8349. doi:10.1111/jcmm.15097
8. Coussens LM, Werb Z. Inflammation and cancer. Nature. 2002;420(6917):860–867. doi:10.1038/nature01322
9. Gourzones C, Barjon C, Busson P. Host-tumor interactions in nasopharyngeal carcinomas. Semin Cancer Biol. 2012;22(2):127–136. doi:10.1016/j.semcancer.2012.01.002
10. Chan KCA, Woo JKS, King A, et al. Analysis of plasma Epstein-Barr virus DNA to screen for nasopharyngeal cancer. N Engl J Med. 2017;377(6):513–522. doi:10.1056/NEJMoa1701717
11. Jiang R, Zou X, Hu W, et al. The elevated pretreatment platelet-to-lymphocyte ratio predicts poor outcome in nasopharyngeal carcinoma patients. Tumour Biol. 2015;36(10):7775–7787. doi:10.1007/s13277-015-3505-0
12. Xiong Y, Shi LL, Zhu LS, Ding Q, Ba L, Peng G. Prognostic efficacy of the combination of the pretreatment systemic immune-inflammation index and Epstein-Barr virus DNA status in locally advanced nasopharyngeal carcinoma patients. J Cancer. 2021;12(8):2275–2284. doi:10.7150/jca.52539
13. Jiang W, Chen Y, Huang J, et al. Systemic immune-inflammation index predicts the clinical outcome in patients with nasopharyngeal carcinoma: a propensity score-matched analysis. Oncotarget. 2017;8(39):66075–66086. doi:10.18632/oncotarget.19796
14. Chen Y, Jiang W, Xi D, et al. Development and validation of nomogram based on SIRI for predicting the clinical outcome in patients with nasopharyngeal carcinomas. J Investig Med. 2019;67(3):691–698. doi:10.1136/jim-2018-000801
15. Zhong H, Chen J, Cheng S, et al. Prognostic nomogram incorporating inflammatory cytokines for overall survival in patients with aggressive non-Hodgkin’s lymphoma. EBioMedicine. 2019;41:167–174. doi:10.1016/j.ebiom.2019.02.048
16. Zeng Q, Hong M-H, Shen L-J, et al. Nomograms for predicting long-term survival in patients with non-metastatic nasopharyngeal carcinoma in an endemic area. Oncotarget. 2016;7(20):29708–29719. doi:10.18632/oncotarget.8823
17. Wang X, Mao M, He Z, et al. Development and validation of a prognostic nomogram in AFP-negative hepatocellular carcinoma. Int J Biol Sci. 2019;15(1):221–228. doi:10.7150/ijbs.28720
18. Balachandran VP, Gonen M, Smith JJ, DeMatteo RP. Nomograms in oncology: more than meets the eye. Lancet Oncol. 2015;16(4):e173–180. doi:10.1016/S1470-2045(14)71116-7
19. Mao YP, Tang LL, Chen L, et al. Prognostic factors and failure patterns in non-metastatic nasopharyngeal carcinoma after intensity-modulated radiotherapy. Chin J Cancer. 2016;35(1):103. doi:10.1186/s40880-016-0167-2
20. Tang LQ, Li CF, Li J, et al. Establishment and validation of prognostic nomograms for endemic nasopharyngeal carcinoma. J Natl Cancer Inst. 2016;108(1):djv291. doi:10.1093/jnci/djv291
21. Liberti MV, Locasale JW. The Warburg effect: how does it benefit cancer cells? Trends Biochem Sci. 2016;41(3):211–218. doi:10.1016/j.tibs.2015.12.001
22. Jurisic V. Estimation of cell membrane alteration after drug treatment by LDH release. Blood. 2003;101(7):2894;author reply 2895. doi:10.1182/blood-2002-08-2397
23. Fleck A, Raines G, Hawker F, et al. Increased vascular permeability: a major cause of hypoalbuminaemia in disease and injury. Lancet. 1985;1(8432):781–784. doi:10.1016/S0140-6736(85)91447-3
24. Gao S, Wu M, Chen Y, et al. Lactic dehydrogenase to albumin ratio in prediction of unresectable pancreatic cancer with intervention chemotherapy. Future Oncol. 2018;14(14):1377–1386. doi:10.2217/fon-2017-0556
25. Feng JF, Wang L, Yang X, Jiang YH. Prognostic value of lactate dehydrogenase to albumin ratio (LAR) in patients with resectable esophageal squamous cell carcinoma. Cancer Manag Res. 2019;11:7243–7251. doi:10.2147/CMAR.S208320
26. Hussain SP, Harris CC. Inflammation and cancer: an ancient link with novel potentials. Int J Cancer. 2007;121(11):2373–2380. doi:10.1002/ijc.23173
27. Riesco A. Five-year cancer cure: relation to total amount of peripheral lymphocytes and neutrophils. Cancer. 1970;25(1):135–140. doi:10.1002/1097-0142(197001)25:1<135::AID-CNCR2820250120>3.0.CO;2-9
28. Pikarsky E, Porat RM, Stein I, et al. NF-kappaB functions as a tumour promoter in inflammation-associated cancer. Nature. 2004;431(7007):461–466. doi:10.1038/nature02924
29. Wang Y, Shen Y, Wang S, Shen Q, Zhou X. The role of STAT3 in leading the crosstalk between human cancers and the immune system. Cancer Lett. 2018;415:117–128. doi:10.1016/j.canlet.2017.12.003
30. Mizukami Y, Jo WS, Duerr EM, et al. Induction of interleukin-8 preserves the angiogenic response in HIF-1alpha-deficient colon cancer cells. Nat Med. 2005;11(9):992–997. doi:10.1038/nm1294
31. Li B, Zhou P, Liu Y, et al. Platelet-to-lymphocyte ratio in advanced cancer: review and meta-analysis. Clin Chim Acta. 2018;483:48–56. doi:10.1016/j.cca.2018.04.023
 © 2021 The Author(s). This work is published and licensed by Dove Medical Press Limited. The full terms of this license are available at https://www.dovepress.com/terms.php and incorporate the Creative Commons Attribution - Non Commercial (unported, v3.0) License.
By accessing the work you hereby accept the Terms. Non-commercial uses of the work are permitted without any further permission from Dove Medical Press Limited, provided the work is properly attributed. For permission for commercial use of this work, please see paragraphs 4.2 and 5 of our Terms.
© 2021 The Author(s). This work is published and licensed by Dove Medical Press Limited. The full terms of this license are available at https://www.dovepress.com/terms.php and incorporate the Creative Commons Attribution - Non Commercial (unported, v3.0) License.
By accessing the work you hereby accept the Terms. Non-commercial uses of the work are permitted without any further permission from Dove Medical Press Limited, provided the work is properly attributed. For permission for commercial use of this work, please see paragraphs 4.2 and 5 of our Terms.