")
Back to Journals » Journal of Hepatocellular Carcinoma » Volume 11
Multiple Machine-Learning Fusion Model Based on Gd-EOB-DTPA-Enhanced MRI and Aminotransferase-to-Platelet Ratio and Gamma-Glutamyl Transferase-to-Platelet Ratio to Predict Microvascular Invasion in Solitary Hepatocellular Carcinoma: A Multicenter Study
Authors Wang F, Yan CY, Qin Y, Wang ZM, Liu D, He Y, Yang M, Wen L, Zhang D
Received 5 December 2023
Accepted for publication 20 February 2024
Published 29 February 2024 Volume 2024:11 Pages 427—442
DOI https://doi.org/10.2147/JHC.S449737
Checked for plagiarism Yes
Review by Single anonymous peer review
Peer reviewer comments 3
Editor who approved publication: Dr Manal Hassan
Fei Wang,1,2 Chun Yue Yan,3 Yuan Qin,4 Zheng Ming Wang,1 Dan Liu,1 Ying He,1 Ming Yang,2 Li Wen,1 Dong Zhang1
1Department of Radiology, XinQiao Hospital of Army Medical University, Chongqing, 400037, People’s Republic of China; 2Department of Medical Imaging, Luzhou People’s Hospital, Luzhou, 646000, People’s Republic of China; 3Department of Emergency Medicine, Luzhou People’s Hospital, Luzhou, 646000, People’s Republic of China; 4Department of Radiology, Chongqing University Three Gorges Hospital, Chongqing, 404031, People’s Republic of China
Correspondence: Dong Zhang, Department of Radiology, Xin Qiao Hospital, Army Medical University, Chongqing, 400037, People’s Republic of China, Tel +86-23-68774676, Email [email protected]
Background: Currently, it is still confused whether preoperative aminotransferase-to-platelet ratio (APRI) and gamma-glutamyl transferase-to-platelet ratio (GPR) can predict microvascular invasion (MVI) in solitary hepatocellular carcinoma (HCC). We aimed to develop and validate a machine-learning integration model for predicting MVI using APRI, GPR and gadoxetic acid disodium (Gd-EOB-DTPA) enhanced MRI.
Methods: A total of 314 patients from XinQiao Hospital of Army Medical University were divided chronologically into training set (n = 220) and internal validation set (n = 94), and recurrence-free survival was determined to follow up after surgery. Seventy-three patients from Chongqing University Three Gorges Hospital and Luzhou People’s Hospital served as external validation set. Overall, 387 patients with solitary HCC were analyzed as whole dataset set. Least absolute shrinkage and selection operator, tenfold cross-validation and multivariate logistic regression were used to gradually filter features. Six machine-learning models and an ensemble of the all models (ENS) were built. The area under the receiver operating characteristic curve (AUC) and decision curve analysis were used to evaluate model’s performance.
Results: APRI, GPR, HBPratio3 ([liver SI‒tumor SI]/liver SI), PLT, peritumoral enhancement, non-smooth margin and peritumoral hypointensity were independent risk factors for MVI. Six machine-learning models showed good performance for predicting MVI in training set (AUCs range, 0.793– 0.875), internal validation set (0.715– 0.832), external validation set (0.636– 0.746) and whole dataset set (0.756– 0.850). The ENS achieved the highest AUCs (0.879 vs 0.858 vs 0.839 vs 0.851) in four cohorts with excellent calibration and more net benefit. Subgroup analysis indicated that ENS obtained excellent AUCs (0.900 vs 0.809 vs 0.865 vs 0.908) in HCC > 5cm, ≤ 5cm, ≤ 3cm and ≤ 2cm cohorts. Kaplan‒Meier survival curves indicated that ENS achieved excellent stratification for MVI status.
Conclusion: The APRI and GPR may be new potential biomarkers for predicting MVI of HCC. The ENS achieved optimal performance for predicting MVI in different sizes HCC and may aid in the individualized selection of surgical procedures.
Keywords: hepatocellular carcinoma, microvascular invasion, inflammatory biomarker, magnetic resonance imaging, machine learning
Introduction
Currently, hepatocellular carcinoma (HCC) is the fifth most common malignant tumor and the third leading cause of cancer-related death in the world,1,2 with increasing morbidity and mortality.1,3 Most studies have shown that microvascular invasion (MVI) is the most direct predictive signal of intrahepatic micrometastasis and the most important source of tumor recurrence, and MVI has been recognized as an independent predictor of early recurrence and poor prognosis after liver resection or liver transplantation.4–7 It was worth noting that previous studies also did not recommend liver transplantation or radiofrequency ablation for MVI-positive HCC patients.8–11 To be more specific, anatomic hepatectomy or partial hepatectomy with a wide resection margin should be used to improve the prognosis for resectable or solitary small HCC with MVI-positive.12,13 However, the MVI has mainly been evaluated through postoperative histopathological analysis, which greatly limits the value of guidance for preoperative treatment decisions due to a certain time lag.14 Therefore, it is crucial to explore a potential noninvasive tool to predict MVI for individualized treatment decision and stratification management of HCC patients.
HCC is an inflammatory cancer.15 Inflammation is the basis for driving the interaction between biological behaviors such as the tumor microenvironment of liver cancer and host immune response, and plays an important role in the progression of HCC carcinogenesis.16,17 A few studies have shown that neutrophil–lymphocyte ratio18 and lymphocyte-to-monocyte ratio19 are closely related to MVI. The conclusions drawn between different studies are also inconsistent, and the best cutoff values are also different.18–20 In addition, some previous studies have suggested that aminotransferase-to-platelet ratio (APRI)21–23 and gamma-glutamyl transferase-to-platelet ratio (GPR)24–26 are independent risk factors for shorter survival and higher recurrence after HCC surgery. However, it is still uncertain whether preoperative APRI or GPR can predict MVI in solitary HCC, and there is no report on the relationship between APRI/GPR and MVI.
Recent studies have explored imaging features of gadoxetic acid disodium (Gd-EOB-DTPA) enhanced MRI to identify MVI, such as peritumoral enhancement and peritumoral hypointensity on hepatobiliary phase (HBP).27,28 However, the performance of a single imaging feature in predicting MVI still needs further improvement. Ueno A29 suggested that during the multi-step progression of HCC from atypical nodules to well-differentiated, moderately differentiated, and to poorly differentiated HCC, hepatocyte uptake of organic anion transport polypeptide 1B13 (OATP1B3) expression decreased gradually, which provided HCC with different low signal intensity in HBP. Moreover, MVI is more likely to occur of poorly differentiated HCC with higher malignancy.30 Therefore, further quantitative studies are needed to explore whether combining tumor signal intensity with imaging features can improve performance in predicting MVI.
Machine learning models such as Decision Tree (Tree), Random forest (RF), Support Vector Machine (SVM), Logistic regression (LR), eXtreme Gradient Boosting (Xgboost), K-nearest neighbor (Knn), have been widely used in cancer research. Compared with the traditional logistic regression model, the unique advantage of machine-learning model is the use of nonlinear functions and the consideration of possible interactions between all variables, avoiding certain confounding factors.31 To be more specific, the fusion and superposition application of multiple machine-learning models has been proved to improve the predictive performance of pathological complete response in breast cancer treated with neoadjuvant chemotherapy32 and pathological highly invasive lung cancer.33 However, to our knowledge, there is no study on the use of integrating APRI, GPR, Gd-EOB-DTPA-enhanced MRI features and multiple machine-learning to predict MVI in different sizes of solitary HCC.
Therefore, the purpose of this study is to explore whether preoperative APRI and GPR can add complementary value for predicting MVI of HCC and to develop and validate a multiple machine-learning integration model for predicting MVI in solitary HCC using APRI, GPR and Gd-EOB-DTPA-enhanced MRI.
Materials and Methods
Patients and Basic Data Collection
This retrospective study was approved by the Ethics Committee of XinQiao Hospital of the Army Medical University (No: 2023-047-01) and was in conformation with the ethical guidelines of the 2008 Declaration of Helsinki. The requirement for written informed consent was waived due to the retrospective nature of the study.
Patient workflow is shown in Figure 1. The inclusion criteria were as follows: (a) Patients with solitary HCC were confirmed after hepatectomy; (b) MVI was evaluated in consensus by two experienced abdominal pathologists and classified as positive and negative; (c) Gd-EOB-DTPA-enhanced MRI examination within one month before surgery; and (d) Complete blood routine, biochemical, and tumor marker examination within two weeks before surgery. The exclusion criteria included (a) previous history of any preoperative anticancer treatments and macro-vascular invasion in MRI; (b) trauma, fever or acute infection within two weeks before surgery; (c) history of any other concurrent malignancies; and (d) accompanying autoimmune diseases.
 |
Figure 1 Workflow and design of the study. |
A total of 314 patients from XinQiao Hospital of Army Medical University were divided chronologically into training set and internal validation set at a 7:3 ratio. Seventy-three patients from Chongqing University Three Gorges Hospital and Luzhou People’s Hospital served as external validation set. Finally, a total of 387 patients with solitary HCC (332 males and 55 females; mean age, 53.9 ± 10.6 years) from three independent centers were analyzed as the whole dataset set. All patients basic data were recorded, including age, gender, lymphocyte count (Lym), platelet count (PLT), alanine aminotransferase (ALT), aspartate aminotransferase (AST), gamma-glutamyl transferase (GGT), etc. The best cutoff values (the Youden index [sensitivity+specificity-1]) were determined by the receiver operating characteristic curve (ROC).18,20,34,35 The detailed definitions of derivative biomarkers are summarized in Supplementary Table 1.
MR Imaging and Analysis
All patients underwent Gd-EOB-DTPA-enhanced MRI using a 1.5T (n = 287) or 3.0T (n = 27) MR scanner (Signa HDxt, GE Healthcare) from XinQiao Hospital of Army Medical University and a 3.0T MR scanner from Chongqing University Three Gorges Hospital (Magnetom Verio, Siemens Healthcare; n = 51) and Luzhou People’s Hospital (Magnetom skyra, Siemens Healthcare; n = 22). The imaging sequences included axial T1-weighted imaging, T2-weighted imaging, T1-weighted imaging multiphase enhancement. The arterial phase (20–35 s), portal venous phase (60–70 s), delayed phase (180 s) and hepatobiliary phase (HBP, 20 min) were scanned after contrast injection. The scanning protocols are detailed in Supplementary Table 2.
Two abdominal radiologists (F.W. and Y.H., with 7 and 5 years of MR experience) blinded to the MVI of the HCC patients. Qualitative features included peritumoral enhancement, non-smooth margins, radiologic capsule, and peritumoral hypointensity in HBP.28,35 Quantitative features included tumor size and signal intensity (SI) ratio of HBPsir, HBPsie, HBPratio1, HBPratio2, HBPratio3, and HBPratio4 (Supplementary Table 1). Besides, regions of interests (ROIs, mean area 100 mm2) were applied to measure the normal liver, tumor and right spinal muscle SI for three times on the tumor largest level of the axial HBP and took the average value and tried to avoid the vascular, cystic and necrotic areas.36 The typical examples are shown in Figure 2.
 |
Figure 2 Qualitative and quantitative features of HCC. Peritumoral enhancement (a); radiologic capsule ((b) complete, (c) incomplete); non-smooth margins on HBP (d); smooth margins on HBP (e); quantitative measurement in HBP (f): ROIs (mean area 100 mm2) were applied to measure the tumor signal intensity (SI), normal liver SI and right spinal muscle SI for three times on the tumors largest level of the axial HBP; peritumoral hypointensity in HBP (g). Abbreviations: HBP, hepatobiliary phases; HCC, hepatocellular carcinoma; SI, signal intensity; ROI, regions of interest. |
Feature Screening and Model Development
All processes were performed on the R 4.1 platform (http://www.r-project.org/; R Foundation for Statistical Computing, Vienna, Austria). In the training set, feature selection was performed with tenfold cross-validation, least absolute shrinkage and selection operator (LASSO) and stepwise forward multivariate logistic regression, and feature selection and standardization were performed based on the training set and applied to the validation sets. Firstly, tenfold cross validation and LASSO regression were used to screen baseline features, retaining features with non-zero coefficients based on penalty coefficients and optimal Lambda. Besides, the remaining features were selected for further analysis through stepwise forward multivariate logistic regression, and important features with P<0.05 were retained for model construction.
The R package was used to establish the classifiers. This package provided a comprehensive and good interface to access many machine learning algorithms in R, which included “mlr3”, “glm”, “rms”, “glmnet”, “caret”, “kNN”, “e1071”, and “randomForest”. We used 10-fold cross-validation to evaluate the classifier. Ultimately, six machine-learning models of RF, Tree, LR, SVM, Xgboost and Knn were developed on the training set and verified in three validation sets. We also established the ensemble model (ENS), which carried out a simple logistic regression on the prediction probabilities of all models. The area under the curve (AUC), accuracy, precision, recall, and a Brier score were used to assess the model’s performances. The calibration curve and decision curve analysis (DCA) were used to evaluate the calibration capability and net benefit. Subgroup analyses were used to verify the stability and generalization ability of the model.
Follow-Up Plan
The follow-up will be conducted once in the first month, then once in 3 months, and then once every 6 months or once a year after one year. Tumor recurrence was defined as intrahepatic or extrahepatic recurrence detected by CT or MRI or confirmed by pathology. The 314 patients from XinQiao Hospital of Army Medical University were followed up to the date of recurrence or last review, with a deadline of March 1, 2023. Recurrence-free survival (RFS) was defined as the time interval from the date of surgery to the date of recurrence or the last follow-up visit.
Statistical Analysis
The intraclass correlation coefficients (ICCs) were calculated by a two-way random effect model with absolute agreement to evaluate the agreement for the two radiologists. Bland‒Altman plots was used to examine bias and limits of agreement.37 The ICC was classified into moderate (0.5 ≤ ICC < 0.75), good (0.75 ≤ ICC < 0.9) and excellent (ICC ≥ 0.9).38 Statistical analyses were performed using R software (version 4.1) and MedCalc (version 15.2). Two-tailed P < 0.05 was considered indicative of a statistically significant difference.
Results
Patient Baseline Characteristics
Between January 2015 and December 2022, 314 patients from XinQiao Hospital of Army Medical University were divided chronologically into training set (n = 220) and internal validation set (n = 94) at a 7:3 ratio. In addition, 73 patients from Chongqing University Three Gorges Hospital (n = 51) and Luzhou People’s Hospital (n = 22) served as external validation set from June 2018 to February 2023. Overall, 387 patients were analyzed as whole dataset set. The definitions and best cutoff values of derivative biomarkers and MR quantitative features are summarized in Table 1. The baseline characteristics are summarized in Table 2.
 |
Table 1 The Definitions and Best Cutoff Values of Derivative Biomarkers and MR Quantitative Features for Predicting MVI in Solitary HCC |
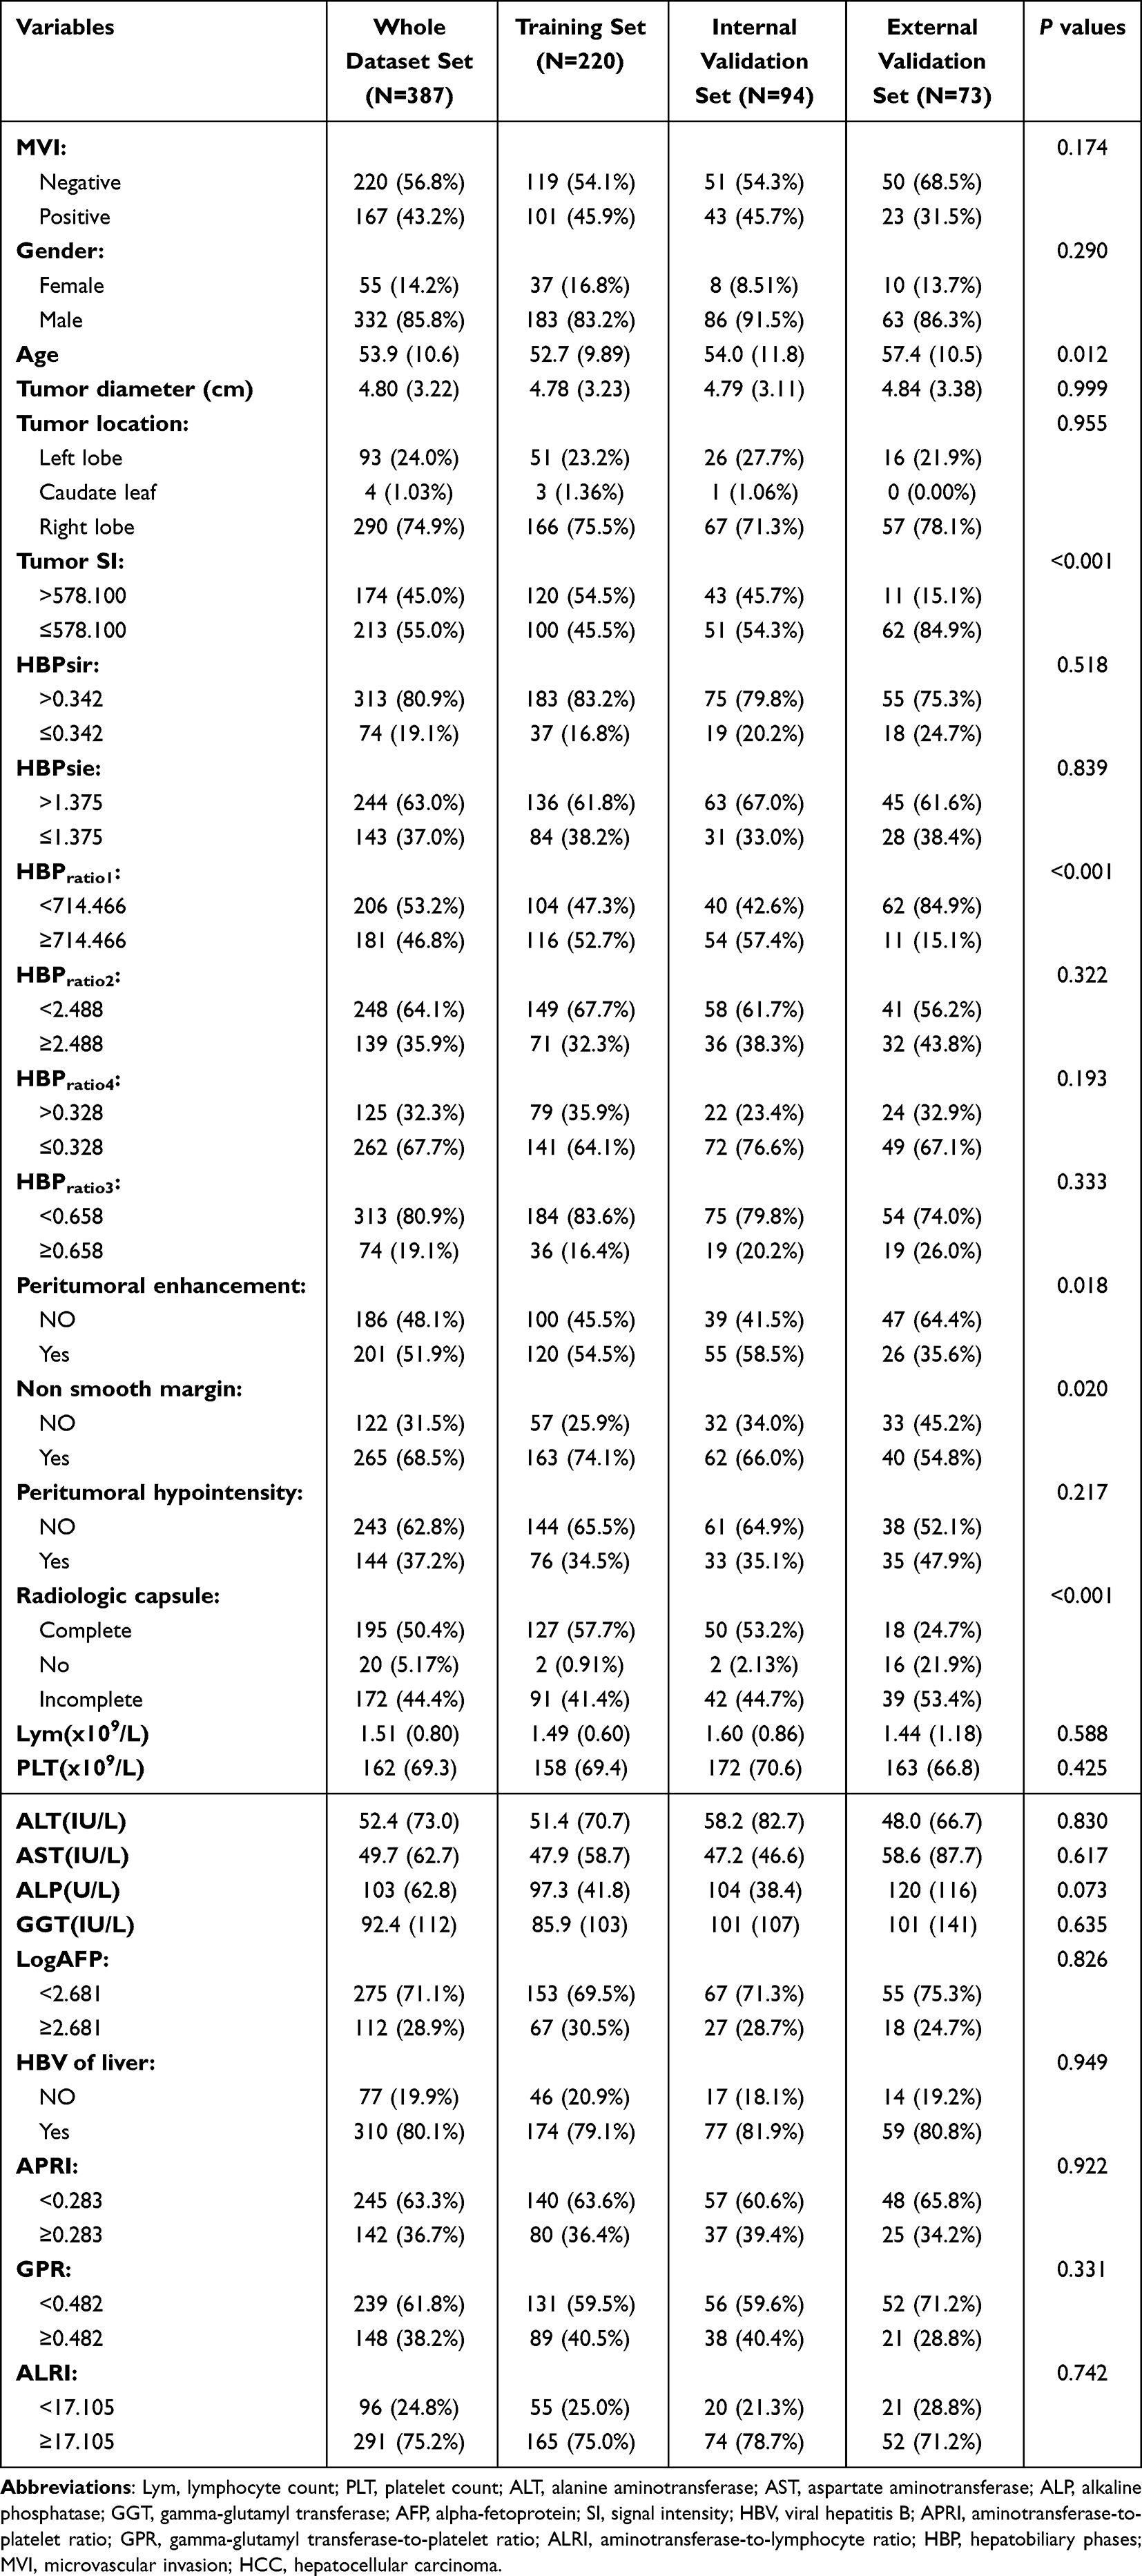 |
Table 2 The Baseline Characteristics of the HCC Patients in Different Cohorts |
ICC Analysis and Features Selection
The ICC analysis indicated that two radiologists had a good agreement for quantitative and qualitative features (ICCs range: 0.7924–0.9925; Supplementary Table 3). Bland‒Altman plots also suggested that there was good agreement on the quantitative parameters measured by the two radiologists (Supplementary Figure 1).
Eleven features were selected from 26 baseline characteristics through tenfold cross validation and LASSO regression (Figure 3A and B; Supplementary Table 4). Finally, seven most important features were selected through stepwise forward multivariate logistic regression based on the eleven features (Table 3). The results showed that APRI ≥ 0.283 (Odds Ratio [OR]=3.912; P=0.0105), GPR ≥ 0.482 (OR = 0.267; P = 0.0068), PLT (OR = 0.990; P = 0.0076), HBPratio3 ≥ 0.658 (OR = 3.745; P = 0.0181), peritumoral enhancement (OR = 4.353; P = 0.0003), Non-smooth margin (OR = 5.864; P = 0.0016) and peritumoral hypointensity (OR = 15.109; P < 0.0001) were independent risk factors for the MVI. Heatmaps of correlation coefficients for seven important features showed that the correlation coefficients were less than 0.55, which suggested no covariance between these features (Figure 3C). Sort the importance of Shapley values for seven important parameters is shown in Figure 3D.
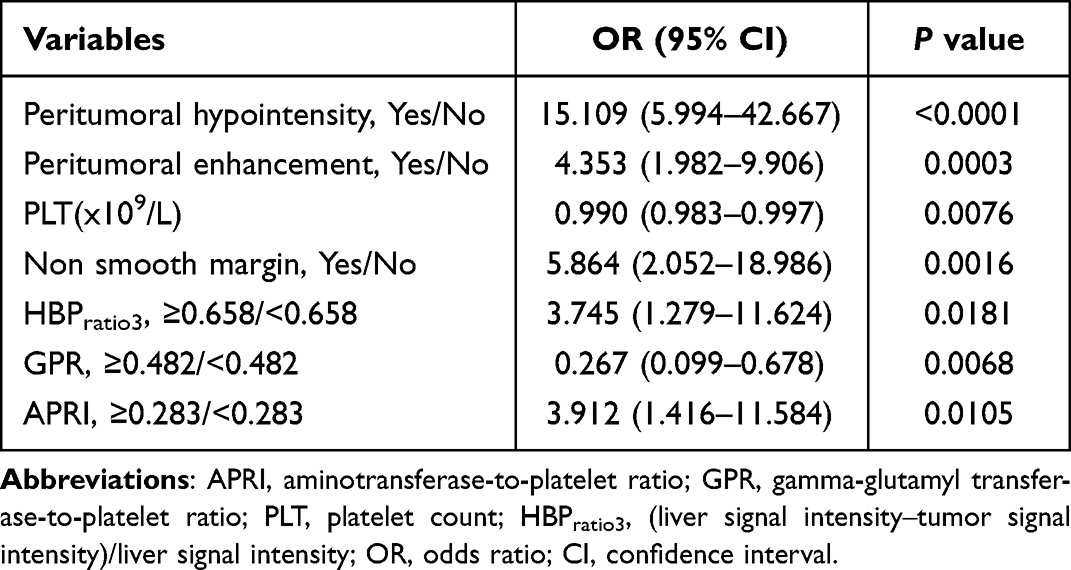 |
Table 3 Seven Most Important Features Were Selected Through Stepwise Forward Multivariate Logistic Regression |
 |
Figure 3 Feature selection path plots of tenfold cross-validation (A) and LASSO regression (B). The dotted vertical line represents the log (Lambda) value (Lambda=0.02257) corresponding to the number of variables of the minimum binomial deviation, where eleven features were included. Heatmaps of correlation coefficients for seven important features (C). Sort the importance of Shapley values for seven important parameters (D). Abbreviations: APRI, aminotransferase-to-platelet ratio; GPR, gamma-glutamyl transferase-to-platelet ratio; PLT, platelet count; HBPratio3, (liver signal intensity‒tumor signal intensity)/liver signal intensity. |
Model Building and Evaluation
Six machine-learning models were developed based on the seven important features, and the ROC curves are summarized in Figure 4A–D. The ENS showed the highest AUCs (0.879 vs 0.858 vs 0.839 vs 0.851; Figure 5A–D), the smallest Brier scores (0.139 vs 0.143 vs 0.121 vs 0.153) and a better recalls (0.832 vs 0.882 vs 0.940 vs 0.841) in four cohorts (Table 4). Importantly, the ENS had significantly better performance in predicting MVI than the other four machine learning models (P<0.05), except for the RF and LR model. The calibration curves showed that the predicted probability by ENS closely matched the actual probability with histopathological confirmation results for MVI in four cohorts (Figure 5E–H). The DCA suggested that using the ENS to predict the MVI would add more benefit than treating either all or no patients in four cohorts (Figure 5I–L). To be more specific, the DCA indicated that ENS obtained more net benefits to predict MVI than the other six machine-learning models (Figure 6).
 |
Table 4 Comparison of the Prediction Performance of Multiple Machine-Learning Models for Predicting MVI in Solitary HCC |
 |
Figure 4 Comparison of the ROC curves of the six machine-learning models for predicting MVI in training set (A), internal validation set (B), external validation set (C) and whole dataset set (D). Abbreviations: ROC, the receiver operating characteristic curve; MVI, microvascular invasion. |
 |
Figure 5 ROC curves of the ENS model for predicting MVI in training set (A), internal validation set (B), external validation set (C) and whole dataset set (D). The calibration curves of ENS in training set (E), internal validation set (F), external validation set (G) and whole dataset set (H). Decision curve analysis of ENS in training set (I), internal validation set (J), external validation set (K) and whole dataset set (L). Abbreviations: ROC, the receiver operating characteristic curve; MVI, microvascular invasion; ENS, the ensemble model. |
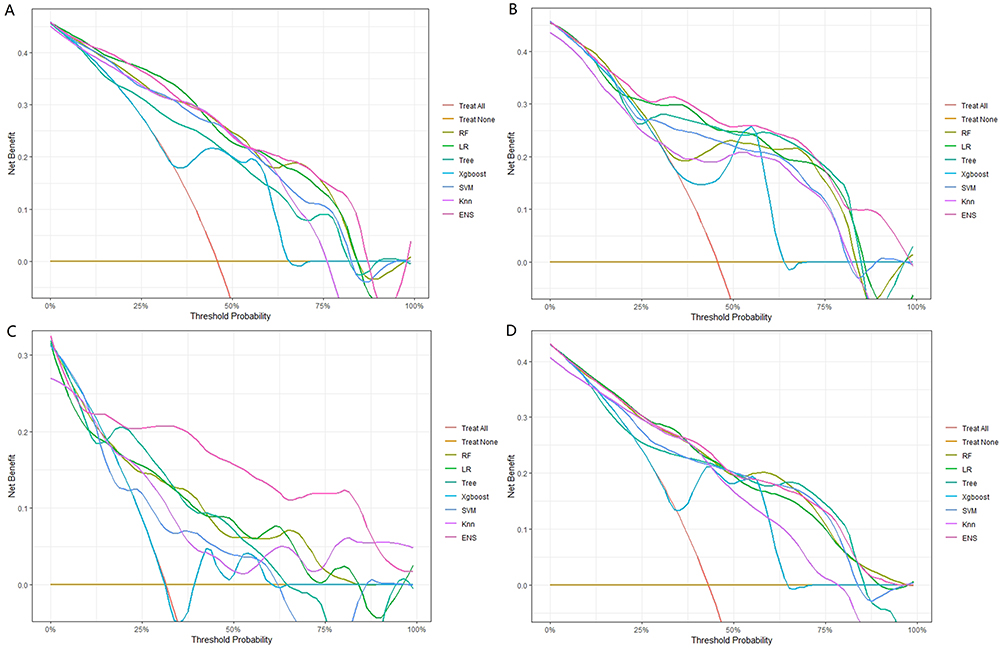 |
Figure 6 Comparison of the clinical net benefit of the seven models for predicting MVI in training set (A), internal validation set (B), external validation set (C) and whole dataset set (D). Abbreviations: RF, Random forest; LR, Logistic regression; Tree, Decision Tree; Xgboost, eXtreme Gradient Boosting; SVM, Support Vector Machine; Knn, K-nearest neighbor; ENS, the ensemble model; MVI, microvascular invasion. |
Subgroup Analysis
We investigated the performance of ENS for predicting MVI with different tumor diameters (>5cm, ≤5cm, ≤3cm, 2cm < tumor size ≤ 5cm, ≤2cm; Table 5) based on all patients. Overall, the ENS for predicting MVI of different sizes HCC (>5cm, ≤5cm, ≤3cm, ≤2cm) achieves excellent prediction performance (AUC range: 0.809–0.908), and obtains good calibration and clinical net benefit (Supplementary Figure 2A–H).
 |
Table 5 The ENS Model Diagnostic Performance for MVI of Different Sizes HCC |
To verify the accuracy of our ENS in different MRI scanners and magnetic field intensity. The subgroup analysis of gender (male vs female), magnetic field intensity (1.5T vs 3.0T) and MRI scanners (GE vs Siemens) is summarized in Supplementary Table 5. Importantly, the ENS had a better and stable performance in different subgroups.
Survival Analysis
Forty-two patients were lost to follow-up, and 272 HCC patients completed follow-up. There were 102 postoperative recurrences (37.5%), and the recurrence rates for one-, two-, and three-years were 24.6% (67/272), 32.7% (89/272), and 34.9% (95/272), respectively. The median RFS was 18.267 months in the MVI-positive patients and was 38.333 months in the MVI-negative patients, and patients were stratified into two risk groups (high risk vs low risk) using the optimal cutoff for the ENS prediction probability scores. Noticeably, the differences were statistically significant according to pathological results (Figure 7A) and ENS prediction results (Figure 7B). The ENS also achieved excellent stratification for MVI status of one-, two-, and three-years RFS (all P<0.001; Figure 7C–E).
 |
Figure 7 Kaplan–Meier survival curve plots according to pathological results (A) and ENS prediction results (B). The ENS model achieved excellent stratification for MVI high-risk status vs low-risk status of one- (C), two- (D), and three-years RFS (E). Abbreviations: ENS, the ensemble model; MVI, microvascular invasion; RFS, recurrence-free survival. |
Discussion
To our knowledge, this is the first study to use of integrating APRI, GPR, Gd-EOB-DTPA-enhanced MRI features and multiple machine-learning to predict MVI in solitary HCC. Six machine-learning models and ENS were developed in the study. Compared to the any one of the six machine-learning models, the ENS achieved the highest performance and smallest Brier score in four cohorts with an excellent calibration and more net benefit. Additionally, Kaplan‒Meier survival curves also indicated that ENS achieved excellent stratification for the MVI status. The best predictive performance was achieved for predicting MVI by combining APRI, GPR and Gd-EOB-DTPA-enhanced MRI features and ensemble multiple machine-learning models.
Inflammation is one of the most important features of cancer.39 Several previous studies have shown that APRI and GPR were independent risk factors for shorter OS and high recurrence after HCC surgery.21–26 Additionally, a recent meta-analysis (4706 HCCs) showed a significant correlation between preoperative GPR and postoperative prognosis in HCC patients, with higher GPR closely associated with poorer OS (HR: 1.79; P<0.001).26 However, MVI is the most direct predictive signal for early intrahepatic micrometastasis in HCC and the most important source of tumor recurrence or poor prognosis. Our study first indicates that APRI ≥ 0.283 and GPR ≥ 0.482 are independent predictors for MVI. The following factors may be the reasons. Firstly, HCC is often secondary to cirrhosis or liver disease. The mitochondria of liver cells are often damaged, which significantly increase the release of AST.40 Secondly, higher GGT levels were closely related to the multiple intrahepatic micrometastases and vascular invasion.41,42 Finally, platelets can produce a variety of growth factors and serotonin, which promote angiogenesis, cell proliferation, and cancer cell metastasis.43
Interestingly, our study found that the HBPratio3 ≥0.658 was an independent predictor for MVI. This may be related to the fact that the low expression of OATP1B3 is uptaken by hepatocytes with poor differentiation of HCC.29,44 Du et al30 also showed that the histological differentiation of HCC is strongly correlated with MVI, and MVI is more likely to occur in HCC patients with poor differentiation. Peritumoral enhancement, peritumoral hypointensity and non-smooth margin were independent predictors for MVI. Firstly, peritumoral enhancement may be due to branch blockage caused by tumor invasion of surrounding small blood vessels, resulting in compensatory perfusion of surrounding proliferative local blood vessels and the formation of peritumoral enhancement.45 Secondly, peritumoral hypointensity may be mainly due to microvascular invasion, which leads to a decrease in blood flow around the tumor and results in a decrease in the ability of liver cells to uptake Gd-EOB-DTPA and peritumoral hypointensity on HBP.36 Finally, MVI-positive HCC has an aggressive tendency to invade the tumor envelope and protrude into non-cancerous parenchyma, which results in a higher frequency of non-smooth margin.28,46
Significantly, the ENS that integrated inflammation information, Gd-EOB-DTPA-enhanced MRI features and multiple machine-learning, achieved the excellent and stable prediction performance for MVI in four cohorts. Compared to any one of the six machine-learning models, the ENS showed the highest predictive performance. Xu et al18 showed a nomogram that the AUC for predicting MVI based on six features was 0.868 (n = 156 HCCs, single center), without validation data and external validation. Similarly, the AUC of another nomogram was 0.839 (n = 627 HCCs, single center), lacking calibration, validation data and external validation.19 Furthermore, Gu et al20 developed a model for predicting MVI based on seven features without external validation (n = 658 HCCs, single center), and the AUCs in training and validation set were 0.788 and 0.735, respectively. Meanwhile, Tang et al45 also developed a nomogram (n = 273 patients, single center), with an AUC of 0.754 in training set and an AUC of 0.746 in validation set. Despite the performance of the above models was good, however, it lacks multiple validation cohorts and calibration and not combines multiple machine learning. Importantly, our ENS obtained more clinical net benefits over a wide range of threshold values, and survival analysis confirmed that ENS achieved excellent stratification for the MVI high-risk status vs low-risk status. Thus, if the precise predictions of preoperative pathological MVI can be provided for each HCC patient, it may be useful for a more detailed consideration of treatment strategies.
Several previous studies have shown that MVI is an independent factor with poor prognosis for progression-free survival and overall survival in patients with HCC ≤3cm.30,47,48 Giuliante et al48 reported a 37% incidence of MVI in small HCC with a diameter of ≤3cm, and two studies indicated even in HCC of 2cm or less, the incidence of MVI could reach 15–28%.49,50 Similarly, a 28.2% and 25.0% incidence of MVI was found in small HCCs with a diameter of ≤3cm and ≤2cm in our study. Interestingly, our ENS achieved excellent performance (AUC: 0.865; recall: 0.916) for MVI with a diameter of ≤3cm HCC. Okamura et al36 showed that the AUC of prediction for MVI by ADC value was 0.772 in HCC ≤3cm, which was less accurate than our ENS model. Moreover, for HCC with a diameter of ≤2cm, Xu et al51 suggested that an AUC of prediction for MVI was 0.711 based on ADC value; however, our ENS achieved more excellent performance for MVI (AUC: 0.908; recall: 0.922). Overall, the ENS for predicting MVI of different sizes HCC (>5cm, ≤5cm, ≤3cm, ≤2cm) achieves excellent prediction performance, and obtains good calibration and clinical net benefit.
However, several limitations associated with this study warrant mention. Firstly, our research is a retrospective study. Secondly, the patients who did not undergo Gd-EOB-DTPA-enhanced MRI or surgery were not included, and there may be a certain selection bias. Thirdly, our sample size is not yet large enough in our cohorts with HCC ≤ 2cm and HCC ≤ 3cm, and further validation is required using larger sample data from more centers. Finally, although our model has been verified in the different cohorts, it may still lack large-scale external verification of multiple regions and multiple ethnic groups, which will also be our future research direction.
Conclusion
In conclusion, the APRI and GPR may be new potential biomarkers for predicting MVI in HCC. The ENS achieved the optimal performance for predicting MVI in different sizes of HCC and holds promise for using as a noninvasive tool and may aid in the individualized selection of surgical procedures.
Abbreviations
AFP, α-fetoprotein; AUC, area under the curve; ALP, alkaline phosphatase; AST, aspartate aminotransferase; APRI, aminotransferase-to-platelet ratio; ALT, alanine aminotransferase; DCA, decision curve analysis; HBP, hepatobiliary phase; Gd-EOB-DTPA, gadoxetic acid disodium; LR, logistic regression; Xgboost, eXtreme Gradient Boosting; Knn, K-nearest neighbor; ROC, receiver operating characteristic curve; GPR, gamma-glutamyl transferase-to-platelet ratio; HCC, hepatocellular carcinoma; MVI, microvascular invasion; LASSO, least absolute shrinkage and selection operator logistic regression; ICC, intraclass correlation coefficient; SI, signal intensity; PLT, platelet count; MRI, magnetic resonance imaging; Neu, neutrophilic granulocyte count; RF, random forest; Tree, decision Tree; SVM, support Vector Machine; OS, overall survival; RFS, recurrence-free survival; ENS, ensemble models.
Data Sharing Statement
The original manuscript contained in the research is included in the article. Further inquiries can be made directly to the corresponding author.
Ethics Statement
This retrospective study was approved by the Ethics Committee of XinQiao Hospital of the Army Medical University (No: 2023-047-01) and was in conformation with the ethical guidelines of the 2008 Declaration of Helsinki. As a retrospective study, to ensure patient confidentiality, the identities of the individuals included in this study were anonymized using computer-generated ID numbers. Thus, the requirement for written informed consent was waived.
Consent to Publish
All authors have read and approved the submitted manuscript, the manuscript has not been submitted elsewhere nor published elsewhere in whole or in part.
Acknowledgments
The authors thank American Journal Experts (AJE) for assisting in the preparation of this paper.
Funding
This study was supported by the Talent project of Chongqing, China (Dong Zhang, CQYC202103075).
Disclosure
All authors have no relevant financial or non-financial interests to disclose for this work.
References
1. Calderaro J, Seraphin TP, Luedde T, Simon TG. Artificial intelligence for the prevention and clinical management of hepatocellular carcinoma. J Hepatol. 2022;76(6):1348–1361. doi:10.1016/j.jhep.2022.01.014
2. Sung H, Ferlay J, Siegel RL, et al. Global cancer statistics 2020: GLOBOCAN estimates of incidence and mortality worldwide for 36 cancers in 185 countries. CA Cancer J Clin. 2021;71(3):209–249. doi:10.3322/caac.21660
3. Villanueva A. Hepatocellular carcinoma. N Engl J Med. 2019;380(15):1450–1462. doi:10.1056/NEJMra1713263
4. Lahan-Martins D, Perales SR, Gallani SK, et al. Microvascular invasion in hepatocellular carcinoma: is it predictable with quantitative computed tomography parameters? Radiol Bras. 2019;52(5):287–292. doi:10.1590/0100-3984.2018.0123
5. Pommergaard HC, Rostved AA, Adam R, et al. Vascular invasion and survival after liver transplantation for hepatocellular carcinoma: a study from the European Liver Transplant Registry. HPB. 2018;20(8):768–775. doi:10.1016/j.hpb.2018.03.002
6. Sheng X, Ji Y, Ren GP, et al. A standardized pathological proposal for evaluating microvascular invasion of hepatocellular carcinoma: a multicenter study by LCPGC. Hepatol Int. 2020;14(6):1034–1047. doi:10.1007/s12072-020-10111-4
7. Hong SB, Choi SH, Kim SY, et al. MRI features for predicting microvascular invasion of Hepatocellular Carcinoma: a systematic review and meta-analysis. Liver Cancer. 2021;10(2):94–106. doi:10.1159/000513704
8. Omata M, Cheng AL, Kokudo N, et al. Asia-Pacific clinical practice guidelines on the management of hepatocellular carcinoma: a 2017 update. Hepatol Int. 2017;11(4):317–370. doi:10.1007/s12072-017-9799-9
9. Lee S, Kang TW, Song KD, et al. Effect of microvascular invasion risk on early recurrence of Hepatocellular Carcinoma after surgery and radiofrequency ablation. Ann Surg. 2021;273(3):564–571. doi:10.1097/SLA.0000000000003268
10. Aggarwal A, Te HS, Verna EC, Desai AP. A national survey of hepatocellular carcinoma surveillance practices following liver transplantation. Transplant Direct. 2021;7(1):e638. doi:10.1097/TXD.0000000000001086
11. Nitta H, Allard MA, Sebagh M, et al. Predictive model for microvascular invasion of hepatocellular carcinoma among candidates for either hepatic resection or liver transplantation. Surgery. 2019;165(6):1168–1175. doi:10.1016/j.surg.2019.01.012
12. Hwang S, Lee YJ, Kim KH, et al. The impact of tumor size on long-term survival outcomes after resection of solitary Hepatocellular carcinoma: single-institution experience with 2558 patients. J Gastrointest Surg. 2015;19(7):1281–1290. doi:10.1007/s11605-015-2849-5
13. Erstad DJ, Tanabe KK. Prognostic and therapeutic implications of microvascular invasion in Hepatocellular Carcinoma. Ann Surg Oncol. 2019;26(5):1474–1493. doi:10.1245/s10434-019-07227-9
14. Yuan E, Chen Y, Song B. Quality of radiomics for predicting microvascular invasion in hepatocellular carcinoma: a systematic review. Eur Radiol. 2023;33(5):3467–3477. doi:10.1007/s00330-023-09414-5
15. Xue TC, Jia QA, Ge NL, et al. The platelet-to-lymphocyte ratio predicts poor survival in patients with huge hepatocellular carcinoma that received transarterial chemoembolization. Tumour Biol. 2015;36(8):6045–6051. doi:10.1007/s13277-015-3281-x
16. Diakos CI, Charles KA, McMillan DC, Clarke SJ. Cancer-related inflammation and treatment effectiveness. Lancet Oncol. 2014;15(11):e493–e503. doi:10.1016/S1470-2045(14)70263-3
17. Sanghera C, Teh JJ, Pinato DJ. The systemic inflammatory response as a source of biomarkers and therapeutic targets in hepatocellular carcinoma. Liver Int. 2019;39(11):2008–2023. doi:10.1111/liv.14220
18. Xu X, Sun S, Liu Q, Liu X, Wu F, Shen C. Preoperative application of systemic inflammatory biomarkers combined with MR imaging features in predicting microvascular invasion of hepatocellular carcinoma. Abdom Radiol. 2022;47(5):1806–1816. doi:10.1007/s00261-022-03473-w
19. Li P, Huang W, Wang F, et al. Nomograms based on inflammatory biomarkers for predicting tumor grade and micro-vascular invasion in stage I/II hepatocellular carcinoma. Biosci Rep. 2018;38(6):BSR20180464. doi:10.1042/BSR20180464
20. Gu Y, Zheng F, Zhang Y, Qiao S. Novel nomogram based on inflammatory markers for the preoperative prediction of microvascular invasion in solitary primary Hepatocellular Carcinoma. Cancer Manag Res. 2022;14:895–907. doi:10.2147/CMAR.S346976
21. Ji F, Liang Y, Fu SJ, et al. A novel and accurate predictor of survival for patients with hepatocellular carcinoma after surgical resection: the neutrophil to lymphocyte ratio (NLR) combined with the aspartate aminotransferase/platelet count ratio index (APRI). BMC Cancer. 2016;16:137. doi:10.1186/s12885-016-2189-1
22. Lai L, Su T, Liang Z, et al. Development and assessment of novel predictive nomograms based on APRI for Hepatitis B virus-associated small solitary Hepatocellular Carcinoma with stereotactic body radiotherapy. J Cancer. 2020;11(22):6642–6652. doi:10.7150/jca.47291
23. Zhang X, Xin Y, Yang Y, et al. Aspartate aminotransferase-to-platelet ratio index for predicting late recurrence of hepatocellular carcinoma after radiofrequency ablation. Int J Hyperthermia. 2022;39(1):437–445. doi:10.1080/02656736.2022.2043457
24. Ma C, Wang N, Ma H, Song K, Yu R, Chen H. Serum gamma-glutamyl transpeptidase-to-platelet ratio (GPR) can predict the prognosis of hepatocellular carcinoma: a meta-analysis and systematic review. Transl Cancer Res. 2022;11(4):745–753. doi:10.21037/tcr-21-2559
25. Yang D, Wu H, Nong W, et al. A new model based on gamma-glutamyl transpeptidase to platelet ratio (GPR) predicts prognostic outcome after curative resection of solitary hepatocellular carcinoma. Clin Res Hepatol Gastroenterol. 2021;45(5):101509. doi:10.1016/j.clinre.2020.07.014
26. Zhang Y, Jin F, Wu Y, et al. Prognostic impact of gamma-glutamyl transpeptidase to platelets ratio on hepatocellular carcinoma patients who have undergone surgery: a meta-analysis and systematic review. Eur J Gastroenterol Hepatol. 2023;35(8):803–811. doi:10.1097/MEG.0000000000002572
27. Feng ST, Jia Y, Liao B, et al. Preoperative prediction of microvascular invasion in hepatocellular cancer: a radiomics model using Gd-EOB-DTPA-enhanced MRI. Eur Radiol. 2019;29(9):4648–4659. doi:10.1007/s00330-018-5935-8
28. Lee S, Kim SH, Lee JE, Sinn DH, Park CK. Preoperative gadoxetic acid-enhanced MRI for predicting microvascular invasion in patients with single hepatocellular carcinoma. J Hepatol. 2017;67(3):526–534. doi:10.1016/j.jhep.2017.04.024
29. Ueno A, Masugi Y, Yamazaki K, et al. OATP1B3 expression is strongly associated with Wnt/β-catenin signalling and represents the transporter of gadoxetic acid in hepatocellular carcinoma. J Hepatol. 2014;61(5):1080–1087. doi:10.1016/j.jhep.2014.06.008
30. Du M, Chen L, Zhao J, et al. Microvascular invasion (MVI) is a poorer prognostic predictor for small hepatocellular carcinoma. BMC Cancer. 2014;14:38. doi:10.1186/1471-2407-14-38
31. Ngiam KY, Khor IW. Big data and machine learning algorithms for health-care delivery. Lancet Oncol. 2019;20(5):e262–e273. doi:10.1016/S1470-2045(19)30149-4
32. Huang Y, Zhu T, Zhang X, et al. Longitudinal MRI-based fusion novel model predicts pathological complete response in breast cancer treated with neoadjuvant chemotherapy: a multicenter, retrospective study. EClinicalMedicine. 2023;58:101899. doi:10.1016/j.eclinm.2023.101899
33. Onozato Y, Iwata T, Uematsu Y, et al. Predicting pathological highly invasive lung cancer from preoperative [18F]FDG PET/CT with multiple machine learning models. Eur J Nucl Med Mol Imaging. 2023;50(3):715–726. doi:10.1007/s00259-022-06038-7
34. Mao S, Yu X, Shan Y, Fan R, Wu S, Lu C. Albumin-Bilirubin (ALBI) and Monocyte to Lymphocyte Ratio (MLR)-based nomogram model to predict tumor recurrence of AFP-negative Hepatocellular Carcinoma. J Hepatocell Carcinoma. 2021;8:1355–1365. doi:10.2147/JHC.S339707
35. Yang L, Gu D, Wei J, et al. A radiomics nomogram for preoperative prediction of microvascular invasion in Hepatocellular Carcinoma. Liver Cancer. 2019;8(5):373–386. doi:10.1159/000494099
36. Okamura S, Sumie S, Tonan T, et al. Diffusion-weighted magnetic resonance imaging predicts malignant potential in small hepatocellular carcinoma. Dig Liver Dis. 2016;48(8):945–952. doi:10.1016/j.dld.2016.05.020
37. Giavarina D. Understanding Bland Altman analysis. Biochem Med. 2015;25(2):141–151. doi:10.11613/BM.2015.015
38. Koo TK, Li MY. A guideline of selecting and reporting intraclass correlation coefficients for reliability research. J Chiropr Med. 2016;15(2):155–163. doi:10.1016/j.jcm.2016.02.012
39. Hanahan D, Weinberg RA. Hallmarks of cancer: the next generation. Cell. 2011;144(5):646–674. doi:10.1016/j.cell.2011.02.013
40. Okuda M, Li K, Beard MR, et al. Mitochondrial injury, oxidative stress, and antioxidant gene expression are induced by hepatitis C virus core protein. Gastroenterology. 2002;122(2):366–375. doi:10.1053/gast.2002.30983
41. Ma H, Zhang L, Tang B, et al. γ-Glutamyl transpeptidase is a prognostic marker of survival and recurrence in radiofrequency-ablation treatment of hepatocellular carcinoma. Ann Surg Oncol. 2014;21(9):3084–3089. doi:10.1245/s10434-014-3724-4
42. Fu SJ, Zhao Q, Ji F, et al. Elevated preoperative serum gamma-glutamyltranspeptidase predicts poor prognosis for Hepatocellular Carcinoma after liver transplantation. Sci Rep. 2016;6:28835. doi:10.1038/srep28835
43. Gauglhofer C, Sagmeister S, Schrottmaier W, et al. Up-regulation of the fibroblast growth factor 8 subfamily in human hepatocellular carcinoma for cell survival and neoangiogenesis. Hepatology. 2011;53(3):854–864. doi:10.1002/hep.24099
44. Kitao A, Matsui O, Yoneda N, et al. The uptake transporter OATP8 expression decreases during multistep hepatocarcinogenesis: correlation with gadoxetic acid enhanced MR imaging. Eur Radiol. 2011;21(10):2056–2066. doi:10.1007/s00330-011-2165-8
45. Tang M, Zhou Q, Huang M, et al. Nomogram development and validation to predict hepatocellular carcinoma tumor behavior by preoperative gadoxetic acid-enhanced MRI. Eur Radiol. 2021;31(11):8615–8627. doi:10.1007/s00330-021-07941-7
46. Hu H, Zheng Q, Huang Y, et al. A non-smooth tumor margin on preoperative imaging assesses microvascular invasion of hepatocellular carcinoma: a systematic review and meta-analysis. Sci Rep. 2017;7(1):15375. doi:10.1038/s41598-017-15491-6
47. Zhou YM, Yang JM, Li B, et al. Risk factors for early recurrence of small hepatocellular carcinoma after curative resection. Hepatobiliary Pancreat Dis Int. 2010;9(1):33–37.
48. Giuliante F, Ardito F, Pinna AD, et al. Liver resection for hepatocellular carcinoma ≤3 cm: results of an Italian multicenter study on 588 patients. J Am Coll Surg. 2012;215(2):244–254. doi:10.1016/j.jamcollsurg.2012.04.013
49. Fukuda S, Itamoto T, Nakahara H, et al. Clinicopathologic features and prognostic factors of resected solitary small-sized hepatocellular carcinoma. Hepatogastroenterology. 2005;52(64):1163–1167.
50. Shindoh J, Andreou A, Aloia TA, et al. Microvascular invasion does not predict long-term survival in hepatocellular carcinoma up to 2 cm: reappraisal of the staging system for solitary tumors. Ann Surg Oncol. 2013;20(4):1223–1229. doi:10.1245/s10434-012-2739-y
51. Xu P, Zeng M, Liu K, Shan Y, Xu C, Lin J. Microvascular invasion in small hepatocellular carcinoma: is it predictable with preoperative diffusion-weighted imaging? J Gastroenterol Hepatol. 2014;29(2):330–336. doi:10.1111/jgh.12358
 © 2024 The Author(s). This work is published and licensed by Dove Medical Press Limited. The full terms of this license are available at https://www.dovepress.com/terms.php and incorporate the Creative Commons Attribution - Non Commercial (unported, v3.0) License.
By accessing the work you hereby accept the Terms. Non-commercial uses of the work are permitted without any further permission from Dove Medical Press Limited, provided the work is properly attributed. For permission for commercial use of this work, please see paragraphs 4.2 and 5 of our Terms.
© 2024 The Author(s). This work is published and licensed by Dove Medical Press Limited. The full terms of this license are available at https://www.dovepress.com/terms.php and incorporate the Creative Commons Attribution - Non Commercial (unported, v3.0) License.
By accessing the work you hereby accept the Terms. Non-commercial uses of the work are permitted without any further permission from Dove Medical Press Limited, provided the work is properly attributed. For permission for commercial use of this work, please see paragraphs 4.2 and 5 of our Terms.