")
Back to Journals » Diabetes, Metabolic Syndrome and Obesity » Volume 14
miR-140-5p Aggravates Insulin Resistance via Directly Targeting GYS1 and PPP1CC in Insulin-Resistant HepG2 Cells
Authors Li X, Ye Y, Wang B, Zhao S
Received 27 January 2021
Accepted for publication 20 May 2021
Published 4 June 2021 Volume 2021:14 Pages 2515—2524
DOI https://doi.org/10.2147/DMSO.S304055
Checked for plagiarism Yes
Review by Single anonymous peer review
Peer reviewer comments 2
Editor who approved publication: Prof. Dr. Juei-Tang Cheng
Xuemei Li,* Yan Ye, Baoli Wang, Shujun Zhao*
NHC Key Laboratory of Hormones and Development, Tianjin Key Laboratory of Metabolic Diseases, Chu Hsien-I Memorial Hospital & Tianjin Institute of Endocrinology, Tianjin Medical University, Tianjin, 300134, People’s Republic of China
*These authors contributed equally to this work
Correspondence: Xuemei Li; Shujun Zhao
NHC Key Laboratory of Hormones and Development, Tianjin Key Laboratory of Metabolic Diseases, Chu Hsien-I Memorial Hospital & Tianjin Institute of Endocrinology, Tianjin Medical University, Tianjin, 300134, People’s Republic of China
Email [email protected]; [email protected]
Background: Much attention has been paid to the regulatory role of microRNA (miRNA) in insulin resistance. Nevertheless, how miR-140-5p regulates insulin resistance remains unclear. In this research, we aim to investigate the roles of miR-140-5p in insulin resistance.
Methods: qRT-PCR is used to analyze the expression level of miR-140-5p in insulin-resistant HepG2 cells. Glucose consumption and glucose uptake are detected to study the effect of miR-140-5p knockdown in insulin-resistant HepG2 cells and miR-140-5p overexpression in HepG2 cells. Bioinformatic analysis, luciferase reporter assay and confirmatory experiments are applied to identify the target gene bound with miR-140-5p and study the effect of miR-140-5p on the downstream substrates of target genes. Rescue experiments have verified the roles of miR-140-5p and target gene in glucose metabolism.
Results: The expression level of miR-140-5p was upregulated in insulin-resistant HepG2 cells and was significantly correlated with cellular glucose metabolism. Functionally, miR-140-5p overexpression induced impairment of glucose consumption and glucose uptake. Besides, bioinformatics analysis indicated that glycogen synthetase (GYS1) and protein phosphatase 1 catalytic subunit gamma (PPP1CC) were the target genes of miR-140-5p. Western blotting and qRT-PCR results revealed a negative correlation between GYS1, PPP1CC and miR-140-5p. The glycogen detection results showed that miR140-5p inhibited the production of the downstream substrates of the target gene. Rescue experiments showed that inhibition of GYS1 or PPP1CC partially enhanced the insulin-resistant effects of miR-140-5p knockdown in insulin-resistant HepG2 cells.
Conclusion: miR-140-5p overexpression augments the development of insulin resistance and miR-140-5p may be served as a therapeutic target of metabolic diseases.
Keywords: miR-140-5p, insulin resistance, glycogen synthetase, protein phosphatase 1 catalytic subunit gamma
Introduction
Diabetes mellitus (DM) is a disease caused by the absolute or relative deficiency of insulin, resulting in the disorder of glucose, fat and protein metabolism. It is mainly divided into insulin-dependent diabetes mellitus (T1DM) and non-insulin-dependent diabetes mellitus (T2DM), of which T2DM accounts for more than 90%.1 Recent studies have found that insulin resistance is the leading cause of T2DM; and improving insulin sensitivity and insulin resistance are the critical measures to treat and prevent T2DM and delay the development of diabetes.2 Thus, the potential mechanisms of insulin resistance in T2DM were urgently needed to be revealed for finding novel diagnostic markers and therapeutic targets.
MicroRNAs (miRs/miRNAs) are a kind of highly conserved, endogenous single-stranded non-coding small RNAs, with a wide range of biological functions, which can regulate downstream target genes at the post-transcriptional level.3 With the application of bioinformatics methods and high-throughput sequencing technologies, the regulatory role of miRNA in insulin resistance has attracted more and more attention.4,5 miRNAs, as regulators of glucose dynamic balance, regulate the production and secretion of insulin, the development of islets and the differentiation of islets cells, which participate in the occurrence of insulin resistance.6,7 Several miRNAs are related to insulin resistance and regulation of diabetes through impaired glucose metabolism, such as the Let-7 family, miR-126, miR-143a, which are directly or indirectly involved in the occurrence of insulin resistance and metabolic syndrome.6,8,9 However, only a few specific functional roles and potential mechanisms of miRNAs were found in insulin resistance.
miR-140-5p has been reported to be up-regulated in the plasma of obese or diabetic patients. It is restored after treatment with metformin or bariatric surgery, suggesting a strong correlation between the circulating concentration of miR-140-5p and insulin sensitivity.10,11 Besides, miR-140-5p overexpression is positively correlated with body mass index (BMI), waist to hip ratio (WHtR), diabetic control, profile parameters and is not associated with age of the studied subjects.12 However, whether miR-140-5p is associated with insulin resistance in diabetes has not been reported yet. Multiple studies have shown that miR-140-5p is identified as a tumor suppressor, including breast cancer,13 bladder cancer,14 non-small cell lung cancer,15 renal cell carcinoma.16 At present, it is generally believed that metabolic diseases and malignant tumors share a common biological mechanism, and tumor cells have enhanced the dependence on glycolytic pathway productivity, namely Warburg effect.17,18 Similarly, many genome-wide studies have confirmed that the genes associated with the development of type 2 diabetes are also oncogenes.19,20 Although miR-140-5p was closely associated with tumors, it remained unclear whether miR-140-5p played an important role in insulin resistance and the development and progression of T2DM.
The aim of this study was to investigate the roles and the related mechanism of miR-140-5p in insulin resistance. Therefore, the expression of miR-140-5p in insulin resistance model cells was first detected, and thereafter, the effect of miR-140-5p on glucose consumption and glucose uptake was determined. In addition, the downstream targets of miR-140-5p were explored and were demonstrated the effect on glucose metabolism in insulin resistance model cells.
Materials and Methods
Cell Line and Culture Conditions
HepG2 cell line were purchased from Chinese Academy of Science, Shanghai Institute of Biochemistry and Cell Biology (Shanghai, China). HepG2 cells were cultured with Dulbecco’s Modified Eagle Medium (DMEM, Invitrogen, USA) supplemented with 10% fetal bovine serum (FBS, Thermo Fisher, USA) and 100 U/mL penicillin and 100 mg/mL streptomycin (Gibco, USA), at 37 °C, under 5% CO2.
Insulin Resistance Model Establishment
A high insulin-induced insulin-resistant HepG2 cells model was established according the related references.21–23 HepG2 cells were cultured in DMEM containing 10% FBS, 100 U/mL penicillin and 100 mg/mL streptomycin in 5% CO2 in a humidified atmosphere. After the cells achieved about 80% confluence, the medium was changed and high concentration of insulin (30 μM) was supplemented to induce insulin-resistant model.24,25
Quantitative Real-Time Polymerase Chain Reaction (qRT-PCR)
TRIZOL reagent (Thermo Fisher, USA) was used to extract total RNA from HepG2 cells and cDNA was reverse-transcribed by Revert Aid First Strand cDNA Synthesis kit (Thermo Fisher Scientific, USA). RT-qPCR was conducted by SYBR-Green PCR Master Mix kit (Takara, Tokyo, Japan) and 7900 HT Fast system (Applied Biosystems, California, USA) with the following protocol: 94°C, 5 min; 40 cycles of amplification (94°C, 30 sec and 62°C, 40 sec); and then 72°C, 10 min. U6 and GAPDH were served as the internal control for miR-140-5p, GYS1 and PPP1CC. U6 upstream primer: 5ʹ-CTCGCTTCGGCAGCACA-3ʹ, downstream primer:5ʹ - AACGCTTCACGAATTTGCGT-3ʹ. miR-140-5p upstream primer: 5ʹ-CAGTGGTTTTACCCTATGGTAG-3ʹ, downstream primer: 5ʹ -ACCATAGGGTAAAACCACTGTT-3ʹ. GYS1 upstream primer: 5ʹ-CAGACAGTGGTTGCCTTCTTC-3ʹ, downstream primer: 5ʹ -TTCCTCCCGAACTTTTCCTT-3ʹ. PPP1CC upstream primer: 5ʹ-CTCAACATCGACAGCATTATCCA-3ʹ, downstream primer: 5ʹ -CACGAGACTTTAAGCACAGTCC-3ʹ. GAPDH upstream primer: 5ʹ-AAGGTGAAGGTCGGAGTCAA-3ʹ, downstream primer: 5ʹ -AATGAAGGGGTCATTGATGG-3ʹ. 2−ΔΔCT method was employed to analyze the relative fold changes of candidate genes.26,27
Cell Transfection
NC inhibitor, miR-140-5p inhibitor, NC mimic, miR-140-5p mimic, negative control short hairpin RNA (sh-NC), GYS1 short hairpin RNAs (sh-GYS1), PPP1CC short hairpin RNAs (sh-PPP1CC) were designed and obtained from Gene Pharma (Shanghai, China). Cells were seeded into a 6-well plate at a density of 1×10⁴ cells/well and allowed to adhere for 12 h. HepG2 cells were transfection with 50nM NC mimic, 50nM miR-140-5p mimic. Insulin-resistant HepG2 cells were transfected with NC inhibitor, miR-140-5p inhibitor, sh-NC, sh-GYS1, sh-PPP1CC, and the final concentration of miRNA inhibitor and shRNAs was 50 nM and 20 nM. Transfection of HepG2 cells was conducted using lipofectamine 2000 transfection reagent (Thermo Fisher Scientific, USA), and HepG2 cells were cultured in 6-well plates for 48 h and collected for subsequent analyses.28
Glucose Consumption, Glucose Uptake and Glycogen Content Analysis
After transfection for 48 h, Glucose oxidase method was used to detect glucose consumption, the glucose content in each well was determined by the glucose kit (GOD-POD method, Jiancheng Bioengineering Institute, Nanjing, China). The glucose consumption of the cells was calculated by subtracting the glucose content in each group from the mean of the glucose content in the culture medium without cells. Cellular glucose uptake was detected by 2-NBDG assay; after the transfection, 10 mM 2-(7-Nitrobenz-2-oxa-1,3-diazol-4-yl) amino-2-deoxy-D-glucose (2-NBDG, Invitrogen, USA) was added in glucose-free and serum-free DMEM medium for 30 min. The supernatant medium was collected and measured in automatic fluorescence microplate reader at an excitation wavelength of 488nm and emission wavelength of 520 nm. The cellular glucose uptake can be estimated via quantifying fluorescence. After transfection for 48 h, cells were washed twice with PBS (pH=7.4) and then were collected and homogenized in 30% KOH. The cell samples were boiled for 20 min and then added with 1.5 mL anhydrous ethanol. The samples were then centrifuged at 12,000 r/min (centrifugation radius 6.2 cm) for 15 min. The precipitate was dissolved in 0.5 mL distilled water, and 0.2% anthranone was added (diluted with 98% sulfuric acid) and boiled for 20 min. OD value was detected and recorded at 620 nm in automatic fluorescence microplate reader to estimate the intracellular glycogen content.29
Western Blot Analysis
HepG2 cells were seeded in 24-well plates and were transfected with NC mimics and miR-140-5p mimics for 48 h. Cells were then cracked in RIPA lysis buffer plus PMSF in low temperature. BCA assay kit (Santa Cruz, California, USA) were used to detect total protein concentration. Prepared protein samples were separated in SDS-PAGE, transferred into 0.22 μm PVDF membranes and incubated with ready antibodies. The primary antibody was incubated overnight, and the secondary antibody for 2 h. Finally, enhanced chemiluminescence (Thermo Fisher, MA, USA) visualized this membrane. The antibody β-actin was purchased from CST (1:1000 dilution, Beverly, Massachusetts, USA). Antibodies against the GSY1, PPP1CC were purchased from Abcam (1:1000 dilution, Shanghai, China).
Luciferase Reporter Assay
HepG2 cells were seeded in 24-well plates until reaching 60% confluence. The luciferase reporter was constructed by cloning 3ʹUTR region of the GSY1 WT, GYS1 Mut and PPP1CC WT, PPP1CC MUT (mutant of functional miR-140-5p binding domain). Sequences that could be binding to miR-140-5p were partly mutated and inserted into the reporters to identify the binding specificity. Each well was co-transfected with luciferase reporter plasmids (0.5 μg) and NC mimics and miR-140-5p mimics (100 nM) using Lipofectamine 2000 (Thermo Fisher Scientific, USA) according to the manufacturer’s protocol. The luciferase activity was measured after 48 h transfection by using the Dual-Luciferase Reporter Assay (Promega, Shanghai, China).30,31
Statistical Analysis
SPSS 18.0 software was used for statistical analysis. All experiments were repeated three times and the data were presented as the mean ± standard deviation (SD). An unpaired t-test was performed to compare the difference of the two groups. Besides, a one-way ANOVA followed by Bonferroni multiple comparison test was used to detect the difference between the two or more groups. It was considered as statistically significant when P<0.05.
Results
miR-140-5p is Upregulated in Insulin-Resistant HepG2 Cells
To clarify the potential role of miR-140-5p, the insulin resistance model of HepG2 cells was induced by high concentration insulin (30 μM) and qRT-PCR was performed to examine the expression of miR-140-5p in insulin-resistant HepG2 cells. As shown in Figure 1, the expression of miR-140-5p was significantly higher in insulin-resistant HepG2 cells than that in HepG2 cells.
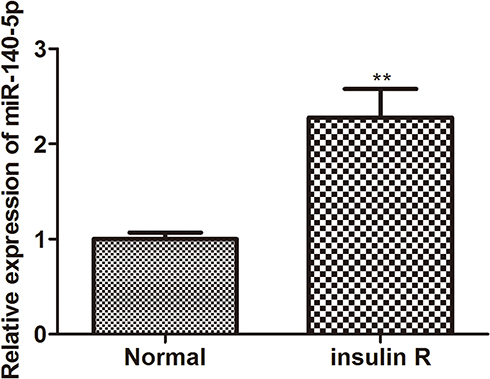 |
Figure 1 Relative expression of miR-140-5p in insulin-resistant HepG2 cells. The relative expression level of miR-14-5p in HepG2 cells and insulin-resistant HepG2 cells was detected by qRT-qPCR (n=8). Data were the presented as the mean ± standard deviation; ** P<0.01, compared with the normal group. Abbreviations: miR, microRNA; qRT-qPCR, quantitative real-time polymerase-chain reaction. |
The Effects of miR-140-5p on Glucose Metabolism in Insulin-Resistant HepG2 Cells
To investigate whether miR-140-5p affected the glucose metabolism, glucose consumption and glucose uptake were, respectively, detected after insulin-resistant HepG2 cells were transfected with miR-140-5p inhibitor and HepG2 cells were transfected with miR-140-5p mimic. We found that when miR-140-5p was inhibited in insulin-resistant HepG2 cells, the glucose consumption and glucose uptake were significantly increased, whereas miR-140-5p overexpression significantly decreased the glucose consumption and glucose uptake in HepG2 cells (Figure 2A–D). These results suggested that the down-regulation of miR-140-5p in HepG2 cells might be related to insulin resistance.
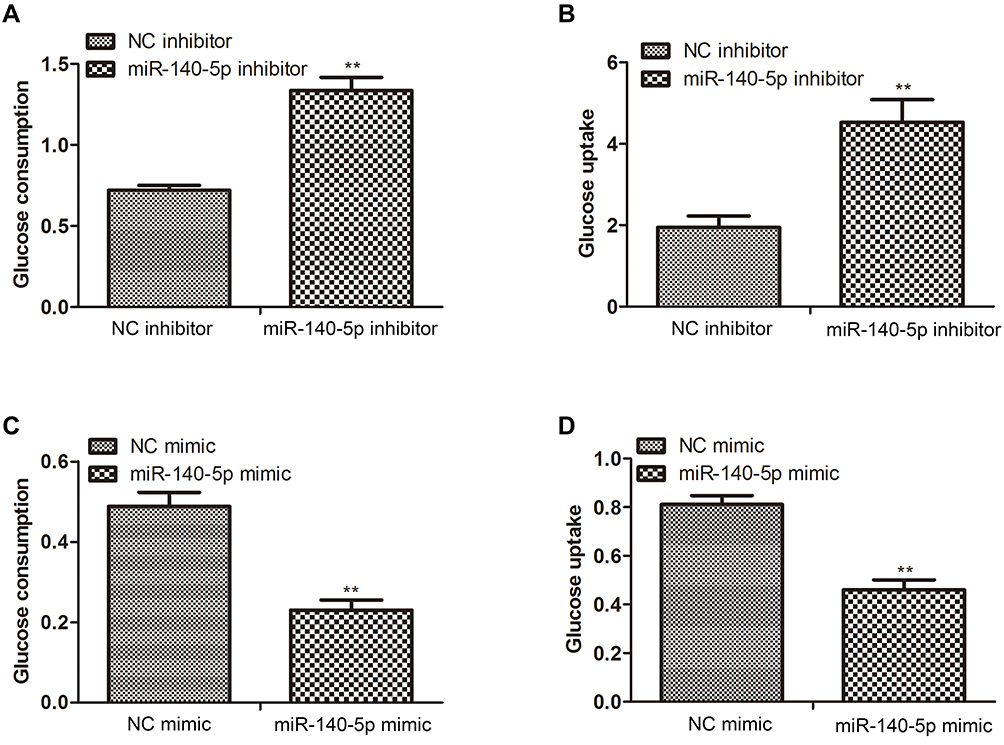 |
Figure 2 Effect of miR-140-5p on glucose metabolism in insulin-resistant HepG2 cells. (A and B) Glucose consumption and glucose uptake in insulin-resistant HepG2 cells transfected with miR-140-5p inhibitor (n=8). (C and D) Glucose consumption and glucose uptake in HepG2 cells transfected with miR-140-5p mimic (n=8). Data were expressed as the mean ± standard deviation; ** P<0.01 compared with the NC inhibitor/mimic group. |
GYS1 and PPP1CC Were Involved in miR-140-5p-Modulated Insulin Resistance
After the previous results confirmed the expression and function of miR-140-5p in insulin-resistant HepG2 cells, we identified the putative targets of miR-140-5p. Bioinformatics algorithms predicted that the 3ʹUTR of GYS1-Wt and PPP1CC-Wt contained elements complementary to miR-140-5p, respectively (Figure 3A). Dual-luciferase reporter assay showed that compared with the NC mimic group, HepG2 cells co-transfected with GYS1-Wt/PPP1CC-Wt and miR-140-5p displayed reduced luciferase activity. However, little effect was observed in HepG2 cells co-transfected with GYS1-Mut/PPP1CC-Mut and miR-140-5p (Figure 3B). Compared with the respective NC mimic group, qRT-PCR and Western blotting analyses demonstrated that miR-140-5p inhibited the mRNA and protein expression levels of GYS1 and PPP1CC (Figure 3C and D). Besides, mRNA expression levels of GYS1 and PPP1CC were significantly decreased in insulin-resistant HepG2 cells than that in HepG2 cells (Figure 3E).
 |
Figure 3 miR-140-5p negatively regulated GYS1 and PPP1CC expression. (A) Bioinformatics analysis of predicted interaction of miR-140-5p with its binding sites in the GYS1 and PPP1CC gene. (B) Relative luciferase activity in HepG2 cells co-transfected with either NC mimic or miR-140-5p mimic and GYS1-Wt/PPP1C-Wt or GYS1-Mut/PPP1C-Mut (n=8). (C) qRT-PCR showing relative expression of GYS1 and PPP1CC in HepG2 cells transfected with NC mimic, miR-140-5p mimic (n=8). (D) Western blotting showing relative protein expression of GYS1 and PPP1CC in HepG2 cells transfected with NC mimic, miR-140-5p mimic. β-actin was detected as a loading control (n=8). (E) qRT-PCR showing relative expression of GYS1 and PPP1CC in insulin-resistant HepG2 cells (n=8). Data were expressed as the mean ± standard deviation; ** P<0.01, ***P<0.001, compared with the normal group. Abbreviations: miR, microRNA; qRT-qPCR, quantitative real-time polymerase-chain reaction; GYS1, glycogen synthase 1; PPP1CC, protein phosphatase 1 catalytic subunit gamma. |
miR-140-5p Reduced Glycogen Content in HepG2 Cells
Higher miR-140-5p expression and lower GYS1 and PPP1CC levels were observed in insulin-resistant HepG2 cells. Since glycogen was downstream substrates of target gene GYS1 and PPP1CC, we detected the glycogen content in HepG2 cells transfected with miR-140-5p inhibitor and miR-140-5p mimic. We found that compared with NC inhibitor group, the content of glycogen was increased significantly in miR-140-5p inhibitor group, while glycogen content in miR-140-5p mimic group was lower than NC mimic group (Figure 4A and B).
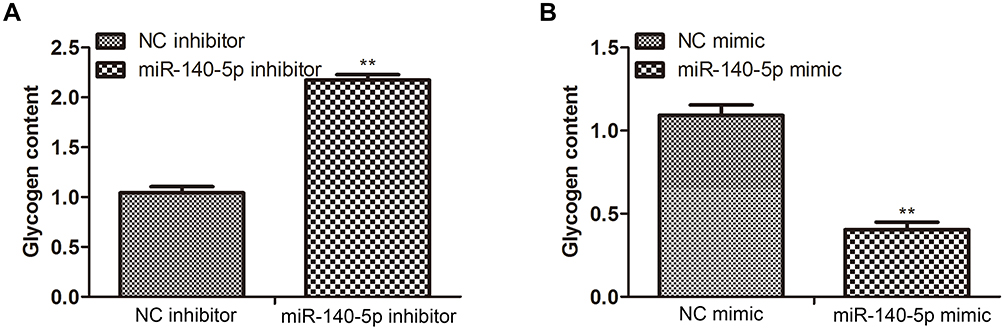 |
Figure 4 Effect of miR-140-5P on the downstream substrates of target genes. (A and B) Glycogen content in HepG2 cells transfected with NC inhibitor, miR-140-5p inhibitor, NC mimic, miR-140-5p mimic (n=8). Data were expressed as the mean ± standard deviation; ** P<0.01 compared with the NC inhibitor/mimic group. Abbreviation: miR, microRNA. |
miR-140-5p Rescues GYS1-Induced and PPP1CC-Induced Insulin Resistance
To determine whether miR-140-5p regulates insulin resistance via targeting GYS1 and PPP1CC, glucose consumption and glucose uptake were detected in insulin-resistant HepG2 cells. Results indicated that miR-140-5p inhibitor suppressed miR-140-5p expression and promoted the expression level of GYS1 and PPP1CC (Figure 5A). Moreover, GYS1 knockdown did not affect the expression of miR-140-5p in insulin-resistant HepG2 cells transfected with miR-140-5p inhibitor, and PPP1CC knockdown also showed the same results (Figure 5A). Compared with the NC inhibitor + sh-NC group, miR-140-5p knockdown promoted glucose consumption and glucose uptake. Glucose consumption and glucose uptake were rescued by sh-GYS1 and sh-PPP1CC (Figure 5B and C).
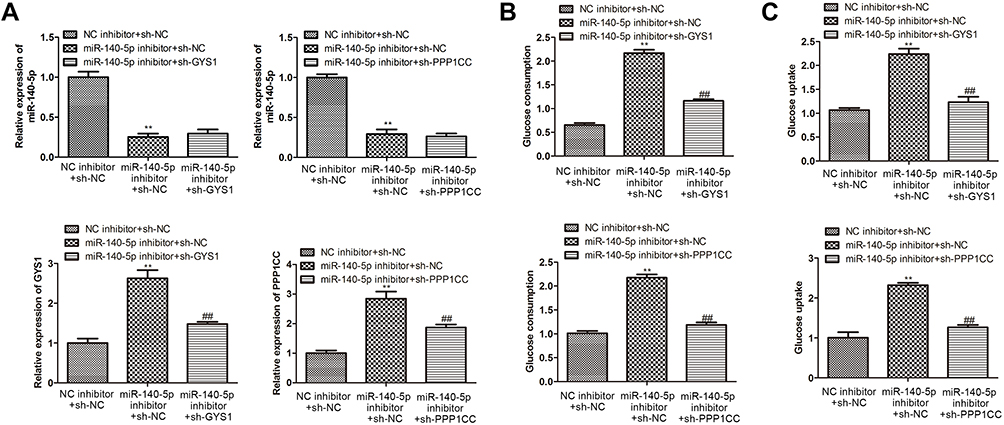 |
Figure 5 Knockdown of miR-140-5p improved cellular glucose metabolism via targeting GYS1 and PPP1CC gene. (A) qRT-PCR showing the relative expression level of miR-14-5p, GYS1 and PPP1CC in insulin-resistant HepG2 cells transfected with NC inhibitor + sh-NC, miR-140-5p inhibitor + sh-NC, miR-140-5p inhibitor + sh-GYS1/sh-PPP1CC (n=8). (B( and (C) Glucose consumption and glucose uptake in insulin-resistant HepG2 cells transfected with NC inhibitor + sh-NC, miR-140-5p inhibitor + sh-NC, miR-140-5p inhibitor + sh-GYS1/sh-PPP1CC (n=8). Data were expressed as the mean ± standard deviation; ** P<0.01 compared with the NC inhibitor + sh-NC group; ##P<0.01 compared with the miR-140-5p inhibitor + sh-NC. Abbreviation: miR, microRNA. |
Discussion
Insulin resistance refers to decreased insulin sensitivity and reactivity, which usually refers to the decrease of insulin-mediated glucose utilization, and the insulin level cannot maintain the body’s glucose homeostasis.32 Multiple studies have shown that miRNAs regulate essential processes of insulin resistance, such as regulating the expression of insulin receptor,33 insulin receptor substrates34–36and glucose transporter 4 (GLUT4).37 Therefore, many miRNAs have been associated with insulin resistance and it is urgent to study the effect of miRNAs on insulin resistance in diabetic patients and its underlying mechanisms. In this study, we found that there was a significant increase of miR-140-5p in insulin resistance model cells and clarify the functional role of miR-140-5p in insulin resistance model cells.
First, we established insulin resistance model cells by high concentration of insulin induction. Interestingly, insulin of high concentration had a significant effect on the up-regulation of miR-140-5p (Figure 1), consistent with the previous study.38,39 Insulin resistance in HepG2 cells is mainly caused by impaired insulin signaling pathway and reduced glucose uptake, so we examined glucose consumption and the protein levels of insulin signaling pathway. As shown in Supplementary Figure S1 (A, B), glucose consumption and phosphorylation of IRS1, Akt and ERK were significantly decreased in insulin-resistant HepG2 cells. IRS1, the insulin receptor substrates (IRSs) family protein, links insulin receptor activation with activation of the essential downstream insulin signaling protein kinase B (Akt) and extracellular signal-regulated kinase (ERK) pathways.40,41 Therefore, these results proved that an in vitro insulin resistant model of HepG2 cells were established after high-concentration insulin (30 μM) stimulation. Functional assays showed that transfection with miR-140-5p inhibitor into the insulin resistance HepG2 cells enhanced glucose metabolism, as manifested by increased glucose consumption and glucose uptake (Figure 2A and B). Meanwhile, transfection of HepG2 cells with miR-140-5P mimic showed the opposite result, that is, it would attenuate glucose metabolism (Figure 2C and D). The above results suggested that miR-140-5p might be valuable as a diagnostic biomarker and a potential therapeutic target for insulin resistance in diabetes mellitus.MiRNAs exert their biological function by regulating their target genes in T2DM.42 In order to explore the mechanism of miR-140-5p, bioinformatics tools were used to predict target genes of miR-140-5p, and the results revealed that the 3ʹ-untranslated region (3ʹUTR) of target gene including glycogen synthetase1 (GYS1) and protein phosphatase 1, catalytic subunit gamma (PPP1CC) contained the conserved binding site of miR-140-5p (Figure 3A). A variety of bioinformatics tools were used to predict the target genes of miR-140-5p, and the results showed that PicTar, TargetScan and Diana databases all predicted the presence of binding sites of miR-140-5p in the 3 ‘untranslated region of GYS1 and PPP1CC. Several studies have found that the expression levels of various miRNAs are closely related to type 2 diabetes, including miR-140-5p, miR-142-3p, miR-222, miR-423-5p, miR-195, miR-126.38 As shown in Figure 2S, the expression level of miR-140-5p was significantly increased in insulin-resistant HepG2 cells, which was consistent with the results of previous studies. Luciferase reporter plasmids containing predictive GYS1 and PPP1CC target gene sequences showed that GYS1 and PPP1CC were the direct targets of miR-140-5p (Figure 3B). In addition, we found that miR-140-5p mimic decreased the expression of GYS1 and PPP1CC in HepG2 cells and reduced glycogen content in insulin resistance HepG2 cells (Figure 3C and D, Figure 4). In contrast to miR-140-5p expression in insulin resistance models, the mRNA expression level of GYS1 and PPP1CC in insulin resistance models were decreased (Figure 3E). Previous studies have proved that the muscle isoform of glycogen synthase, which is encoded by GYS1 gene, has been associated with insulin resistance and T2DM.43 Glycogen synthase is a rate-limiting enzyme in liver and muscle glycogen synthesis, and is also the main target enzyme of insulin. By activating glycogen synthase phosphatase, insulin activates GYS, increases the ability of liver and muscle to synthesize glycogen, inhibits the production of endogenous glucose and stimulates the uptake of glucose in peripheral tissues.44–46 Protein phosphatase 1 (PP1) is the main phosphatase in the insulin- activated glycogen synthase pathway, consisting of 37KDa catalytic subunit (PPlC) and 126KDa regulatory subunit (PPlG).47 Protein phosphatase 1 regulates subunit positively regulate and catalyze subunit dephosphorylation, activate glycogen synthase through dephosphorylation, and promote glucose uptake and glycogen synthesis.48,49 During the transport of glucose into cells, glycogen synthesis, oxidative decomposition and other metabolic processes, protein phosphatase 1 (PP1) pathway is the most important metabolic process for synthesizing glucose into glycogen, accounting for about 60 ~ 70%.50 In the state of insulin resistance, the activation effect of insulin on PPP1CC is weakened, thus reducing the activity of GYS1, resulting in decreased glycogen synthesis and increased blood glucose in T2D patients.51 Our investigation further corroborated that GYS1 and PPP1CC were target genes of miR-140-5p and had effects on the glycose consumption and glycose uptake, which provided a novel mechanism through which miR-140-5p could regulate the insulin resistance in diabetes mellitus. We also found the downregulation of GYS1 and PPP1CC partly rescued the miR-140-5p depletion mediated cell glycose consumption and glycose uptake (Figure 5A–C). Together, these results indicated that GYS1 and PPP1CC played a beneficial role in improving insulin resistance partly through regulating miR-140-5p in diabetes mellitus. In summary, the current results indicated that miR-140-5p was upregulated in insulin resistance model cells and promoted the insulin resistance via targeted inhibition of GYS1 and PPP1CC. Thus, miR-140-5p might serve as a potential therapeutic target for insulin resistance and T2DM.
Data Sharing Statement
All data generated or analysed during this study are included in this published article.
Consent for Publication
The authors agree to publication in the Journal.
Author Contributions
All authors made a significant contribution to the work reported, whether that is in the conception, study design, execution, acquisition of data, analysis and interpretation, or in all these areas; took part in drafting, revising or critically reviewing the article; gave final approval of the version to be published; have agreed on the journal to which the article has been submitted; and agree to be accountable for all aspects of the work.
Funding
This work was supported by Postdoctoral Science Foundation of China (2017M611178, Xuemei Li), Science Foundation of Tianjin Medical University (2016KYZM05, Xuemei Li), Tianjin Natural Science Foundation (19JCZDJC 35300, Shujun Zhao).
Disclosure
The authors declare that they have no conflicts of interest.
References
1. Saeedi P, Petersohn I, Salpea P, et al. Global and regional diabetes prevalence estimates for 2019 and projections for 2030 and 2045: results from the International Diabetes Federation Diabetes Atlas, 9(th) edition. Diabetes Res Clin Pract. 2019;157:107843. doi:10.1016/j.diabres.2019.107843
2. Chatterjee S, Khunti K, Davies MJ. Type 2 diabetes. Lancet. 2017;389(10085):2239–2251. doi:10.1016/S0140-6736(17)30058-2
3. Kabekkodu SP, Shukla V, Varghese VK, Chakrabarty S, Satyamoorthy K. Clustered miRNAs and their role in biological functions and diseases. Biol Rev Camb Philos Soc. 2018;93(4):1955–1986.
4. He L, Hannon GJ. MicroRNAs: small RNAs with a big role in gene regulation. Nat Rev Genet. 2004;5(7):522–531. doi:10.1038/nrg1379
5. Kim J, Yao F, Xiao Z, Sun Y, Ma L. MicroRNAs and metastasis: small RNAs play big roles. Cancer Metastasis Rev. 2018;37(1):5–15.
6. Feng J, Xing W, Xie L. Regulatory Roles of MicroRNAs in Diabetes. Int J Mol Sci. 2016;17:10.
7. Guo C, Sun YQ, Li Q, Zhang JC. MiR-7, miR-9 and miR-375 contribute to effect of Exendin-4 on pancreatic β-cells in high-fat-diet-fed mice. Clin Invest Med. 2018;41(1):E16–e24. doi:10.25011/cim.v41i1.29459
8. Frost RJ, Olson EN. Control of glucose homeostasis and insulin sensitivity by the Let-7 family of microRNAs. Proc Natl Acad Sci U S A. 2011;108(52):21075–21080. doi:10.1073/pnas.1118922109
9. Nair S, Jayabalan N, Guanzon D, et al. Human placental exosomes in gestational diabetes mellitus carry a specific set of miRNAs associated with skeletal muscle insulin sensitivity. Clin sci. 2018;132(22):2451–2467. doi:10.1042/CS20180487
10. Villard A, Marchand L, Thivolet C, Rome S. Diagnostic Value of Cell-free Circulating MicroRNAs for Obesity and Type 2 Diabetes: a Meta-analysis. J Mol Biomark Diagn. 2015;6(6):45.
11. Xiong Z, Li B, Wang W, et al. MiR-140 targets RAP2A to enable the proliferation of insulin-treated ovarian granulosa cells. J Ovarian Res. 2020;13(1):13. doi:10.1186/s13048-020-0611-4
12. Al-Rawaf HA. Circulating microRNAs and adipokines as markers of metabolic syndrome in adolescents with obesity. Clin nutrition. 2019;38(5):2231–2238. doi:10.1016/j.clnu.2018.09.024
13. Zhu D, Lv W, Zhou X, et al. Long non-coding RNA TMPO-AS1 promotes tumor progression via sponging miR-140-5p in breast cancer. Exp Ther Med. 2021;21(1):17. doi:10.3892/etm.2020.9449
14. Wu S, Xu R, Zhu X, et al. The long noncoding RNA LINC01140/miR-140-5p/FGF9 axis modulates bladder cancer cell aggressiveness and macrophage M2 polarization. Aging. 2020;12(24):25845–25864. doi:10.18632/aging.202147
15. Mei J, Liu G, Wang W, et al. OIP5-AS1 modulates epigenetic regulator HDAC7 to enhance non-small cell lung cancer metastasis via miR-140-5p. Oncol Lett. 2020;20(4):7. doi:10.3892/ol.2020.11868
16. Huang C, Li J, Zhang X, et al. The miR-140-5p/KLF9/KCNQ1 axis promotes the progression of renal cell carcinoma. FASEB j. 2020;34(8):10623–10639. doi:10.1096/fj.202000088RR
17. Barrea L, Caprio M, Tuccinardi D, et al. Could ketogenic diet “starve” cancer? Emerging evidence. Crit Rev Food Sci Nutr. 2020;1–22.
18. Gao P, Tchernyshyov I, Chang TC, et al. c-Myc suppression of miR-23a/b enhances mitochondrial glutaminase expression and glutamine metabolism. Nature. 2009;458(7239):762–765. doi:10.1038/nature07823
19. Fernández-Tajes J, Gaulton KJ, van de Bunt M, et al. Developing a network view of type 2 diabetes risk pathways through integration of genetic, genomic and functional data. Genome Med. 2019;11(1):19. doi:10.1186/s13073-019-0628-8
20. Diedisheim M, Carcarino E, Vandiedonck C, Roussel R, Gautier JF, Venteclef N. Regulation of inflammation in diabetes: from genetics to epigenomics evidence. Mol Metab. 2020;41:101041. doi:10.1016/j.molmet.2020.101041
21. Zhu Y, Zhang H, Wei Y, et al. Pea-derived peptides, VLP, LLP, VA, and LL, improve insulin resistance in HepG2 cells via activating IRS-1/PI3K/AKT and blocking ROS-mediated p38MAPK signaling. J Food Biochem. 2020;44(11):e13454. doi:10.1111/jfbc.13454
22. Li J, Ding X, Jian T, et al. Four sesquiterpene glycosides from loquat (Eriobotrya japonica) leaf ameliorates palmitic acid-induced insulin resistance and lipid accumulation in HepG2 Cells via AMPK signaling pathway. PeerJ. 2020;8:e10413. doi:10.7717/peerj.10413
23. Ma YM, Tao RY, Liu Q, et al. PTP1B inhibitor improves both insulin resistance and lipid abnormalities in vivo and in vitro. Mol Cell Biochem. 2011;357(1–2):65–72. doi:10.1007/s11010-011-0876-4
24. Zhang C, Qian D, Zhao H, Lv N, Yu P, Sun Z. MiR17 improves insulin sensitivity through inhibiting expression of ASK1 and anti-inflammation of macrophages. Biomed Pharmacother. 2018;100:
25. Lin M, Mao ZJ. lncRNA-mRNA competing endogenous RNA network in IR-hepG2 cells ameliorated by APBBR decreasing ROS levels: a systematic analysis. PeerJ. 2020;8:e8604. doi:10.7717/peerj.8604
26. Wang W, Ding XQ, Gu TT. Pterostilbene and allopurinol reduce fructose-induced podocyte oxidative stress and inflammation via microRNA-377. Free Radic Biol Med. 2015;83:
27. Zhang X, Xu X, Ge G, et al. miR‑498 inhibits the growth and metastasis of liver cancer by targeting ZEB2. Oncol Rep. 2019;41(3):1638–1648. doi:10.3892/or.2018.6948
28. Tan PY, Wen LJ, Li HN, Chai SW. MiR-548c-3p inhibits the proliferation, migration and invasion of human breast cancer cell by targeting E2F3. Cytotechnology. 2020;72(5):751–761. doi:10.1007/s10616-020-00418-3
29. Zhu H, Leung SW. Identification of microRNA biomarkers in type 2 diabetes: a meta-analysis of controlled profiling studies. Diabetologia. 2015;58(5):900–911. doi:10.1007/s00125-015-3510-2
30. Yang D, Li R, Xia J, et al. Long Noncoding RNA PCAT18 Upregulates SPRR3 to Promote Colorectal Cancer Progression by Binding to miR-759. Cancer Manag Res. 2020;12:
31. Li H, Wang X. Expression of miR-140-5p and miR-370 in nephroblastoma and its effect on cell proliferation. J BUON. 2020;25(4):2105–2109.
32. den Biggelaar LJ, Sep SJ, Eussen SJ, et al. Discriminatory ability of simple OGTT-based beta cell function indices for prediction of prediabetes and type 2 diabetes: the CODAM study. Diabetologia. 2017;60(3):432–441. doi:10.1007/s00125-016-4165-3
33. Yang WM, Jeong HJ, Park SW, Lee W. Obesity-induced miR-15b is linked causally to the development of insulin resistance through the repression of the insulin receptor in hepatocytes. Mol Nutr Food Res. 2015;59(11):2303–2314. doi:10.1002/mnfr.201500107
34. Yang WM, Jeong HJ, Park SY, Lee W. Induction of miR-29a by saturated fatty acids impairs insulin signaling and glucose uptake through translational repression of IRS-1 in myocytes. FEBS Lett. 2014;588(13):2170–2176. doi:10.1016/j.febslet.2014.05.011
35. Fernandez-Twinn DS, Alfaradhi MZ, Martin-Gronert MS, et al. Downregulation of IRS-1 in adipose tissue of offspring of obese mice is programmed cell-autonomously through post-transcriptional mechanisms. Mol Metab. 2014;3(3):325–333. doi:10.1016/j.molmet.2014.01.007
36. Kitao N, Nakamura A, Miyoshi H, et al. The role of glucokinase and insulin receptor substrate-2 in the proliferation of pancreatic beta cells induced by short-term high-fat diet feeding in mice. Metabolism. 2018;85:
37. Guo Y, Li G, Li H, et al. MicroRNA-15a Inhibits Glucose Transporter 4 Translocation and Impairs Glucose Metabolism in L6 Skeletal Muscle Via Targeting of Vesicle-Associated Membrane Protein-Associated Protein A. Canadian j Diabetes. 2020;44(3):261–266.e262. doi:10.1016/j.jcjd.2019.07.151
38. Ortega FJ, Mercader JM, Moreno-Navarrete JM, et al. Profiling of circulating microRNAs reveals common microRNAs linked to type 2 diabetes that change with insulin sensitization. Diabetes Care. 2014;37(5):1375–1383. doi:10.2337/dc13-1847
39. Ortega FJ, Mercader JM, Catalán V, et al. Targeting the circulating microRNA signature of obesity. Clin Chem. 2013;59(5):781–792. doi:10.1373/clinchem.2012.195776
40. Ding X, Jian T, Wu Y, et al. Ellagic acid ameliorates oxidative stress and insulin resistance in high glucose-treated HepG2 cells via miR-223/keap1-Nrf2 pathway. Biomed Pharmacother. 2019;110:
41. Ding XQ, Gu TT, Wang W. Curcumin protects against fructose-induced podocyte insulin signaling impairment through upregulation of miR-206. Mol Nutr Food Res. 2015;59(12):2355–2370. doi:10.1002/mnfr.201500370
42. Eliasson L, Esguerra JLS. MicroRNA Networks in Pancreatic Islet Cells: normal Function and Type 2 Diabetes. Diabetes. 2020;69(5):804–812. doi:10.2337/dbi19-0016
43. Savage DB, Zhai L, Ravikumar B, et al. A prevalent variant in PPP1R3A impairs glycogen synthesis and reduces muscle glycogen content in humans and mice. PLoS Med. 2008;5(1):e27. doi:10.1371/journal.pmed.0050027
44. Nitschke S, Chown EE, Zhao X, et al. An inducible glycogen synthase-1 knockout halts but does not reverse Lafora disease progression in mice. J Biol Chem. 2020;296.
45. Zhao M, Shen L, Ouyang Z, et al. Loss of hnRNP A1 in murine skeletal muscle exacerbates high-fat diet-induced onset of insulin resistance and hepatic steatosis. J Mol Cell Biol. 2020;12(4):277–290. doi:10.1093/jmcb/mjz050
46. Kang HW, Lim WC, Lee JK, Ho JN, Lim EJ, Cho HY. Germinated waxy black rice ameliorates hyperglycemia and dyslipidemia in streptozotocin-induced diabetic rats. Biol Pharm Bull. 2017;40(11):1846–1855. doi:10.1248/bpb.b17-00239
47. Hu X, Li Z, Ding Y, et al. Chk1 modulates the interaction between myosin phosphatase targeting protein 1 (MYPT1) and protein phosphatase 1cβ (PP1cβ). Cell Cycle. 2018;17(4):421–427. doi:10.1080/15384101.2017.1418235
48. Felgueiras J, Jerónimo C, Fardilha M. Protein phosphatase 1 in tumorigenesis: is it worth a closer look? Biochimica Et Biophysica Acta Rev Cancer. 2020;1874(2):188433. doi:10.1016/j.bbcan.2020.188433
49. Salvi F, Hoermann B, Del Pino García J, et al. Towards dissecting the mechanism of protein phosphatase-1 inhibition by its C-terminal phosphorylation. Chembiochem. 2021;22(5):834–838. doi:10.1002/cbic.202000669
50. Luo C, Wu M, Su X, et al. Protein phosphatase 1α interacts with a novel ciliary targeting sequence of polycystin-1 and regulates polycystin-1 trafficking. FASEB j. 2019;33(9):9945–9958. doi:10.1096/fj.201900338R
51. Chown EE, Wang P, Zhao X, et al. GYS1 or PPP1R3C deficiency rescues murine adult polyglucosan body disease. Ann Clin Translational Neurol. 2020;7(11):2186–2198. doi:10.1002/acn3.51211
 © 2021 The Author(s). This work is published and licensed by Dove Medical Press Limited. The full terms of this license are available at https://www.dovepress.com/terms.php and incorporate the Creative Commons Attribution - Non Commercial (unported, v3.0) License.
By accessing the work you hereby accept the Terms. Non-commercial uses of the work are permitted without any further permission from Dove Medical Press Limited, provided the work is properly attributed. For permission for commercial use of this work, please see paragraphs 4.2 and 5 of our Terms.
© 2021 The Author(s). This work is published and licensed by Dove Medical Press Limited. The full terms of this license are available at https://www.dovepress.com/terms.php and incorporate the Creative Commons Attribution - Non Commercial (unported, v3.0) License.
By accessing the work you hereby accept the Terms. Non-commercial uses of the work are permitted without any further permission from Dove Medical Press Limited, provided the work is properly attributed. For permission for commercial use of this work, please see paragraphs 4.2 and 5 of our Terms.