")
Back to Journals » ClinicoEconomics and Outcomes Research » Volume 16
Medical Costs Associated with High/Moderate/Low Likelihood of Adult Growth Hormone Deficiency: A Healthcare Claims Database Analysis
Authors Yuen KC , Blevins LS, Clemmons DR, Faurby M, Hoffman AR, Kelepouris N, Kerr JM, Tarp JM, Fleseriu M
Received 15 November 2023
Accepted for publication 26 February 2024
Published 8 March 2024 Volume 2024:16 Pages 133—147
DOI https://doi.org/10.2147/CEOR.S445495
Checked for plagiarism Yes
Review by Single anonymous peer review
Peer reviewer comments 2
Editor who approved publication: Dr Samer Hamidi
Kevin CJ Yuen,1 Lewis S Blevins,2 David R Clemmons,3 Mads Faurby,4 Andrew R Hoffman,5 Nicky Kelepouris,6 Janice M Kerr,7 Jens Magelund Tarp,4 Maria Fleseriu8
1Barrow Pituitary Center, Barrow Neurological Institute and St. Joseph’s Hospital and Medical Center, University of Arizona College of Medicine and Creighton School of Medicine, Phoenix, AZ, USA; 2Department of Neurosurgery, University of California, San Francisco, CA, USA; 3Department of Medicine, University of North Carolina School of Medicine, Chapel Hill, NC, USA; 4Global Evidence, Pricing and Access, Novo Nordisk A/S, Søborg, Denmark; 5Department of Medicine, Stanford University, Stanford, CA, USA; 6Department of Medical Affairs BioPharm, CMR, Novo Nordisk Inc., Plainsboro, NJ, USA; 7Department of Endocrinology, University of Colorado Denver, Anschutz Medical Campus, Aurora, CO, USA; 8Pituitary Center, Departments of Medicine and Neurological Surgery, Oregon Health and Science University, Portland, OR, USA
Correspondence: Kevin CJ Yuen, Barrow Pituitary Center, Barrow Neurological Institute and St. Joseph’s Hospital and Medical Center, University of Arizona College of Medicine and Creighton School of Medicine, 475 N. 5th Street, Phoenix, AZ, 85004, USA, Tel +1 602 406-2748, Fax +1 602 406-2770, Email [email protected]
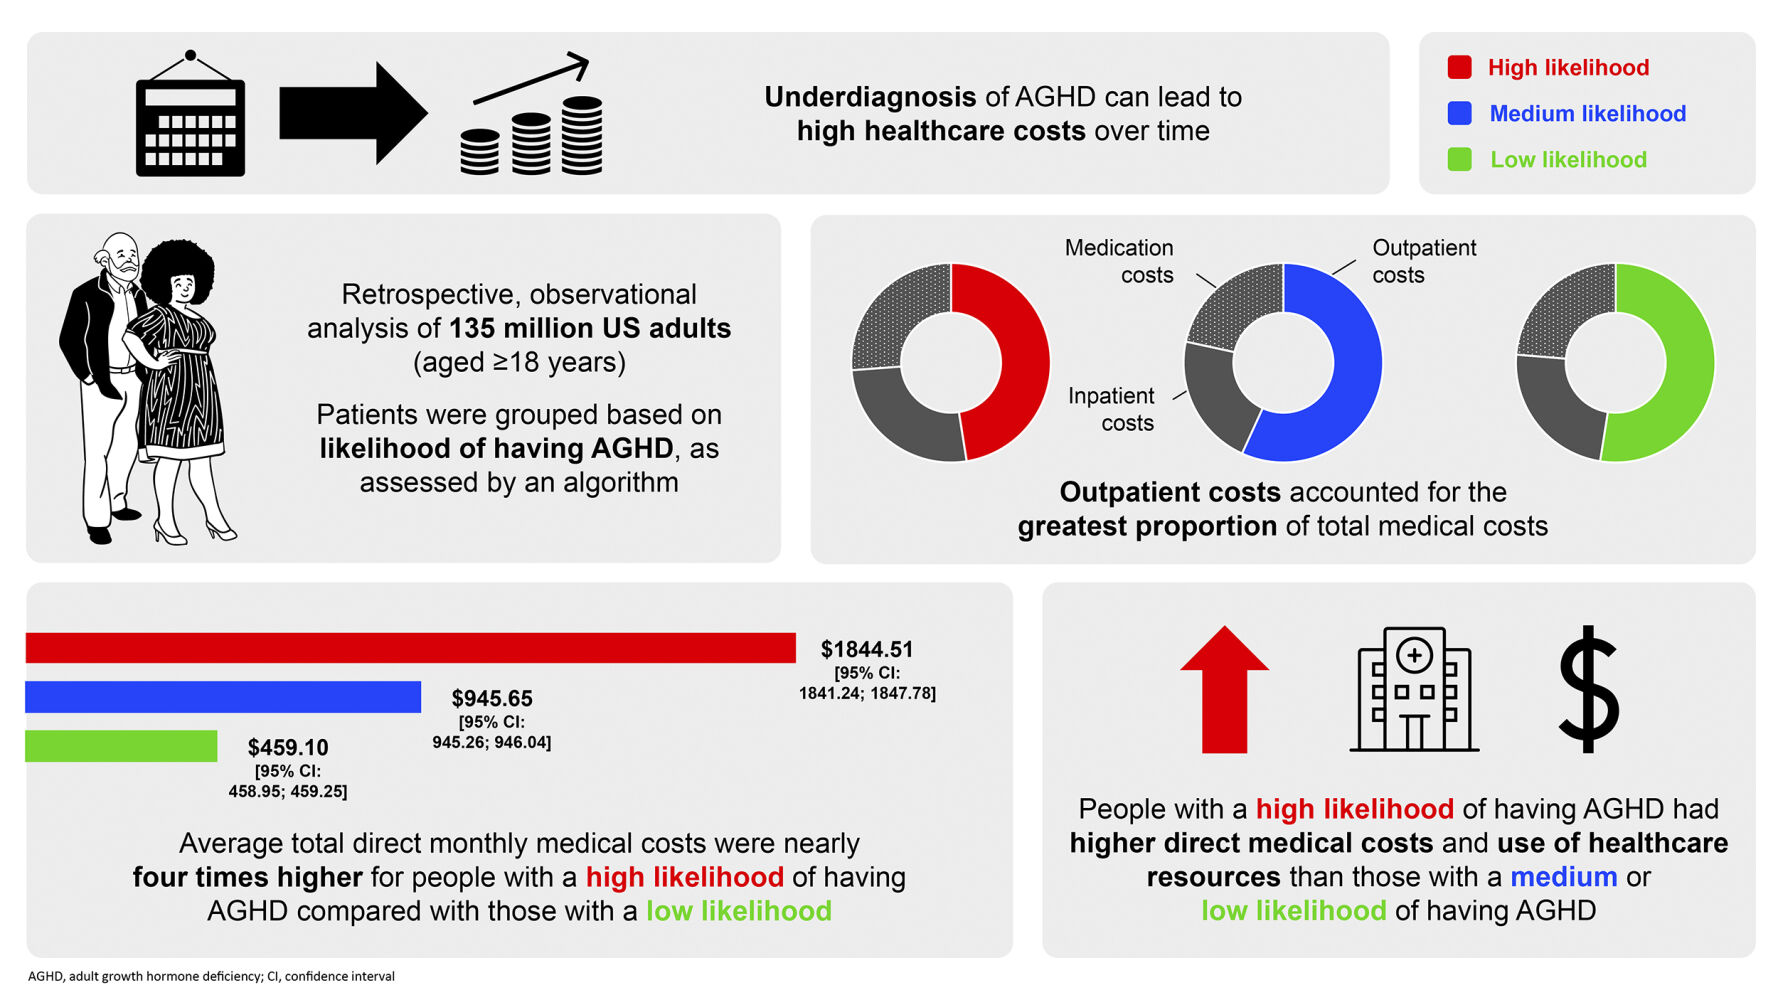
Purpose: Adult growth hormone deficiency (AGHD) is often underdiagnosed and undertreated, leading to costly comorbidities. Previously, we developed an algorithm to identify individuals in a commercially insured US population with high, moderate, or low likelihood of having AGHD. Here, we estimate and compare direct medical costs by likelihood level.
Patients and Methods: Retrospective, observational analysis using the Truven Health MarketScan database to analyze direct medical costs relating to inpatient and outpatient claims, outpatient prescription claims, medication usage, clinical utilization records, and healthcare expenditures. Patients were categorized into groups based on algorithmically determined likelihoods of AGHD. Likelihood groups were further stratified by age and sex. Trajectories of annual costs (USD) by likelihood level were also investigated.
Results: The study cohort comprised 135 million US adults (aged ≥ 18 years). Individuals ranked as high-likelihood AGHD had a greater burden of comorbid illness, including cardiovascular disease and diabetes, than those ranked moderate- or low-likelihood. Those in the high-likelihood group had greater mean total direct medical monthly costs ($1844.51 [95% confidence interval (CI): 1841.24;1847.78]) than those in the moderate- ($945.65 [95% CI: 945.26;946.04]) and low-likelihood groups ($459.10 [95% CI: 458.95;459.25]). Outpatient visits accounted for the majority of costs overall, although cost per visit was substantially lower than for inpatient services. Costs tended to increase with age and peaked around the time that individuals were assigned a level of AGHD likelihood. Total direct medical costs in individuals with a high likelihood of AGHD exceeded those for individuals with moderate or low likelihood.
Conclusion: Understanding the trajectory of healthcare costs in AGHD may help rationalize allocation of healthcare resources.
Plain Language Summary: Growth hormone is an important substance found in the body. Adult growth hormone deficiency (AGHD) is the reduced production of growth hormone unrelated to the normal reduction seen with aging. Untreated AGHD can result in the development of other conditions, known as comorbidities, which can be expensive to manage.
Previously, 135 million privately insured people in the US, aged 18– 64 years, were categorized into groups by their likelihood (high, medium, or low) of having AGHD. This study compared the estimated direct medical costs (eg hospital care and medication) across the different likelihood levels. People with a high likelihood of AGHD had more comorbidities than people with a medium/low likelihood, and an average total direct medical monthly cost of $1844.51, nearly twice as much as those with a medium likelihood ($945.65), and four times as much as those with a low likelihood ($459.10). These costs tended to increase with age, with the highest costs associated with people aged 50– 59 years and 60– 64 years. Outpatient costs (for treatments not requiring an overnight hospital stay) accounted for the greatest proportion of total medical costs, ahead of inpatient costs (for treatments requiring an overnight hospital stay) and medication costs.
These findings suggest that diagnosing and treating AGHD earlier may help to reduce medical costs over time. Increased testing and treatment will cause an initial increase in the use of healthcare resources, but could improve overall cost effectiveness by reducing the long-term impact of the disease and avoiding unnecessary healthcare use.
Keywords: AGHD, cost of comorbidities, cost of disease, likelihood of AGHD, medical costs, Truven Health MarketScan database
Graphical Abstract:
Introduction
Adult growth hormone deficiency (AGHD) is characterized by decreased secretion of growth hormone (GH) not associated with aging. It may persist from childhood or be acquired in adulthood.1,2 Causes of AGHD are broad, including brain/pituitary tumors, genetic defects, brain surgery and irradiation, traumatic brain injury, and rare infections, such as tuberculosis.2–4 AGHD is associated with a reduced quality of life, impaired sense of wellbeing, and a range of comorbidities, including increased cardiovascular morbidity and mortality, neuropsychiatric–cognitive deficits, adverse body composition, and metabolic and bone abnormalities.1,5–11 Despite the fact that these comorbidities have been well known and well documented over the past three decades, AGHD still remains underdiagnosed and undertreated.12–14 A lack of validated biomarkers and easily performed diagnostic tests, and the overlap of symptoms with normal aging and metabolic syndrome, means that the true incidence rate of AGHD is likely to be underestimated.1,12,14–17 A lack of awareness of AGHD among clinicians, particularly non-endocrinologists, is another obstacle in referring potential patients for diagnostic work-up.16,17
Studies designed to determine the incidence and prevalence of AGHD are limited.18 In the US, an estimated 6000 people are diagnosed with AGHD annually,14 an incidence rate of ~1 per 50,000. In Denmark, combined analysis of three nationwide registries estimated the annual incidence rate of AGHD to be 1–2 per 100,000 people,12 with a higher incidence rate in males compared with females, and in those aged above 45 years.12
Patients diagnosed with AGHD should be treated with GH replacement therapy to correct metabolic abnormalities and impaired quality of life.1,2,19 GH replacement therapy can reduce the societal impact of AGHD, such as healthcare resource consumption (physician visits, days in hospital) and non-medical burden (sick leave duration).1,20–22 However, GH therapy may not completely reverse the burden of AGHD to patients, healthcare systems (including payers and insurance providers), and employers.23
Although there are few detailed evaluations of healthcare costs linked to AGHD, the economic burden of AGHD is substantial.24 This is driven largely by costly medical conditions associated with AGHD, although the direct connection between costs per condition appears to lack definition. For example, the lifetime direct and indirect costs associated with traumatic brain injury are estimated to be (USD) $0.6–1.9 million per person.14 Patients with Cushing’s syndrome (CS), who have or may develop AGHD, can accrue annual healthcare costs of almost $35,000, of which ~40% are directly due to CS,25 and, among patients undergoing trans-sphenoidal pituitary surgery, direct medical costs have been estimated to be ~$20,000 per case.26 In addition, productivity losses are associated with the condition; most patients with AGHD are of working age and untreated AGHD can severely impair their ability to work.24
While patients with AGHD consume more healthcare resources than those without,24 we do not know the direct medical costs associated with AGHD, its consequences, and its management. While drug costs are the major driver of treatment-related health expenditures,27 GH replacement therapy can help to reduce the societal and economic burden of AGHD.2,21,22,24,28 Given the likely under-recognition and under-treatment of AGHD and the consequent lack of understanding of its overall economic burden, methods for identifying individuals who are likely to have or to develop AGHD are needed. To fill this gap, we previously developed an algorithm using patient information (eg, diagnoses, medication) to identify people with a high, moderate, or low likelihood of having AGHD in a commercially insured population in the US.18 This algorithm may be used by healthcare providers to identify patients who would potentially benefit from diagnostic tests and subsequent treatment.18 Understanding of the economic burden of having AGHD would help healthcare professionals and payers to allocate funds for patients who do not yet have a formal diagnosis of AGHD, thereby potentially reducing the future burden of AGHD.
To gain insight into medical costs possibly associated with AGHD, we have extended our research to estimate direct medical costs associated with the high, moderate and low likelihood of having AGHD in the same patient population. Our aim was to indicate the level of possible costs that may be avoided by better diagnostic testing and treatment of individuals with an identified higher likelihood of having AGHD.
Materials and Methods
Study Design
We performed a retrospective, observational analysis using health and cost data from the Truven Health MarketScan Commercial Claims and Encounters Database and the Medicare Supplemental and Coordination of Benefits Database (hereafter referred to as the Truven database). The Truven database comprises de-identified patient-level data organized in a manner that ensures data privacy and only contains fully paid health claims. All cost data in the Truven database were adjusted to January 2020 values.
The study cohort in the Truven database consisted of 135 million US adults aged ≥18 years as of 31 December 2017 (the index date) and with medical records listed for at least 6 months prior to this date. Using an algorithm (described in detail previously18 and summarized in Supplementary Table S1), we categorized the cohort into groups by their likelihood of having AGHD. Individuals of between 18 and 65 years of age were identified as being at high, moderate, or low likelihood of having AGHD based on assessment of diagnostic codes in the International Classification of Diseases, as well as current procedural terminology codes for diagnostic test and anatomical therapeutic chemical codes for medications.18 It should be noted that information on actual diagnoses of AGHD was not available. The high-likelihood group will have included some patients with diagnosed AGHD, but most of those in the high-likelihood group did not meet all of the criteria for a diagnosis of AGHD.
Analyses
Data for baseline demographics and clinical characteristics contained in the Truven database were analyzed by level of likelihood of having AGHD. This included a detailed analysis of overall health status using comorbidity scores and associated specific illnesses and treatments. In addition, because the investigated population included women of childbearing age, we included an analysis of costs associated with pregnancy care (routine care and procedures). The primary analysis was an estimation of direct medical costs associated with likelihood of having AGHD, both overall costs and those associated with accessing inpatient and outpatient healthcare services, as well as those arising from prescription of medications. In addition, we estimated the costs among the differing likelihood groups (defined below) according to age (≥18–<30, ≥30–<40, ≥40–<50, ≥50–<60, or ≥60–<65 years) and sex (male versus female).
We then estimated total direct medical costs associated with likelihood of having AGHD, reported as values per patient per month (USD, $), averaged over the entire analysis period, relating to inpatient and outpatient claims, outpatient prescription claims, medication usage, laboratory tests, clinical utilization records, and healthcare expenditures (including pregnancy where relevant). The average drug cost per patient per month in each category was calculated by summing the total cost and dividing by the total observational time.
Preliminary analyses indicated that GH therapy was prescribed to 2.2% of the high-likelihood group.18 The cost of GH therapy was included in the total cost analysis, but the low prescription rate meant that it was not considered to be a major cost element in the specific analysis of this cohort and was not reported separately.
As well as averaged costs, we investigated annual cost trajectories. For the low-likelihood group, which was the default group for all patients entering the database, trajectories were derived for the 10 years starting from the index date. For the moderate- and high-likelihood groups, trajectories were analyzed for up to 10 years before and after year 0 (a date that is individual for each patient, corresponding to the time of diagnosis of a condition re-categorizing them from the low-likelihood group into the high- or moderate-likelihood groups).
For inpatient and outpatient visits, further analyses were performed to determine the average visits per patient overall and by sex, as well as trajectories for patients requiring healthcare access and the costs per visit.
Statistical Analysis
The average cost values (USD, $, per month per patient) were calculated as an ordinary average with a Gaussian distribution. Confidence intervals (CIs) were calculated using the usual Z-value expressions, and comparisons were made using t-tests. Effect size was calculated for the standardized mean difference (SMD) between the different levels of likelihood. For comorbidity variables, a standardized difference of ≤0.2 was considered negligible due to the binary variables analyzed in this study.29
Ethics
This was a retrospective database study without prospectively enrolled participants. All database records are de-identified and fully compliant with US patient confidentiality requirements, including the Health Insurance Portability and Accountability Act of 1996. The data used for this study did not involve the interaction or interview with any subjects, and the data does not include any individually identifiable data; as such, this is not research involving human subjects. Accordingly, ethical approval was not required for this study.
Results
Study Cohort Characteristics and Health Status by AGHD Likelihood
Most individuals included in the Truven database were considered to be at low likelihood of having AGHD (93.6%), with 6.0% considered at moderate and 0.5% at high likelihood of having AGHD.18 The baseline and clinical characteristics are summarized in Table 1 and Supplementary Tables S2 and S3.
 |
Table 1 Clinical Characteristics Within 1 Year Prior of Individuals Being Categorized into Either the High-, Moderate-, or Low-Likelihood Groupa |
There were marked differences between groups in health status, with those in the high-likelihood group having a higher frequency of comorbid conditions and requirement for medications than in the other-likelihood groups (Table 2 and Supplementary Tables S2 and S3). The 10-year mortality risk, as calculated using the Charlson Comorbidity Index (CCI), revealed a difference between individuals in the high- (mean CCI score 1.4) and moderate-likelihood (mean CCI score 0.4) groups (SMD −0.37) but not between those in the moderate- and low-likelihood groups (mean CCI score 0.4 versus 0.2, respectively; SMD −0.06) (Table 2). Both the CHA2DS2-VASc score (risk of stroke in people with atrial fibrillation) and the Diabetes Complications Severity Index (DCSI) score indicated worse health in the high-likelihood group compared with the moderate-likelihood group, although the between-group differences were smaller than for the CCI (SMD <0.20) (Table 2).
 |
Table 2 Comorbidity Risk Scores Within 1 Year Prior to Individuals Being Categorized into Either the High-, Moderate-, or Low-Likelihood Group |
The incidences of comorbidities observed in the high- and moderate-likelihood AGHD groups were similar overall (SMD <0.2), with the exception of hyperlipidemia, hypertension, heart disease, hematologic neoplasm, and malignant tumor of breast (Supplementary Table S2). No differences in the incidence of comorbidities were evident when comparing the moderate- and low-likelihood AGHD groups.
Medication use was similar overall between the high- and moderate-likelihood groups (SMD <0.2), apart from antithrombotic agents, antineoplastic agents, opioids, and psycholeptics (Supplementary Table S3). There were no differences in medication use between the moderate- and low-likelihood AGHD groups (SMD <0.2).
Regarding pituitary conditions, there were no clear differences between the groups overall, except for pituitary tumors (5.0% of patients in the high-likelihood group versus 0.1% and 0.0% in the other groups; SMD of −0.31 and −0.32 for high- versus moderate- and low-likelihood groups, respectively). Likewise, 4.1% of patients in the high-likelihood group received radiation therapy versus 0.1% and 0.0% in the other groups (SMD −0.29 in both cases), but there were no other notable differences (Supplementary Table S2).
Only small differences were observed between groups in duration of observation period (Supplementary Figure S1) and in the start and end dates relative to the categorization date (Supplementary Figure S2).
Primary Analyses: Direct Medical Costs Associated with Likelihood of Having AGHD
Total direct medical monthly costs were approximately two-fold higher for individuals in the high-likelihood group ($1844.51) compared with the moderate-likelihood group ($945.65), which were two-fold higher compared with the low-likelihood group ($459.10) (Figure 1a).
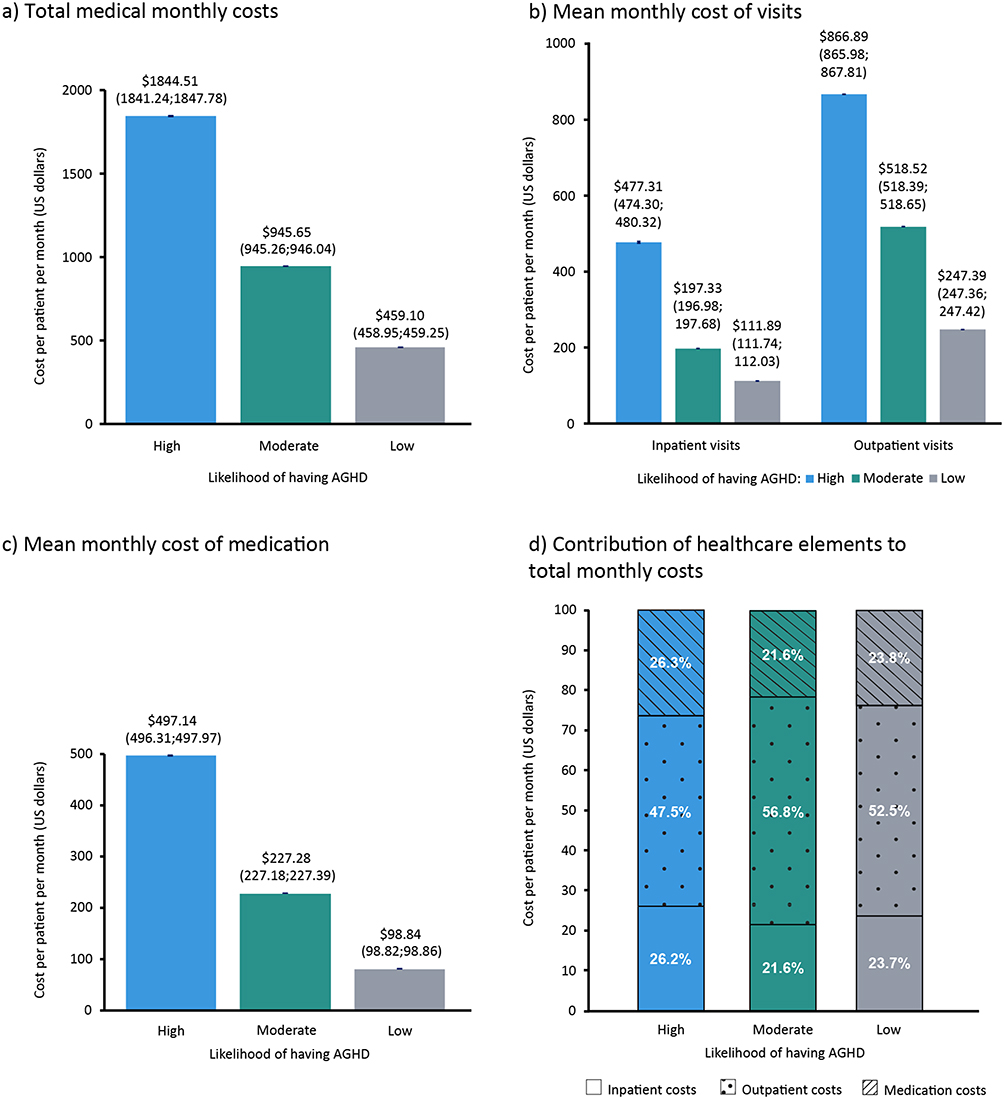 |
Figure 1 Mean monthly direct medical costs for people in the groups identified as having a high, moderate, or low likelihood of AGHD. Data are presented as the average cost over the analysis period in USD ($) per patient per month for each level of likelihood as follows: (a) Total medical costs, (b) Inpatient and outpatient costs, (c) Medications, and (d) Costs per healthcare element expressed as a percentage of the total direct medical costs (error bars/values in parentheses indicate 95% confidence intervals). Abbreviation: AGHD, adult growth hormone deficiency. |
The mean monthly cost of healthcare resources utilized during outpatient visits was greater for all likelihood groups than the associated cost for inpatient visits (Figure 1b).
Specifically for inpatient-related costs, the population mean monthly values of healthcare resources were largest in the high-likelihood group ($477.31) compared with those for the moderate- and low-likelihood groups ($197.33 and $111.89, respectively). Likewise, costs associated with outpatient visits were highest among individuals in the high-likelihood group ($866.89, compared with $518.52 for the moderate-likelihood and $247.39 for the low-likelihood groups).
When comparing the population mean costs related to medications, the high-likelihood group had the greatest monthly cost: $497.14 versus $227.28 and $98.84 for the moderate- and low-likelihood groups, respectively (Figure 1c). When costs associated with inpatient and outpatient visits and medications were expressed as a percentage of total direct medical costs, inpatient visits, and prescribed medications accounted for a greater proportion of the total in the high-likelihood group than among either moderate- or low-likelihood individuals (Figure 1d).
Direct Medical Costs Among AGHD Risk-Stratified Groups by Age and Sex
In each of the likelihood groups, there was a trend towards higher annual costs with increasing age (Supplementary Figure S3a). For example, among individuals with a high likelihood of having AGHD, total costs were lowest for those in the youngest age category (≥18–<30 years; $1503.50 [95% CI: 1487.90; 1519.10]), compared with the oldest age category (≥60–<65 years; $1887.34 [95% CI: 1880.22; 1894.47]). This trend to high direct medical costs per patient associated with likelihood of AGHD was observed for inpatient and outpatient resource consumption and drug prescriptions (Supplementary Figure S3b and S3c). Numerically, the highest per-patient costs in the high-likelihood group were for outpatient visits, from a low of $675.12 per patient per month among those aged ≥18–<30 years, to $962.84 in those aged ≥50–<60 years (Supplementary Figure S3b).
Medications accounted for a higher proportion of total medical costs in the high-likelihood group versus moderate- and low-likelihood groups, and with a tendency to account for more of the total costs as age increased (Supplementary Figure S3d).
There was a trend towards higher total annual costs per patient for males versus females for the high- and moderate-likelihood group (Supplementary Figure S4a). In both sexes, there was an approximate doubling of costs from low to moderate, and from moderate to high, likelihood of having AGHD (Supplementary Figure S4a); this pattern was also observed for outpatient visits (Supplementary Figure S4b), which accounted for the majority (approximately 60%) of the non-medication-related costs, as well as inpatient and medication-related costs (Supplementary Figure S4c and S4d). Overall, the cost of outpatient visits tended to be slightly higher for females, while the cost of inpatient visits tended to be higher for males (Supplementary Table S4).
Additionally, we estimated the costs associated with pregnancy in each AGHD likelihood group. These costs were a composite of those associated with routine visits and procedures recorded for pregnancies in women in the population being studied. Given the high mean age in all likelihood groups, the average monthly costs per patient related to pregnancy were low overall, between $10 and $25 per month, which is less than one-twentieth of the costs for inpatients and outpatients for non-pregnancy health matters.
Medication-associated costs were higher among males than females in elevated AGHD likelihood groups: $575.64 [95% CI: 574.10; 577.17] and $448.09 [95% CI: 447.15; 449.04], respectively, in the high-likelihood group, and $293.62 [95% CI: 293.40; 293.85] and $200.86 [95% CI: 200.74; 200.97], respectively in the moderate-likelihood group. However, in the low-likelihood group, medication-related costs were marginally higher among females ($110.32 [95% CI: 110.29; 110.35]) than males ($87.23 [95% CI: 87.20; 87.26]) (Supplementary Figure S4c, Supplementary Table S4). The trend to higher costs in individuals with a high or moderate likelihood of AGHD for males versus females was also noted for inpatient costs, as well as the proportion of costs related to medications (Supplementary Figure S4d, Supplementary Table S4).
Comorbidities in the year prior to individuals being categorized into the high- or moderate-likelihood groups were analyzed by sex (Supplementary Table S5). It was observed that rates of cardiovascular and metabolic comorbidities were higher among males versus females in these groups, with the exception of stroke (Supplementary Table S5). This was also associated with increased use of prescribed medications.
Annual Cost Trajectories by Likelihood of Having AGHD
We analyzed trends over time of healthcare expenditure with reference to year 0 (Figure 2).
 |
Figure 2 Annual mean cost trajectory for each level of likelihood of AGHD. Data per year are presented for high- and moderate-likelihood groups for the period of 10 years before (−10 years) and after (+10 years) year 0, and for the low-likelihood group over 10 years from the index date for (a) Total direct medical costs in the previous year, (b) Inpatient and outpatient visit costs in the previous year, and (c) Medication-related costs in the previous year. Abbreviation: AGHD, adult growth hormone deficiency. |
Throughout the periods evaluated, direct medical costs per year in the high-likelihood group exceeded those in the moderate-likelihood group; costs in the moderate-likelihood group in the pre-year 0 period were only marginally higher than those in the low-likelihood group (Figure 2). Overall, total direct medical costs associated with likelihood of AGHD per patient per year gradually increased over the 20-year period, from $5428 to $13,551, with a peak of $23,287 at year 0 in the high-likelihood group, and from $1804 to $10,563 in the moderate-likelihood group (Figure 2a). Over 10 years, costs in the low-likelihood group increased modestly (from $3898 to $5174). Similar trajectories were observed for inpatient and outpatient costs and for medication-related costs (Figure 2b and c), although the annual rate of medication-related costs increased more in the moderate- compared with the high-likelihood group.
Although the costs increased over the whole period, we observed peak in costs per year between years −2 and +2 for total inpatient and outpatient costs among patients with a high likelihood of having AGHD, followed by a levelling of annual costs for the remainder of the analysis period (Figure 2a and b). Costs per year among the moderate-likelihood group tended to increase year on year, with no clearly defined peak (Figure 2a and b); the rate of increase was greatest in the years −2 and −1.
Regarding medication-related costs, a steep increase was seen during the 3 years preceding year 0 in the high-likelihood group, but there was no peak (Figure 2c).
Inpatient- and Outpatient-Associated Medical Costs: Further Analyses of Likelihood Groups
Additional data analyses were undertaken to understand the differences in costs per month per patient in each likelihood group for inpatient and outpatient visits. We excluded medication costs, as they were rarely associated with individual visits. Overall, patients had substantially more outpatient than inpatient visits over the period of the analysis (Supplementary Figure S5a). Visits by male and female patients are shown in Supplementary Figure S5b. The proportions of individuals requiring visits are shown in Figure 3a. These observations were reflected in the trajectory over time for the number of visits per patient (Figure 3b). However, the records showed that costs per visit were much higher for accessing inpatient compared with outpatient services. Consequently, the cost per visit was found to be around 50 times higher for inpatient versus outpatient visits (Figure 3c).
 |
Figure 3 Cost and health visits over time by level of AGHD likelihood. Data per year are presented for high- and moderate-likelihood groups for the period of 10 years before (−10 years) and after (+10 years) year 0, and for the low-likelihood group over 10 years from the index date for (a) The percentage of each likelihood group having a visit at some time in the previous year, (b) The average number of visits per patient in the previous year in each likelihood group and (c) The cost (USD, $) of each visit per patient per year. Abbreviation: AGHD, adult growth hormone deficiency. |
Discussion
Using the Truven database of healthcare records, we characterized the total direct medical costs of healthcare for people with high likelihood versus moderate and low likelihood of having AGHD, investigated the relative contributions of inpatient and outpatient visits and prescribed medications, and mapped out the annual cost trajectory in these patients over time.
We found that the high-likelihood group incurred significantly greater overall mean direct medical costs ($1844.51 per patient per month) compared with the moderate- and low-likelihood groups ($945.65 and $459.10, respectively). As those in the high-likelihood group had the greatest rates of comorbidities, poorest levels of health, and highest rates of medication use, the impact of AGHD likelihood on direct medical costs is to be expected. However, we found that the occurrence of pituitary conditions and associated clinical procedures did not differ substantially between the groups, except for a higher rate of pituitary tumors in the high-likelihood group.
Overall, outpatient visits accounted for the largest proportion of direct medical costs in the likelihood groups (around 54% for the low- and moderate-likelihood groups and 47% in the high-likelihood group). Between one-fifth and one-quarter of total costs were due to accessing inpatient services or receiving medications in all groups.
Costs overall and by source increased year on year in all likelihood groups, although there was a pronounced peak in the total medical costs, as well as healthcare visits, in the high-likelihood group, occurring in the 4 years centered around year 0. Increasing costs over time are reflective of the growing burden of age-related health problems typically observed in the general population. Our results suggest that, during the period around year 0, elevated rates of physician visits, hospitalizations, and associated care and procedures were required for this group of patients. Because the rates of comorbidities were higher and the level of health was generally worse in the high- versus lower-likelihood groups, these costs are probably driven by healthcare resource use not directly related to AGHD. Indeed, studies have shown that the costs of individual diseases were substantially higher in patients with comorbidities, demonstrating that the interaction of different diseases leads to overall cost increases.30 Furthermore, chronic conditions such as cardiovascular disease and diabetes, which occurred at substantially higher rates in the high-likelihood group, are among the most expensive health conditions to treat in the US.31 To determine the exact drivers of costs during the period of peak costs and their relationship to the diagnostic process for AGHD, additional studies using patient-level data would be required. As part of improving AGHD care through increased awareness and management with defined clinical endpoints,1,2,16,17 understanding the use of and implications for elevated healthcare resource consumption will be important in improving patients’ access to health assessments and appropriate care in this context. Although GH replacement therapy was not reported separately in this assessment, drug-related costs were greatest among those with a high likelihood of AGHD, with high proportions of costs due to medications found across the age range, including the youngest patients. This accords with the observation that patients in the high-likelihood group tended to have worse overall health than those in the other groups.
Our results show that the burden of pituitary conditions and associated procedures was mostly similar between those with low and moderate likelihood of having AGHD, indicating that the major drivers of the overall cost differences found may not be directly due to AGHD per se in these cases. However, in the high-likelihood group, rates of pituitary tumor and requirements for neurosurgery and radiotherapy versus the other groups, may account for some of the cost burden in this cohort. These observations need to be studied in prospective trials involving people diagnosed with AGHD to fully understand the implications of disease and its consequences on cost burden.
There were more females than males in the groups likely to have AGHD. The per-patient costs were higher for males than females in the high- and moderate-likelihood groups. This finding was unexpected, given that women typically use more healthcare services and accrue greater healthcare costs than men.32 This may partly by explained by the absence of data from government-funded healthcare programs such as Medicaid in the Truven database, as women tend to be the largest beneficiaries of these programs.32–34 The observed difference may be related to the higher likelihood of males to receive medications, particularly for diabetes management, in line with higher rates of cardiovascular comorbidities seen among males than females. Also, males in the moderate-likelihood group tended to be older than the females (Supplementary Table S5) and may therefore have experienced higher costs as a consequence.
In the primary analysis, the costs associated with pregnancy were not included. However, AGHD can adversely impact upon fertility,35 and hormonal biochemical evaluation might be more often requested for women rather than men, and therefore impact upon healthcare resource use. In a separate analysis, we found that costs per month due to pregnancy-related visits and procedures were very low compared with those for other health issues, probably because of the age of the people in the study, and would not account for the sex-based differences observed. Consequently, pregnancy itself is unlikely to have contributed to the observations made in this study regarding cost differences for men versus women, as might be expected from this cohort in which the majority of patients were ≥40 years of age.
The outpatient costs per patient per month were observed to be greater than inpatient costs for both moderate- and high-likelihood groups. However, hospitalization is known to be a major driver in healthcare resource use in general,36,37 so this finding appeared counterintuitive. To address this, we performed further analyses to understand the role played by the number of visits, the proportion of patients accessing healthcare services, and the medical cost per visit to explain why outpatient costs per patient per month were higher than inpatient costs. We found that costs for hospitalization were more than 50 times greater than those for outpatient visits; however, outpatient services were accessed far more frequently than hospitalization occurred (ie, approximately 20 outpatient visits annually compared with fewer than one hospitalization per year per individual). As previously mentioned, identification of exact drivers of costs for patient visits would require patient-level data, which are not available from the database. The contribution of different factors to the cost of outpatient visits is therefore difficult to ascertain. Other possible limitations of outpatient treatment that are difficult to identify in the database include issues with monitoring adherence, difficulty in accounting for prescription costs in different geographical regions and whether some patients were eligible for discounts or free refills, or whether some individuals had access to certain treatments that were not available to others.
When considering the trajectories of costs over time, it is noteworthy that there was a distinct peak in annual costs around the index data for the high-likelihood group, and that a similar, if less pronounced, effect was observed for the number of health visits. This is to be expected in an event-driven analysis around the time of a qualifying event. The steep increase in costs indicates that this period around the index event is often dominated by expensive multiple comorbidities, the economic consequences of which then stabilize over time. Distinct from this, the moderate-likelihood group was associated with progressively increasing annual costs and health visits year on year, with a disproportionately large annual increment in the year before the index date and continuing increases for the next 2 years. Given that individuals in the high-likelihood group tended to be categorized as such sooner than those in the moderate-likelihood group, and that the latter group tended to be observed for longer after the index date, it might be deduced that people with a high likelihood of having AGHD are more likely to be directed into appropriate diagnostic and care pathways sooner than others.
A major strength of this study is the size of the established Truven database, which includes data from 135 million US citizens and offers a holistic picture of health status and healthcare resource use per patient. Nevertheless, the sample of patients with pituitary disorders was comparatively small, with 0.5% of individuals classified as highly likely to have AGHD according to the algorithm.18 Extending our investigations to other data sources, such as the NordiNet International Outcome Study38 and KIMS39 databases of GH-related disorders, could provide additional insights into costs in a focused group of individuals such as those with diagnosed AGHD. The use of artificial intelligence may also prove useful in applying our algorithm to a wider patient population with known or suspected AGHD.
Some limitations of this study should be acknowledged. Incomplete or inconsistent data collection is a feature of all healthcare databases. A particular limitation of the Truven database is that it predominantly covers individuals who have some form of employer-based health insurance, and is therefore not representative of the entire population, for example those receiving Medicaid insurance.40 We would expect that emergency room visits and inpatient medication use data to be subject to some of these limitations, although we cannot quantify their impact. In addition, the cohort is likely to be representative of the managed-healthcare population but may not be fully representative of the full, general, US population, nor of patients in other countries with different healthcare systems, such as nationally funded health services. Further investigation into direct costs associated with specific types of diagnostic testing and treatment for patients at a higher likelihood of having AGHD, including those in different geographical regions, is warranted, with the aim of determining which method carries most burden versus which is most appropriate in these individuals.
As mentioned above, the study did not identify patients with confirmed AGHD in the database. The algorithm used to assign patients in the Truven database with a likelihood of having AGHD used criteria such as diagnoses, diagnostic tests, and prescribed medications.18 A limitation of this algorithm is that it could not be validated against actual diagnoses of AGHD, as this information is not available in the Truven database, thus only correlation, and not causation, can be demonstrated for AGHD and its associated costs. This may explain why the percentage of patients categorized as having a high likelihood of having AGHD is higher than the estimated population average (prevalence of 2–3 per 10,000 population [0.02% to 0.03%]). Additionally, the cost trajectory of those with a high likelihood of AGHD may at least partly reflect the increased medical needs of an older population (Supplementary Figure S3). Ultimately, prospective studies are needed to demonstrate the social, economic, and medical cost impact of GH replacement in patients diagnosed with AGHD.
Conclusions
The total cost of care for patients with a high likelihood of AGHD is significantly higher than those for patients with moderate or low likelihood. Furthermore, the long-term cost trajectory for patients actually decreased upon diagnosis of a condition that moved them into the moderate- or high-likelihood groups. Future studies to investigate the benefit of identifying patients with AGHD early on are warranted, as the diagnosis and appropriate treatment could potentially alter the cost trajectory. Although increased testing and treatment (including GH therapy) will increase healthcare resource use, it may help people with an elevated likelihood of having AGHD to obtain appropriate diagnosis, support, and treatment, as well as offering potential cost efficiencies by directly reducing the burden of disease and associated avoidable healthcare resource utilization.
Abbreviations
AGHD, Adult Growth Hormone Deficiency; CCI, Charlson Comorbidity Index; CHA2DS2VASc, Score for atrial fibrillation stroke risk; CI, Confidence Interval; DCSI, Diabetes Complications Severity Index; CS, Cushing’s Syndrome; GH, Growth Hormone; SD, Standard Deviation; SMD, Standardized Mean Difference.
Data Sharing Statement
Data are subject to third-party restrictions. The data that support the findings of this study are available from a third party (International Business Machines Corporation). Restrictions apply to the availability of these data, which were used under license for this study. Data can be acquired through licenses from the vendor.
Compliance with Ethics Guidelines
This was a retrospective database study without prospectively enrolled participants. All database records are de-identified and fully compliant with US patient confidentiality requirements, including the Health Insurance Portability and Accountability Act of 1996. The data used for this study did not involve the interaction or interview with any subjects and the data does not include any individually identifiable data and, as such, is not research involving human subjects. Accordingly, ethical approval was not required for this study.
Acknowledgments
Data from the Truven database were supplied by International Business Machines Corporation. Any analysis, interpretation, or conclusion based on these data is solely that of the authors and not of International Business Machines Corporation. The authors thank Teddy Sun and Kai Wai Lee, formerly of Novo Nordisk, for their contributions to early drafts of this manuscript and Navid Nedjatian of Novo Nordisk for his review of and input to the manuscript.
Medical writing and editorial support for the development of this manuscript, under the direction of the authors, were provided by Sonia Vyskocilova, PhD, and Helen Marshall, BA, of Ashfield MedComms, and David Floyd, PhD, on behalf of Ashfield MedComms, funded by Novo Nordisk.
Author Contributions
All authors made a significant contribution to the work reported, whether that is in the conception, study design, execution, acquisition of data, analysis and interpretation, or in all these areas; took part in drafting, revising or critically reviewing the article; gave final approval of the version to be published; have agreed on the journal to which the article has been submitted; and agree to be accountable for all aspects of the work.
Funding
This study, medical writing support, and Rapid Service Fee were funded by Novo Nordisk. The sponsor reviewed drafts of the manuscript for medical and scientific accuracy.
Disclosure
KCJY has received research grants to the Barrow Neurological Institute from Ascendis, Crinetics, Corcept, Sparrow Pharmaceuticals, and Amryt; served as occasional advisory board member for Novo Nordisk, Ascendis, Ipsen, Amryt, Recordati, Xeris and Crinetics; served as occasional speaker for Novo Nordisk and Recordati. LSB and JMK have nothing to disclose. DRC has acted as a consultant for Novo Nordisk. MFa and JMT are employees and stockholders of Novo Nordisk. ARH has acted as consultant for Ascendis and Novo Nordisk. NK is an employee of Novo Nordisk; and holds stocks in Novo Nordisk and Pfizer. MFl has received research support for her institution from Ascendis; received occasional consulting honoraria from Ascendis, Novo Nordisk, and Pfizer, and is part of the Pituitary Society Board of Directors.
References
1. Yuen KCJ, Biller BMK, Radovick S, et al. American association of clinical endocrinologists and American college of endocrinology guidelines for management of growth hormone deficiency in adults and patients transitioning from pediatric to adult care. Endocr Pract. 2019;25(11):1191–1232. doi:10.4158/GL-2019-0405
2. Molitch ME, Clemmons DR, Malozowski S, Merriam GR, Vance ML. Evaluation and treatment of adult growth hormone deficiency: an endocrine society clinical practice guideline. J Clin Endocrinol Metab. 2011;96(6):1587–1609. doi:10.1210/jc.2011-0179
3. Boguszewski CL. Update on GH therapy in adults. F1000Research. 2017;6:2017. doi:10.12688/f1000research.12057.1
4. Lam KSLS, K. MM, Tam SCF, Ng MMT, Ma HTG. Hypopituitarism after tuberculous meningitis in childhood. Ann Internal Med. 1993;118(9):701–706. doi:10.7326/0003-4819-118-9-199305010-00007
5. Stochholm K, Laursen T, Green A, et al. Morbidity and GH deficiency: a nationwide study. Eur J Endocrinol. 2008;158(4):447–457. doi:10.1530/EJE-07-0523
6. Thomas JD, Monson JP. Adult GH deficiency throughout lifetime. Eur J Endocrinol. 2009;161 (Suppl 1):S97–S106. doi:10.1530/EJE-09-0258
7. Gupta V. Adult growth hormone deficiency. Indian J Endocrinol Metab. 2011;15(Suppl 3):S197–202. doi:10.4103/2230-8210.84865
8. Hazem A, Elamin MB, Bancos I, et al. Therapy in endocrine disease: body composition and quality of life in adults treated with GH therapy: a systematic review and meta-analysis. Eur J Endocrinol. 2012;166(1):13–20. doi:10.1530/EJE-11-0558
9. Fukuda I, Hizuka N, Muraoka T, Ichihara A. Adult growth hormone deficiency: current concepts. Neurol Med Chir. 2014;54(8):599–605. doi:10.2176/nmc.ra.2014-0088
10. McGauley GA, Cuneo RC, Salomon F, Sönksen PH. Psychological well-being before and after growth hormone treatment in adults with growth hormone deficiency. Horm Res. 1990;33(Suppl 4):52–54. doi:10.1159/000181584
11. Tritos NA, Biller BMK. Current concepts of the diagnosis of adult growth hormone deficiency. Rev Endocr Metab Disord. 2021;22(1):109–116. doi:10.1007/s11154-020-09594-1
12. Stochholm K, Gravholt CH, Laursen T, et al. Incidence of GH deficiency - A nationwide study. Eur J Endocrinol. 2006;155(1):61–71. doi:10.1530/eje.1.02191
13. Nedjatian N, den Hollander B, Amirouche Y. Country-specific differences in adult growth hormone deficiency diagnosis and treatment rates.
14. Reed ML, Merriam GR, Kargi AY. Adult growth hormone deficiency - benefits, side effects, and risks of growth hormone replacement. Front Endocrinol. 2013;4:64. doi:10.3389/fendo.2013.00064
15. Feldt-Rasmussen U, Klose M, et al. Adult growth hormone deficiency clinical management. In: Feingold KR, Anawalt B, Boyce A, editors. Endotext. South Dartmouth (MA): MDText.com, Inc.; 2000.
16. Yuen KCJ. Adult growth hormone deficiency guidelines: more difficult than it seems to incorporate into clinical practice universally. Eur J Endocrinol. 2021;184(4):C5–7. doi:10.1530/EJE-20-1455
17. Martel-Duguech LM, Jorgensen JOL, Korbonits M, et al. ESE audit on management of adult growth hormone deficiency in clinical practice. Eur J Endocrinol. 2020. doi:10.1530/EJE-20-1180
18. Yuen KCJ, Birkegard AC, Blevins LS, et al. Development of a novel algorithm to identify people with high likelihood of adult growth hormone deficiency in a US healthcare claims database. Int J Endocrinol. 2022;2022:1–9. doi:10.1155/2022/7853786
19. Fleseriu M, Hashim IA, Karavitaki N, et al. Hormonal replacement in hypopituitarism in adults: an endocrine society clinical practice guideline. J Clin Endocrinol Metab. 2016;101(11):3888–3921. doi:10.1210/jc.2016-2118
20. Hernberg-Ståhl E, Luger A, Abs R, et al. Healthcare consumption decreases in parallel with improvements in quality of life during GH replacement in hypopituitary adults with GH deficiency. J Clin Endocrinol Metab. 2001;86(11):5277–5281. doi:10.1210/jcem.86.11.7997
21. Saller B, Mattsson AF, Kann PH, et al. Healthcare utilization, quality of life and patient-reported outcomes during two years of GH replacement therapy in GH-deficient adults - comparison between Sweden, The Netherlands and Germany. Eur J Endocrinol. 2006;154(6):843–850. doi:10.1530/eje.1.02149
22. Koltowska-Häggström M, Mattsson AF, Shalet SM. Assessment of quality of life in adult patients with GH deficiency: KIMS contribution to clinical practice and pharmacoeconomic evaluations. Eur J Endocrinol. 2009;161(Suppl 1):S51–64. doi:10.1530/EJE-09-0266
23. Holmer H, Svensson J, Rylander L, et al. Psychosocial health and levels of employment in 851 hypopituitary Swedish patients on long-term GH therapy. Psychoneuroendocrinology. 2013;38(6):842–852. doi:10.1016/j.psyneuen.2012.09.008
24. Loftus J, Camacho-Hubner C, Hey-Hadavi J, Goodrich K. Targeted literature review of the humanistic and economic burden of adult growth hormone deficiency. Curr Med Res Opin. 2019;35(6):963–973. doi:10.1080/03007995.2018.1546682
25. Broder MS, Neary MP, Chang E, Cherepanov D, Ludlam WH. Burden of illness, annual healthcare utilization, and costs associated with commercially insured patients with Cushing disease in the United States. Endocr Pract. 2015;21(1):77–86. doi:10.4158/EP14126.OR
26. Parasher AK, Lerner DK, Glicksman JT, et al. Drivers of in-hospital costs following endoscopic transphenoidal pituitary surgery. Laryngoscope. 2021;131(4):760–764. doi:10.1002/lary.29041
27. National Institute for Health and Care Excellence (NICE). Human growth hormone (somatropin) in adults with growth hormone deficiency [TA64]; 2003. Available from: https://www.nice.org.uk/guidance/TA64.
28. Bolin K, Sandin R, Koltowska-Häggström M, Loftus J, Prütz C, Jonsson B. The cost-effectiveness of growth hormone replacement therapy (Genotropin®) in hypopituitary adults in Sweden. Cost Eff Resour Alloc. 2013;11(1):24. doi:10.1186/1478-7547-11-24
29. Austin PC. Using the standardized difference to compare the prevalence of a binary variable between two groups in observational research. Commun Stat Simul Comput. 2009;38(6–7):1228–1234. doi:10.1080/03610910902859574
30. Cortaredona S, Ventelou B. The extra cost of comorbidity: multiple illnesses and the economic burden of non-communicable diseases. BMC Med. 2017;15(1):216. doi:10.1186/s12916-017-0978-2
31. National Center for Chronic Disease Prevention and Health Promotion (NCCDPHP). Health and Economic Costs of Chronic Diseases; 2022. Available from: https://www.cdc.gov/chronicdisease/about/costs/index.htm.
32. Owens GM. Gender differences in health care expenditures, resource utilization, and quality of care. J Manag Care Pharm. 2008;14(3 Suppl):2–6. doi:10.18553/jmcp.2008.14.S6-A.2
33. Cameron KA, Song J, Manheim LM, Dunlop DD. Gender disparities in health and healthcare use among older adults. J Womens Health (Larchmt). 2010;19(9):1643–1650. doi:10.1089/jwh.2009.1701
34. Henry J Kaiser Family Foundation. Medicaid’s role for women; 2019. Available from: https://firstfocus.org/wp-content/uploads/2019/11/Fact-Sheet-Medicaids-Role-for-Women.pdf.
35. Spiliotis BE. Growth hormone insufficiency and its impact on ovarian function. Ann N Y Acad Sci. 2003;997:77–84. doi:10.1196/annals.1290.009
36. Kilgore M, Patel HK, Kielhorn A, Maya JF, Sharma P. Economic burden of hospitalizations of medicare beneficiaries with heart failure. Risk Manag Healthc Policy. 2017;10:63–70. doi:10.2147/RMHP.S130341
37. American Diabetes Association. Economic costs of diabetes in the U.S. in 2017. Diabetes Care. 2018;41(5):917–928. doi:10.2337/dci18-0007
38. Höybye C, Sävendahl L, Christesen HT, et al. The NordiNet® International Outcome Study and NovoNet® ANSWER Program®: rationale, design, and methodology of two international pharmacoepidemiological registry-based studies monitoring long-term clinical and safety outcomes of growth hormone therapy (Norditropin®). Clin Epidemiol. 2013;5:119–127. doi:10.2147/CLEP.S42602
39. Gutiérrez LP, Kołtowska-Häggström M, Jönsson PJ, et al. Registries as a tool in evidence-based medicine: example of KIMS (Pfizer International Metabolic Database). Pharmacoepidemiol Drug Saf. 2008;17(1):90–102. doi:10.1002/pds.1510
40. Kulaylat AS, Schaefer EW, Messaris E, Hollenbeak CS. Truven Health Analytics MarketScan databases for clinical research in colon and rectal surgery. Clin Colon Rectal Surg. 2019;32(1):54–60. doi:10.1055/s-0038-1673354
 © 2024 The Author(s). This work is published and licensed by Dove Medical Press Limited. The full terms of this license are available at https://www.dovepress.com/terms.php and incorporate the Creative Commons Attribution - Non Commercial (unported, v3.0) License.
By accessing the work you hereby accept the Terms. Non-commercial uses of the work are permitted without any further permission from Dove Medical Press Limited, provided the work is properly attributed. For permission for commercial use of this work, please see paragraphs 4.2 and 5 of our Terms.
© 2024 The Author(s). This work is published and licensed by Dove Medical Press Limited. The full terms of this license are available at https://www.dovepress.com/terms.php and incorporate the Creative Commons Attribution - Non Commercial (unported, v3.0) License.
By accessing the work you hereby accept the Terms. Non-commercial uses of the work are permitted without any further permission from Dove Medical Press Limited, provided the work is properly attributed. For permission for commercial use of this work, please see paragraphs 4.2 and 5 of our Terms.