")
Back to Journals » Diabetes, Metabolic Syndrome and Obesity » Volume 17
Lowest Glucagon/Highest C-Peptide in Oral Glucose Tolerance Test: Clinical Utility in Monitoring Glucose Control in Type 2 Diabetes Mellitus
Authors Chang L, Ma X, Yuan M, Ding L , Gu Y, Liu L, Li Y, Shu H, Liu M , He Q
Received 12 January 2024
Accepted for publication 10 April 2024
Published 17 April 2024 Volume 2024:17 Pages 1769—1780
DOI https://doi.org/10.2147/DMSO.S459392
Checked for plagiarism Yes
Review by Single anonymous peer review
Peer reviewer comments 2
Editor who approved publication: Dr Konstantinos Tziomalos
Lina Chang,* Xiaohui Ma,* Menghua Yuan,* Li Ding, Yian Gu, Lili Liu, Yan Li, Hua Shu, Ming Liu, Qing He
Department of Endocrinology and Metabolism, Tianjin Medical University General Hospital, Tianjin, People’s Republic of China
*These authors contributed equally to this work
Correspondence: Qing He; Ming Liu, Department of Endocrinology and Metabolism, Tianjin Medical University General Hospital, Tianjin, 300052, People’s Republic of China, Email [email protected]; [email protected]
Purpose: Understanding factors that influence blood glucose levels in patients with type 2 diabetes mellitus (T2DM) is crucial for managing hyperglycemia. Currently, there is no standardized interpretation method for glucagon levels in oral glucose tolerance test (OGTT). This study aims to assess the relationship between the lowest glucagon/highest C-peptide ratio (Lglc/Hcp) in OGTT and glucose control levels in T2DM.
Patients and Methods: Clinical data from 120 patients with T2DM were examined to compare the correlations of Lglc/Hcp and other pancreatic islet function-associated indices with fasting blood glucose (G0), glucose at 120 minutes in OGTT (G120), hemoglobin A1c (HbA1c), and the area under the glucose curve in OGTT (AUCglu). Additionally, the study investigated difference in Lglc/Hcp between patient groups based on the highest blood glucose levels (Hglu) in OGTT (Hglu ≥ 16.7 mmol/L vs Hglu < 16.7 mmol/L).
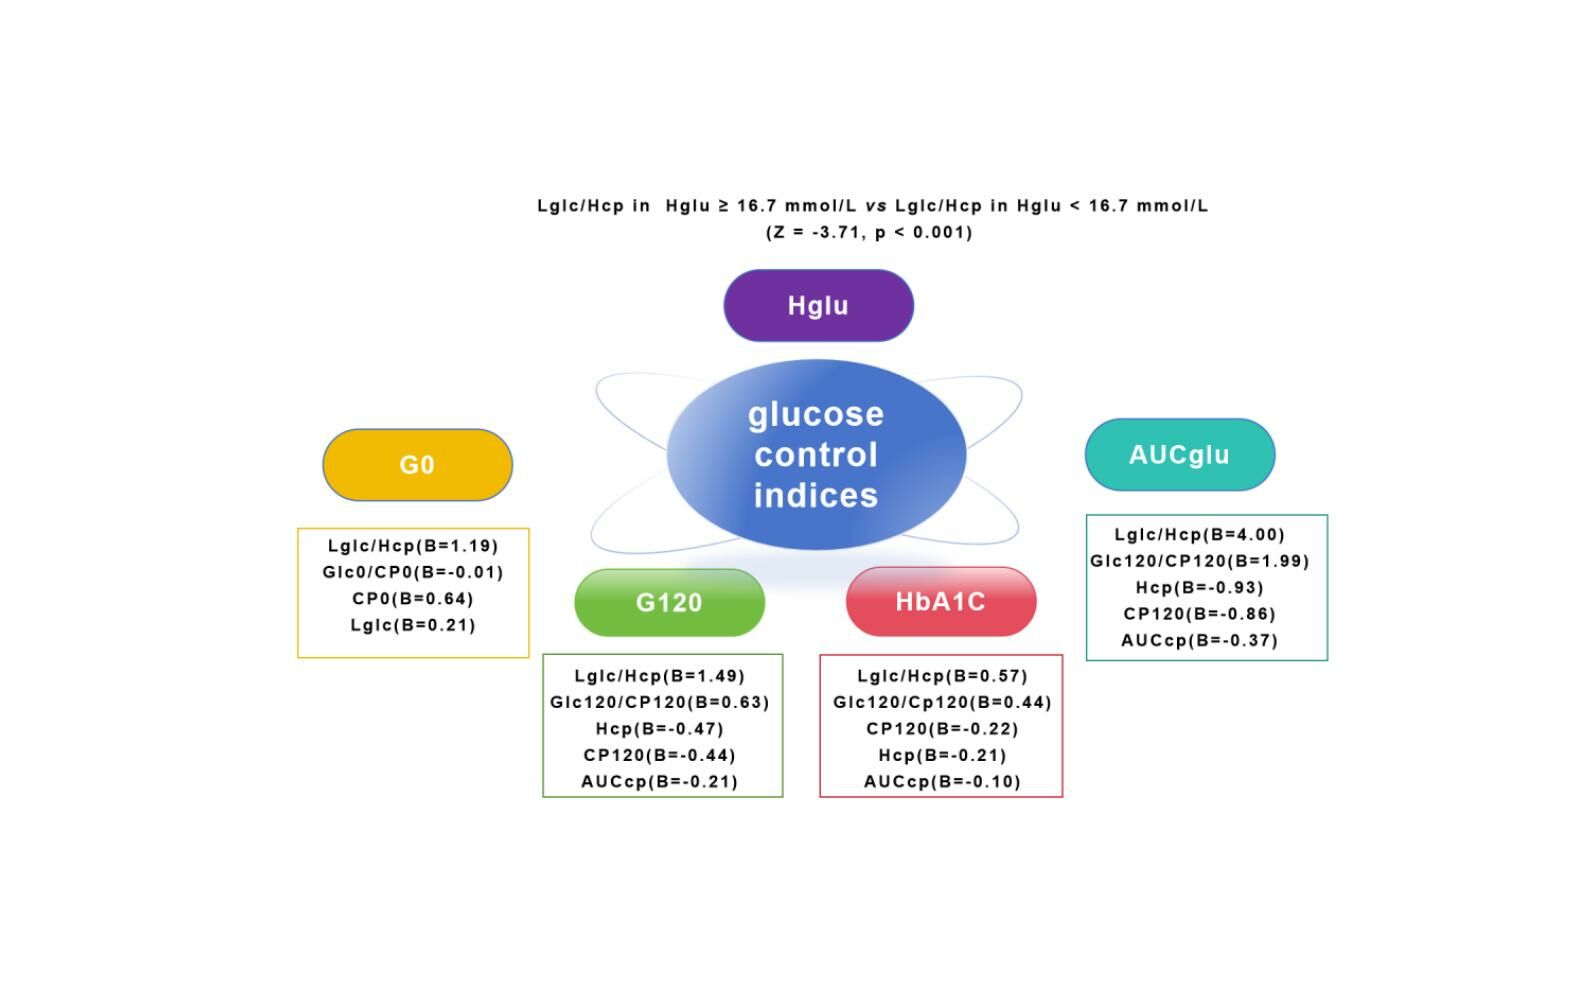
Results: The generalized linear model suggested that Lglc/Hcp significantly correlated with G0 (B = 0.85, P < 0.001), G120(B = 1.46, P < 0.001), HbA1c (B = 0.67, P < 0.001), and AUCglu (B = 3.46, P < 0.001). This correlation surpassed C-peptide and glucagon-related parameters, even after adjusting for confounding factors. Furthermore, Lglc/Hcp was notably higher in patients with Hglu ≥ 16.7 mmol/L compared to those with Hglu < 16.7 mmol/L (Z = − 3.71, p < 0.001).
Conclusion: Lglc/Hcp in OGTT closely relates to blood glucose control in patients with T2DM, potentially reflecting the overall pancreatic islet function in regulating glucose levels. Moreover, inhibiting glucagon secretion may be a crucial consideration for patients requiring insulin treatment.
Keywords: C-peptide, glucose control, glucagon, type 2 diabetes mellitus
Graphical Abstract:
Introduction
Unger first assumed that an increase in glucagon is necessary for the occurrence of diabetes,1 diverging from the conventional insulin-centric model of type 2 diabetes (T2DM) pathogenesis into the dual hormone hypothesis. However, the precise measurement of glucagon poses challenges due to its low concentration and the presence of similar peptide compounds in the blood.2 Notably, Mercodia developed sandwich ELISA kits using two antibodies to improve sensitivity and specificity.3 Furthermore, glucagon is inherently unstable and susceptible to degradation, posing an additional hurdle in the accurate assessment of its levels in clinical settings.4 In this research, we added enzyme inhibitors into blood collection vessels to impede glucagon degradation and ensure its stability.
In the past, numerous studies have examined the evolving pattern of glucagon levels across the spectrum from normal glucose tolerance to prediabetes and diabetes,5–7 however, there is no unified standard on how to interpret the glucagon level in the oral glucose tolerance test (OGTT) of patients with T2DM. Notably, direct analysis using glucagon levels does not appear to demonstrate a significant association with glucose regulation. Research by Hosokawa revealed that in individuals with type 2 diabetes, irrespective of whether they were administered DPP-4 inhibitors or GLP-1 analogues, glucagon levels did not show a substantial correlation with glucose levels, moreover, a study by Kumpatla indicated that fasting glucagon was not linked to blood glucose or glycosylated hemoglobin.5,8 Subsequent investigations, upon realizing the lack of correlation between absolute glucagon levels and blood glucose, explored its connection with blood glucose through variations in glucagon at 30 minutes or the glucagon-to-insulin ratio, yet the findings were inconsistent.5,9–12
Taking into account the response of pancreatic B cells, which increase insulin release, and pancreatic A cells, which reduce glucagon secretion following oral glucose intake to sustain stable blood glucose levels, and acknowledging that some patients had received insulin therapy prior to the OGTT, we employed the ratio of the lowest glucagon to highest C-peptide (Lglc/Hcp) during the OGTT. In this cross-sectional observational study, our primary aim was to assess the association between Lglc/Hcp and blood glucose control levels, while the secondary objective was to investigate whether Lglc/Hcp elevation occurred in type 2 diabetes patients requiring intensive insulin therapy.
Materials and Methods
Study Design and Population
This cross-sectional observational study enrolled 120 Chinese patients with T2DM who were hospitalized at Tianjin Medical University General Hospital from September 2022 to December 2023. The sample size was determined based on adjusted confounding factors and included independent variables of interest. The diagnosis of T2DM was based on the 2023 American Diabetes Association guidelines.13 Exclusion criteria included gestational diabetes, type 1 diabetes, special types of diabetes, OGTT without glucagon detection, severe liver and kidney dysfunction, gastrointestinal disorders, anemia, malignant tumors, and other conditions affecting blood glucose levels such as thyroid dysfunction and Cushing’s syndrome. The use of hypoglycemic medications was not considered an exclusion criterion.
All participants fasted for 8 h and underwent a 75 g oral glucose tolerance test at 6:00 am. Venous blood samples were collected at 0, 30, 60, 120, and 180 min to measure the blood glucose, C-peptide, and glucagon levels. Furthermore, we collected information on patients’ hemoglobin A1c (HbA1c) levels, use of hypoglycemic drugs in the past week, height, weight, disease course and presence of fatty liver. Basic patient characteristics are summarized in Table 1.
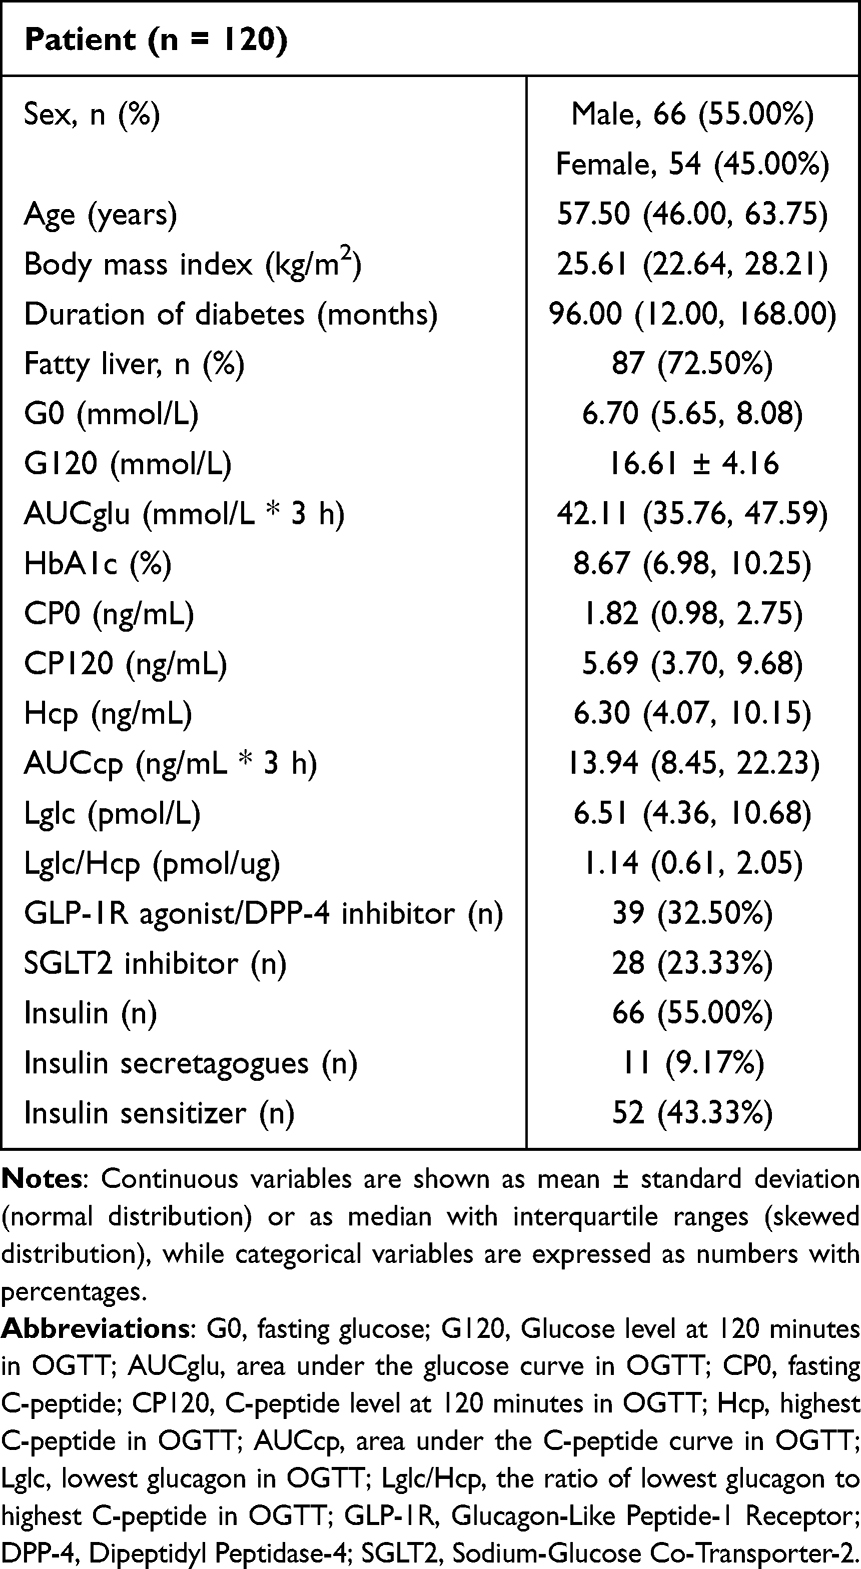 |
Table 1 Characteristics of Patients |
Biochemical Measurement
HbA1c levels were determined using liquid chromatography with the HLC-723G8 analyzer in standard mode (TOSOH G8, Japan), the catalog numbers of kit for measuring HbA1c were 0021800, 0021801, 0021802 and 0023482. Blood glucose levels were measured using the hexokinase method with a Biochemical analyzer (HITACHI 008AS, Japan), and C-peptide levels were assessed via chemokine immunoassay using the Chemiluminescence Apparatus (ARCHIRECT i2000, America). A glucagon stabilizer was added to the glucagon collection vessel to prevent glucagon degradation (patent number: ZL201810066819.6). We employed dual monoclonal antibodies that target the N and C terminals of glucagon and determined it by chemiluminescence immunoassay using a Fully Automatic Chemiluminescence analyzer (HomoG 100, China). There was no cross-reactivity with 300pmol/L glicentin and 25pmol/L Proglucaon1–61, and the cross-reactivity with 300pmol/L oxyntomodulin was 4.0%. Comparative analysis with the Swedish Mercodia test showed a relative deviation within ±15%, and a strong linear correlation with an R-value of 0.98, as depicted in Figure 1. Body mass index (BMI) was calculated as weight (kg) divided by height in square meters. The area under the glucose curve (AUCglu) and C-peptide curve (AUCcp) in OGTT were calculated using the trapezoidal rule.
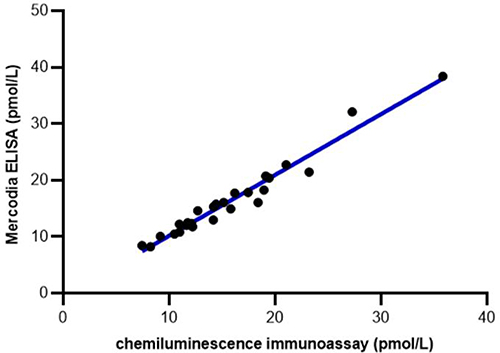 |
Figure 1 Scatter plots of glucagon detection using Chemiluminescence immunoassay and Swedish Mercodia ELISA. |
Statistical Analysis
Continuous variables are shown as mean ± standard deviation (normal distribution) or as median with interquartile ranges (skewed distribution), while categorical variables are expressed as numbers with percentages. Spearman correlation analysis and the generalized linear model were employed to assess the correlation of Lglc/Hcp, the ratio of fasting glucagon to fasting C-peptide in OGTT (Glc0/CP0), the ratio of 120-min glucagon to 120-min C-peptide in OGTT (Glc120/CP120), highest C-peptide in OGTT (Hcp), lowest glucagon in OGTT (Lglc), AUCcp with glucose control indices, including fasting glucose (G0), glucose level at 120-min in OGTT (G120), HbA1c, and AUCglu. Two sample non-parametric T-tests and the generalized linear model were used to compare Lglc/Hcp in different Hglu groups. Statistical analyses were conducted using SPSS (version 23.0; IBM SPSS Inc., Armonk, NY, USA), with statistical significance set at p < 0.05. Additionally, all figures were generated using GraphPad Prism 8.0.2 software.
Results
Clinical Characteristics of the Study Subjects
This study included 120 patients with T2DM, of whom 66 and 54 were males and females, respectively. The basic patient information is shown in Table 1.
Correlation of Lglc/Hcp with G0 and G120
The scatter plot depicted in Figure 2 and Spearman correlation analysis revealed a positive correlation between Lglc/Hcp and G0 (r = 0.51, p < 0.001) as well as G120 (r = 0.45, p < 0.001).
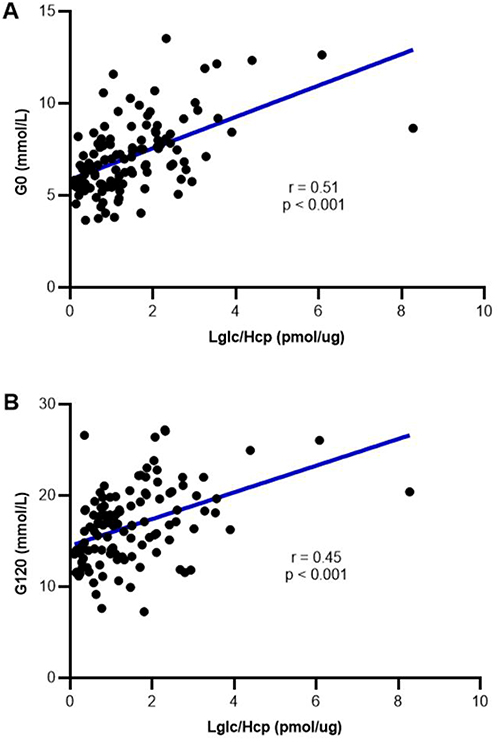 |
Figure 2 The linear correlation of Lglc/Hcp with G0 and G120. (A) The linear correlation of Lglc/Hcp with G0. (B) The linear correlation of Lglc/Hcp G120. Abbreviations: Lglc/Hcp, the ratio of lowest glucagon to highest C-peptide in OGTT; G0, Fasting Glucose; G120, Glucose level at 120 minutes in OGTT. |
As illustrated in Table 2, the generalized linear model suggested that in Model 1, prior to adjusting for confounding variables, Lglc/Hcp and Lglc exhibited positive correlations with G0 (B = 0.85, p < 0.001; B = 0.18, p < 0.001), while Hcp and AUCcp displayed negative correlations with G0 (B = −0.11, p = 0.001; B = −0.04, p = 0.01). In Models 2 and 3, after accounting for age, diabetes duration, BMI, fatty liver, and the use of hypoglycemic drugs in the past week, Lglc/Hcp remained positively correlated with G0. In the three models, Lglc/Hcp exhibited a stronger correlation with G0 compared to the other parameters.
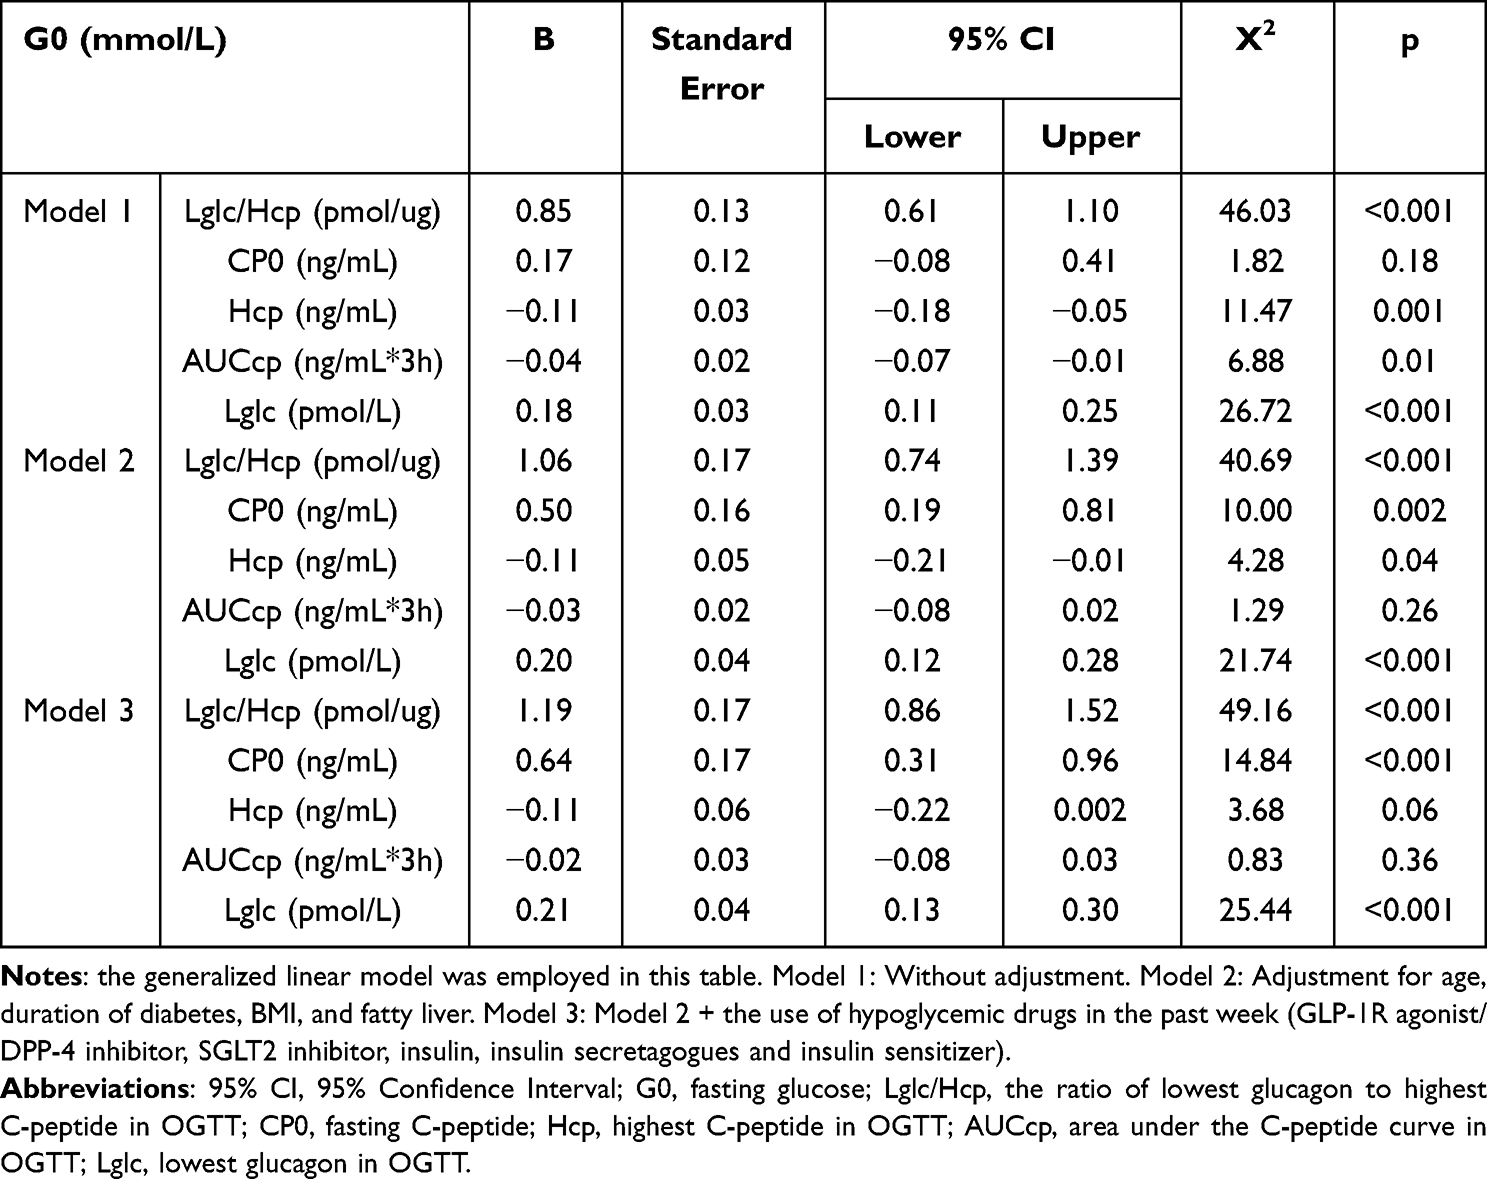 |
Table 2 Correlation Between Metabolic Indices with G0 |
Additionally, in Table 3, without adjusting for confounding factors in Model 1, Lglc/Hcp showed a positive correlation with G120 (B = 1.46, p < 0.001), however, CP120, Hcp, and AUCcp displayed negative correlations with G120 (B = −0.41, p < 0.001; B = −0.43, p < 0.001; B = −0.19, p < 0.001). After adjusting for confounding factors in Models 2 and 3, Lglc/Hcp maintained a positive correlation with G120. In the three models, Lglc/Hcp showed a more pronounced correlation with G120 compared to the other parameters.
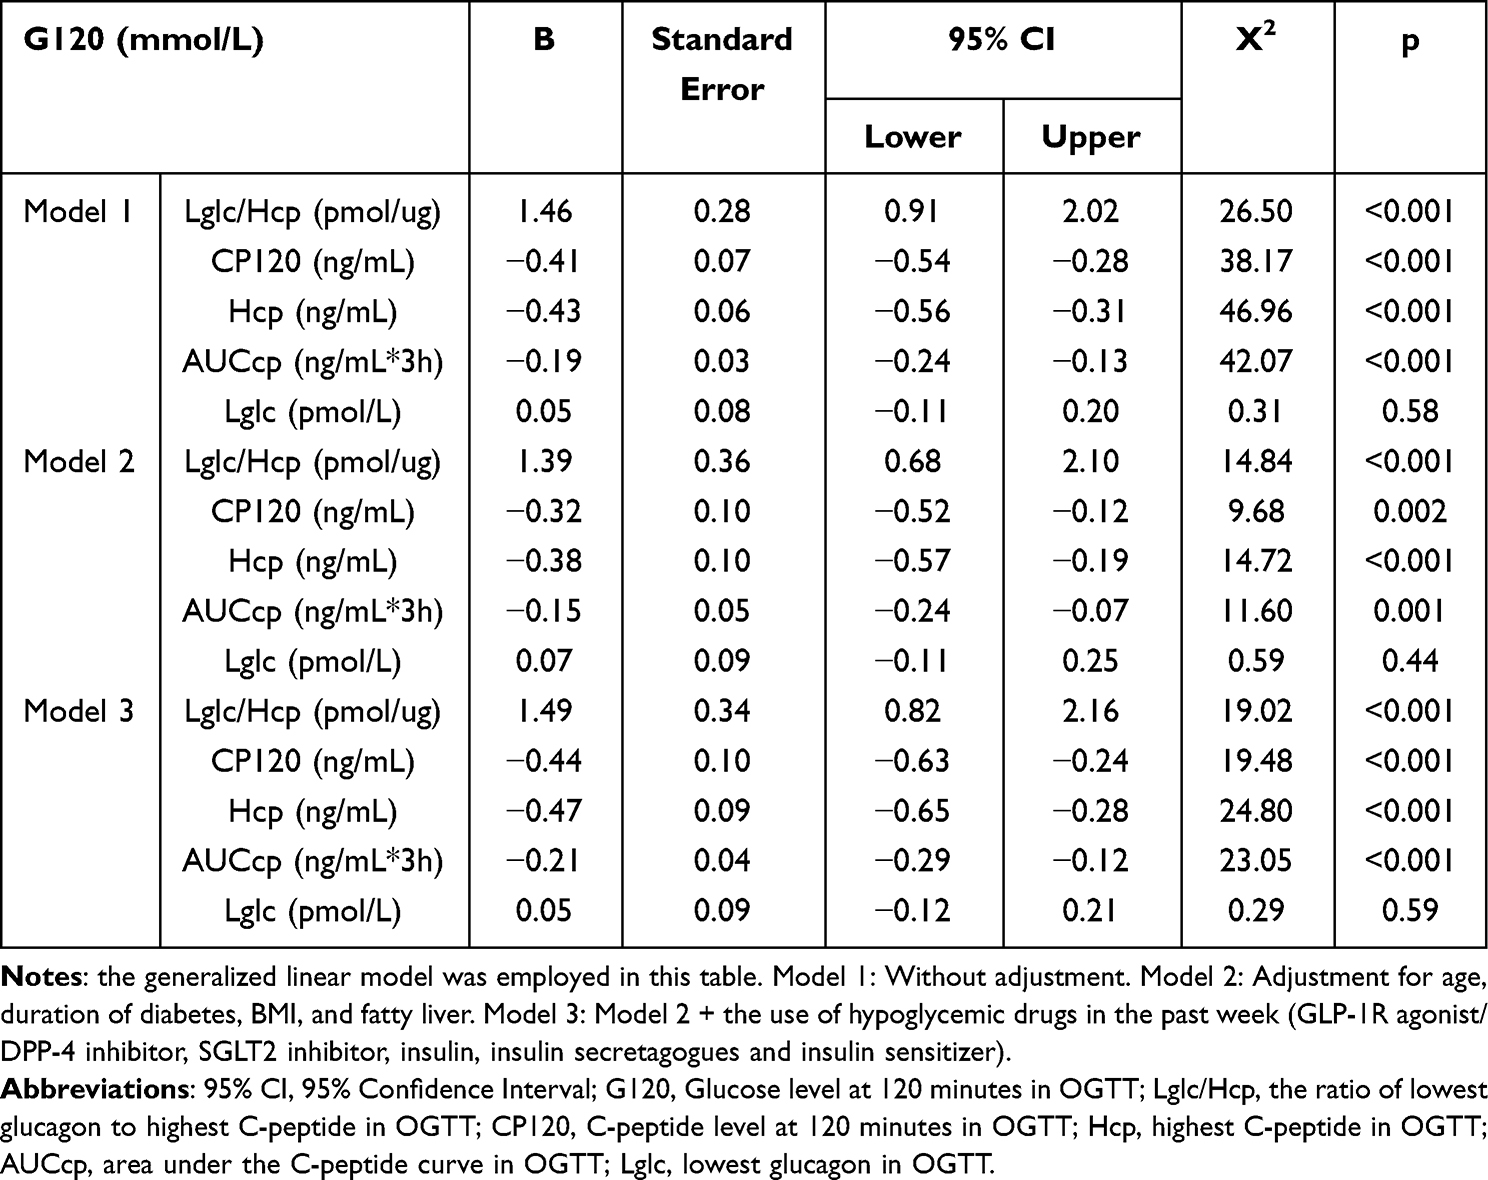 |
Table 3 Correlation Between Metabolic Indices with G120 |
Correlation of Lglc/Hcp with HbA1c and AUCglu
In Model 1, without adjusting for confounding factors, Lglc/Hcp positively correlated with HbA1c (B = 0.67, p < 0.001) and AUCglu (B = 3.46, p < 0.001). Conversely, CP0, CP120, Hcp, and AUCcp showed negative correlations with HbA1c and AUCglu. Following adjustments for confounders in Models 2 and 3, the positive correlations of Lglc/Hcp with HbA1c and AUCglu persisted. Among the three models, Lglc/Hcp demonstrated the strongest associations with HbA1c levels and AUCglu, as shown in Table 4.
 |
Table 4 Correlation Between Metabolic Indices with HbA1c and AUCglu |
Correlation Between the Ratio of Glucagon/C-Peptide with Glucose Control Indices
Previous researches have indicated that HbA1c levels are positively linked to both fasting and postprandial glucagon-to-insulin ratios,9,10 therefore, we compared the correlations of Lglc/Hcp, Glc0/CP0, and Glc120/CP120 with glucose control metrics. Our findings revealed that the positive associations of Lglc/Hcp with HbA1c, G0, G120, and AUCglu were more robust compared to Glc0/CP0 and Glc120/CP120 with these glucose control parameters (Table 5), even after adjusting for age, duration of diabetes, BMI, fatty liver, and the use of hypoglycemic drugs in the past week in model 3.
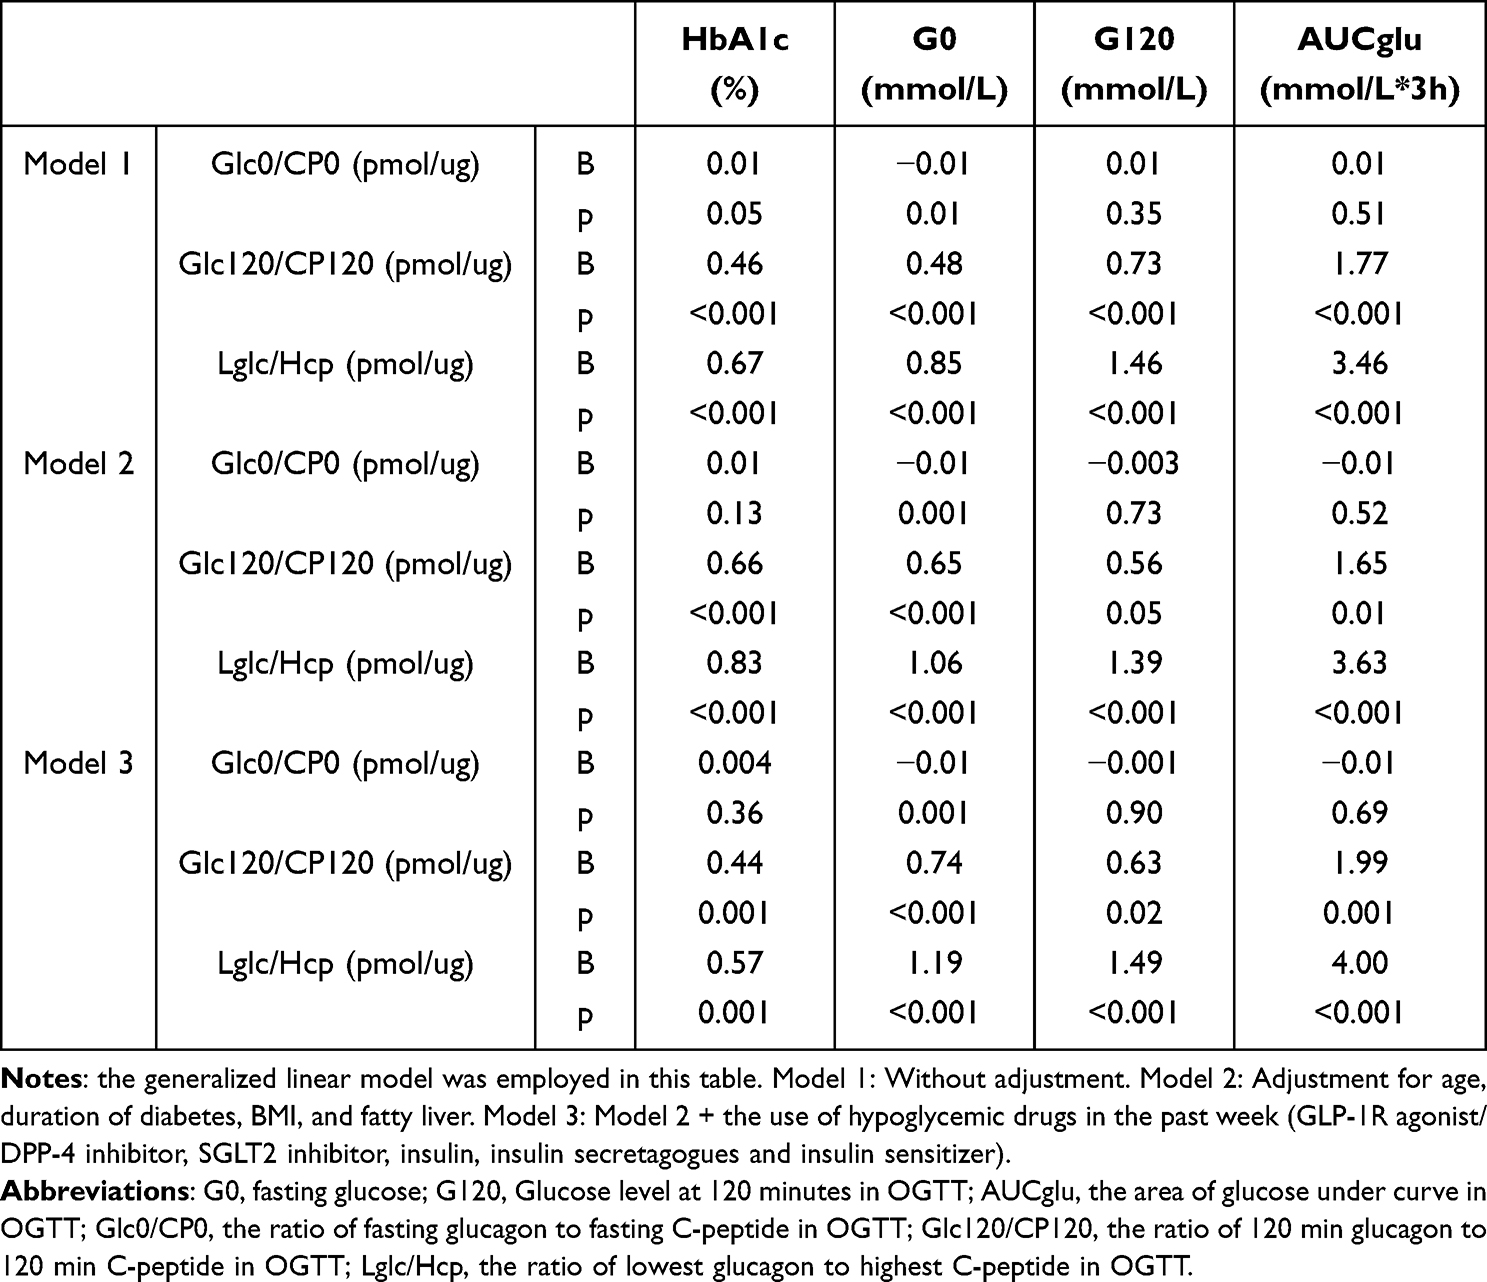 |
Table 5 Correlation Between the Ratio of Glucagon/C-Peptide with Glucose Control Indices |
Comparing of Lglc/Hcp in Different Groups of Hglu
The guideline of Standards of Care in Diabetes published by the America Diabetes Association in 2023 indicate that insulin therapy should be initiated when glucose level is ≥16.7 mmol/L,13 hence, patients were divided into two groups based on whether Hglu ≥ 16.7 mmol/L, and the Lglc/Hcp levels were compared.
Results of the non-parametric two-sample t-test revealed that the Lglc/Hcp levels of patients with Hglu ≥ 16.7 mmol/L were significantly higher than those of patients with Hglu < 16.7 mmol/L (Z = −3.71, p < 0.001), as depicted in Figure 3. Using a generalized linear model to adjust for age, duration of diabetes, BMI, fatty liver, and the use of hypoglycemic drugs in the past week, the noted differences persisted, as presented in Table 6.
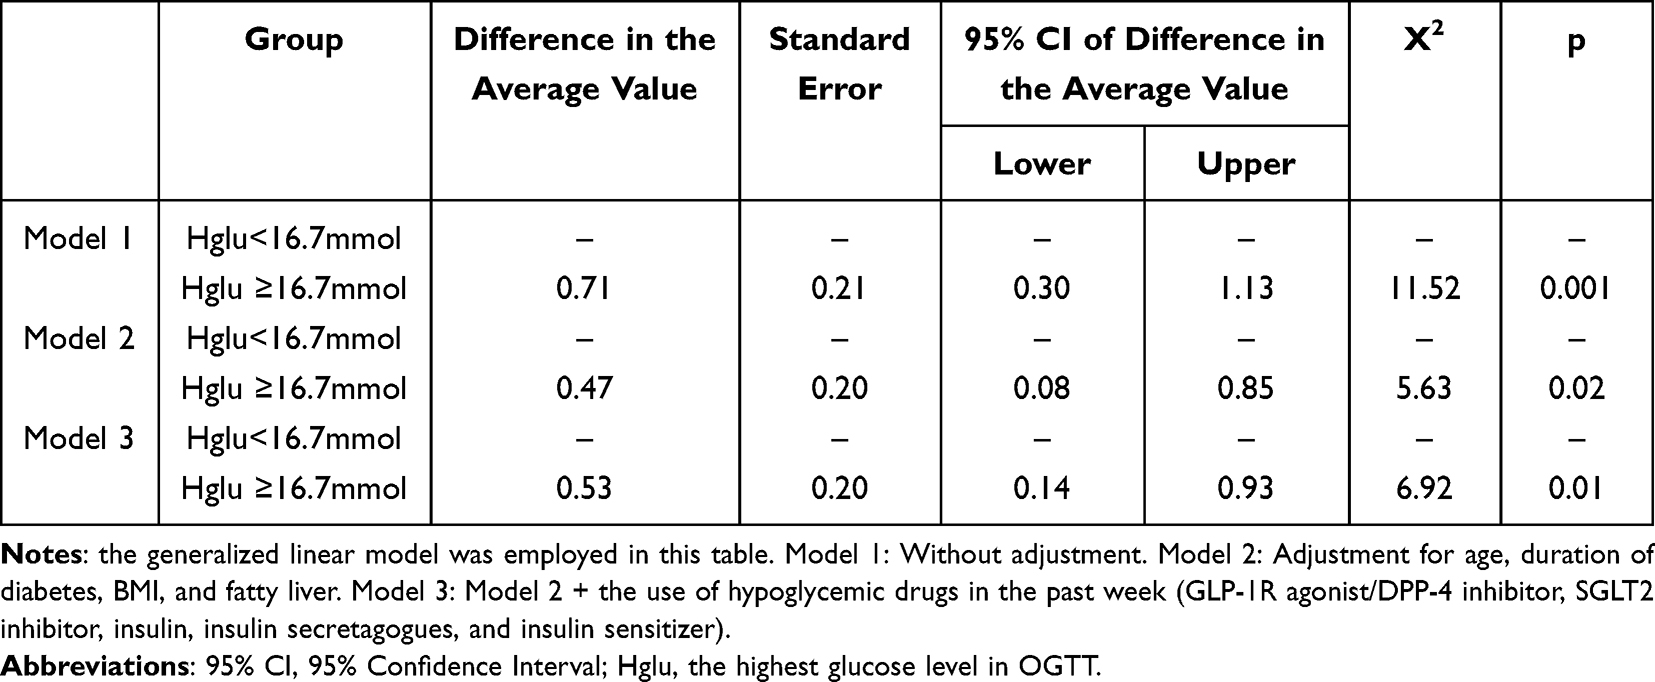 |
Table 6 Comparison of Lglc/Hcp in Different Groups of Hglu |
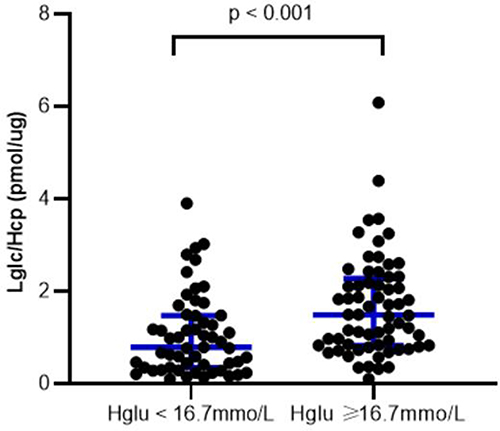 |
Figure 3 The level of Lglc/Hcp in different groups of Hglu. Abbreviations: Lglc/Hcp, the ratio of lowest glucagon to highest C-peptide in OGTT; Hglu, the highest glucose level in OGTT. |
Discussion
Glucagon, as the primary antagonist of insulin, elevates blood glucose levels through the inhibition of glycolysis and the promotion of gluconeogenesis and glycogen breakdown.4,14 When assessing factors affecting blood glucose levels in diabetic patients, consideration of both glucagon and insulin secretion may offer a more comprehensive perspective than focusing solely on insulin. However, accurate detection of glucagon is hindered by its low circulating levels and the presence of structurally similar peptides.2 Radioimmunoassay targeting C-terminal-specific antibodies against glucagon has been used as a specific detection method for glucagon, however, it still lacks sensitivity and specificity for determining glucagon in plasma. Therefore, the use of a sandwich enzyme-linked immunosorbent assay (ELISA) with two antibodies is essential to enhance specificity. Notably, more precise sandwich ELISA kits have been developed by Mercodia.3 The chemiluminescence immunoassay employed in our research exhibited a relative deviation of ±15% compared to the ELISA of Swedish Mercodia, with an R-value of linear correlation at 0.98. Moreover, glucagon is unstable and prone to degradation, which is another challenge in accurately determining glucagon in clinical practice.4 In this study, we added glucagon protective agents to the glucagon collection vessel to improve glucagon stability.
Elevated fasting and postprandial glucagon levels are common in most patients with T2DM.15–17 However, there is no clear evidence indicating that glucagon directly causes postprandial glucose elevation. Hosokawa discovered that in individuals with type 1 diabetes mellitus and T2DM, fasting glucagon levels were not correlated with fasting blood glucose. In patients with T2DM, regardless of the use of DPP-4 inhibitors or GLP-1 analogs, glucagon levels did not show a significant relationship with glucose levels.8 Consistent with the findings of this study, our results indicate that fasting glucagon is unrelated to G0, and the glucagon level at 120min in the OGTT is not correlated with G120 (data were not shown). Although some studies have shown that fasting glucagon is not higher in patients with DM than in those without DM, it is still considered “inappropriately elevated”.18 Furthermore, Buchanan found that in non-insulin-deficient diabetics, the mean glucagon values remained at or slightly above the fasting levels throughout the test. However, in insulin-deficient patients with diabetes, the mean glucagon values were higher throughout the test than in the fasting state, suggesting that the response mode of glucagon to carbohydrate intake depends on the severity of insulin deficiency, that is, plasma glucagon does not change significantly in non-insulin-deficient patients with diabetes after carbohydrate intake, whereas it increases significantly in insulin-deficient patients.19 Sherwin and Shah reported that glucagon infusion did not significantly increase blood glucose levels when insulin was sufficient.20,21 Based on the above research, analyzing the absolute value of glucagon to assess its impact on blood glucose may be inappropriate.
Some researchers employ a 30-minute increment of glucagon or 30-minute glucagon suppression to indicate inadequate glucagon inhibition and explore its correlation with blood glucose levels. Henkel utilized the radioimmunoassay method to quantify glucagon, noting a relationship between a 30-minute glucagon increment and the 6-hour postprandial glucose area under the curve in individuals with type 2 diabetes. Kobayashi identified that a 30-minute glucagon increment was linked to fasting blood glucose levels and HbA1c.11,22 However, Farch conducted a study comparing 30-minute glucagon suppression in patients with diabetes diagnosed using fasting glucose levels alone, 2-hour glucose levels alone, and both fasting and 2-hour glucose criteria, with no significant differences observed.12 Notably, our study did not suggest a correlation between a 30-min increment in glucagon or 30-min glucagon suppression with G0, G120 and HbA1c, even after adjusting for potential confounding variables (data not displayed).
Hamasaki discovered a positive association between the postprandial glucagon/C-peptide ratio and levels of glycated albumin, indicating an imbalance between insulin and glucagon. Postprandial hyperglucagonemia and impaired insulin secretion are associated with poor blood glucose control.23 Lee and Kumer found that HbA1c levels positively correlated with fasting and postprandial glucagon-to-insulin ratios.9,10 However, another study found no difference in glucagon/insulin levels at various points of the OGTT among individuals with normal glucose tolerance, prediabetes, and diabetes.5 Due to the stimulatory effect of oral glucose on insulin secretion by pancreatic B cells and its inhibitory effect on glucagon secretion by pancreatic A cells,24 we utilized the Lglc/Hcp ratio as a rough indicator of overall pancreatic islet secretory function and examined its relationship with glucose control levels in our research. Studies have shown that fatty liver has a significant impact on glucagon levels.25 Moreover, different hypoglycemic drugs have different effects on glucagon levels. For instance, GLP-1R agonists and DPP-4 inhibitors reduce glucagon levels, while SGLT-2 inhibitors elevate glucagon levels.26 Therefore, when correcting for confounding factors in this study, we considered both fatty liver and hypoglycemic drugs. We observed a significantly stronger correlation of Lglc/Hcp with G0 and G120 in the OGTT compared to CP0, CP120, Hcp, Lglc, and AUCcp with G0 and G120, even after controlling for age, duration of diabetes, BMI, fatty liver and use of hypoglycemic drugs in the past week. Additionally, our findings indicated a positive relationship between Lglc/Hcp and HbA1c as well as AUCglu, which was more stronger than the correlations of CP0, CP120, Hcp, Lglc, and AUCcp with HbA1c and AUCglu, even after adjusting for the aforementioned confounding factors (Table 4). Consistent with the findings of Lee and Kumer, our data showed positive association of Glc0/CP0 and Glc120/CP120 with HbA1c, however, the association of Glc0/CP0 and Glc120/CP120 with HbA1c, G0, G120, and AUCglu were weaker than the association of Lglc/Hcp with the above mentioned glucose control indices (Table 5).
In addition, the study findings indicated a significant elevation in the Lglc/Hcp ratio among patients with Hglu levels ≥ 16.7 mmol/L compared to those with Hglu levels < 16.7 mmol/L, even after adjusting for confounding factors (Table 6). This suggests that the inhibition of glucagon secretion could be a crucial aspect of treatment for individuals necessitating insulin therapy.
Our study benefits from the utilization of a more precise method for measuring glucagon levels and the inclusion of a population consisting solely of hospitalized patients, leading to more robust and reliable results. Nevertheless, it is important to note that our study is limited by being conducted at a single center, having a cross-sectional design, and the majority of participants using hypoglycemic medications. Nevertheless, our study provides a novel perspective on the complex relationship between glucagon, C-peptide, and glucose control, adding nuance to existing frameworks. Furthermore, our study also offers a new and more reliable indicator for blood glucose control that could guide future treatment strategies for patients with T2DM, and it has potential implications for the standardization of glucagon level interpretation in OGTT, thus filling a notable gap in the current literature.
Conclusion
In conclusion, Lglc/Hcp in OGTT is closely related to blood glucose control levels in patients with T2DM, it may reflect the overall ability of pancreatic islets to regulate glucose in T2DM. Additionally, for patients with T2DM who require insulin treatment, inhibiting glucagon secretion while administering insulin may be more conducive to glucose control.
Abbreviations
G0, fasting glucose; G120, Glucose level at 120 minutes in OGTT; AUCglu, area under the glucose curve in OGTT; CP0, fasting C-peptide; CP120, C-peptide level at 120 minutes in OGTT; Hcp, highest C-peptide in OGTT; AUCcp, area under the C-peptide curve in OGTT; Lglc, lowest glucagon in OGTT; Lglc/Hcp, the ratio of lowest glucagon to highest C-peptide in OGTT; Glc0/CP0, the ratio of fasting glucagon to fasting C-peptide in OGTT; Glc120/CP120, the ratio of 120 min glucagon to 120 min C-peptide in OGTT; GLP-1R, Glucagon-Like Peptide-1 Receptor; DPP-4, Dipeptidyl Peptidase-4; SGLT2, Sodium-Glucose Co-Transporter-2.
Data Sharing Statement
The data that support the findings of this study are available from the corresponding author upon reasonable request.
Ethics Statement
All procedures performed in studies were by the 1964 Helsinki Declaration and its later amendments or comparable ethical standards. The ethical approval for this study was provided by the Ethical Committee of Tianjin Medical University General Hospital (Approval number: IRB2020-YX-027-01). Informed consent was obtained from all participants.
Acknowledgments
Lina Chang, Xiaohui Ma, and Menghua Yuan are co-first authors for this study.
Author Contributions
All authors made a significant contribution to the work reported, whether that is in the conception, study design, execution, acquisition of data, analysis, and interpretation, or all these areas; took part in drafting, revising, or critically reviewing the article; gave final approval of the version to be published; have agreed on the journal to which the article has been submitted; and agree to be accountable for all aspects of the work.
Funding
This work was supported by Tianjin Key Medical Discipline (Specialty) Construction Project (grant number TJYXZDXK-030A), Tianjin Major Science and Technology Projects (grant number 21ZXJBSY00060), Neuroendocrine Tumor Clinical Specialized Disease Research Center (Cultivation), Tianjin Health Science and Technology Key Project (TJWJ2021ZD001), Tianjin Medical University General Hospital Clinical Research Program (22ZYYLCZD02).
Disclosure
Dr Lina Chang, Dr Qing He, Dr Ming Liu and Dr Li Ding report a pending patent “A Calculation Method and Its Application of an Index Related to Pancreatic Regulation of Blood Glucose” (patent no: 202311654605.8). The authors report no other conflicts of interest in this work.
References
1. Unger RH, Orci L. The essential role of glucagon in the pathogenesis of diabetes mellitus. Lancet. 1975;1(7897):14–16. doi:10.1016/S0140-6736(75)92375-2
2. Hædersdal S, Andersen A, Knop FK, Vilsbøll T. Revisiting the role of glucagon in health, diabetes mellitus and other metabolic diseases. Nat Rev Endocrinol. 2023;19(6):321–335. doi:10.1038/s41574-023-00817-4
3. Wewer Albrechtsen NJ, Hartmann B, Veedfald S, et al. Hyperglucagonaemia analysed by glucagon sandwich ELISA: nonspecific interference or truly elevated levels. Diabetologia. 2014;57(9):1919–1926. doi:10.1007/s00125-014-3283-z
4. Wewer Albrechtsen NJ, Kuhre RE, Pedersen J, Knop FK, Holst JJ. The biology of glucagon and the consequences of hyperglucagonemia. Biomarker Med. 2016;10(11):1141–1151. doi:10.2217/bmm-2016-0090
5. Kumpatla S, Parveen R, Murugan P, Juttada U, Devarajan A, Viswanathan V. Hyperglucagonemia and impaired insulin sensitivity are associated with development of prediabetes and type 2 diabetes - A study from South India. Diabetes Metab Syndr. 2021;15(4):102199. doi:10.1016/j.dsx.2021.102199
6. Yabe D, Kuroe A, Watanabe K, Iwasaki M, Seino T. Early phase glucagon and insulin secretory abnormalities, but not incretin secretion, are similarly responsible for hyperglycemia after ingestion of nutrients. J Diabetes Complicat. 2015;29(3):413–421. doi:10.1016/j.jdiacomp.2014.12.010
7. Faerch K, Vaag A, Holst JJ, Glümer C, Pedersen O, Borch-Johnsen K. Impaired fasting glycaemia vs impaired glucose tolerance: similar impairment of pancreatic alpha and beta cell function but differential roles of incretin hormones and insulin action. Diabetologia. 2008;51(5):853–861. doi:10.1007/s00125-008-0951-x
8. Hosokawa Y, Kozawa J, Nishizawa H, et al. Positive correlation between fasting plasma glucagon and serum C-peptide in Japanese patients with diabetes. Heliyon. 2019;5(5):e01715. doi:10.1016/j.heliyon.2019.e01715
9. Lee M, Kim M, Park JS, et al. Higher glucagon-to-insulin ratio is associated with elevated glycated hemoglobin levels in type 2 diabetes patients. Korean J Intern Med. 2019;34(5):1068–1077. doi:10.3904/kjim.2016.233
10. Kumar R, Srivastava S, Jain G, Pahadiya H. A study of correlation of glucagon-insulin ratio with Hba1c in diabetic patients in a Tertiary Care Hospital. J Assoc Physicians India. 2022;70(4):11–12.
11. Kobayashi M, Satoh H, Matsuo T, et al. Plasma glucagon levels measured by sandwich ELISA are correlated with impaired glucose tolerance in type 2 diabetes. Endocr J. 2020;67(9):903–922. doi:10.1507/endocrj.EJ20-0079
12. Færch K, Vistisen D, Pacini G, et al. Insulin resistance is accompanied by increased fasting glucagon and delayed glucagon suppression in individuals with normal and impaired glucose regulation. Diabetes. 2016;65(11):3473–3481. doi:10.2337/db16-0240
13. ElSayed NA, Aleppo G, Aroda VR, et al. 2. Classification and diagnosis of diabetes: standards of care in diabetes-2023. Diabetes Care. 2023;46(Suppl 1):S19–S40. doi:10.2337/dc23-S002
14. Jiang G, Zhang BB. Glucagon and regulation of glucose metabolism. Am J Physiol Endocrinol Metab. 2003;284(4):E671–E678. doi:10.1152/ajpendo.00492.2002
15. Menge BA, Grüber L, Jørgensen SM, et al. Loss of inverse relationship between pulsatile insulin and glucagon secretion in patients with type 2 diabetes. Diabetes. 2011;60(8):2160–2168. doi:10.2337/db11-0251
16. Shen J, Chen Z, Chen C, Zhu X, Han Y. Impact of incretin on early-phase insulin secretion and glucose excursion. Endocrine. 2013;44(2):403–410. doi:10.1007/s12020-012-9867-9
17. Ichikawa R, Takano K, Fujimoto K, et al. Basal glucagon hypersecretion and response to oral glucose load in prediabetes and mild type 2 diabetes. Endocr J. 2019;66(8):663–675. doi:10.1507/endocrj.EJ18-0372
18. Unger RH, Aguilar-Parada E, Müller WA, Eisentraut AM. Studies of pancreatic alpha cell function in normal and diabetic subjects. J Clin Invest. 1970;49(4):837–848. doi:10.1172/JCI106297
19. Buchanan KD, McCarroll AM. Abnormalities of glucagon metabolism in untreated diabetes mellitus. Lancet. 1972;2(7792):1394–1395. doi:10.1016/S0140-6736(72)92964-9
20. Sherwin RS, Fisher M, Hendler R, Felig P. Hyperglucagonemia and blood glucose regulation in normal, obese and diabetic subjects. N Engl J Med. 1976;294(9):455–461. doi:10.1056/NEJM197602262940901
21. Shah P, Basu A, Basu R, Rizza R. Impact of lack of suppression of glucagon on glucose tolerance in humans. Am J Physiol. 1999;277(2):E283–E290. doi:10.1152/ajpendo.1999.277.2.E283
22. Henkel E, Menschikowski M, Koehler C, Leonhardt W, Hanefeld M. Impact of glucagon response on postprandial hyperglycemia in men with impaired glucose tolerance and type 2 diabetes mellitus. Metabolism. 2005;54(9):1168–1173. doi:10.1016/j.metabol.2005.03.024
23. Hamasaki H, Morimitsu S. Association of glucagon with obesity, glycemic control and renal function in adults with type 2 diabetes mellitus. Can J Diabetes. 2021;45(3):249–254. doi:10.1016/j.jcjd.2020.08.108
24. Scheen AJ, Lefèbvre PJ. Glucagon, from past to present: a century of intensive research and controversies. Lancet Diabetes Endocrinol. 2023;11(2):129–138. doi:10.1016/S2213-8587(22)00349-7
25. Wewer Albrechtsen NJ, Junker AE, Christensen M, et al. Hyperglucagonemia correlates with plasma levels of non-branched-chain amino acids in patients with liver disease independent of type 2 diabetes. Am J Physiol Gastrointest Liver Physiol. 2018;314(1):G91–G96. doi:10.1152/ajpgi.00216.2017
26. Hædersdal S, Lund A, Knop FK, Vilsbøll T. The role of glucagon in the pathophysiology and treatment of type 2 diabetes. Mayo Clin Proc. 2018;93(2):217–239. doi:10.1016/j.mayocp.2017.12.003
 © 2024 The Author(s). This work is published and licensed by Dove Medical Press Limited. The full terms of this license are available at https://www.dovepress.com/terms.php and incorporate the Creative Commons Attribution - Non Commercial (unported, v3.0) License.
By accessing the work you hereby accept the Terms. Non-commercial uses of the work are permitted without any further permission from Dove Medical Press Limited, provided the work is properly attributed. For permission for commercial use of this work, please see paragraphs 4.2 and 5 of our Terms.
© 2024 The Author(s). This work is published and licensed by Dove Medical Press Limited. The full terms of this license are available at https://www.dovepress.com/terms.php and incorporate the Creative Commons Attribution - Non Commercial (unported, v3.0) License.
By accessing the work you hereby accept the Terms. Non-commercial uses of the work are permitted without any further permission from Dove Medical Press Limited, provided the work is properly attributed. For permission for commercial use of this work, please see paragraphs 4.2 and 5 of our Terms.