")
Back to Journals » Diabetes, Metabolic Syndrome and Obesity » Volume 14
Leptin Concentrations in Non-Obese and Obese Non-Diabetes Nigerian-Africans
Authors Agbogu-Ike OU , Ogoina D , Onyemelukwe GC
Received 27 May 2020
Accepted for publication 3 August 2020
Published 21 December 2021 Volume 2021:14 Pages 4889—4902
DOI https://doi.org/10.2147/DMSO.S264735
Checked for plagiarism Yes
Review by Single anonymous peer review
Peer reviewer comments 2
Editor who approved publication: Dr Konstantinos Tziomalos
Obiageli Uzoamaka Agbogu-Ike,1 Dimie Ogoina,2 Geoffrey Chukwubuike Onyemelukwe1
1Department of Medicine, Ahmadu Bello University (ABU) Teaching Hospital, Zaria, Nigeria; 2Department of Medicine, Niger Delta University Teaching Hospital, Okolobiri, Bayelsa, Nigeria
Correspondence: Obiageli Uzoamaka Agbogu-Ike
Department of Medicine, ABUTH, Zaria, Nigeria
Tel +234 8129930000
Email [email protected]
Background: Controversial findings exist on the role of leptin in obesity and its correlation with metabolic variables, with few data emanating from Nigerian-Africans. Plasma leptin was therefore determined in obese and non-obese. Its relationship with obesity indices and metabolic variables were further envisaged.
Materials and Methods: A cross-sectional comparative study on 87 randomly-selected non-diabetes Nigerians distributed into 3 groups (24 normal, 23 pre-obese and 40 obese). Obesity indices, fasting Insulin (FI) and homeostasis model assessment-insulin resistance (HOMA-IR) were determined. Plasma leptin was determined by sandwich enzyme-linked immunosorbent assay. Mann-Whitney U-test, Independent Kruskal-Wallis test, Spearman correlation and Step-wise Multivariate Logistic Regression analysis determined outcomes.
Results: Median+IQR leptin concentrations were higher in obese {61.8(40.8, 91.4) ng/mL, p< 0.001} than pre-obese {42.7(28.0, 51.7) ng/mL, p=0.003} and normal {28.6(20.7, 39.8) ng/mL, p=0.03} BMI categories. Leptin was higher (p< 0.001) in females than males {Median+IQR, 52.0 (35.0, 80.0) ng/mL versus 34.0(24, 65.0 ng/mL)}. Leptin was positively correlated with body fat percentage (BFP), r=0.57; waist circumference (WC), r=0.46 and body mass index (BMI), r=0.50, p< 0.001, respectively in all subjects, with higher correlation coefficient in males than females. Leptin showed sex-specific correlations to age, FI and HOMA-IR. In the unadjusted models, central obesity/generalized obesity, WC, BMI, BFP, combined pre-obesity/obesity, younger age and female sex were significantly (p< 0.001) associated with log-transformed leptin. WC (OR: 1.2, 95% CI, 1.05– 1.38, p=0.009), BFP (OR: 1.41, 95% CI, 1.07– 1.84, p=0.013) and BMI (OR: 1.6, 95% CI, 1.13– 2.31, p=0.008) in men and all subjects, were independently associated with hyperleptinaemia following adjustments.
Conclusion: Plasma leptin concentrations, fasting insulin and insulin resistance are higher in obese and pre-obese than normal controls, with females showing higher leptin concentrations than males. Leptin is independently related to BMI, BFP, WC, female sex and generalized/central obesity in Nigerian-Africans especially males. It showed sex-specific relations to age, fasting insulin and HOMA-IR.
Keywords: plasma leptin, obese, pre-obese, normal healthy non-diabetics, body fat percentage, HOMA-insulin resistance, Nigerian-Africans
Introduction
Leptin, an adipocyte-secreted hormone and product of the OB gene, a 16-kDa (167 amino acids) non-glycosylated polypeptide hormone, synthesized and secreted by white adipose tissue into blood circulation, is structurally and functionally related to the cytokine family, inclusive of interleukin-6 (IL-6), IL-12, IL-15, granulocyte colony stimulating factor, oncostatin M, prolactin and human growth hormone.1–4 Thus, linking the neuroendocrine system to the immune system due to its dual nature as a hormone and cytokine.3 It functions in the feed-back loop regulation of food intake and body weight; regulating appetite, satiety, energy expenditure and conveyance of information on energy availability, thus acting as a mediator between obesity and cardiovascular disease.1–3,5 Furthermore, leptin stimulates the production of pro-inflammatory cytokines in macrophages, dendritic cells and T-lymphocytes; enhances the expansion of regulatory T-lymphocytes (T-reg) which regulate the immune system;4,5 affects haematopoiesis;6 leptin dependent platelet aggregation;5 regulates bone formation;7 blood pressure homeostasis;8 glucose homeostasis and lipid metabolism,9 as well as other recently discovered effects on reproduction, angiogenesis and wound healing, which are all energy demanding physiological processes.10–13 Leptin acts peripherally in stimulation of vascular inflammation, oxidative stress and vascular smooth muscle hypertrophy which may contribute to the pathogenesis of type-2 diabetes, hypertension, atherosclerosis and coronary artery disease.5,11,13
The leptin receptor Ob-R (or Lep R), a member of Class I cytokine receptor family inclusive of glycoprotein (gp-130), the common signal receptor for IL-6 family of cytokines; has six isoforms (LepRa - LepRf) with different sizes.3,6,12–14 The LepRb (long isoform) is expressed in the hypothalamic nuclei involved in the control of food intake and body weight as well as cells of the liver, pancreas, lung, kidney, adipose tissues, endothelium, immune system, endometrium, and placenta;6 thus accounting for the multiple effects of leptin. Leptin-deficient (ob/ob) and leptin receptor (ob-Rb) deficient (db/db) mice display complex syndromes characterized by hypothermia, infertility, hyperglycaemia, decreased insulin sensitivity, obesity and hyperlipidaemia which is reversed in ob/ob mice with leptin administration.3,12–14 A slight rise in leptin levels decreases appetite, with resultant decrease in body weight, however, despite increased leptin levels found in obesity, the efficacy of the anorexic effect of leptin is reduced, consequently leading to leptin resistance.3,15
Studies have shown positive correlation between serum leptin and percentage of adipose tissue,16,17 suggesting that most obese people may be insensitive to endogenously produced leptin; while humans with congenital leptin deficiency (CLD) (mutations of LEP or LR gene), exhibit morbid obesity, impaired satiety, intensive hyperphagia and continuous food seeking behaviour, hyperinsulinaemia, hypogonadotropic hypogonadism, liver steatosis, dyslipidaemia and frequent deaths sequel to infections.13,18–21 Elucidation of the mechanisms involved in leptin resistance is difficult via in-vivo studies and clear criteria for definition of leptin resistance are not yet established.3 In humans, mutations of the leptin ob gene for example missense mutation and ob-R genes are associated with obesity and hypogonadism.13,20 However, these mutations are rare in humans, thereby complicating research on leptin resistance and its possible diagnostic markers.3
It has been shown that leptin levels are significantly higher in females than males22–24 and decline with increasing age.25,26 Several studies have been done in the white population however, with conflicting findings.3,5,17,18,20–22,27 Information on leptin levels in indigenous African populations is scanty with few data emanating from South-Africa,28 Sudan,29 Benin-Republic24 Cameroon30 and Nigeria.16,24,30–33 Conflicting evidence exists on leptin production rates and levels among ethnic groups,26,27,34 with some studies showing positive correlation with anthropometric indices and or fasting insulin, fasting blood glucose as well as homeostasis-insulin resistance (HOMA-IR),18,21,23,24,26,27,31,33,35–37 while some other reported contrasting finding.34 This study was therefore, conducted to determine plasma leptin concentrations in a sample of obese and non-obese non-diabetes healthy Northern Nigerian-Africans and assess its relation to anthropometric measures, fasting insulin and metabolic indices, bearing in mind ethnic and geographical differences in a heterogeneous global society.
Methods
A cross-sectional comparative-analytical study carried out among 87 non-diabetes apparently healthy volunteers randomly selected from willing patients’ escorts, hospital employees and willing staff at the Ahmadu Bello University Teaching Hospital (ABUTH), Zaria, North-West Nigeria in West Africa. The study also adheres to the Strengthening the Reporting of Observational Studies in Epidemiology (STROBE) guidelines for an observational study of this nature and complied with the amended Helsinki’s declaration.
Inclusion Criteria
Adults above 20 years of age without personal or family history of hypertension or diabetes who had fasting blood glucose levels less than seven millimoles per litre (FBG < 7 mmol/L); non-smokers; no history of previous stroke or family history of sudden cardiac death and no history of cardiopulmonary, renal or liver disease.
Exclusion Criteria
Subjects were excluded on account of clinical evidence of any illness; concurrent use of any form of medications like metformin, steroids or psychoactive drugs, anti-diabetes/insulin therapy, anti-obesity or anti-hypertensive medications; engagement in competitive sports; factors known to interfere with insulin secretion and action, as well as pregnant and breastfeeding mothers. Subjects with chronic pro-inflammatory diseases like arthritis or rhinitis and clinical evidence of hypo or hyperthyroidism were also excluded.
Study Procedure
Information on age, sex, anthropometric measures were obtained from all subjects. Weights in kilogram (Kg) were taken with light clothing to the nearest 0.5 kg.38 Heights in meters to the nearest 0.5 cm were taken with all subjects standing erect without shoes or head gear. Body mass index (BMI) was derived by dividing the weight by square of height in kg/m2 according to the World Health Organization (WHO) criteria38 and further classified as normal {Body mass index (BMI), 18.5–24.9 kg/m2}; pre-obese {BMI, 25.0–29.9 kg/m2} and obese {BMI ≥ 30.0 kg/m2}.39 Additionally, body fat percentage which is a measure of fitness level was determined via the formula by Bruso viz-a-viz.: [Adults] Body fat percentage (BFP) (%) = (1.39 x BMI) + (0.16 x age) + 10.34 x gender) – 9;40 where gender=0 for females and 1 for males, so as to account for the lower fat percentage of men. Central obesity was further determined by the International Diabetes Federation Criteria {Males, Waist Circumference (WC) ≥ 94cm and Females, WC≥80 cm}.41 Blood pressures were determined after a 10 minutes’ rest in the recumbent position, standing and sitting, with a random zero mercury sphygmomanometer, thrice and average values were taken.
Biochemical and Hormonal Assays
Following an overnight 10–12 hours fast commencing between 21.00 to 22.00 hours the preceding night, 5mls of blood was drawn from each subject and placed in ethylenediaminetetraacetic acid (EDTA) treated tubes and promptly centrifuged. The plasma was then divided into aliquots for insulin and leptin estimation. A drop {500 kallikrein inactivator unit (KIU)} of Aprotinin (trasylol®) {United States of America (USA); Lot No: SLBD9903V; Catalog No: 1001466032} was added to the sample bottles prior to sample collection. Plasma was separated into cryovials and stored at −20°C until further analysis. Plasma glucose was determined by the glucose oxidase method within an hour of collection, while serum electrolyte, urea and creatinine were assessed at the Chemical pathology laboratory via the Chenray-120 clinical chemistry auto-analyser.
Plasma Insulin Assay
Insulin assay was done with commercially available human insulin enzyme linked immunosorbent assay (ELISA) kit (DRG instruments Gmbh, Marburg Germany Kat/Cat #: EIA-2935). The inter-assay and intra-assay coefficient of variation was 5.2% and 4.8% respectively, with a sensitivity of 99% for human insulin and no cross reaction with pro-insulin. Insulin resistance values were divided using the homeostasis model assessment (HOMA) method employing the equation below:42

The figure 22.5 in the equation brings the insulin resistance value to 1.0 (insulin sensitivity of 100%) of normal subjects. HOMA-IR ≥ 2.0 defined insulin resistance for African migrants43
Plasma Leptin Assay
Leptin assay was done using leptin enzyme linked immunosorbent assay (ELISA) kit (Diagnostic Automation/Cortez Diagnostics Inc., Calabasas, CA 91302, Catalog Number: 1742-6). The assay was undertaken for leptin using the manufacturer’s manual. The kit detects human leptin 100% with no cross reaction to human insulin, pro-insulin, C-peptide, glucagon, or Insulin growth factor-1 (IGF-1). The lowest detectable level of leptin that could be distinguished from the zero standards was 1.0 ng/mL. The reference range for plasma leptin in males was 3.84 ± 1.79 ng/mL and females 7.36 ± 3.73 ng/mL. Hyperleptinaemic state was referred to as > 9.4 ng/mL for men and > 27.4 ng/mL for women.36
Principle of Leptin ELISA Assay
The Leptin ELISA kit is a solid phase enzyme-linked immunosorbent assay based on the sandwich principle. The microtiter plates were pre-coated with monoclonal anti-leptin antibodies directed towards unique antigenic sites on leptin molecules. Standards and samples containing endogenous leptin were incubated in the microtitre plate wells with specific rabbit anti-leptin antibody, after which a sandwich complex was formed. Following incubation, the unbound material was washed off and a Streptavidin peroxidase enzyme complex was added for detection of the bound leptin. The intensity of colour change was proportional to the concentration of leptin in the patient sample and read off spectrophotometrically.
Statistical Analysis
Data was validated and analyzed via Statistical Package for the Social Sciences (SPSS) version-25 software (IBM). The Kolmogorov–Smirnov test was used to determine the normality of data distribution. Non-Parametric numerical data were summarized as Median + Interquartile Range with 25th and 75th percentiles considered, while numeric variables were expressed as Mean ± Standard Deviation (SD). Independent Student’s t-test determined the sex differences in numerical variables or Mann-Whitney U-test for skewed data as the case may be. The values were presented in categories of normal, pre-obese and obese. Three or more Independent numerical variables with normality and equal variances were analysed via One-way Analysis of Variance (ANOVA) with Post-hoc Bonferroni test. When data was not normally distributed with equal variances observed, the Independent Samples Kruskal-Wallis test with Pairwise comparison was used. Spearman Correlation analysis was used for correlation relationships between plasma leptin and other demographic-metabolic parameters. Plasma Leptin variables were log-transformed to reduce its skewness. Step-wise Multivariate Binary Logistic Regression analysis was done to determine the relationship between log-transformed leptin concentrations and selected demographic-metabolic variables. The level of statistical significance in each case was considered at p ≤ 0.05 at 95% Confidence Interval (CI).
Results
Subject Participation and Characteristics of the Study Population According to Gender
A total of 87 apparently healthy adults aged 26–75 years, distributed into 3 groups based on the WHO classification of body mass index viz.: 24 normal BMI, 23 pre-obese and 40 obese individuals were studied. There was no significant (p>0.05) gender difference in age (p=0.41), body mass index (p=0.24), waist circumference (p=0.41), fasting blood glucose (p=0.53), fasting insulin (p=0.14) and HOMA-insulin resistance (p=0. 25) via the Mann-Whitney U-test. The Mean ± SD BMI was 29.0 ± 6.2 k/m2 and 30.3 ± 7.0 kg/m2 in males and females respectively, while the average WC was 98.5 ± 15.6 cm in males and 99.0 ± 13.0 cm in females. On the contrary, the Mean ± SD body fat percentage (BFP) in males (45.9 ± 9.2%), was significantly (p<0.001) lower that of females was 58.5 ± 9.9%. Furthermore, females had significantly (p=0.009) higher leptin levels than males {Median + IQR, 52.0 (35.0, 80.0) ng/mL versus 34.0 (24, 65.0 ng/mL)}.
Demographic and Clinical Characteristics of the Subjects by BMI Category and Gender
The demographic and clinical characteristics of the study population according to BMI categories and gender are shown in Tables 1 and 2, respectively. The Median age was 48 years, 50 years and 46 years respectively in the normal, pre-obese and obese categories with no significant (p=0.55) age difference. There was significant (p<0.001) difference in waist circumference, body fat percentage and BMI across the BMI categories by One Way Independent Kruskal–Wallis test (Table 1). The actual difference by Pairwise comparison was the higher (p<0.001, respectively) Median WC, Median BFP and Median BMI of the obese subjects than the normal as well as pre-obese subjects (Table 1). There was significant (p<0.001 and p=0.04, respectively) difference in HOMA-IR and fasting insulin among the three categories of BMI. The difference by Pair-wise comparison was the significantly (p<0.01 and p=0.06, respectively) higher HOMA-IR and marginally higher FI in the obese than normal controls, as well as higher (p=0.02 and p=0.05, respectively) HOMA-IR and FI in pre-obese than normal controls. HOMA-IR and FI however, showed no significant (p>0.05) difference between obese and pre-obese (Table 1).
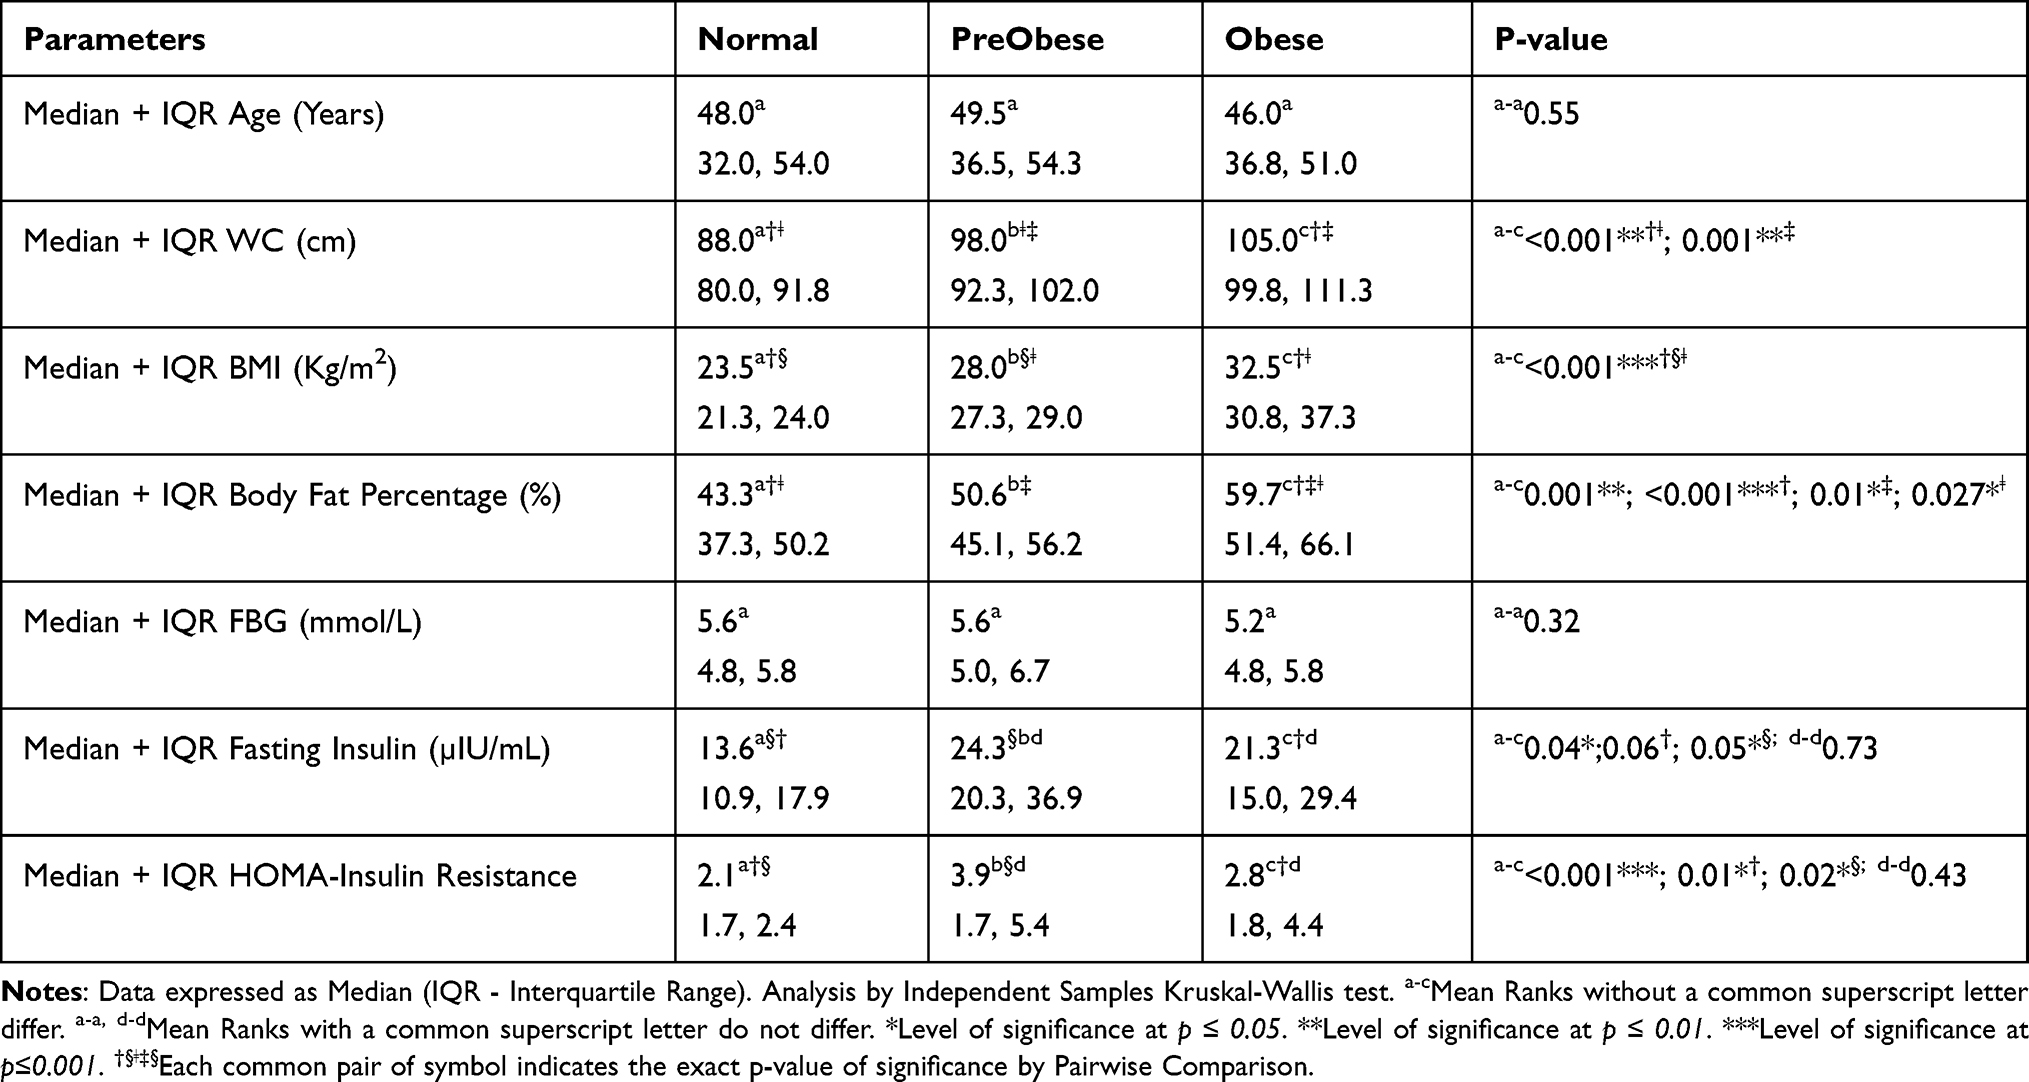 |
Table 1 Characteristics of the Study Population by Body Mass Index Categories |
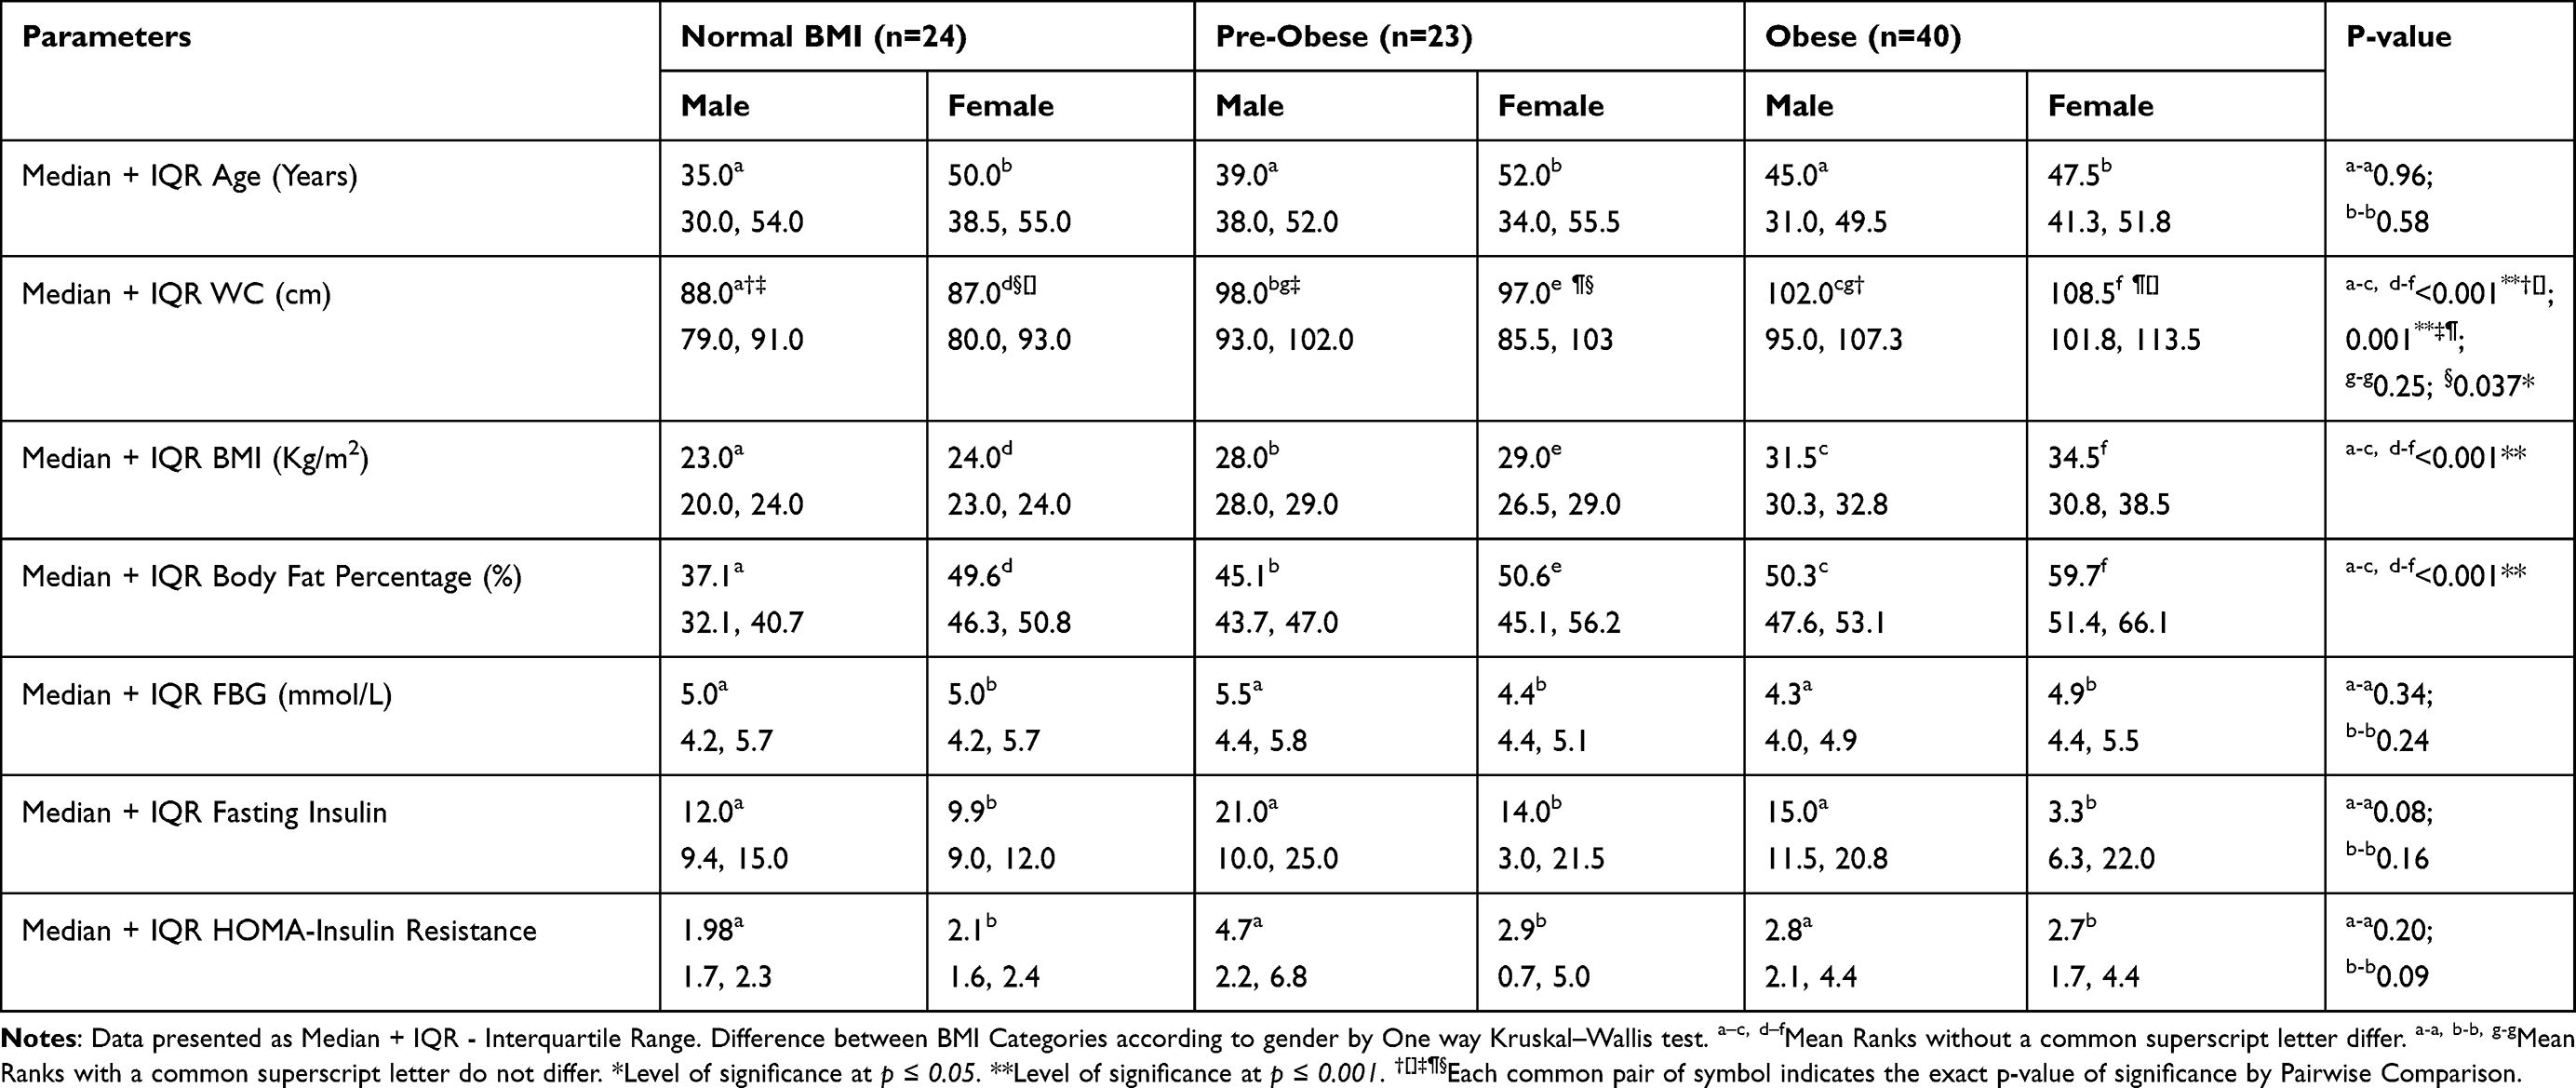 |
Table 2 Characteristics of the Body Mass Index Categories by Gender |
Gender wise, males similar to females showed significantly (p<0.001) higher BMI, BFP and WC across the 3 BMI categories by Independent Samples Kruskal-Wallis test (Table 2). The actual difference by Pairwise comparison was the higher WC (p<0.001 and p=0.001, respectively), BFP (p<0.001, respectively) and BMI (p<0.001, respectively) in male obese than male normal controls as well as male pre-obese than normal subjects (Table 2). Only BMI and BFP were significantly (p<0.001) higher in male obese than male pre-obese, while WC showed no such difference (p=0.25). Additionally, WC, BFP and BMI were higher (p=0.001 p<0.001 and p<0.001, respectively) in female obese than pre-obese, female pre-obese than normal (WC, p=0.037; BFP, p<0.001 and BMI, p<0.001, respectively) as well as female obese than normal controls (p<0.001, respectively) (Table 2). Fasting blood glucose and age showed no significant (p>0.05) difference amongst the female BMI categories with similar trend in males. However, fasting insulin and HOMA-IR were higher (p=0.03 and p=0.014) in pre-obese males than normal males; obese males than normal males (FI, p=0.07 and IR, p=0.016) with no significant (FI, p=0.25 and IR, p=0.19) difference between obese males and pre-obese males (Table 2).
Differences in Plasma Leptin Concentrations Across BMI Categories
Figure 1 showed that plasma leptin levels increased significantly (p<0.0001, Kruskal-Wallis) with increasing BMI categories. The actual difference by Pairwise comparison was the significantly (p<0.0001, p=0.003, respectively) higher leptin levels in obese than normal BMI category (Figure 1) as well as pre-obese than normal BMI group. The obese category also showed significantly (p=0.03) higher leptin levels than pre-obese group. Additionally, the Median + Interquartile Range (IQR) leptin concentrations of all the subjects was 46.0 (29.0, 72.0 ng/mL). In both normal BMI and pre-obese groups, females had significantly (p=0.01 and p=0.04, respectively) higher Median leptin levels than males by Mann-Whitney U-test (Figure 1). This was not the case with the obese category, as there was no significant (p=0.73) difference in plasma leptin levels between the males and females (Figure 1).
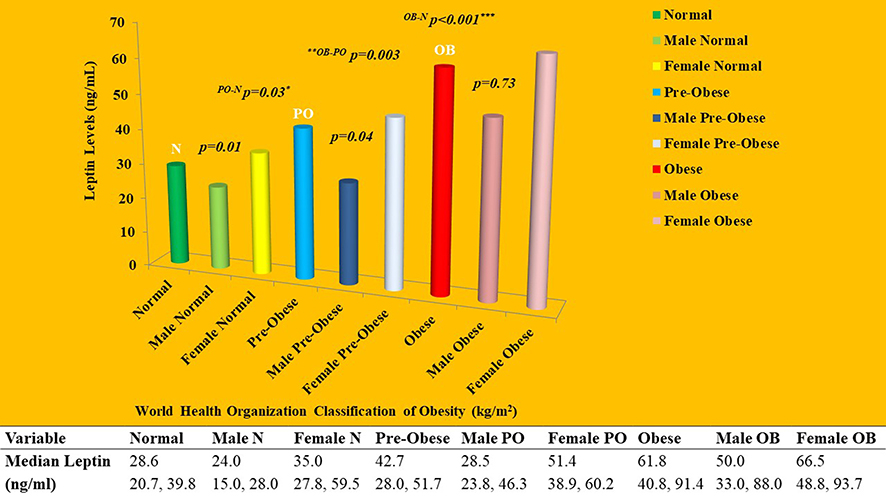 |
Figure 1 Leptin Concentrations across Body Mass Index (BMI) Categories by Gender. OB-NDifference between Obese and normal BMI; OB-PODifference between Obese and Pre-Obese; PO-NDifference between Pre-obese and normal BMI category. *Level of significance at p ≤ 0.05. **Significant at p ≤ 0.01. ***Significant at p ≤ 0.001. Abbreviations: OB, Obese; PO, Pre-obese; N, Normal BMI. |
Sex-Specific Concentrations of Plasma Leptin According to BMI Categories
Differences in plasma leptin between BMI categories were determined by gender. Median leptin level was significantly (p<0.001; p=0.014 and p=0.01) higher in male obese than male normal controls; male obese than male pre-obese groups and male pre-obese than normal BMI subjects (Independent One way Kruskal-Wallis test). Obese females had significantly (p=0.025) higher Median leptin levels than normal BMI females, but showed no significant difference (p=0.20) from that of pre-obese females. Pre-obese female subjects also showed no significant (p=0.14) difference in leptin levels from normal controls (Figure 1).
Relationship Between Plasma Leptin and Selected Demographic-Metabolic Variables
The Spearman correlations between plasma leptin and other variables in all study participants and by gender are shown in Table 3. Plasma leptin significantly (p<0.05) positively correlated with age (p=0.04), WC (p<0.001), body fat percentage (p<0.001) and BMI (p<0.001) in all subjects (Figure 2), but showed no significant (p>0.05) correlations with FBS, fasting insulin and HOMA-IR in all subjects (Table 3).
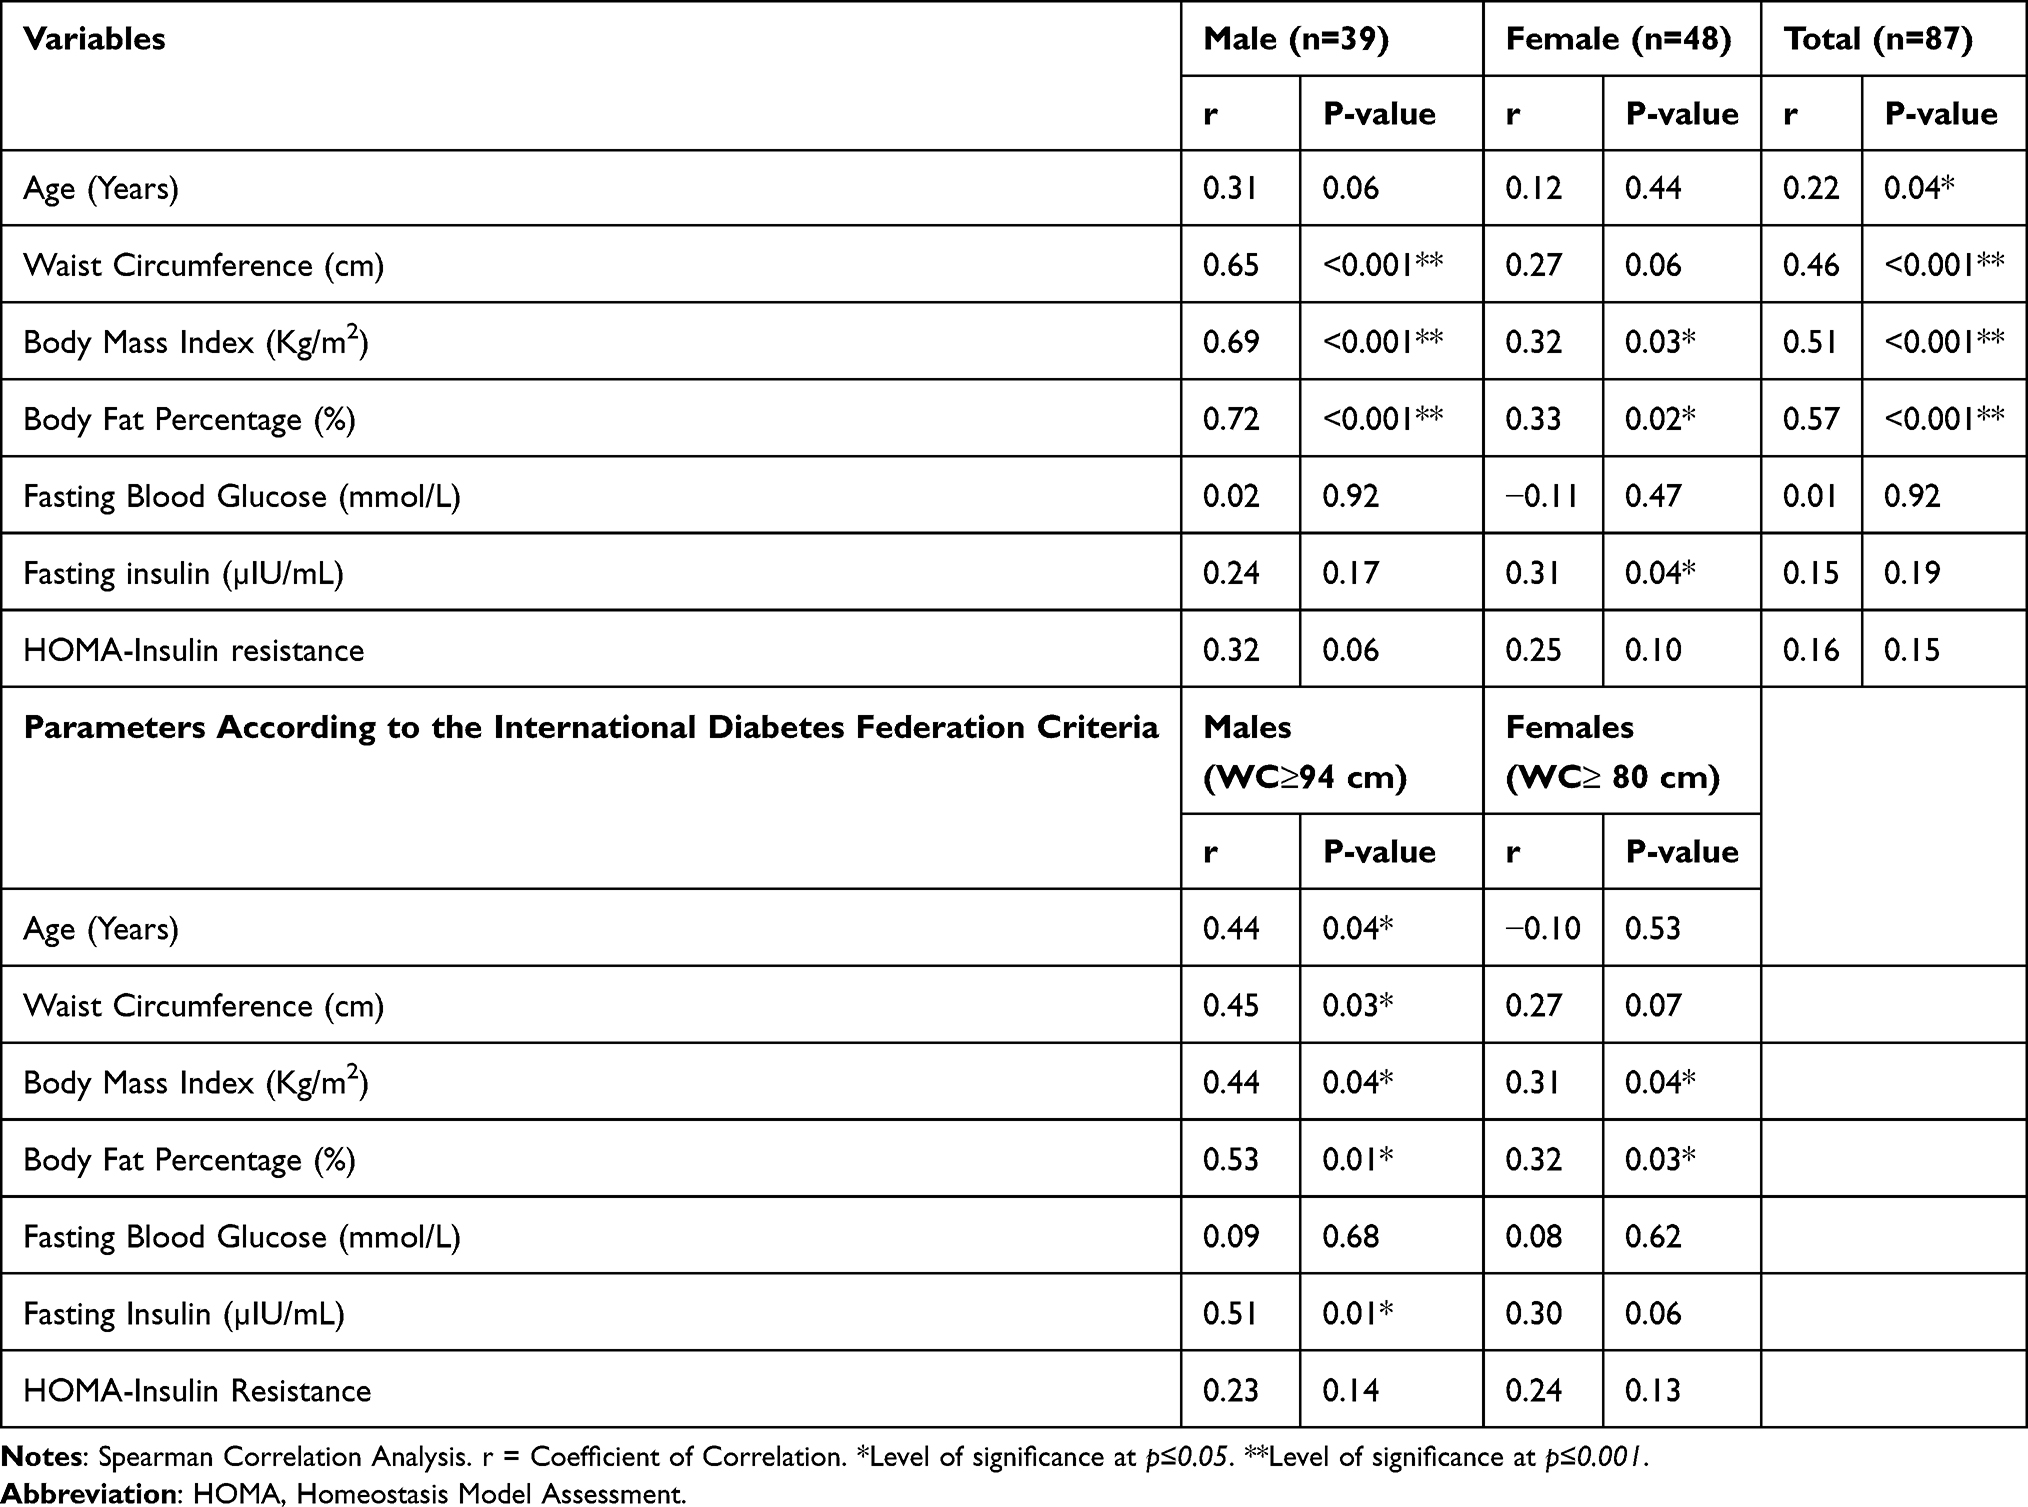 |
Table 3 Relations of Log-Transformed Plasma Leptin Concentrations to Demographic- Metabolic Variables According to Gender/Total Sample and International Diabetes Federation (IDF) Classification of Central Obesity |
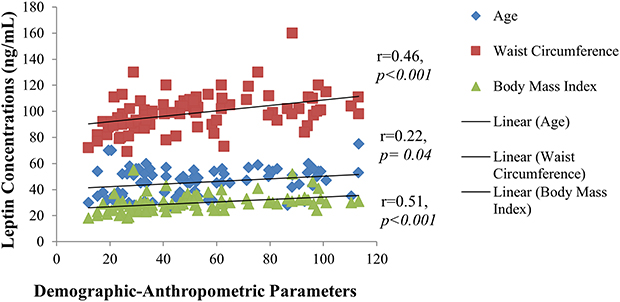 |
Figure 2 Positive Correlations of Plasma Leptin with Demographic-Anthropometric Variables in all Subjects. Abbreviations: WC, Waist Circumference; BMI, Body Mass Index and Age. |
In males, these significant correlations persisted with body fat percentage, BMI and WC, with two to two and half times higher correlation values in males than females and marginal (p=0.06 and p=0.059, respectively) correlations with HOMA-IR and age. The females only showed positive correlation of plasma leptin to BMI (p=0.025), body fat percentage (p=0.02) and fasting insulin (p=0.04), with marginal correlation to WC (p=0.06) (Table 2).
Furthermore, by the IDF criteria for defining central obesity, 23 (26.4%) of the males were centrally obese, while 44 (50.6%) of the females were same. Plasma leptin showed significantly (p≤0.05) stronger positive correlations with obesity indices (BFP, WC and BMI) amongst the centrally obese male subjects than female centrally obese (Table 2). Fasting insulin and age became significantly (p≤0.05) positively correlated to central obesity amongst male centrally obese subjects, with marginal correlation of leptin with FI in female centrally obese subjects (Table 2).
Further Assessment of Relationship Between Log-Transformed Plasma Leptin and Selected Demographic-Metabolic Variables by Step-Wise Multivariate Logistic Regression Analysis
In Stepwise Regression analysis, using log-transformed leptin (Ln10Leptin) as the dependent variable and age, sex, fasting insulin, fasting blood glucose, BFP, WC and BMI as independent variables; BFP, WC, BMI, generalized obesity ≥ 30 kg/m2, combined pre-obesity and obesity by BMI ≥ 25 kg/m2, age and sex were associated with log-transformed hyperleptinaemia in the unadjusted model (Table 4). Following adjustments, BMI, BFP and WC were independent predictors of hyperleptinaemia in the whole sample population with higher Odds in males {(WC, OR: 1.2, 95% CI, 1.06–1.36, p=0.004, when adjusted for age and sex and WC; OR: 1.2, 95% CI, 1.05–1.38, p=0.009, when adjusted for age, sex, FBG, FI and HOMA-IR); (Body fat percentage, OR: 1.44, 95% CI, 1.13–1.83, p=0.003, when adjusted for age, sex and WC and BFP, OR: 1.41, 95% CI, 1.07–1.84, p=0.013 when adjusted for age, sex, FBG, FI and HOMA-IR)}. BMI also showed higher odds of being associated with hyperleptinaemia in males (OR: 1.6, 95% CI, 1.80–2.28, p=0.004, when adjusted for age, sex and BMI and OR: 1.6, 95% CI, 1.13–2.31, p=0.008, when adjusted for age, sex, FBG, FI, HOMA-IR} (Table 5). There was no significant (p>0.05) independent predictor of hyperleptinaemia in females.
 |
Table 4 Association of Log-Transformed Plasma Leptin (Ln10Leptin) with Demographic-Metabolic Parameters in the Unadjusted Model |
 |
Table 5 Association of Log-Transformed Plasma Leptin (Ln10Leptin) with Demographic-Metabolic Parameters in the Adjusted Model |
Generalized obesity and combined pre-obesity and obesity were also independent (p<0.001) predictors of hyperleptinaemia with 11 times Odd among the male subjects by Relative Risk assessment with Pearson’s Chi-square analysis (Data not shown). Female sex was significantly (p<0.001) associated with hyperleptinaemia in the unadjusted (Table 4) and BMI, WC, BFP, FBG and generalized obesity adjusted models, however with low Odds (<1) (Data not shown).
Age was significantly (p=0.023) associated with hyperleptinaemia however, the Odds were low for subjects ≥ 45 years (OR: 0.61, 95% CI, 0.37–1.01) and high (OR: 1.84, 95% CI, 1.12–3.02) for younger subjects (Table 4).
Further, HOMA-IR, FBG, fasting insulin showed no associations with hyperleptinaemia in the unadjusted (Table 4) and adjusted models (Table 5). Central obesity by IDF criteria was also not significantly (p>0.05) associated with hyperleptinaemia.
Finally, there was a high prevalence of log-transformed hyperleptinaemia with 63(72.4%) subjects having hyperleptinaemia and 24(27.6%) having normoleptinaemia. Of these, a larger proportion of females 42(87.5%) were hyperleptinaemic as against 18 (46.2%) of males with same. There were 6(12.5%) of female subjects with normoleptinaemia while 21(53.8%) of the males were normoleptinaemic.
Discussion
This study showed increasing level of plasma leptin from normal BMI category to pre-obese and obese groups irrespective of sex. This is consistent with previous reports from most African,16,24,28,30–33 American14,17,18,21,27,34 and studies from other continents.22,23,25,26,35,37 There was however, variations in Median leptin concentrations across populations, ethnicities and geographical locations. Most African-American, even population-based studies,17,18,27,28,34,36 reported higher leptin levels in blacks than whites, attributed to higher subcutaneous tissue than visceral adipose tissue, as more leptin is produced from the latter than the former.34 Genetic, geographic, study selection criteria and dietary pattern may also vary across populations studied. The high Median leptin levels in this study is somewhat similar to previous reports in Industrialized countries,18,22,23,25,27,35,36 some African24,26 and Nigerian studies.16,31,32 It however, contrasts report of much lower leptin levels in some other geographical locations.33,44 In the present study, specimens were stored with aprotinin. Aprotinin inhibits the proteinases enzymes that degrade leptin molecules, as endogenous leptin is unstable and has a short half-life, hence, easily biodegradable.14 Ethnic differences may occur, depending on the lean body mass of the subjects selected as well as differences in mean age of the study population. In one particular study, mean BMI was 25.26±5.0 kg/m2 in males and 25.33±4.48 kg/m2 in females,33 as against the average BMI of 29.0 ± 6.2 kg/m2 and 30.3 ± 7.0 kg/m2 in males and females respectively in this study, as well as the higher percentage body fat in both males and females of this study. Some other studied older adults44 and leptin levels have been shown to decline with aging due to loss of subcutaneous tissue mass which produces more leptin.25,26
Although low levels of leptin have been detected in the epithelia of stomach, placenta, skeletal muscle, mammary gland, chondrocytes and a variety of tissues,3,6 the plasma leptin concentrations correlate with amount of fat tissue;17,27,28,30,34 thus obese individuals produce higher levels of leptin than lean ones.17,22–24,27,35–37 The positive correlation of plasma leptin with indices of obesity, inclusive of BMI, body fat percentage and WC, which were also shown to be independent predictors of hyperleptinaemia in males as well as all subjects combined, corroborates previous findings.16,17,27,28,30,34 This suggests that most obese people may be insensitive to endogenously produced leptin, a term otherwise referred to as “leptin resistance”.3,14,15
Leptin is synthesized and secreted by adipocytes and its blood concentrations give a reflection on the amount of energy stored in adipose tissues.3,6 Circulatory levels in lean individuals ranges from 5–15 ng/mL45 and its deficiency leads to augmented appetite and increased food intake resulting in morbid obesity.14,15 The multiple effects and strategic importance of leptin can be seen in the intracellular signals it initiates upon binding with leptin receptors.3,6,12–15 Only the LepRb (long form) has the intracellular capacity to trigger JAK-2-STAT-3 signalling pathway in the hypothalamus, making it the primary etiological factor of leptin specific manifestations.3,11–15 Several mechanisms have been postulated to explain leptin resistance found in obesity, inclusive of the rare OB and DBU gene mutation, with consequent structural changes in leptin molecule, resulting in hyperphagia, obesity immediately after birth and hypothalamic hypogonadism in homozygotes;3,4,11–13,19,20 though this may not explain leptin resistance in the general population.3,5
Other mechanisms include altered leptin transport across the blood brain barrier (BBB) due to apoptosis of arcuate and hypothalamic neurons, loss of tanycytes (ependymal cells at the median eminence of hypothalamus) and loss of transporters at the BBB, consequent on obesity and intake of high fat diet.14 Leptin resistance can also occur from downregulation of leptin activated signal transduction pathway.14,15 External stimuli such as hunger and overeating, as well as altered circadian rhythm, which modulates leptin expression can result in 30% average increase in night-time leptin levels.3,5,46 Leptin also functions by linking the neuroendocrine system to the immune system via its pro-inflammatory cytokine effect.6 Hyperleptinaemia has been shown to induce low grade inflammatory state by regulating the expression of inflammatory cytokines such as interleukin (IL-1β, IL-6, IL-8), tumour necrosis factor-alpha (TNF-α), C-reactive protein and low levels of IL-10 in the subcutaneous adipose tissue of centrally obese, hyperglycaemic, insulin resistant and hypertriglyceridaemic subjects.3,13,14,27 This study is limited by the lack of assessment of inflammatory cytokines which need to be assayed in subsequent studies. Leptin can also induce stress within the endoplasmic reticulum (ER) as well as autophagy disorders.3,46
Genetic polymorphisms have been described such as the Q223R polymorphism associated with BMI, body fat accumulation, increased leptin levels and blood pressure.47 Other leptin receptor gene polymorphisms have been reported to be associated with obesity amplified leptin production and secretion.3,11,45–47 This study is limited in this regard as genetic studies were not done to determine any such associations, which need to be elucidated in Nigerian-Africans in further studies.
Leptin induced adipocyte apoptosis, has been a surprising recent finding and both pro and anti-anti-apoptotic effects of leptin have been demonstrated in several cell types including anti-apoptotic effects in certain types of cancer cells - effects probably mediated through autocrine and paracrine effects.48 Therefore, in obesity, the above mentioned mechanisms, inclusive of adipocyte hypoxia, may lead to a state of insulin resistance, chronic inflammation and macrophage infiltration; reduction in adiponectin levels (anti-inflammatory and anti-tumorigenesis molecule); hyperleptinaemia; adipocyte apoptosis; ER stress and mitochondrial dysfunction, with consequent cancer risk in obese subjects.3,5,46–49
A direct sex-specific relationship was observed between plasma leptin and metabolic variables viz-a-viz.: HOMA-IR and age in males and fasting insulin in females and centrally obese males. This finding supports previous data on African-Americans,21,27,34 Sub-Saharan Africans,30–32 as well as other ethnicities.23,26,29,35,37 In fact, hyperinsulinaemia and insulin resistance have been reported to induce hyperleptinaemia via enhanced adiposity.30,36
Consistent with previous reports was a gender difference in leptin levels, with females having higher levels than males across all BMI categories. This is due to oestrogenic stimulation of leptin production and androgenic inhibition of same, as well as increased leptin expression in subcutaneous adipose tissue, which is more in women than visceral adipose tissue in men.23,24,34 The Odds of female sex being independently associated with hyperleptinaemia was low in all models, suggesting a protective role of hyperleptinaemia in females compared to males whose Odds were double. This suggests that centrally or generalized obese black African males are at adverse risk of metabolic effects of hyperleptinaemia, further buttressing the adverse consequence of “Pot belly syndrome” in men, its associated insulin resistance and consequent type-2 diabetes, hypertension and cardiovascular disease.5,11,13
Furthermore, the larger proportion of subjects with hyperleptinaemia, with most females being affected than males is in keeping with previous reports of 92.5% among Nigerian obese women in Lagos;31 thus suggesting the role of subcutaneous adiposity in females being more associated with hyperleptinaemia, while visceral obesity is more in keeping with insulin resistance and hyperinsulinaemia in men.17
Finally, there is a recent trend in which strategies that enhance BBB permeability of leptin are being developed and advocated in Industrialized Nations for the treatment of obesity and metabolic syndrome.13,14 These include the modification of leptin structure, development of leptin mimetic and analogues, new leptin receptor agonists, as well as use of combination therapy with molecules that reduce leptin resistance and enhance leptin sensitivity.14 Africans especially sub-Saharan Africans should embrace this direction and carry out further clinical studies, since it is clear from this study that leptin resistance and not deficiency is their major problem.
Limitations
Cross-sectional studies such as this may not elucidate mechanisms or determine the cause-effect relationship of plasma leptin on obesity/pre-obesity in comparison to normal BMI in healthy individuals, hence longitudinal/prospective and population based studies to incorporate larger sample sizes, are advocated across the geopolitical zones of Nigeria and other sub-Saharan African countries, to further clarify the role of leptin in obesity and HOMA-IR among black Africans. Dual energy X-ray absorptiometry which is the gold standard for determining body fat percentage, though not feasible for routine testing, unavailable in resource poor centres and exorbitant when available, was not utilized in this study. However, the use of the formula extrapolated from anthropometric measures has been used in previous reports which made valid conclusions.
Conclusion
Plasma leptin concentrations, fasting insulin and insulin resistance are higher in obese and pre-obese than normal controls, with females showing higher leptin levels than males. Leptin showed direct independent relationship with BMI, BFP, WC, female sex and generalized/central obesity in Nigerian-Africans especially males. Leptin showed sex-specific relations to age, fasting insulin and HOMA-IR. Sub-Saharan Africans should embrace further studies on combination therapy in treatment of obesity associated with leptin resistance.
Recommendations
The findings here are a clarion call to healthy Northern Nigerian-Africans especially male obese subjects to embark on the World Health Organisation recommended lifestyle modification in a bid to prevent obesity-related diseases and cardiovascular mortality. Body fat percentage, waist circumference and BMI being independent modifiable predictors of hyperleptinaemia in all obese subjects especially males, suggests religious measurement of these indices for evaluation of health risk of Nigerian-Africans. Further studies should incorporate genetic studies for the leptin gene polymorphisms in African blacks. Other hormones such as adiponectin, ghrelin should be evaluated in subsequent studies as found in the white population, as they may have been important confounders that should be subsequently clarified (Currently concluded - Unpublished Data).
Data Sharing Statement
All data generated or analysed during this study are included in this published article.
Ethics Approval and Consent to Participate
Institutional ethical approval was obtained from the Health Research Ethics Committee (ABUTH/HREC/S16), ABUTH, Zaria, Nigeria. Written informed consent from all study participants after full explanation of the purpose and nature of all procedures used were obtained.
Acknowledgments
Many thanks to the laboratory Scientist of Ahmadu Bello University Teaching Hospital, Zaria, Mrs Lilian O. Okonkwo for laboratory assistance.
Author Contributions
All authors made a significant contribution to the work reported, whether that is in the conception, study design, execution, acquisition of data, analysis and interpretation, or in all these areas; took part in drafting, revising or critically reviewing the article; gave final approval of the version to be published; have agreed on the journal to which the article has been submitted; and agreed to be accountable for all aspects of the work.
Funding
Emzor Pharmaceuticals Industries Limited Nigeria supported the research.
Disclosure
The authors report no conflicts of interest for this work.
References
1. Ram RM, Beena G, Ragunathan P, Malathi R. Analysis of structure, function and evolutionary origin of the ob gene product - Leptin. J Biomol Struct Dyn. 2007;25(2):183–188. doi:10.1080/07391102.2007.10507167
2. Gaucher EA, Miyamoto MM, Benner SA. Evolutionary, structural and biochemical evidence for a new interaction site of the leptin obesity protein. Genetics. 2003;163(4):1549–1553. doi:10.1093/genetics/163.4.1549
3. Gruzdeva O, Borodkina D, Uchasova E, Dyleva Y, Barbarash O. Leptin resistance: underlying mechanisms and diagnosis. Diab Metab Syndr Obes. 2019;12:191–198. doi:10.2147/DMSO.S182406
4. Maurya R, Bhattacharya P, Dey R, Nakhasi HL. Leptin functions in infectious diseases. Front Immunol. 2018. doi:10.3389/fimmu.2018.02741
5. Vilahur G, Ben-Aicha S, Badimon L, Notes A. New insights into the role of adipose tissue in thrombosis. Cardiovasc Res. 2017;113(9):1046–1054. doi:10.1093/cvr/cvx086
6. Fantuzzi G, Faggioni R. Leptin in the regulation of immunity, inflammation and haematopoesis. J Leukoc Biol. 2000;68:437–446.
7. Reid LR, Baldock PA, Cornish J. Effects of leptin on the skeleton. Endocr Rev. 2018;39(6):938–959. doi:10.1210/er.2017-00226
8. Schutte AE, Schutte R. Leptin: a cardiovascular perspective. JEMDSA. 2012;17(2):72–76.
9. Minokoshi Y, Toda C, Okamoto S. Regulatory role of leptin in glucose and lipid metabolism in skeletal muscle. Indian J Endocrinol Metab. 2012;16(Suppl 3):S562–S568. doi:10.4103/2230-8210.105573
10. Andreoli MF, Donato JJ, Cakir I, Perello M. Leptin resensitisation: a reversion of leptin-resistant states. J Endocrinol. 2019;241(3):R81–R96. doi:10.1530/JOE-18-0606
11. Fuster JJ, Ouchi N, Gokce N, Walsh K. Obesity-induced changes in adipose tissue microenvironment and their impact on cardiovascular disease. Circ Res. 2016;118:1786–1807. doi:10.1161/CIRCRESAHA.115.306885
12. Allison MB, Myers MG. 20 years of leptin: connecting leptin signalling to biological function. J Endocrinol. 2014;223(1):T25–T35. doi:10.1530/JOE-14-0404
13. Wasim M. Role of leptin in obesity. Obes Weight Loss Ther. 2015;5(2):258–261.
14. Izquierdo AG, Crujeiras AB, Casaneura FF, Carreira MC. Leptin, obesity and leptin resistance: where are we 25 years later. Nutrients. 2019;11(11):2704. doi:10.3390/nu11112704
15. Farr OM, Gavrieli A, Mantzoros CS. Leptin applications in 2015: what have we learned about leptin and obesity? Curr Opin Endocrinol Diab Obes. 2015;22(5):353–359. doi:10.1097/MED.0000000000000184
16. Ebesunun MO, Okeke DC. Serum leptin correlated with anthropometric indices in obese subjects. J Metab Syndr. 2014;3(4):157–162.
17. Rasmussen-Torvik LJ, Wassel CL, Ding J, et al. Associations of body mass index and insulin resistance with leptin, adiponectin, and the leptin-to-adiponectin ratio across ethnic groups: the multi-ethnic study of atherosclerosis (Mesa). Ann Epidemiol. 2012;22(10):705–709. doi:10.1016/j.annepidem.2012.07.011
18. Feitosa AC, Mancini MC, Cercato C, Villares SM, Halpern A. Metabolic profile according to leptin levels in obese patients. Arq Bras Endocrinol Metabol. 2007;51(1):59–64. doi:10.1590/S0004-27302007000100010
19. Paz-Filho G, Mastronardi C, Delibasi T, Wong ML, Licinio J. Congenital leptin deficiency: diagnosis and effects of leptin replacement therapy. Arq Bras Endocrinol Metabol. 2010;54(8):690–697. doi:10.1590/S0004-27302010000800005
20. Ramachandrappa S, Farooqi IS. Genetic approaches to understanding human obesity. J Clin Invest. 2011;121(6):2080–2086. doi:10.1172/JCI46044
21. Leon-Cabrera S, Solís-Lozano L, Suárez-álvarez K, González-Chávez A, Béjar YL, Robles-Díaz G. Hyperleptinemia is associated with parameters of low-grade systemic inflammation and metabolic dysfunction in obese human beings. Front Integr Neurosci. 2013;7(62):1–7. doi:10.3389/fnint.2013.00062
22. Kazmi A, Sattar A, Hashim R, Khan SP, Younus M, Khan FA. Serum leptin values in the healthy obese and non-obese subjects of Rawalpindi. J Pakist Med Assoc. 2013;63(2):245–248.
23. Al Maskari MY, Alnaqdy AA. Correlation between Serum leptin levels, body mass index and obesity in Omanis. Sultan Qaboos Univ Med J. 2006;6(2):27–31.
24. Awede B, Adovoekpe D, Adehan G, et al. Adiponectin, in contrast to leptin, is not associated with body mass index, waist circumference and HOMA-IR in subjects of a West-African population. Physiol Rep. 2018;6(11):e13718–e13724. doi:10.14814/phy2.13718
25. Isiclori AM, Strollo F, Morè M, et al. Leptin and aging: correlation with endocrine changes in male and female healthy adult population of different body weights. J Clin Endocrinol Metab. 2000;85:1954–1962. doi:10.1210/jcem.85.5.6572
26. Al-Sultan AI, Al-Elq AH. Leptin levels in normal weight and obese Saudi adults. J Fam Comm Med. 2006;13(3):97–102.
27. Cohen SS, Fowke JH, Cai Q, Buchowski MS, Signorello LB, Hargreaves MK. Differences in the association between serum leptin levels and body mass index in black and white women: a report from the southern community cohort study. Ann Nutr Metab. 2012;60:90–99. doi:10.1159/000336180
28. van Zyl S, van der Merwe LJ, van Rooyen FC, Joubert G, Walsh CM. The relationship between obesity, leptin, adiponectin and the components of metabolic syndrome in urban African women, free state, South Africa. South Afr J Clin Nutr. 2017;30(3):68–73. doi:10.1080/16070658.2017.1267380
29. Mosamer MS, Elmahdi SA, Mursi D. Leptin and serum lipids among Sudanese obese in Khartoum State. IJAHMR. 2019;3(8):1–4.
30. Ayina CNA, Noubiap JJN, Ngoa LSE, Boudou P, Gautier JF, Mengnjo MK. Association of serum leptin and adiponectin with anthropomorphic indices of obesity, blood lipids and insulin resistance in a Sub-Saharan African population. Lipids Health Dis. 2016;15:96. doi:10.1186/s12944-016-0264-x
31. Osegbe I, Okpara H, Azinge E. Relationship between serum leptin and insulin resistance among obese Nigerian women. Ann Afr Med. 2016;15(1):14–19. doi:10.4103/1596-3519.158524
32. Adejumo EN, Adejumo OA, Azenabor A, et al. Leptin: adiponectin ratio discriminated the risk of metabolic syndrome better than adiponectin in South West Nigeria. Diab Metab Syndr. 2019;13(3):1845–1849.
33. Yusuf NW, Mabrouk MA, Girei AB, Mohammed A. Relationship between leptin and indices of obesity among apparently healthy adults in Kano, Northwestern Nigeria. Intern J Med Sci Pub Health. 2015;4(9). doi:10.5455/ijmsph.2015.19042015236
34. Considine RV, Premkumar A, Reynolds JC, Sebring NG, Ricks M, Sumner AE. Adiponectin and leptin in African Americans. Obesity. 2008;16:428–434. doi:10.1038/oby.2007.80
35. Fadoua TG, de León C, Ferid M, Mohsen S, Nebil A. Leptin, insulin and lipid profiles in obese subjects with and without metabolic syndrome in the region of Cap-Bon: Tunisia. Endocrinol Metab Synd. 2015;4(3):193. doi:10.4172/2161-1017.1000193
36. Jamar G, Caranti DA, de Cassia CH, Masquio DC, Bandoni DH, Pisani LP. Leptin as a cardiovascular risk marker in metabolically healthy obese: hyperleptinemia in metabolically healthy obese. Appetite. 2017;108:477–482. doi:10.1016/j.appet.2016.11.013
37. Sharma V, Sharma N. Leptin signalling - Leptin resistance in obesity and its correlation with body mass index. Natl J Physiol Pharm Pharmacol. 2018;8(6):817–819.
38. World Health Organization. Global database on body mass index. Available from: http://apps.who.int/bmi/index.jsp.
39. World Health Organization.WHO STEP wise approach to surveillance (STEPS). Waist circumference and waist-hip ratio: report of a WHO expert consultation. Geneva: World Health Organization; 2008. Available from: whqlibdoc.who.int/publication/2011/9789241501491_eng.pdf.
40. Bruso J. How to convert BMI to body fat percentage. Available from: www.livestrong.com.
41. International Diabetes Federation. IDF Diabetes Atlas.
42. Targher G, Alberiche M, Bonadonna RC, et al. Homeostasis model assessment closely mirrors the glucose clamp technique in the assessment of insulin sensitivity: studies in subjects with various degrees of glucose tolerance and insulin sensitivity. Diab Care. 2000;23:57–63. doi:10.2337/diacare.23.1.57
43. Renzaho AM, Nowson CA, Kaur A, Halliday JA, Fong DM, De Silva J. Prevalence of vitamin D insufficiency and risk factors for type-2 diabetes and cardiovascular disease among African migrant and refugee adults in Melbourne. Asia Pacific J Clin Nutr. 2011;20:397–403.
44. Ruhl CE, Everhart JE, Ding J, et al. Serum leptin concentrations and body adipose measures in older black and white adults. Am J Clin Nutr. 2004;80(3):576–583. doi:10.1093/ajcn/80.3.576
45. Yang R, Barouch LA. Leptin signalling and obesity cardiovascular consequences. Circulation Res. 2007;101:545–559. doi:10.1161/CIRCRESAHA.107.156596
46. Zhou Y, Rui L. Leptin signalling and leptin resistance. Front Med. 2013;7(2):207–222. doi:10.1007/s11684-013-0263-5
47. Chumakova GA, Ott AV, Veselovskaya NG, Gritsenko OV, Shenkova NN. Pathogenetic mechanisms of leptin resistance. Russ J Cardiol. 2015;4(4):107–110. doi:10.15829/1560-4071-2015-4-107-110
48. Rayalam S, Della-Fera MA, Ambati S, Bante CA. Is leptin a pro or anti-apoptotic agent? In: Gertler A, editor. Leptin and Leptin Antagonists. CRC Press; 2009.
49. Amin MN, Hussain MS, Sarwar MS, Moghal MMR, Das A. How the association between obesity and inflammation may lead to insulin resistance and cancer. Diab Metab Syndr. 2019;13(2):1213. doi:10.1016/j.dsx.2019.01.041
 © 2021 The Author(s). This work is published and licensed by Dove Medical Press Limited. The full terms of this license are available at https://www.dovepress.com/terms.php and incorporate the Creative Commons Attribution - Non Commercial (unported, v3.0) License.
By accessing the work you hereby accept the Terms. Non-commercial uses of the work are permitted without any further permission from Dove Medical Press Limited, provided the work is properly attributed. For permission for commercial use of this work, please see paragraphs 4.2 and 5 of our Terms.
© 2021 The Author(s). This work is published and licensed by Dove Medical Press Limited. The full terms of this license are available at https://www.dovepress.com/terms.php and incorporate the Creative Commons Attribution - Non Commercial (unported, v3.0) License.
By accessing the work you hereby accept the Terms. Non-commercial uses of the work are permitted without any further permission from Dove Medical Press Limited, provided the work is properly attributed. For permission for commercial use of this work, please see paragraphs 4.2 and 5 of our Terms.