")
Back to Journals » Diabetes, Metabolic Syndrome and Obesity » Volume 12
K-means clustering of overweight and obese population using quantile-transformed metabolic data
Authors Li L , Song Q , Yang X
Received 24 February 2019
Accepted for publication 9 July 2019
Published 23 August 2019 Volume 2019:12 Pages 1573—1582
DOI https://doi.org/10.2147/DMSO.S206640
Checked for plagiarism Yes
Review by Single anonymous peer review
Peer reviewer comments 2
Editor who approved publication: Dr Konstantinos Tziomalos
Li Li,1 Qifa Song,2 Xi Yang1
1Department of Endocrinology and Metabolism, Ningbo First Hospital, Ningbo, People’s Republic of China; 2Department of Microbiology, Ningbo Municipal Centre for Disease Control and Prevention, Ningbo, People’s Republic of China
Correspondence: Qifa Song
Department of Microbiology, Ningbo Municipal Centre for Disease Control and Prevention, No. 237, Yongfeng Road, Ningbo, Zhejiang Province 315010, People’s Republic of China
Tel +86 05 748 727 4563
Email [email protected]
Objective: Use of K-means clustering for big data technology to cluster an overweight and obese population metabolically.
Methods: K-means clustering with the help of quantile transformation of attribute values was applied to overcome the impact of the considerable variation in the values of obesity attributes involving outliers and skewed distribution.
Results: Overall, 447 subjects were categorized into six clusters; metabolically normal, mild, and severe categories. There were clearly separated metabolically normal Cluster 1 and severe Cluster 2, as well as intermediate Cluster 3, 4, and 5 that had profiles of fewer attributes with abnormal values. Cluster 3 was characteristic of sole hypertension. Cluster 3 and 4 exhibited contrasting HDL-C and LDL-C levels despite similarly elevated total cholesterol. Cluster 6 with slightly elevated triglyceride was closest to the normal group. Four- and 10-quantile-transformations yielded consistent clustering results. Compared with the original data, the quantile-transformed data produced more regular and spherical clusters and evenly distributed clusters in terms of object numbers.
Conclusions: This big data analysis strategy makes use of quantile-transformation of data to overcome the issue of outliers and the irregular distribution and applies to the analysis of other non-communicable diseases.
Keywords: overweight and obesity, big data technology, quantile-transformation, K-means clustering
Introduction
The increased prevalence of overweight and obesity has become a major contributor to the global burden of diseases.1 Obesity is commonly associated with several abnormal metabolic attributes, such as insulin resistance, increased blood glucose,2 dyslipidemia (mainly increased triglyceride and decreased serum high-density lipoprotein cholesterol (HDL-C), and hypertension.3 These abnormal metabolic attributes are major contributors to a number of serious diseases from type 2 diabetes mellitus (T2DM), cardiovascular diseases and some cancers.4 They are often used as indices to classify obese patients into metabolically healthy and unhealthy subgroups. This classification is usually required for precision medicine and epidemiological description of obesity.5
Because of the vast number of people affected by overweight and obesity, as well as a wide array of causative risk factors and resultant clinical features, the relevant data have been becoming too large and complex for traditional data-processing application tools. These data are characteristic of high volume, variety, and velocity that comply with the definition of big data6 and require new architecture, algorithms, and analytics to manage and explore for hidden knowledge.7 In medicine, several big data analysis technologies, especially unsupervised data mining and clustering algorithms, are often used to uncover naturally occurring disease patterns or subgroups.8 This unsupervised clustering of data or patients is useful in precision medicine where the prerequisite is to identify subgroups of patients.
However, the application of big data analytics in obesity research and management still faces great challenges, such as complexities of data processing and management of high dimensional attributes.9 Notably, great variation in the values of obesity attributes is often a big problem that causes an irregular distribution of attribute values and generates uncertain proportions of value outliers. Consequently, the application and subsequent effects of big data analytics on obesity research are very limited.9 Empirically, if data are not actually distributed following an assumed distribution mode, or if potential sources yield value outliers that are distant from the mean of values, quantiles are more useful descriptive statistics than means or other continuous values and are insensitive to outliers and skewed distribution of values.10
To motivate the obesity data analysis by application of big data analysis technologies, we aimed to cluster obesity data using R computer programs with the help of quantile transformation of attribute values that mitigates the impact of skewed attribute value distribution.11 R, as an open source programming and scripting language, has extensive libraries of statistical packages, machine learning algorithms, and graphics tools that are widely used among statisticians and big data miners for developing statistical software and data analysis.12,13 For classification of the overweight and obese population according to metabolic indices has significant clinical implications, the present study used metabolic attributes to explore subgroups of the obese population.14
Methods
Study population
This study was approved by the Ethics Committee of Ningbo First Hospital and was conducted in accordance with the Declaration of Helsinki. All patients provided with written consent that informed them of the goal, benefits, medical information, and confidentiality agreement of the study. The study was followed as in a planned diagram (Figure 1). The study enrolled individuals who sought weight loss treatment in the hospital from July 2015 to December 2018. Patients with age of 18–75 years and body mass index (BMI) ≥24 kg/m2 were included. Patients with secondary obesity were excluded. Medical staff reviewed the medical history of the participants and performed a physical examination, including measurements of weight, height, systolic, and diastolic blood pressure. Fasting blood sugar (FBG), glycosylated hemoglobin (HbA1c), insulin, triglyceride, total cholesterol, low-density lipoprotein cholesterol (LDL-C) and HDL-C in serum were also measured. Data from the participants were retrospectively analyzed.
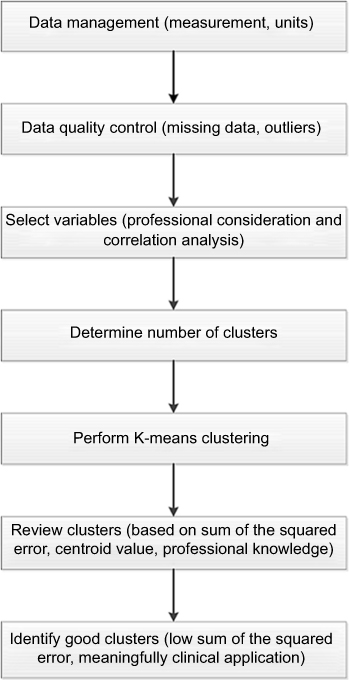 |
Figure 1 Study design. |
Attribute selected for clustering
Previous researches have used several attributes to classify obese patients into metabolically healthy and unhealthy subgroups.15–17 The attributes usually included FBG, HbA1c, and homeostasis model assessment insulin resistance (HOMA-IR) for T2DM, triglyceride, total cholesterol, LDL-C and HDL-C for dyslipidemia, and systolic and diastolic blood pressure for hypertension (Table S1).14 We initially included all the above-mentioned attributes to cluster the overweight and obese population based on the natural distribution of the values. Correlation matrix and parameters were reviewed to remove redundant attributes that were highly correlated with each other.
Data management
The primary challenges are missing data and value outliers in the big data analysis. In this study, less than 10% of missing value rate was achieved for each attribute. These missing data were tackled by the imputation method that used the median of each attribute to replace the missing data.18 Because outliers can greatly affect distribution and clustering, they were identified by the function boxplot() in R language. The outliers were 1.5 times of interquartile ranges less than the first quantile value or more than the third quantile value. Values of selected attributes were transformed into four-quantile values by the quantile method (Method S3) in R software package factoextra (version 1.0.5).19 In brief, four quantiles divided the data objects into four equal-sized groups. Values of all attributes within each of four intervals were assigned a digit of one through four, respectively.20 For instance, values less than the first quantile were assigned a digit one; values between the first quantile and the second quantile (also call median value) were assigned a digit two, and so on. The similar process was done for 10-quantile-transformation and assigned each value a digit of one through 10.
K-means clustering
After selection of attributes and data management, the prototype-based, partitional clustering on the selected attributes were then performed by our scripted program (Method S3) based on R software package factoextra (version 1.0.5).19 We first determined the optimal number of clusters via reviewing the gap statistics plotted against various numbers of clusters by the function fviz_gap_stat () in R package factoextra . Principally, K-means clustering involved calculating distance measure for all values and created a new center-based point that represented the means of values for each cluster. This new center-based point was called centroid professionally.21 Clusters of both original data and quantile-transformed data were obtained and compared. Objects in the data set were defined and visualized at the normal distributions of 68% and 95% confidence interval (CI).
Results
Overall, 447 (166 men and 281 women) overweight and obese participants with BMI>24 were included (Table S2). Of the participants, 115, 193, and 139 had BMI of 24.6–29.9, 30–34.9 and 35–55.1, respectively. Except for HOMA-IR whose reference range is inconsistent from different resources, the numbers of participants with elevated FBG and HbA1c were 46 and 51, respectively, while the numbers of participants with the remaining abnormal attributes ranged between 119 and 199 (Table S2).
Data quality was checked from the measurement to the collection process. Most outliers were found in the attributes with widely distributed values such as HDL-C, triglyceride, HbA1c, and FBG (Figure 2). The greatest outlier was observed in triglyceride. In nine attributes, ie, FBG, HbA1c, HOMA-IR, triglyceride, total cholesterol, LDL-C, HDL-C, systolic and diastolic blood pressure, there were 233 missing values that accounted for 5% (233/4023) of the total number of attribute values (Table S2). These missing values were replaced with the median of each attribute. After calculating and plotting the correlation matrix for every pair of nine candidate attributes, three types of associations were detected and designated as Type A, Type B, and Type C (Figure 3). Type A was a high correlation between FBG and HbA1c (r =0.81, 95% CI =0.77–0.84), as well as systolic blood pressure and diastolic blood pressure (r =0.75, 95% CI =0.71–0.79). Type B correlation existed between total cholesterol and HDL-C (r =0.22, 95% CI =0.14–0.31) as well as total cholesterol and LDL-C (r =0.45, 95% CI =0.37–0.52). Correlation plot for two pairs of Type B attributes displayed two different components of the relationship in each pair (Figure 3). The remaining pairs of attributes demonstrated no obvious correlation. Therefore, on the basis of the correlation information, we removed diastolic blood pressure and HbA1c to reduce redundant information and selected seven attributes for clustering, ie, systolic blood pressure to represent blood pressure, FBG and HOMA-IR for glucose metabolism and insulin resistance, and total cholesterol, HDL-C, LDL-C, and triglyceride for lipid metabolism.
 |
Figure 2 Outliers in nine attributes. Abbreviations: SBP, systolic blood pressure; FINS, fasting insulin. |
 |
Figure 3 Correlation matrix of nine candidate attributes. Three types of correlation are observed. Type A is a high correlation between FBG and HbA1c, as well as between systolic blood pressure and diastolic blood pressure. Type B correlation exists between total cholesterol and HDL-C, as well as between total cholesterol and LDL-C. Type C exists in the remaining pairs of attributes. Abbreviations: SBP, systolic blood pressure; DBP, diastolic blood pressure; TC, total cholesterol; HDL-C, HDL cholesterol; LDL-C, LDL cholesterol; TG, triglyceride; HbA1c, glycosylated hemoglobin; FBG, fasting blood glucose; HOMA-IR, homeostasis model assessment insulin resistance. |
At clustering stage, six was arbitrarily selected as the optimal number of clusters because the curve became slowly up there, where indicated the best separation for 447 subjects (Figure 4). We also used four to nine as the optimal number of clusters to compare the resultant clusters. Nevertheless, from the professional knowledge, six was most suitable for differentiate clinically meaningful subgroups for precision medicine (results not shown). After transforming original data into four- and ten- quantiles that represented probability distribution of seven attributes, quantile-transformed data were used to calculate six clusters respectively at 95% and 68% CI (Both figures in Figure 5 and Left in Figure 6).
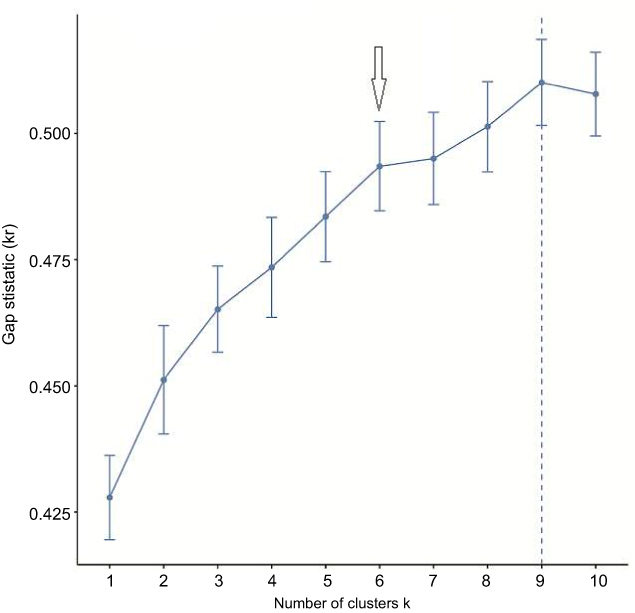 |
Figure 4 Specification of the optimal number of clusters. At the number six, the curve becomes slowly up. The arrow indicates the selected number. |
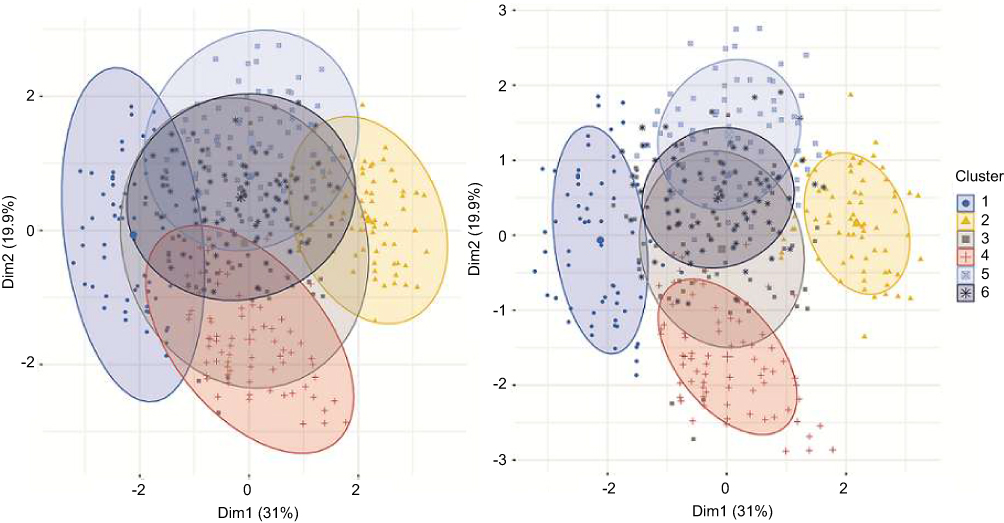 |
Figure 5 Six clusters generated from four-quantile-transformed obesity data by K-means clustering method. Left: 95% probability of normal distribution area is used to encircle objects. Right: 68% probability of normal distribution area is used to encircle objects. Decreasing the probability reduces the overlapping area. |
 |
Figure 6 Six clusters generated using 10-quantile-transformed and original obesity data. Left: Clusters were derived from 10-quantile-transformed obesity data with 95% probability of normal distribution area. The result is very similar to Figure 4. Right: Clusters derived from the original obesity data. The plot shows an uneven spread of clusters. The numbers of objects in each cluster vary dramatically. |
The clinical meaning of six clusters in terms of metabolism was evaluated through the means of seven attributes that were represented by cluster centroids (Table 1). The clusters were clinically graded into normal, mild, and severe categories. Cluster 1 was the sole normal group with seven attributes all at normal levels, whereas Cluster 2, which showed abnormal levels in systolic blood pressure, total cholesterol, LDL-C, triglyceride, HOMA-IR, and the highest FBG, was well separated from the normal group and represented the severe group (Table 1, Figure 5). Cluster 3, 4, and 5 had one to four abnormal attributes and demonstrated an intermediate state between normal and abnormal. Cluster 3 was characteristic of significantly elevated systolic blood pressure. Cluster 6 showing slightly elevated HOMA-IR was very close to Cluster 1 in the normal group.
 |
Table 1 Part 1. Attribute values represented by centroids of clusters obtained by four-quantile-transformed data and K-means clustering method |
To evaluate the possible impact from different sizes of quantiles, clusters at 95% CI derived from four-quantile-transformed data (Left in Figure 5) were compared with those from ten-quantile-transformed data (Left in Figure 6). High similarity was found between two graphs. Compare with the cluster at 95% CI (Left in Figure 5), the cluster at 68% CI (Right in Figure 5) showed less overlapping area and more external objects. In addition, to evaluate the effect of data transformation, the original data were also clustered and plotted at 95% CI (Right in Figure 6). Remarkable differences were observed between the two methods. The graph from the original data was much less spherical and more irregular than those from the four- and ten-transformed data. The numbers of objects of each cluster in the original data graph also varied more widely, from 4 to 160, indicating the significant influence by unpredictable outliers.
Discussion
Clustering is a method to illustrate underlying centralizing trends in the distribution of values, especially for those without available distribution information that are difficult to be categorized by a traditional classification. In the present study, after tackling irregular distribution and outliers by quantile transformation, 447 overweight and obese subjects were successfully clustered into six groups by K-means clustering. In terms of metabolism, these clusters well represented normal, mild, and severe groups each with characteristic clinical features.
Big data analysis usually involves three stages, ie, data preprocessing, data mining that was K-means clustering in this study, and data post-processing. At the preprocessing stage, the present study included the selection of attributes for clustering, as well as handling of outliers and missing values. In obesity research, a multitude of attributes and features are usually available, such as a metabolic panel, hormones and physical examination panel.22 Here, we focused on a metabolic panel of attributes that usually include blood pressure, lipid, and glucose metabolic factors.14 A fundamental principle for selecting attributes is to choose a set of attributes whose pairwise correlation is as low as possible and to remove those redundant and irrelevant attributes.23 As mentioned above, HbA1c and diastolic blood pressure were removed for redundancy.
The next issue was outliers and missing values.24 As showed by maximal value/minimal value and SD/mean (Table S2), different attributes varied dramatically in distribution ranges, ranging from the lowest in systolic blood pressure to the top two highest in triglyceride and HOMA-IR. The distinct distribution features resulted in different outlier occurrence, which could influence the clusters unexpectedly and generate nonrepresentative cluster centroids.25 Since it is very difficult to accurately assess and totally eliminate such influence, we transformed the attribute values into quantiles to minimize the effect of these outliers and skewed distribution.
At the data mining stage, K-means clustering was used because it generates non-hierarchical clusters without sub-clusters. This method is capable of finding a user-specified number of clusters (K), which are represented by their centroids. We took into account both professional knowledge and the analysis recommendation (Figure 4) and specified six as the optimal number of clusters. The gap statistic yielded by the R package factoextra function fviz_gap_stat() is inversely correlated to the sum of the squared error (SSE) that measures the quality of clustering.26 A lower SSE indicates bigger gap statistic and clearer separation between clusters. At cluster number of six, the increment in the gap statistic turned to be slow, showing a slowly increasing SSE.
At K-means plotting, six clusters from 447 objects were clinically meaningful and consistent with the real clinical world (Figure 5, Table 1). Three cluster categories that were metabolically normal, mild and severe were the exact requisite classifications for precisely managing overweight and obese subjects.14 The quantile-transformed data produced more regular and spherical clusters and evenly distributed clusters in terms of the numbers of objects in each cluster (Both figures in Figure 5 and Left in Figure 6) than the clusters from the original data (Right in Figure 6), where some outliers were plotted far away from their centroids. Such weakness was greatly mitigated in quantile-transformed data (Both figures in Figure 5 and Left in Figure 6). This data transformation approach also displayed the sizes of the comparatively higher or lower levels instead of displaying only information about normal or abnormal values as against reference values. The clustering results from different quantile levels, such as four- (Both figures in Figure 5) and 10-quantiles (Left in Figure 6) were consistent. In contrast, previous researches metabolically categorized overweight and obese subjects using similar clinical features.5,27 As there are no accepted criteria for metabolism categorization, these previous researches yielded categories of overweight and obese subjects using combinations of subjectively selected attributes and reference values. Such traditional method has the risk of neglecting naturally existing combinations of features.
The final post-processing mainly involved the improvement of clustering and interpretation of the results. A notable challenge is a continuity in the attribute values of natural data that may produce overlapping and even fuzzy zones. This situation requires professional interpretation. Interpretation of the clusters as a whole group of objects instead of individuals was favored due to the overlapping zones between clusters. A modification of the probability of normal distribution can be used to reduce this problem. It was demonstrated by comparing the clustering plot with 95% CI (Left in Figure 5) with the 68% CI (Right in Figure 5). A lower CI such as 68% could alleviate the overlapping problem. The modification had little impact on the centroids values because of the normal distribution. Since the centroids values of each cluster could indicate the normal or abnormal trend, it was often a case of one-tailed statistic test. Taking Cluster 3 for instance, all objects with systolic blood pressure higher than 140 mmHg should be considered to be in this group. Consequently, the number of external objects was not as large as the volume of the probability value.
K-means clustering has some limitations. It cannot handle non-globular clusters. It also has trouble in clustering data with many outliers that exert an unexpected impact on the cluster shape. The primary goal of the present data transformation is to reduce these weaknesses.
To summarize, we have developed an unsupervised K-means clustering roadmap to cluster overweight and obese population into clinically meaningful subgroups. This method makes use of quantile-transformation of data to reduce the influences of outliers and irregular distribution. This big data analysis strategy is also applicable to the analysis of other commonly found non-communicable diseases.
Ethics approval and consent to participate
This study was approved by the Ethics Committee of Ningbo First Hospital and was conducted in accordance with the Declaration of Helsinki. All patients provided with written consent that informed them of the goal, benefits, medical information, and confidentiality agreement of the study.
Acknowledgments
This study was supported by the Natural Science Foundation of Ningbo, China (Grant No. 2016A610169), “Science and Technology Innovation 2025” Major Special Project of Ningbo (Grant No. 2019C50094), and Medical Health Science and Technology Project of Zhejiang Provincial Health Commission (Grant No. 2019KY579).
Disclosure
The authors report no conflicts of interest in this work.
References
1. Ng M, Fleming T, Robinson M, et al. Global, regional, and national prevalence of overweight and obesity in children and adults during 1980-2013: a systematic analysis for the Global Burden of Disease Study 2013. Lancet. 2014;384(9945):766–781. doi:10.1016/S0140-6736(14)60460-8
2. Li C, Ford ES, Zhao G, Kahn HS, Mokdad AH. Waist-to-thigh ratio and diabetes among US adults: the Third National Health and Nutrition Examination Survey. Diabetes Res Clin Pract. 2010;89(1):0–87. doi:10.1016/j.diabres.2010.02.014
3. Horan M. Body mass index and the prevalence of hypertension and dyslipidemia. Obes Res. 2012;8(9):605–619.
4. Lavie CJ, Deedwania P, Ortega FB. Obesity is rarely healthy. Lancet Diabetes Endocrinol. 2018;6:678–679. doi:10.1016/S2213-8587(18)30143-8
5. Stefan N, Haring HU, Hu FB, Schulze MB. Metabolically healthy obesity: epidemiology, mechanisms, and clinical implications. Lancet Diabetes Endocrinol. 2013;1(2):152–162. doi:10.1016/S2213-8587(13)70062-7
6. Connelly R, Playford CJ, Gayle V, Dibben C. The role of administrative data in the big data revolution in social science research. Soc Sci Res. 2016;59:1–12. doi:10.1016/j.ssresearch.2016.04.015
7. Harper E. Can big data transform electronic health records into learning health systems? Stud Health Technol Inform. 2014;201:470–475.
8. Deo RC. Machine learning in medicine. Circulation. 2015;132(20):1920–1930. doi:10.1161/CIRCULATIONAHA.115.001593
9. Timmins KA, Green MA, Radley D, Morris MA, Pearce J. How has big data contributed to obesity research? A review of the literature. Int J Obes (Lond). 2018;42(12):1951–1962. doi:10.1038/s41366-018-0153-7
10. Guloksuz S, Li F, Tek C, et al. Analyzing the duration of untreated psychosis: quantile regression. JAMA Psychiatry. 2016;73(10):1094–1095. doi:10.1001/jamapsychiatry.2016.2013
11. Cohen ME, Horning GM. A quantile plot for simultaneous representation of clinical and statistical attributes of probing change: application to early identification of the downhill patient. J Periodontal Res. 1998;33(4):187–195.
12. Hornik K (November 26, 2015). “R FAQ”. The comprehensive R archive network. 2.1 what is R? Available from: https://cran.r-project.org/.
13. Sanchez-Pinto LN, Luo Y, Churpek MM. Big data and data science in critical care. Chest. 2018;154(5):1239–1248. doi:10.1016/j.chest.2018.04.037
14. Iacobini C, Pugliese G, Blasetti Fantauzzi C, Federici M, Menini S. Metabolically healthy versus metabolically unhealthy obesity. Metabolism. 2019;92:51–60. doi:10.1016/j.metabol.2018.11.009.
15. Kyung Mook C, Hyun Joo C, Hae Yoon C, et al. Higher mortality in metabolically obese normal-weight people than in metabolically healthy obese subjects in elderly Koreans. Clin Endocrinol (Oxf). 2013;79(3):364–370. doi:10.1111/cen.12154
16. Hinnouho GM, Czernichow S, Dugravot A, Batty GD, Kivimaki M, Singh-Manoux A. Metabolically healthy obesity and risk of mortality: does the definition of metabolic health matter? Diabetes Care. 2013;36(8):2294–2300. doi:10.2337/dc12-1654
17. Ortega FB, Lee DC, Katzmarzyk PT, et al. The intriguing metabolically healthy but obese phenotype: cardiovascular prognosis and role of fitness. Eur Heart J. 2013;34(5):389–397. doi:10.1093/eurheartj/ehs174
18. Hand DJ, Adèr HJ, Mellenbergh GJ. Advising on Research Methods: A Consultant’s Companion. Huizen, Netherlands: Johannes van Kessel;2008:305–332. ISBN 90-79418-01-3.
19. Factoextra: Extract and Visualize the Results of Multivariate Data Analyses. 2019; 92: 15–60. doi:10.1016/j.metabol.2018.11.009. Available from: http://www.sthda.com/english/rpkgs/factoextra.
20. Hyndman R J, Fan Y. Sample Quantiles in Statistical Packages. The American Statistician. 1996;50(4):361-365.
21. Tan P-N, Steinbach M, Karpatne A, Kumar V. Introduction to Data Mining.
22. American College of Cardiology/American Heart Association Task Force on Practice Guidelines OEP. Expert panel report: guidelines (2013) for the management of overweight and obesity in adults. Obesity (Silver Spring). 2014;22 Suppl 2:S41–410. doi:10.1002/oby.20660
23. Molina LC, Belanche L, Nebot A. Feature selection algorithms: a survey and experimental evaluation:
24. Hong C, Hauskrecht M. Multivariate conditional outlier detection and its clinical application. Proc Conf AAAI Artif Intell. 2016;2016:4216–4217.
25. Zhao S, Li W, Cao J. A user-adaptive algorithm for activity recognition based on K-means clustering, local outlier factor, and multivariate gaussian distribution. Sensors (Basel). 2018;18(6):1850. doi:10.3390/s18061850
26. Wilkin GA, Huang X. A practical comparison of two K-means clustering algorithms. BMC Bioinformatics. 2008;9. doi:10.1186/1471-2105-9-S6-S19
27. De LA, Da CLC, Lessa R, Asb M. “Metabolically healthy” obesity: fact or threat? Curr Diabetes Rev. 2018;14:405–410. doi:10.2174/1573399813666170502105859
 © 2019 The Author(s). This work is published and licensed by Dove Medical Press Limited. The full terms of this license are available at https://www.dovepress.com/terms.php and incorporate the Creative Commons Attribution - Non Commercial (unported, v3.0) License.
By accessing the work you hereby accept the Terms. Non-commercial uses of the work are permitted without any further permission from Dove Medical Press Limited, provided the work is properly attributed. For permission for commercial use of this work, please see paragraphs 4.2 and 5 of our Terms.
© 2019 The Author(s). This work is published and licensed by Dove Medical Press Limited. The full terms of this license are available at https://www.dovepress.com/terms.php and incorporate the Creative Commons Attribution - Non Commercial (unported, v3.0) License.
By accessing the work you hereby accept the Terms. Non-commercial uses of the work are permitted without any further permission from Dove Medical Press Limited, provided the work is properly attributed. For permission for commercial use of this work, please see paragraphs 4.2 and 5 of our Terms.