")
Back to Journals » Journal of Inflammation Research » Volume 14
Interleukin -1β Promotes Lung Adenocarcinoma Growth and Invasion Through Promoting Glycolysis via p38 Pathway
Authors Tan Q, Duan L, Huang Q, Chen W, Yang Z , Chen J , Jin Y
Received 12 May 2021
Accepted for publication 5 November 2021
Published 2 December 2021 Volume 2021:14 Pages 6491—6509
DOI https://doi.org/10.2147/JIR.S319433
Checked for plagiarism Yes
Review by Single anonymous peer review
Peer reviewer comments 2
Editor who approved publication: Professor Ning Quan
Qi Tan,* Limin Duan,* Qi Huang,* Wenjuan Chen,* Zimo Yang, Jiangbin Chen, Yang Jin
Department of Respiratory and Critical Care Medicine, NHC Key Laboratory of Pulmonary Diseases of Health Ministry, Union Hospital, Tongji Medical College, Huazhong University of Science and Technology, Wuhan, 430022, Hubei, People’s Republic of China
*These authors contributed equally to this work
Correspondence: Yang Jin
Department of Respiratory and Critical Care Medicine, NHC Key Laboratory of Pulmonary Diseases of Health Ministry, Union Hospital, Tongji Medical College, Huazhong University of Science and Technology, 1277 Jiefang Avenue, Wuhan, 430022, Hubei, People’s Republic of China
Tel +86-135-5436-1146
Fax +86-27-85755457
Email [email protected]
Background: There is a close relationship among inflammation, glycolysis, and tumors. The IL-1 family includes important inflammatory cytokines, among which IL-1β has been widely studied. In this study, we focused on the effect of IL-1β on glycolysis of lung adenocarcinoma (LUAD) cells in vivo and in vitro and explored its possible mechanisms.
Methods: A bioinformatic database and quantitative real-time PCR were used to analyze the expression of glycolysis-related enzyme genes and their correlations with IL1β in human LUAD samples. The human LUAD cell line A549 and Lewis lung carcinoma LLC cell line were stimulated with IL-1β. In vitro treatment effects, including glycolysis level, migration, and invasion were evaluated with a glucose assay kit, lactate assay kit, Western blotting, wound healing, and the transwell method. We established a mouse model of subcutaneous tumors using LLC cells pretreated with IL-1β and analyzed in vivo treatment effects through positron-emission tomography-computed tomography and staining. Virtual screening and molecular dynamic simulation were used to screen potential inhibitors of IL-1β.
Results: Our results showed that IL1β was positively correlated with the expression of glycolysis-related enzyme genes in LUAD. Glycolysis, migration, and invasion significantly increased in A549 and LLC stimulated with IL-1β. In vivo, IL-1β increased growth, mean standard uptake value, and pulmonary tumor metastasis, which were inhibited by the glycolysis inhibitor 2-deoxy-D-glucose and p38-pathway inhibitors. Small molecular compound ZINC14610053 was suggested being a potential inhibitor of IL-1β.
Conclusion: IL-1β promotes glycolysis of LUAD cells through p38 signaling, further enhancing tumor-cell migration and invasion. These results show that IL-1β links inflammation to glycolysis in LUAD, and targeting IL-1β and the glycolysis pathway may be a potential therapeutic strategy for lung cancer.
Keywords: interleukin 1β, glycolysis, lung adenocarcinoma, p38 signaling
Introduction
The relationship between inflammation and cancer has been widely studied.1 Lung cancer has been proved to be one of the inflammation-associated cancers.2–4 Non–small cell lung cancer (NSCLC) accounts for approximately 85% of lung cancers, and adenocarcinoma is the most common subtype of NSCLC. Outcomes for lung cancer patients remain poor, with a 5-year survival rate of approximately 15%.5 An inflammatory factor, IL-1β belongs to the member of IL-1 cytokine family, and is secreted by almost all nucleated cells with external antigen and mitogen stimulation.6–8 Studies have revealed that IL-1β plays an active role in many biological processes. It has been found to promote inflammatory tissue damage and induce edema formation in acute inflammation.9,10 This proinflammatory cytokine is involved in immunoregulation through activating CD4+ T cells.11 IL-1β has been found to enhance the bactericidal functions of neutrophils on hypervirulent Klebsiella pneumoniae in vitro and in vivo.12 Therefore, IL-1β is closely related to the degree and development of inflammatory and immune-system diseases, such as rheumatoid arthritis, asthma, and inflammatory bowel diseases.13–15 In recent years, the active role of IL-1β in malignant tumors has been widely studied, which suggested that IL-1β promotes the biological malignant behavior of cancer cells, such as metastatic breast cancer, gastric cancer, and human colon cancer.16–18 Canakinumab is a currently available IL-1β inhibitor and in clinical trials for the treatment of malignant tumors (NCT04581343 and NCT04239157). A phase III clinical study revealed that canakinumab could reduce incidence and mortality in patients with lung cancer, showing promise in the treatment of malignant tumors.19 Yano et al found that IL-1β promotes metastasis of human lung cancer cells.20 Li et al revealed that IL-1β-induced epithelial–mesenchymal transition of lung cancer cells, which was positively associated with the biological malignant behavior of cancer cells.21 These results suggest that the relationship between IL-1β and lung cancer is worthy of being discussed further.
The Warburg effect has been suggested to be a key metabolic hallmark of cancer, wherein cancer cells consume glucose through aerobic glycolysis.22 An increase in the Warburg effect promotes malignant biological behavior of cancer cells, such as aberrant activation of glycolytic enzymes like hexokinase 2 (HK2), phosphofructokinase (PFK), pyruvate kinase M2 (PKM2), and lactate dehydrogenase A (LDHA), accompanied by increased glucose uptake and lactate generation.23–27 A preliminary study of ours found that the IL-1 subfamily (IL-1α, IL-1β, and IL-33) played an important role in various diseases, including malignant tumors, through targeting glycolysis.28 However, little is known about whether IL-1β promotes pathogenesis and development of lung adenocarcinoma (LUAD) through upregulating glycolysis. In this study, we determined the impact of IL-1β on growth and invasion of LUAD cells in vitro and in vivo through targeting glycolysis and explored the underlying mechanisms by which IL-1β upregulated the glycolysis of tumor cells. Our research will provide new insights into relationships among inflammation, metabolic reprogramming, and lung cancer.
Methods
Patient Sample
Tumors and the corresponding peritumor tissue of 36 patients with LUAD were obtained from the Department of Thoracic Surgery, Union Hospital, Tongji Medical College, Huazhong University of Science and Technology after obtaining informed consent from patients as described previously.29 All procedures were approved by the ethics committee of Tongji Medical College, (2010, IEC [S202].
Reagents
Recombinant human IL-1β (Cat#AF-200-01B) and mouse IL-1β (Cat#AF-211-11B) were acquired from PeproTech. P38 inhibitor SB203580 (Cat#s1076) and glycolysis inhibitor 2-deoxy-D-glucose (2DG; Cat#s4701) were obtained from Selleckchem(Houston,United States). The inhibitors were dissolved in DMSO. Working concentrations of SB203580 and 2DG were 30 µM and 5 mM, respectively.
Cell Lines
The A549 human LUAD cell line (ATCC #CCL185) and the Lewis lung carcinoma (LLC) cell line (ATCC #CRL1642 were purchased from the American Type Culture Collection (Manassas, VA, USA). The two cell lines were cultured according to our previous studies.29 Briefly, A549 was cultured in RPMI 1640 plus 10% serum, 2 mM L-glutamine, 1 mM pyruvate, 100 U/mL penicillin, and 100 mg/mL streptomycin, and LLC was cultured using DMEM. Cells were incubated at 37°C in 5% CO2 and 95% air.
GEPIA Data Set
The GEPIA data set is an interactive web server that can be used for tumor/normal differential expression analysis, patient-survival analysis, and correlation analysis based on sample data from the Cancer Genome Atlas (TCGA) and the GTEx project.30,31 We used GEPIA for analyzing the expression of GLUT1, GLUT3, HK2, PFK liver (PFKL), PKM2, MCT1, MCT4, and LDHA in tumor and normal tissue and correlations between IL1β and glycolysis-related genes. Results of patient-survival analyses were also obtained from GEPIA .
TIMER Database
The Tumor Immune Estimation Resource (TIMER) is an online database (http://timer.cistrome.org), developed to study tumor immunity. Data in TIMER are derived from TCGA and cover 32 types of cancer and up to 10, 897 tumors.32,33 The invasive ability of six immunoinfiltrates (eg, B cells, CD4+ T cells, and CD8+ T cells) were estimated in advance in this database. We made use of the module Cancer Exploration to analyze associations between IL1β and glycolysis-related genes in various tumors.
Kaplan–Meier Plotter Database
Kaplan-Meier Plotter, a classic online tool (http://kmplot.com/analysis) for analyzing the effect of tumor genes on survival and prognosis, is able to conduct survival analysis with regard to 54,000 genes.34 Data in it are derived from GEO, EGA, and TCGA for 21 tumor types, including breast cancer (6,234 samples), ovarian cancer (2,190), lung cancer (3,452), and gastric cancer (1,440). We performed survival analysis through this database.
PrognoScan Database
The PrognoScan database is a website (http://www.abren.net/PrognoScan) allowing users to analyze the prognostic value of a single gene and realize meta-analysis later.35 It provides a powerful platform to estimate latent tumor markers and therapeutic targets. With the help of this database, we explored prognostic values of glycolysis-related genes.
CCK8 Assay
A549 and LLC (104 cells/well) were incubated in a 96-well plate for 24 hours, then incubated with different concentrations of IL-1β for 24 and 36 hours. Subsequently, 10 μL CCK8 solution was added. Absorbance values were measured at 450 nm with a microplate reader (DR-200Bs). For inhibitory assays, IL-1β-induced cells were stimulated with 2DG for 48 hours. Cells stimulated with IL-1β in the absence of inhibitors and cells stimulated without IL-1β were selected as control groups.
Glycolysis
The level of glycolysis was detected according to the results of glucose consumption and lactate production in A549 and LLC cells. After stimulation with IL-1β, cells and supernatant were collected for measuring glucose consumption and lactate production using a glucose assay kit (Sigma-Aldrich GAGO20) and lactate assay kit (JianCheng A0192), respectively. For inhibitory assays, IL-1β-induced cells were stimulated with 2DG or pathway inhibitors for 48 hours and 1 hour, respectively. Cells stimulated with IL-1β in the absence of the inhibitors were selected as the control group.
Quantitative Real-Time PCR
We used RNAiso Plus (Takara 9109) to isolate total RNAs from tissue. Then, a Vazyme cDNA-synthesis kit was used to reverse-transcribe according to the manufacturer’s instructions. Next, qRT-PCR was performed according to our previous study.29 Sequences of the primers used for PCR are shown in Table 1.
 |
Table 1 Sequence of primers used for qRT-PCR amplification |
Western Blotting
Western blot analysis was used to evaluate the pathway of LUAD activated by IL-1β. A549 and LLC cells were cultured in six-well plates for 12 hours, then stimulated with the different treatments. Cell lysates quantified by BCA protein assay was separated via SDS-PAGE and PVDF membranes (Bio‐Rad, Hercules, CA, USA). After incubation overnight at 4°C, primary antibodies were used for detecting the expression of target proteins: anti–β-actin (1:10,000, TDY, TDY051), anti-p-p38 (1:500, CST, 4511), anti-p38 (1:3,000, CST, 8690), anti-ERK (1:2,000, CST, 4695), anti-p-STAT3 (1:500, CST, 9145), anti-STAT3 (1:1,000, Abcam, ab109085), anti-p-JNK (1:500, CST, 9251), anti-JNK (1:2,000, CST, 9252), anti-p-NFκB p65 (1:1,000, CST, 3033), anti-NFκB p65 (1:3,000, CST, 8242), anti-GLUT1 (1:1,000, Abcam, ab115730), anti-GLUT3 (1:3,000, Abcam, ab41525), and anti-MCT1 (1:1,000, 20139-1-AP), anti-MCT4 (1:1,000, 22787-1-AP), anti-HK2 (1:500, ab209847), anti-LDHA (1:1,000), HRP–goat antirabbit (1:10,000, AS1107), HRP–goat antimouse (1:10,000, ASPEN, AS1106), HRP–goat antigoat (1:10,000, AS1108), HRP–goat antirat (1:10,000, AS1093), HRP–goat antisheep (1:10,000, AS1245).
Wound Healing
A549 cells were stimulated with or without human IL-1β (20 ng/mL) in a six-well plate for 36 hours. Cells were cultured for another 24 hours after a denuded area of constant width was scratched by a sterile 200 μL pipette tip. We used a microscope to monitor and photograph wound closure. The length of wound healing at 0 hours (L0h) and 24 hours (L24 hours) was measured by ImageJ software. The wound-healing ratio was calculated:

This experiment was performed in triplicate with three independent repeats. For inhibitory assays, A549 cells incubated with human IL-1β (20 ng/mL) were stimulated with 2DG or pathway inhibitors for 48 hours and 1 hour, respectively. Cells stimulated with IL-1β in the absence of the inhibitors were selected as control group.
Cell-Migration and -Invasion Assays
Considering that LLC cells belong to a semiadherent cell line, we used transwell experiments to examine the cell migration of LLC cells induced by IL-1β. LLC cells (105/well) cultured with or without IL-1β (20 ng/mL) were resuspended in 100 µL serum-free medium, then seeded into the upper chamber. Complete medium (500 µL) was added to the lower chamber. After 36 hours, cells that had migrated into the underside of the insert were stained with 0.1% crystal violet and counted under microscopy. Migration ability was analyzed through the number of migrated LLC cells. The invasion assay was almost the same. The only difference was that Matrigel (BD Biosciences, San Jose, CA, USA) was added to the upper chamber. For inhibitory assays, A549 and LLC cells incubated with IL-1β (20 ng/mL) were stimulated with 2DG or pathway inhibitors for 48 hours and 1 hour, respectively. Cells stimulated with IL-1β in the absence of inhibitors were selected as the control group.
Animal Model
Six-week-old male C57BL/6 mice were purchased from Vital River Laboratory Animal Technology. All mice were kept in a pathogen-free vivarium at the Wuhan Laboratory Animal Center of Tongji Medical College according to the approved institutional guidelines of the Animal Care and Use Committee. Mice were assigned to study and control groups randomly. Mouse LUAD models were established by subcutaneous injection of 106 LLC cells in 0.1 mL PBS. In the study group, cells were pretreated with IL-1β (20 ng/mL) for 36 hours. Ten days after injection, nine mice were scanned by PET (TransPET Discoverist 180) to confirm glucose uptake through analyzing mean standard uptake value (SUVmean) using Carimas software (Turku PET Centre). Tumor and lung tissue were obtained after all of the mice had been killed, then tumor weight was measured by electronic balance and volume calculated: tumor volume (mm3) = 0.52 × longer length (mm) × shorter length2 (mm2). Lung tissue was fixed with paraformaldehyde for H&E staining to confirm lung metastases. The rate of lung metastasis was calculated using ImageJ software. For inhibitory assays, cells were pretreated with IL-1β (20 ng/mL), then cells stimulated with 2DG or p38-pathway inhibitor for 48 hours and 1 hour in the study group before model establishment. Cells stimulated with IL-1β in the absence of the inhibitor were selected as the control group.
Molecular Docking
Small-molecule data were downloaded from the ZINC15 database and saved as SDF files. The structure of IL-1β (4DEP) was downloaded from the RCSB Protein Data Bank (http://www.rcsb.org). This kind of format was converted into Mol2 with the use of Open Babel software. For molecular docking, we used the script prepare_ligand4.py in the AutoDockTools program to implement batch processing of adding charges to molecules, assigning atomic types, setting rotatable bonds to flexible ones, and saving the file in PDBQT format. In Pymol 1.7, we deleted crystal water and other small molecules of receptor proteins and added hydrogen atoms. The result of changes was saved and then loaded into AutoDockTools 1.5.6 to add charges, assign atomic types, and save the file in PDBQT format, in order to form molecular docking receptors. Afterward, molecular docking was processed with Vina 1.1.2 software. The docking box was set to the appropriate size to be able to contain binding sites for the proteins. We selected the optimal conformation as the result of molecular docking. At the same time, we extracted and sorted docking scores, namely affinity data.
Molecular Dynamic Simulation
Molecular dynamic simulation for proteins and small molecules obtained from molecular docking was carried out using Amber18. Force-field parameter for proteins were defined using ff14SB, while for small-molecule ligands, the general parameter GAFF was chosen. Antechamber mode was used to compute the atomic charge of AM1-BCC. A protein–small-molecule compound was loaded with tleap mode, and hydrogen atoms and antagonistic ions were added automatically so as to neutralize charge. A TIP3P dominant water model was chosen, then periodic border conditions were set. In the process of molecular dynamic simulation, there were four steps: minimization of energy, calefaction, equilibrium, and productive dynamic simulation. Above all, heavy atoms of proteins, including small molecules were restrained, and 10,000 steps involving 5,000 steps of the steepest- descent method and conjugate-gradient method separately were conducted for the purpose of energy minimization of water molecules. Subsequently, the system was gradually heated to 300 K in 50 ps, and then under NPT ensemble, it was balanced for 50 ps. In the end, under the same ensemble, molecular dynamic simulation was completed for 50 ns. Track data were stored every other 10 ps and they were analyzed using CPPTRAJ mode. Binding free energy between proteins and ligands was calculated using MMPBSA.py mode.
Statistics
Data in our research were processed using SPSS 26.0, and statistical set at P<0.05. Measurement materials are denoted by means ± SD, and independent-sample t-tests were used to compare results between the groups. Correlations between IL-1β and selected glycolytic indicators were assessed with Pearson correlation analysis. Paired t-tests were used to compare gene expression between cancer and adjacent normal tissue. Growth of subcutaneous tumors in tumor-bearing mice within groups were analyzed using one-way ANOVA.
Results
Expression of Glycolysis-Related Metabolic Enzyme Genes in Cancerous Tumors and Normal Tissue
To discern the mechanism of enhanced ability of tumors to take up glucose, we analyzed metabolic enzymes associated with glucose metabolism in tumor tissue. GEPIA was utilized to show expression of GLUT1, GLUT3, PFKL, HK2, PKM2, MCT1, MCT4, and LDHA in multiple tumors. In contrast to normal tissue, gene-expression levels of these glycolysis-related metabolic enzymes were elevated in tumors and varied from tumor to tumor (Figure S1). For further study, we discovered that five preceding genes (GLUT1, HK2, MCT1, MCT4, and LDHA) attained generally higher expression in most tumors compared to normal tissue: GLUT1 (T>N, n=23), GLUT3 (T>N, n=8), PFKL (T>N, n=4), PKM2 (T>N, n=17), HK2 (T>N, n=22), MCT1 (T>N, n=19), MCT4 (T>N, n=14) and LDHA (T>N, n=16; Figure S1A).
Expression of Glycolysis-Related Metabolic Enzyme Genes in Lung Adenocarcinoma and Normal Tissue
GEPIA was used to verify how genes of glycolysis-related metabolic enzymes were expressed in LUAD, revealing that mRNA expression of GLUT1 and LDHA were significantly higher in LUAD tissue than adjacent normal tissue, whereas GLUT3 was expressed more highly in the latter (Figure 1A). In addition, the results of RT-PCR showed that mRNA expression of GLUT1 and LDHA in LUAD tissue was consistent with results in GEPIA. Furthermore, MCT1 was expressed more in cancer tissue than adjacent normal tissue (Figure 1B), manifesting upregulation of glycolysis in LUAD.
 |
Figure 1 Expression and prognostic value of seven glycolysis-related genes and IL1β and their relationship analyzed with bioinformatic database and RT-PCR. (A) Relative mRNA expression of glycolysis-related enzyme genes in human lung adenocarcinoma tumor and normal tissue (GEPIA) (*P<0.01); (B) Relative mRNA expression of glycolysis-related enzymes genes in human lung adenocarcinoma tumor and adjacent tissue. Samples of human lung adenocarcinoma and paracancerous tissue were collected and RNA extracted, then RT-PCR used to detect the expression of gene mRNA. A paired t-test was used. (*P<0.05; **P<0.01). (C) Correlation analysis of IL1β and glycolysis-related enzyme genes in lung adenocarcinoma tissue (GEPIA). (D) Analysis of the relationship between IL1β and glycolysis-related enzyme genes in lung adenocarcinoma tissue (TIMER). |
Prognostic Value of Glycolysis-Related Enzyme Genes in Multiple Cancerous Tumors
With GEPIA, we analyzed prognostic values of glycolysis-related enzyme genes in 33 cancers so as to know about the impact of these genes in tumors. Among most of the cancers, high expression of these genes was related to poor prognosis (Figure S1B).
Prognostic Value of Glycolysis-Related Enzyme Genes in LUAD
The Kaplan–Meier Plotter database was chosen to evaluate prognostic values of glycolysis-related enzyme genes in LUAD. The results suggested that high expression of GLUT1, GLUT3, PFKL, HK2, PKM2, MCT1, MCT4, and LDHA indicated shortened overall survival (OS) in LUAD. Except GLUT3, time to first advanced stage was shortened when these genes had relatively high expression (Figure S1C). Overall, active glycolysis in LUAD suggested adverse outcomes in patients.
Expression of IL1β in Tumor Tissue Using Pan-Cancer Analysis
The relationship between inflammation and cancer has attracted extensive attention. Research has confirmed that IL1β has close a relationship to tumors.16,18 To make clear the effect of IL1β on tumors, we performed survival analysis using three databases (GEPIA, Kaplan–Meier Plotter, and PrognoScan). We discovered that for all tumor types, OS was shorter in groups where IL1β was overexpressed, while disease-free survival (DFS) showed no difference (OS HR 1.5, log-rank P<0.001; DFS HR 1.1, log-rank P=0.11). In LUAD, IL1β could be a marker of poor prognosis. High expression was significantly associated with poor prognosis in LUAD patients (PrognoScan — OS HR 1.6, Cox P<0.001, RFS HR 1.6, Cox P=0.11; Kaplan–Meier Plotter — OS HR 1.83, log-rank P<0.001, first progression HR 1.85, log-rank P<0.001; Figure S1D).
Correlation Between IL1β and Glycolysis-Related Enzyme Genes Using Pan-Cancer Analysis
Our previous research uncovered that the IL-1 family participates in progression of various diseases, including tumors, through regulating glycolysis.28 The question was then raised as to whether IL-1β influenced LUAD by regulating glycolysis. Bioinformatics was used as a tool to study associations between cancers and glycolysis-related enzyme genes. In the TIMER database, the results of correlation between 32 cancers and eight genes (GLUT1, GLUT3, PFKL, HK2, PKM2, MCT1, MCT4, and LDHA) showed that except PFKL, the other seven genes were positively associated with IL1β in multiple tumors, with statistical significance (Figure S1E). In LUAD, IL1β was positively associated with GLUT1 (r=0.243, P<0.001), GLUT3 (r=0.453, P<0.001), HK2 (r=0.33, P<0.001), PFKL (r=0.138, P=0.002), PKM2 (r=0.135, P=0.002), MCT1 (r=0.349, P<0.001), and LDHA (r=0.21, P<0.001) in GEPIA, but the relationship between IL1β and MCT4 did not reach statistical significance (=−0.062, P=0.159; Figure 1C). After repeating such analysis on TIMER, we found that apart from MCT4, IL1β was positively correlated with the other genes, attaining statistical significance (Figure 1D), in accordance with the GEPIA results. As results were analyzed, we speculated that IL-1β might regulate tumor progression via the glycolytic pathway.
IL-1β Upregulated Glycolysis in A549 and LLC Cell Lines
We chose human LUAD A549 and mouse LUAD LLC cell lines to confirm the relationship between IL-1β and glycolysis. We used CCK8 assays to detect the effect of IL-1β on cell proliferation. As shown in Figure 2A, A549 cells stimulated with 1.5, 10, 20, 50, and 100 ng/mL IL-1β for 36 hours had a higher rate of cell proliferation than for 24 hours. We found that the rate of cell proliferation was highest for IL-1β 20 ng/mL for 36 hours (OD450: 0 ng/mL, 0.847±0.024, P<0.0001; 1.5 ng/mL, 0.887±0.039, P<0.0001; 10 ng/mL, 1.009±0.043, P<0.01; 50 ng/mL, 1.065±0.05, P>0.05; 100 ng/mL, 1.03±0.042, P<0.05; 20 ng/mL, 1.114±0.049). Similar results were found in LLC cells (OD450: 0 ng/mL, 0.761±0.039, P<0.0001; 1.5, ng/mL, 0.813±0.039, P<0.0001; 10 ng/mL,0.917±0.026, P<0.01; 50 ng/mL, 0.956±0.032, P>0.05; 100 ng/mL, 0.921±0.035, P<0.01; 20 ng/mL, 1.006±0.058; Figure 2A). Therefore, we chose 20 ng/mL as the stimulus concentration and stimulus time was 36 hours. We detected the glycolysis level in cells induced by IL-1β. After stimulation with IL-1β (20 ng/mL) for 36 hours, glucose in cell supernatant was downregulated and lactate upregulated significantly in both A549 and LLC (Figure 2B), which revealed that these cells were active in glycolysis. Subsequently, we tested expression of glycolysis-related proteins (GLUT1, GLUT3, PFKL, HK2, PKM2, MCT1, MCT4, and LDHA) through Western blot assays, and as shown in Figure 2C, expression was enhanced in A549 and LLC cells. IL-1β promoted migration and invasion of these cell lines on wound-healing and transwell assays, respectively (Figure 2D). In summary, we considered that IL-1β facilitated glycolysis in both cell lines.
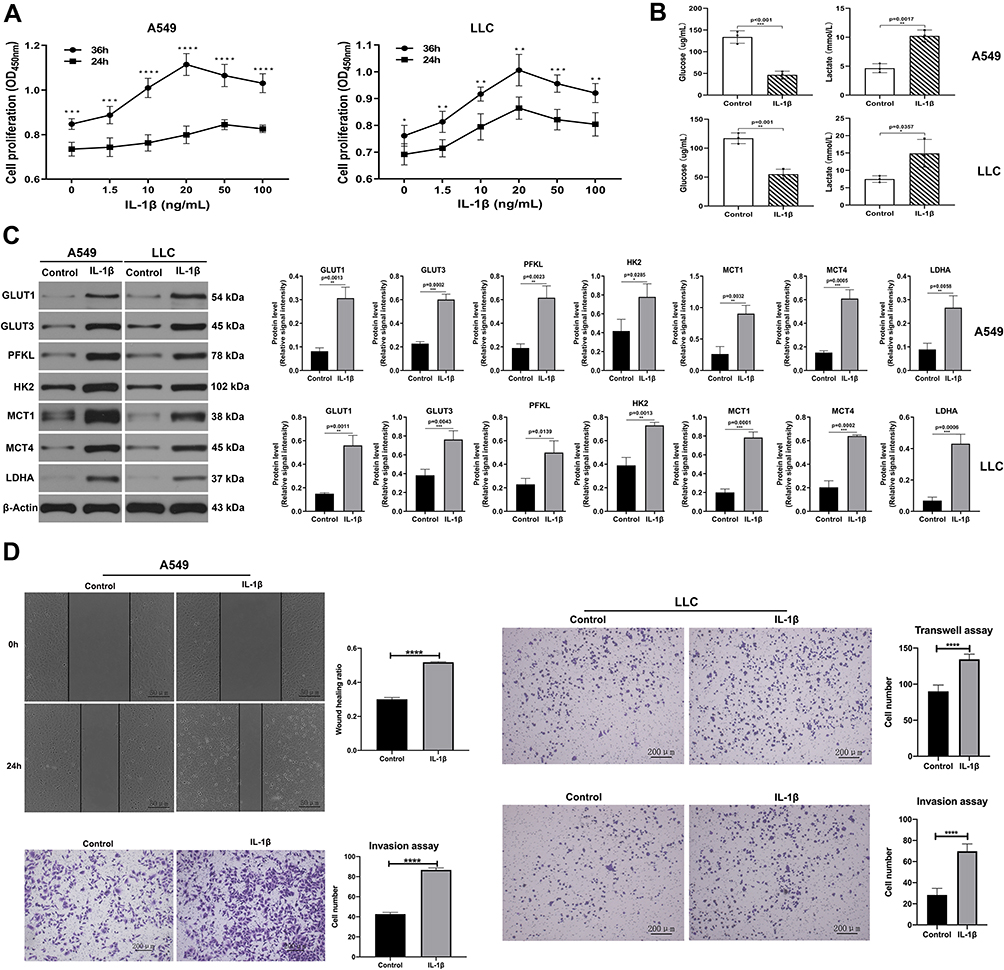 |
Figure 2 IL-1β promoted glucose consumption and lactate accumulation in A549 and LLC cell lines. (A) Cell-survival rates of A549 (left) and LLC (right) stimulated with different concentrations of IL-1β for 24 and 36 hours were analyzed with CCK8. A549 and LLC cells incubated with 20 ng/mL IL-1β for 36 hours reached the highest cell-survival rate. (B) A549 cells (upper) and LLC cells (below) treated with or without 20 ng/mL IL-1β for 36 hours. Compared with the control group, the IL-1β group showed lower levels of glucose and higher levels of lactate. (C) Western blot assay: expression level of GLUT1, GLUT3, PFKL, HK2, MCT1, MCT4 and LDHA in A549 (left) and LLC (right) treated with or without IL-1β. (D) Tests for cell migration and invasion ability under the impact of IL-1β. Wound-healing assay and transwell invasion in A549 cells (left); transwell migration and invasion analysis in LLC cells (right). *P<0.05, **P<0.01, ***P<0.001, ****P<0.0001. |
IL-1β Promoted A549 and LLC Cell Growth and Invasion Through Regulating Glycolysis
In contrast to the control group, IL-1β promoted proliferation of both A549 and LLC cells, while this inclination reversed when these cells were cultivated with IL-1β and 2DG (Figure 3A). Further Western blot assays demonstrated that GLUT1, GLUT3, PFKL, HK2, PKM2, MCT1, MCT4, and LDHA were upregulated when LLC and A549 cells were treated with IL-1β, while on the contrary the expression declined with addition of 2DG (Figure 3C). With wound-healing and transwell invasion assays, we identified the migration and invasion ability of A549 cells. Compared with IL-1β group, where A549 cells were stimulated with only IL-1β, cell migration had been weakened, with lower wound-healing ratio and invasive cell numbers after A549 cells were stimulated with IL-1β + 2DG (Figure 3D). To identify migration and invasion ability of LLC cells, we conducted transwell experiments. LLC cells stimulated with IL-1β showed stronger migration and invasion, but this faded under the impact of 2DG (Figure 3E). We concluded that IL-1β promoted cell migration and invasion in A549 and LLC cell lines through regulating glycolysis.
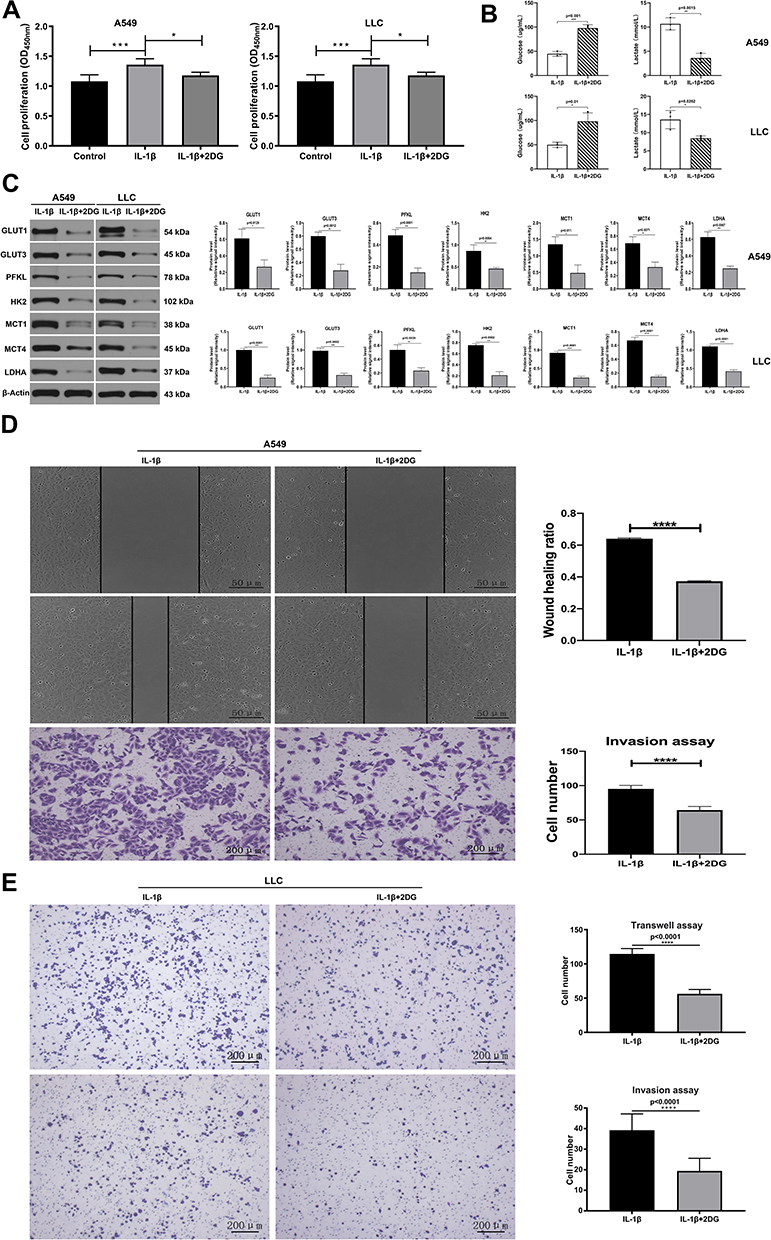 |
Figure 3 IL-1β promoted invasion and migration in A549 and LLC cell lines. (A) OD values of CCK8 assay stood for cell proliferation in IL-1β, IL-1β + 2DG, and control groups. (B) A549 cells and LLC cells incubated with IL-1β or IL-1β + 2DG. IL-1β + 2DG group received an obviously higher levels of glucose and lower levels of lactate than the IL-1β group. (C) Western blot assay showed expression levels of 7 glycolysis-related proteins when A549 (left) and LLC (right) were not only treated with IL-1β but also with 2DG. (D) Effect of IL-1β and IL-1β + 2DG on cell migration and invasion through wound-healing test (upper) and transwell invasion assay (below) respectively in A549 cells. (E) Transwell migration (upper) and invasion (lower) assays of LLC cells stimulated with only IL-1β (20 ng/mL, 36 hours) or with IL-1β + 2DG. *P<0.05, **P<0.01, ***P<0.001, ****P<0.0001. |
IL-1β Promoted Lung Adenocarcinoma Growth and Invasion Through Promoting Glycolysis In Vivo
We further started animal experiments to explore the effect of IL-1β on mouse LUAD models established by subcutaneous injection of LLC cells with or without stimulation of IL-1β. Before all were killed, they underwent PET–CT scans, and glucose uptake by tissue was clear in the images (Figure 4A). Data on glucose uptake were collected and revealed that tissue was more active in glucose metabolism in the IL-1β group. Tumor volume and weight were measured, indicating that IL-1β facilitated tumor growth (Figure 4B). LLC cells stimulated with 2DG previously were used to construct a subcutaneous tumor model as well. Figure 4D and E displays the mass weight and volume of naked tumors in three groups, and it was evident that the IL-1β group ranked top, followed by 2DG and the control group. We obtained lungs from dead mice and acquired H&E-stained histological images. As shown in Figure 4C, lung metastases from LLC subcutaneous tumors were more evident in the IL-1β group. From in vivo study, we concluded that IL-1β promoted metastasis of LUAD by upregulating glycolysis.
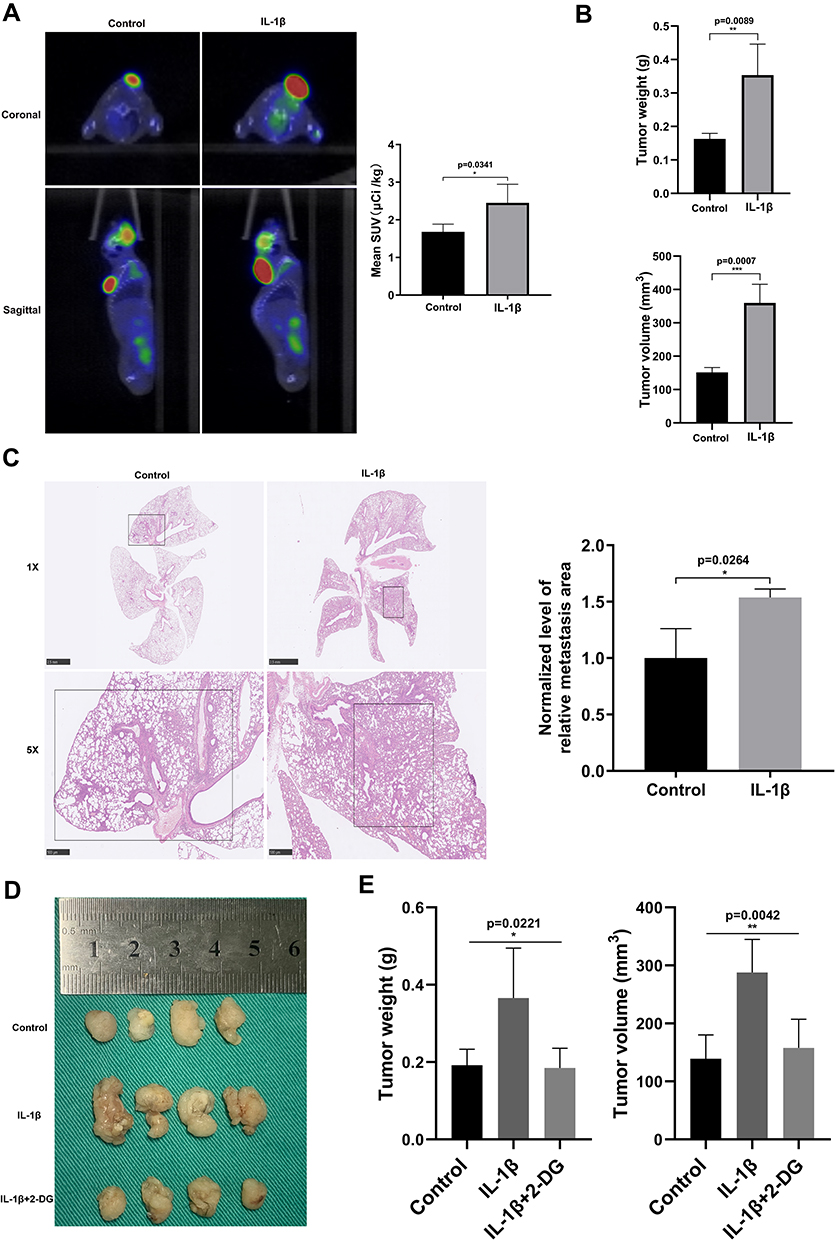 |
Figure 4 IL-1β upregulated glycolysis of LLC cells and promoted pulmonary metastasis in vivo. (A) Animal PET–CT images reflected that standardized uptake value (SUV) was obviously higher in the IL-1β group. (B) Histogram of naked tumor mass (upper) and volume (below) in control and IL-1β groups. (C) Lungs in H&E-stained histological observation, showing alveolar structure destruction and tumor-metastasis area. (D) Gross observation of subcutaneous tumors in control, IL-1β, and IL-1β + 2DG groups. Their weight (E, left) and volume (E, right) were recorded. *P<0.05, **P<0.01, ***P<0.001. |
IL-1β Upregulated Glycolysis in A549 and LLC Cells via p38 Pathway
In order to figure out by which pathway IL-1β regulated glycolysis, we first incubated A549 or LLC cells with IL-1β (20 ng/mL) and then tested protein expression in five common IL-1β-related pathways (STAT3, p38, ERK, JNK, and NFκB) by means of Western blot assays. As shown in Figure 5A, only the p38 pathway was activated by IL-1β in both cell lines, so we focused on the influence of the p38 inhibitor on glycolysis and cell growth. Beforehand, we had evaluated phosphorylation of the p38 downstream pathway to confirm an appropriate and effective concentration of p38 inhibitor (Figure 5B). Subsequently, A549 and LLC cells were stimulated with p38 inhibitor separately. As is apparent in Figure 5B, glucose levels increased and lactate levels decreased significantly in comparison with the control group, where these cells were cultured without certain inhibitors. It was proved through Western blot assays that protein expression of GLUT1, GLUT3, PFKL, HK2, PKM2, MCT1, MCT4, and LDHA had dropped under the effect of the p38-pathway inhibitor (Figure 5C). We also observed that the p38 inhibitor had a negative effect on cell migration and invasion on wound-healing, transwell migration, and transwell invasion assays in A549 cell and LLC cells (Figure 5D and E). To further examine how the p38-pathway inhibitor influenced LUAD in vivo, we established a tumor mouse model by subcutaneously injecting LLC cells previously treated with the p38-pathway inhibitor. Size and weight of tumors are shown in Figure 5F. Tumors in the IL-1β + p38-inhibitor group became smaller than those in the IL-1β group. The results suggested that IL-1β upregulated glycolysis and mobility in A549 and LLC cell lines, mainly via the p38 pathway.
 |
Figure 5 IL-1β upregulated glycolysis and further facilitated migration and invasion of A549 and LLC cells via the p38 pathway. (A) Western blot assay: distinct pathway proteins (STAT3, p38, ERK, JNK, and NFκB) in A549 and LLC cells cultured with IL-1β (20 ng/mL) previously. The p38 pathway was activated. (B) Upper: concentration of p38 inhibitor (30 µM) in A549 and LLC cells was confirmed to be viable through immunoblots. Below: glucose and lactate levels of LLC and A549 cells cultured with 30 µM p38-pathway inhibitor and then stimulated with IL-1β (20 ng/mL). Glucose levels increased and lactate levels decreased significantly in the IL1β + p38 inhibitor group. (C) Seven glycolysis-related proteins were attenuated during existence of p38 inhibitor on immunoblots. (D) Wound-healing test (upper) and transwell invasion (lower) assays of A549 cells incubated with IL-1β or IL-1β + p38 inhibitor for 24 hours. (E) Transwell migration (upper) and invasion (lower) assays of LLC cells cultured with or without p38 inhibitor and then stimulated with IL-1β. (F) Weight and volume of subcutaneous tumors when LLC cells were treated with p38 inhibitor in advance. *P<0.05, **P<0.01, ***P<0.001, ****P<0.0001. |
Screening of Small-Molecule IL-1β Inhibitor
Previous research has suggested that IL-1β has an influence on the advancement of tumors. Our research showed that IL-1β upregulated glycolytic levels and further affected proliferation, invasion, and metastasis of LUAD. Consequently, we went deeper into mechanisms of how IL-1β affect occurrence and development of tumors. Medicine and monoclonal antibodies need to be constantly explored and updated for the purpose of clinical treatment of tumors one day. We hence used structural molecular biology and computer to assist in designing drugs. In other words, we imitated a combination mode of molecular receptors and ligands and selected potential drugs targeting IL-1β. We acquired crystal structures of proteins from the PDB (http://www.rcsb.org) and downloaded small-molecule drugs from ZINC15, which holds 32,190 natural small-molecule compounds. After that, AutoDockTools Vina 1.1.2 software, was used to perform molecular docking. Compounds were ranked according to affinity scores, and ZINC14610053 got the highest absolute value (−6.7 kcal/mol), indicating the strongest ability to combine with IL-1β (Table 2). 3-D interactions of ZINC14610053 inside the binding pocket of IL-1β (Figure 6A) revealed 3H bonds (yellow dotted line). In theory, we inferred that this small-molecule compound could bind to IL-1β and inhibit its activity.
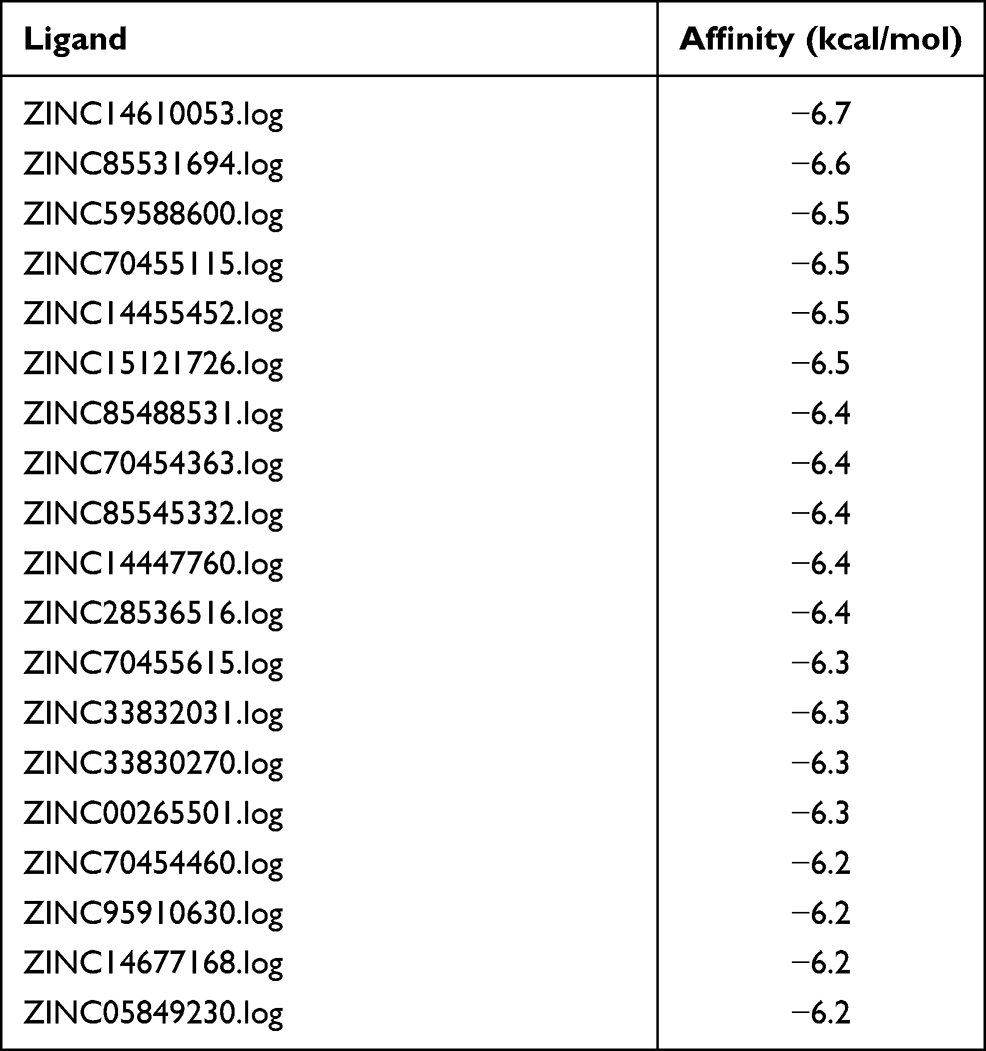 |
Table 2 Screening of small-molecule IL-1β inhibitors by molecule docking (top 20) |
 |
Figure 6 Molecular docking and molecular dynamic simulation study for ZINC14610053 on targeting IL-1β. (A) 3-D interactions of ZINC14610053 inside the active center of IL-1β (left panel); 2-D interactions of ZINC14610053 inside the binding pocket of IL-1β (right panel). (B) RMSD curve of conformation of ZINC14610053 and IL-1β. (C) Turning radius curve of conformation of ZINC14610053 and IL-1β. (D) RMSF curve of conformation of ZINC14610053 and IL-1β. (E) Interaction residues between ZINC14610053 and IL-1β after molecular dynamic optimization. |
Molecular Dynamic Simulation Study of Effect of ZINC14610053 on IL-1β
In order to further research the effect of ZINC14610053 on IL-1β, we conducted molecular dynamic simulation to study whether ZINC14610053 could bind to IL-1β stably. We observed that the conformation changed in the initial stage (0–30 ns), and RMSD curve fluctuated with small amplitude. However, after 30 ns, the RMSD curve tended to stabilize and protein conformation gradually stabilized. Binding of ZINC14610053 to IL-1β did not cause significant changes in protein conformation, and the binding of small-molecule ligands to proteins was relatively stable (Figure 6B). Figure 6C reveals that the radius of gyration remained stable throughout the simulation, consistent with the RMSD result, indicating that binding of ZINC14610053 to IL-1β had stable conformation and compact folding. Then, we used an RMSF curve to detect fluctuation in amino-acid residues. It can be seen in Figure 6D that there was large fluctuation in residues in the range of 45–55. The area of this section was mainly composed of flexible loops (Figure 6D right panel, yellow line), so it fluctuated greatly. In other regions, the fluctuation in residues was relatively gentle. We then calculated binding free energy between ZINC14610053 and IL-1β by taking the RMSD stationary phase (30–50 ns) trajectory based on the MMGBSA equation. The results showed that they had good binding, and binding free energy was –18.1 kcal/mol. After molecular dynamic optimization, interaction residues between ligands and proteins might change to a certain extent, ie, binding sites of ligands were stable after optimization. The main interaction residues are shown in Figure 6E, mainly hydrophilic. In addition, the ligand could form a hydrogen bond with Arg4 with a bond length of 3.3 Å (Figure 6E). In conclusion, there was a theoretical possibility of stable binding with ZINC14610053. We speculated that ZINC14610053 interacted with IL-1β, which needs further study.
Discussion
Metabolic reprogramming is a cancer characteristic in which aerobic glycolysis has attracted much attention.22 Tumor cells give priority to glycolysis and obtain energy independently of oxygen. GLUTs help with glucose uptake. There are 14 types in the glucose-transporter protein family, among which GLUT1 and GLUT3 take responsibility for actively transporting glucose from extracellular space to inside.36,37 Research has reported that carcinogenic mutations lead to mutations of GLUT1 and GLUT3.38,39 During process of glycolysis, there are three classic irreversible reactions, and the key enzymes are HK, PFK1, and PK, in that order. Four distinct types of HK occur, encoded by respective genes.40 HK2 has been discovered to have superior catalytic activity and maintain high expression in multiple tumors.41–43 There are three tissue-specific isoenzymes of PFK1 in human beings. These subtypes — M (muscle), L (liver), and P (platelets and placenta) —are expressed in all human tissue except skeletal muscles, which express only PFKM. Some malignant tumors or cancer cell lines in humans and rats mainly express type C.44–46 Four PK isoenzymes (L, R, M1, and M2) exist in mammals. PKL often appears in the liver and PKR in red cells, while PKM1 is expressed in muscle, heart, and the cerebrum and PKM2 is in early-stage fetal tissue. Tumor cells seem to prefer to express PKM2.47,48 Lactate fuels tumor cells in tumor circulation.49 LDH joins the process of glycolysis and gluconeogenesis, and is crucial in redox reactions between lactate and pyruvic acid. LDH is composed of two dominating subunits: LDHA and LDHB, and and can be assembled into five isoenzymes (LDH1, LDH2, LDH3, LDH4, and LDH5). LDHA encoded by the LDHA gene is the primary form in skeletal muscles and it shows high affinity for pyruvic acid. LDHA also plays an important role in cancer.50–52 Lactate, pyruvic acid, and ketone, standing for monocarboxylic acid, are essential metabolic products among a majority of mammals. Absorption and redistribution of these products are done by proton-coupled MCTs. Abnormal overexpression of MCT1, MCT2, and MCT4 promotes cancer progression via multiple pathways.53 MCT1 and MCT4 play a leading role in lactate transport.54 These are the reasons we selected GLUT1, GLUT3, PFKL, HK2, PKM2, MCT1, MCT4, and LDHA to evaluate glycolytic level in vitro or in vivo.
First of all, with the aid of bioinformatic technology, we estimated expression level of glycolysis-related enzyme genes and their association with prognosis in tumor patients. Most of these genes showed higher expression than normal tissue. Except for GLUT3 and PFKL, other gene expression remained consistent in various tumors. Expression of GLUT1, HK2, MCT1, and MCT4 varied to a relatively large extent. It should be noted that not all tumors have the characteristic of intensive glycolysis. These results embody metabolic heterogeneity among different tumor types, and histological origins might be a reason for this phenomenon.55 Lung and liver cancers rely more on glycolysis.56–58 For LUAD with obvious glycolytic properties, relatively higher glycolysis-related markers indicated shorter OS and progression-free survival, which could be markers of poor prognosis.
Studies have revealed that chronic inflammation takes part in occurrence and progression of cancer.1,59,60 Immunoinflammation in the tumor microenvironment is complicated, not only including tumor cells, stromal cells, immune-system cells, and fibroblasts but also involving cytokines and chemokines.22 The IL-1 family are important cytokines, participating in maintaining immunohomeostasis. IL-1β is being widely studied, and great achievement has been gained in inflammatory diseases and clinical application. In 2017, a retrospective clinical study on atherosclerosis found that inhibition of IL-1β caused declines in morbidity and mortality in all cancer types, especially lung cancer.19 Although IL-1β mediates occurrence and development of various tumors, the mechanism remains unknown. Our study focused on the relationship between the IL-1 subfamily and glycolysis and the effect of IL-1 on disease progress.28 IL-1β promotes diseases, such as rheumatoid arthritis, asthma, and diabetes type 2, by upregulating glycolysis.28 As such, our study focused on whether IL-1β and glycolysis would facilitate a tumor malignancy advancement.
In this study, we explore the effect of IL-1β on glycolysis in LUAD through both in vitro and in vivo experiments. Under aerobic culture, stimulation of IL-1β facilitated glucose consumption and lactate production in LUAD cell lines (A549 and LLC). At the same time, 2DG was used to suppress glycolysis and these outcomes were reversed. As a result, we concluded that IL-1β was able to elevate aerobic glycolysis in LUAD cells. Similarly, in another study, IL-1β promoted glucose uptake and accelerated aerobic glycolysis via upregulation of GLUT1 and GLUT3, which induced differentiation of Th17 cells.61 Furthermore, macrophages are typical immune cells secreting IL-1β whose metabolism and polarization are affected by glycolysis as well. Research has found that in gliomas, IL-1β from macrophage M2 induces transfer of glycolytic metabolism in glioma cells and enhances cell proliferation and formation by PI3K- and PKCδ-mediated activation of glycolytic enzyme glycerol-3-phosphate dehydrogenase (GPD2) and further phosphorylation of GPD2 pT10.62 Inflammasomes depend on IL-1β for the further control of glycolysis in macrophages.63 Lemos et al found that IL-1β activated Myc, resulting in accumulation of such proteins as PKM2, SLC2A3, and LDHA and etc, and then induced glycolysis and tubulointerstitial fibrosis.64 In general, we argue that IL-1β influenced the glycolytic pathway in numerous types of cells.
Enhanced aerobic glycolysis results in large amounts of lactate production. In such situations, tumor cells gain energy. On the other hand, they adjust themselves to the local microenvironment, so some will evolve into a high-glycolysis phenotype and acid-resistant specialty, precipitating malignant ability to proliferate and invade. Glycolytic activity is closely related to tumor proliferation and metastasis.65 IL-1β plays a part in breast cancer bone metastasis66 and mRNA of IL-1β remains highly expressed in multiple metastatic tumor cell lines, including NSCLC, colorectal cancer, and melanoma.67,68 It has been shown to facilitate tumor occurrence and metastasis through inducing angiogenesis and polarization of Th17 cells and recruiting MDSC, TAM, and TANvia multiple pathways.69,70 In our study, it was shown that IL-1β increased migration and invasion in A549 and LLC cell lines. We found 2DG was capable of inhibiting the preceding effect in A549, which suggested that IL-1β made it possible to promote invasion and migration via upregulation of glycolysis in LUAD cells. For the purpose of demonstrating results in vitro, we further established an LLC C57 subcutaneous tumor model and discovered that tumors pretreated with IL-1β grew much more quickly than controls. Besides changes in size, of H&E images of lung tissue showed larger invasion areas in the IL-1β group than controls, and results from PET–CT suggested that tumors in the IL-1β group performed more actively in glucose metabolism. To sum up, we demonstrated that IL-1β boosted glucose metabolism, tumor growth, and metastasis in murine subcutaneous LUAD. A similar phenomenon has been reported in other research. An animal study showed that IL-1β specifically expressed in stomach activated MDSCs in both vitro and vivo via the IL1RI–NFκB pathway and led to spontaneous gastritis and gastric cancer.71 In a melanoma model with IL-1β knocked down, lung metastasis was ameliorated.72 In an NSCLC mouse model, exposure to cigarettes promoted inflammatory reactions (increased IL-1β and TNF-α) and tumor occurrence, while this happened less in knockdown mice, which did not react to smoke inflammation.73 We believe that IL-1β played a role in advancement and metastasis of murine LUAD subcutaneous tumors and was related to the glycolytic metabolism pathway.
Ras and PI3K signal pathways are common in glycolytic regulation. Ras activates MAPK and PI3K, and then triggers the transcription factor cMyc, directly inducing considerable expression of glycolytic genes, such as GLUT1, HK2, PFK, enolase, and LDHA.74–78 PI3K is activated by ligand binding to receptor tyrosine kinase via Akt, and then stimulate cMyc and HIF1α, in order to regulate GLUT1 and several glycolysis-related enzymes, eg, HK2, PFK, aldolase A, and LDHA.79–81 One study found that IL-1β could combine IL1R1 and activate NFκB, JNK, ERK1/2, and the p38-signal pathway.82 Dang et al discovered that the IL-1β–IL-1R1 pathway upregulated HOXC10 via the JNK–cJun pathway, affecting metastasis of liver cancer. IL-1β also has an impact on activity of glycolysis-related enzymes via multiple signal pathways, leading to changes in glycolysis. According to Taneja et al, IL-1β enhances HK activity via IL-1R, Ras, and classic MAPK pathways.83 Riera et al considered that IL-1β increased glycolysis levels of supporting cells via the ERK1/2 pathway.84 We thus selected five classic pathways (NFκB, sTAT3, JNK, ERK, and p38), and inhibited each before observing the impact of IL-1β on LUAD glycolysis. We discovered that after p38 had been inhibited, glucose consumption and lactate production declined, indicating that the effect of IL-1β on LUAD glycolysis was ameliorated. However, there was no obvious difference when NFκB, sTAT3, JNK, and ERK were suppressed. Moreover, inhibiting p38 caused decreased invasive and migratory ability in LUAD cells. We inferred from this that IL-1β produced a positive impact on glycolysis and motor capacity of LUAD via the p38 pathway, similar to another study in which IL-1β PKC and p38 pathways promoted glycolysis in human articular chondrocytes.85 Additionally, Huang et al found that IL-1β induced p38 activation and thus increased migratory and invasive capacity of gastric adenocarcinoma in vitro and the potential for metastasis in vivo.86 We took into consideration all these results and thought that IL-1β could raise glycolysis in LUAD both in vitro and vivo and influence tumor migration, the process of which might be controlled through the p38 pathway.
Given that IL-1β has expansive functions in biology and shows bright prospects in clinical practice, we used combination modes of receptors and ligands imitating molecules, and then potential drugs targeting IL-1β were selected. We sorted descending qualifying small molecules according to docking scores, and the small-molecule compound ZINC14610053 was the last one, theoretically meaning that it might be the best to combine with IL-1β. We will explore the antagonistic effect of this small molecule on IL-1β in further study.
There remain shortcomings in our study. One of them is that design of the animal experiment needs to be modified. For instance, IL-1β knockdown mice could be used to illuminate the function of IL-1β in facilitating tumor growth and metastasis. Joint application of spontaneous and experimental metastasis models using intravenous injection could be used to prove metastatic efficiency. Since the small molecule was screened out, plenty of problems emerge as to whether this molecule actually binds to IL-1β and whether it performs like an inhibitor or a neutralizing antibody if it is able to connect to IL-1β. Whether it has a biological effect on an organism and whether it has advantages compared to current IL-1β drugs remain to be explored. Despite these matters needing to be solved, it still seems promising to apply IL-1β in the clinical field for tumor remedies based on wide biological function and mature clinical drugs of IL-1β. It is worthwhile for us to probe more deeply into problems concerning associations between IL-1β and tumors. Breakthroughs may be made in conventional drugs in new use. For example, indications for them may by broadened or drug combinations may be more effective than a single one. In conclusion, it is worth looking forward to application of IL-1β and cytokines to tumor therapy or adjuvant therapy.
Conclusion
Expression of IL1β in multiple cancerous tumors was positively associated with glycolysis-related enzyme genes and steadily predicted poor prognosis in LUAD. IL-1β upregulated glycolysis levels of LUAD cells in vitro and in vivo and enhance migration, invasion, and metastasis of LUAD. This phenomenon might have been accomplished through the p38 pathway. Finally, we screened small-molecule compounds in the ZINC15 database and found that ZINC14610053 had the strongest binding force theoretically.
Abbreviations
qRT-PCR, quantitative real-time polymerase chain reaction; LLC, Lewis lung carcinoma; PET-CT, positron-emission tomography–computed tomography; H&E, hematoxylin–eosin; 2DG, 2-deoxy-D-glucose; SUV, standard uptake value; NSCLC, non–small cell lung cancer; GEPIA, gene-expression profiling interactive analysis; TCGA, The Cancer Genome Atlas; GTEx, Genotype-tissue Expression project; EGA, European Genome-Phenome Archive; GEO, Gene Expression Omnibus; HK, hexokinase; PFK, phosphofructokinase; PFKL, phosphofructokinase liver; PK, pyruvate kinase; PKM2, pyruvate kinase M2; LDH, lactate dehydrogenase; LDHA, lactate dehydrogenase A; MCT, monocarboxylate transporter; TIMER, Tumor Immune Estimation Resource; LUAD, lung adenocarcinoma; DFS, disease-free survival; OS, overall survival; RFS, relapse-free survival; RMSD, root-mean-square deviation; RMSF, root-mean-square fluctuation; MDSC, myeloid-derived suppressor cell; TAM, tumor-associated macrophage; TAN, tumor-associated neutrophil.
Ethics Statement
This study was conducted in accordance with the Declaration of Helsinki. The animal study was approved by the Animal Care and Use Committee of Tongji Medical College, Huazhong University of Science and Technology, Wuhan, China [(2020) IACUC (S2470)]. All experimental protocols are carried out in accordance with institutional guidelines and national guidelines and regulations of Tongji Medical College, Huazhong University of Science and Technology.
Author Contributions
- All authors have made substantial contributions to the concept of the paper and acquisition, analysis, and interpretation of data.
- All authors have taken part in drafting and writing the paper and carefully revised and reviewed the article.
- All authors have agreed on submission of the paper to the journal.
- All authors have reviewed and agreed on the version of the article to be published.
All authors agree to be accountable for all aspects of the work.
Funding
This study was supported by grants from the National Major Scientific and Technological Special Project for Significant New Drug Development (2019ZX09301-001), National Science Foundation of China (81770096, 81802113, 81900095), and Key Laboratory Open Fund of Hubei Province (F016.02004.2,0003.082).
Disclosure
The authors declare no conflicts of interest for this study.
References
1. Crusz SM, Balkwill FR. Inflammation and cancer: advances and new agents. Nat Rev Clin Oncol. 2015;12(10):584–596. doi:10.1038/nrclinonc.2015.105
2. Wu F, Xu J, Huang Q, et al. The role of interleukin-17 in lung cancer. Mediators Inflamm. 2016;2016:8494079. doi:10.1155/2016/8494079
3. Reppert S, Koch S, Finotto S. IL-17A is a central regulator of lung tumor growth. Oncoimmunology. 2012;1(5):783–785. doi:10.4161/onci.19735
4. Chang SH, Mirabolfathinejad SG, Katta H, et al. T helper 17 cells play a critical pathogenic role in lung cancer. Proc Natl Acad Sci U S A. 2014;111(15):5664–5669. doi:10.1073/pnas.1319051111
5. Siegel RL, Miller KD, Jemal A. Cancer statistics, 2020. CA Cancer J Clin. 2020;70(1):7–30. doi:10.3322/caac.21590
6. Sutton CE, Lalor SJ, Sweeney CM, Brereton CF, Lavelle EC, Mills KH. Interleukin-1 and IL-23 induce innate IL-17 production from gammadelta T cells, amplifying Th17 responses and autoimmunity. Immunity. 2009;31(2):331–341. doi:10.1016/j.immuni.2009.08.001
7. Abderrazak A, Syrovets T, Couchie D, et al. NLRP3 inflammasome: from a danger signal sensor to a regulatory node of oxidative stress and inflammatory diseases. Redox Biol. 2015;4:296–307. doi:10.1016/j.redox.2015.01.008
8. Lopez-Castejon G, Brough D. Understanding the mechanism of IL-1β secretion. Cytokine Growth Factor Rev. 2011;22(4):189–195. doi:10.1016/j.cytogfr.2011.10.001
9. Mishra BB, Rathinam VA, Martens GW, et al. Nitric oxide controls the immunopathology of tuberculosis by inhibiting NLRP3 inflammasome-dependent processing of IL-1β. Nat Immunol. 2013;14(1):52–60. doi:10.1038/ni.2474
10. Guidot DM, Hybertson BM, Kitlowski RP, Repine JE. Inhaled NO prevents IL-1-induced neutrophil accumulation and associated acute edema in isolated rat lungs. Am J Physiol. 1996;271(2 Pt 1):L225–9.
11. Joosten LA, Netea MG, Dinarello CA. Interleukin-1β in innate inflammation, autophagy and immunity. Semin Immunol. 2013;25(6):416–424. doi:10.1016/j.smim.2013.10.018
12. Wang LT, Wang HH, Chiang HC, et al. Human placental MSC-secreted IL-1β enhances neutrophil bactericidal functions during hypervirulent Klebsiella infection. Cell Rep. 2020;32(13):108188. doi:10.1016/j.celrep.2020.108188
13. Buchs N, Di Giovine FS, Silvestri T, Vannier E, Duff GW, Miossec P. IL-1B and IL-1Ra gene polymorphisms and disease severity in rheumatoid arthritis: interaction with their plasma levels. Genes Immun. 2001;2(4):222–228. doi:10.1038/sj.gene.6363766
14. Fu JJ, McDonald VM, Baines KJ, Gibson PG. Airway IL-1β and systemic inflammation as predictors of future exacerbation risk in asthma and COPD. Chest. 2015;148(3):618–629. doi:10.1378/chest.14-2337
15. Coccia M. The Role of IL-1beta in Intestinal Inflammation. Oxford University; 2011.
16. Wu TC, Xu K, Martinek J, et al. IL1 receptor antagonist controls transcriptional signature of inflammation in patients with metastatic breast cancer. Cancer Res. 2018;78(18):5243–5258. doi:10.1158/0008-5472.CAN-18-0413
17. Shigematsu Y, Niwa T, Rehnberg E, et al. Interleukin-1β induced by Helicobacter pylori infection enhances mouse gastric carcinogenesis. Cancer Lett. 2013;340(1):141–147. doi:10.1016/j.canlet.2013.07.034
18. Akagi Y, Liu W, Xie K, Zebrowski B, Shaheen RM, Ellis LM. Regulation of vascular endothelial growth factor expression in human colon cancer by interleukin-1β. Br J Cancer. 1999;80(10):1506–1511. doi:10.1038/sj.bjc.6690553
19. Ridker PM, MacFadyen JG, Thuren T, Everett BM, Libby P, Glynn RJ. Effect of interleukin-1β inhibition with canakinumab on incident lung cancer in patients with atherosclerosis: exploratory results from a randomised, double-blind, placebo-controlled trial. Lancet. 2017;390(10105):1833–1842. doi:10.1016/S0140-6736(17)32247-X
20. Yano S, Nokihara H, Yamamoto A, et al. Multifunctional interleukin-1beta promotes metastasis of human lung cancer cells in SCID mice via enhanced expression of adhesion-, invasion- and angiogenesis-related molecules. Cancer Sci. 2003;94(3):244–252. doi:10.1111/j.1349-7006.2003.tb01428.x
21. Li R, Ong SL, Tran LM, et al. Chronic IL-1β-induced inflammation regulates epithelial-to-mesenchymal transition memory phenotypes via epigenetic modifications in non-small cell lung cancer. Sci Rep. 2020;10(1):377. doi:10.1038/s41598-019-57285-y
22. Hanahan D, Weinberg RA. Hallmarks of cancer: the next generation. Cell. 2011;144(5):646–674. doi:10.1016/j.cell.2011.02.013
23. Han J, Meng Q, Xi Q, et al. Interleukin-6 stimulates aerobic glycolysis by regulating PFKFB3 at early stage of colorectal cancer. Int J Oncol. 2016;48(1):215–224. doi:10.3892/ijo.2015.3225
24. Meng MB, Wang HH, Guo WH, et al. Targeting pyruvate kinase M2 contributes to radiosensitivity of non-small cell lung cancer cells in vitro and in vivo. Cancer Lett. 2015;356(2 Pt B):985–993. doi:10.1016/j.canlet.2014.11.016
25. Yao A, Xiang Y, Si YR, et al. PKM2 promotes glucose metabolism through a let-7a-5p/Stat3/hnRNP-A1 regulatory feedback loop in breast cancer cells. J Cell Biochem. 2019;120(4):6542–6554. doi:10.1002/jcb.27947
26. Xiao M, Xie J, Wu Y, et al. The eEF2 kinase-induced STAT3 inactivation inhibits lung cancer cell proliferation by phosphorylation of PKM2. Cell Commun Signal. 2020;18(1):25. doi:10.1186/s12964-020-0528-y
27. Demaria M, Poli V. PKM2, STAT3 and HIF-1α: the Warburg’s vicious circle. JAKSTAT. 2012;1(3):194–196.
28. Tan Q, Huang Q, Ma YL, et al. Potential roles of IL-1 subfamily members in glycolysis in disease. Cytokine Growth Factor Rev. 2018;44:18–27. doi:10.1016/j.cytogfr.2018.11.001
29. Huang Q, Duan L, Qian X, et al. IL-17 promotes angiogenic factors IL-6, IL-8, and Vegf production via stat1 in lung adenocarcinoma. Sci Rep. 2016;6:36551. doi:10.1038/srep36551
30. Tang Z, Kang B, Li C, Chen T, Zhang Z. GEPIA2: an enhanced web server for large-scale expression profiling and interactive analysis. Nucleic Acids Res. 2019;47(W1):W556–w560. doi:10.1093/nar/gkz430
31. Tang Z, Li C, Kang B, Gao G, Li C, Zhang Z. GEPIA: a web server for cancer and normal gene expression profiling and interactive analyses. Nucleic Acids Res. 2017;45(W1):W98–W102. doi:10.1093/nar/gkx247
32. Li T, Fan J, Wang B, et al. TIMER: a web server for comprehensive analysis of tumor-infiltrating immune cells. Cancer Res. 2017;77(21):e108–e110. doi:10.1158/0008-5472.CAN-17-0307
33. Li T, Fu J, Zeng Z, et al. TIMER2.0 for analysis of tumor-infiltrating immune cells. Nucleic Acids Res. 2020;48(W1):W509–W514. doi:10.1093/nar/gkaa407
34. Győrffy B, Surowiak P, Budczies J, Lánczky A. Online survival analysis software to assess the prognostic value of biomarkers using transcriptomic data in non-small-cell lung cancer. PLoS One. 2013;8(12):e82241. doi:10.1371/journal.pone.0082241
35. Mizuno H, Kitada K, Nakai K, Sarai A. PrognoScan: a new database for meta-analysis of the prognostic value of genes. BMC Med Genomics. 2009;2:18. doi:10.1186/1755-8794-2-18
36. Ancey PB, Contat C, Meylan E. Glucose transporters in cancer - from tumor cells to the tumor microenvironment. Febs j. 2018;285(16):2926–2943. doi:10.1111/febs.14577
37. Mueckler M, Thorens B. The SLC2 (GLUT) family of membrane transporters. Mol Aspects Med. 2013;34(2–3):121–138. doi:10.1016/j.mam.2012.07.001
38. Macheda ML, Rogers S, Best JD. Molecular and cellular regulation of glucose transporter (GLUT) proteins in cancer. J Cell Physiol. 2005;202(3):654–662. doi:10.1002/jcp.20166
39. Pelicano H, Martin DS, Xu RH, Huang P. Glycolysis inhibition for anticancer treatment. Oncogene. 2006;25(34):4633–4646. doi:10.1038/sj.onc.1209597
40. Wilson JE. Isozymes of mammalian hexokinase: structure, subcellular localization and metabolic function. J Exp Biol. 2003;206(Pt 12):2049–2057. doi:10.1242/jeb.00241
41. Xu S, Herschman HR. A tumor agnostic therapeutic strategy for hexokinase 1-null/hexokinase 2-positive cancers. Cancer Res. 2019;79(23):5907–5914. doi:10.1158/0008-5472.CAN-19-1789
42. Mathupala SP, Ko YH, Pedersen PL. Hexokinase-2 bound to mitochondria: cancer’s stygian link to the “Warburg Effect” and a pivotal target for effective therapy. Semin Cancer Biol. 2009;19(1):17–24. doi:10.1016/j.semcancer.2008.11.006
43. Patra KC, Wang Q, Bhaskar PT, et al. Hexokinase 2 is required for tumor initiation and maintenance and its systemic deletion is therapeutic in mouse models of cancer. Cancer Cell. 2013;24(2):213–228. doi:10.1016/j.ccr.2013.06.014
44. Oskam R, Rijksen G, Staal GE, Vora S. Isozymic composition and regulatory properties of phosphofructokinase from well-differentiated and anaplastic medullary thyroid carcinomas of the rat. Cancer Res. 1985;45(1):135–142.
45. Vora S, Halper JP, Knowles DM. Alterations in the activity and isozymic profile of human phosphofructokinase during malignant transformation in vivo and in vitro: transformation- and progression-linked discriminants of malignancy. Cancer Res. 1985;45(7):2993–3001.
46. Sánchez-Martínez C, Aragón JJ. Analysis of phosphofructokinase subunits and isozymes in ascites tumor cells and its original tissue, murine mammary gland. FEBS Lett. 1997;409(1):86–90. doi:10.1016/S0014-5793(97)00496-1
47. Scatena R, Bottoni P, Pontoglio A, Mastrototaro L, Giardina B. Glycolytic enzyme inhibitors in cancer treatment. Expert Opin Investig Drugs. 2008;17(10):1533–1545. doi:10.1517/13543784.17.10.1533
48. Mazurek S, Boschek CB, Hugo F, Eigenbrodt E. Pyruvate kinase type M2 and its role in tumor growth and spreading. Semin Cancer Biol. 2005;15(4):300–308. doi:10.1016/j.semcancer.2005.04.009
49. Hui S, Ghergurovich JM, Morscher RJ, et al. Glucose feeds the TCA cycle via circulating lactate. Nature. 2017;551(7678):115–118. doi:10.1038/nature24057
50. Feng Y, Xiong Y, Qiao T, Li X, Jia L, Han Y. Lactate dehydrogenase A: a key player in carcinogenesis and potential target in cancer therapy. Cancer Med. 2018;7(12):6124–6136. doi:10.1002/cam4.1820
51. Miao P, Sheng S, Sun X, Liu J, Huang G. Lactate dehydrogenase A in cancer: a promising target for diagnosis and therapy. IUBMB Life. 2013;65(11):904–910. doi:10.1002/iub.1216
52. Ding J, Karp JE, Emadi A. Elevated lactate dehydrogenase (LDH) can be a marker of immune suppression in cancer: interplay between hematologic and solid neoplastic clones and their microenvironments. Cancer Biomark. 2017;19(4):353–363. doi:10.3233/CBM-160336
53. Payen VL, Mina E, Van Hée VF, Porporato PE, Sonveaux P. Monocarboxylate transporters in cancer. Mol Metab. 2020;33:48–66. doi:10.1016/j.molmet.2019.07.006
54. Sonveaux P, Végran F, Schroeder T, et al. Targeting lactate-fueled respiration selectively kills hypoxic tumor cells in mice. J Clin Invest. 2008;118(12):3930–3942.
55. Elia I, Schmieder R, Christen S, Fendt SM. Organ-specific cancer metabolism and its potential for therapy. Handb Exp Pharmacol. 2016;233:321–353.
56. Obre E, Rossignol R. Emerging concepts in bioenergetics and cancer research: metabolic flexibility, coupling, symbiosis, switch, oxidative tumors, metabolic remodeling, signaling and bioenergetic therapy. Int J Biochem Cell Biol. 2015;59:167–181. doi:10.1016/j.biocel.2014.12.008
57. Amann T, Hellerbrand C. GLUT1 as a therapeutic target in hepatocellular carcinoma. Expert Opin Ther Targets. 2009;13(12):1411–1427. doi:10.1517/14728220903307509
58. Ma R, Zhang W, Tang K, et al. Switch of glycolysis to gluconeogenesis by dexamethasone for treatment of hepatocarcinoma. Nat Commun. 2013;4:2508. doi:10.1038/ncomms3508
59. Ames BN, Gold LS. The causes and prevention of cancer: gaining perspective. Environ Health Perspect. 1997;105(Suppl 4):865–873.
60. Grivennikov SI, Greten FR, Karin M. Immunity, inflammation, and cancer. Cell. 2010;140(6):883–899. doi:10.1016/j.cell.2010.01.025
61. Revu S, Wu J, Henkel M, et al. IL-23 and IL-1β drive human Th17 cell differentiation and metabolic reprogramming in absence of CD28 costimulation. Cell Rep. 2018;22(10):2642–2653. doi:10.1016/j.celrep.2018.02.044
62. Lu J, Xu Z, Duan H, et al. Tumor-associated macrophage interleukin-β promotes glycerol-3-phosphate dehydrogenase activation, glycolysis and tumorigenesis in glioma cells. Cancer Sci. 2020;111(6):1979–1990. doi:10.1111/cas.14408
63. Finucane OM, Sugrue J, Rubio-Araiz A, Guillot-Sestier MV, Lynch MA. The NLRP3 inflammasome modulates glycolysis by increasing PFKFB3 in an IL-1β-dependent manner in macrophages. Sci Rep. 2019;9(1):4034. doi:10.1038/s41598-019-40619-1
64. Lemos DR, McMurdo M, Karaca G, et al. Interleukin-1β activates a MYC-dependent metabolic switch in kidney stromal cells necessary for progressive tubulointerstitial fibrosis. J Am Soc Nephrol. 2018;29(6):1690–1705. doi:10.1681/ASN.2017121283
65. Gatenby RA, Gillies RJ. Why do cancers have high aerobic glycolysis? Nat Rev Cancer. 2004;4(11):891–899. doi:10.1038/nrc1478
66. Tulotta C, Ottewell P. The role of IL-1B in breast cancer bone metastasis. Endocr Relat Cancer. 2018;25(7):R421–r34. doi:10.1530/ERC-17-0309
67. Elaraj DM, Weinreich DM, Varghese S, et al. The role of interleukin 1 in growth and metastasis of human cancer xenografts. Clin Cancer Res. 2006;12(4):1088–1096. doi:10.1158/1078-0432.CCR-05-1603
68. Gemma A, Takenaka K, Hosoya Y, et al. Altered expression of several genes in highly metastatic subpopulations of a human pulmonary adenocarcinoma cell line. Eur J Cancer. 2001;37(12):1554–1561. doi:10.1016/S0959-8049(01)00154-X
69. Apte RN, Dotan S, Elkabets M, et al. The involvement of IL-1 in tumorigenesis, tumor invasiveness, metastasis and tumor-host interactions. Cancer Metastasis Rev. 2006;25(3):387–408. doi:10.1007/s10555-006-9004-4
70. Bent R, Moll L, Grabbe S, Bros M. Interleukin-1 beta-A friend or foe in malignancies? Int J Mol Sci. 2018;19(8):2155. doi:10.3390/ijms19082155
71. Tu S, Bhagat G, Cui G, et al. Overexpression of interleukin-1β induces gastric inflammation and cancer and mobilizes myeloid-derived suppressor cells in mice. Cancer Cell. 2008;14(5):408–419. doi:10.1016/j.ccr.2008.10.011
72. Carmi Y, Dotan S, Rider P, et al. The role of IL-1β in the early tumor cell-induced angiogenic response. J Immunol. 2013;190(7):3500–3509. doi:10.4049/jimmunol.1202769
73. Takahashi H, Ogata H, Nishigaki R, Broide DH, Karin M. Tobacco smoke promotes lung tumorigenesis by triggering IKKβ- and JNK1-dependent inflammation. Cancer Cell. 2010;17(1):89–97. doi:10.1016/j.ccr.2009.12.008
74. Ramanathan A, Wang C, Schreiber SL. Perturbational profiling of a cell-line model of tumorigenesis by using metabolic measurements. Proc Natl Acad Sci U S A. 2005;102(17):985–993. doi:10.1073/pnas.0502267102
75. Osthus RC, Shim H, Kim S, et al. Deregulation of glucose transporter 1 and glycolytic gene expression by c-Myc. J Biol Chem. 2000;275(29):21797–21800. doi:10.1074/jbc.C000023200
76. Shim H, Dolde C, Lewis BC, et al. c-Myc transactivation of LDH-A: implications for tumor metabolism and growth. Proc Natl Acad Sci U S A. 1997;94(13):6658–6663.
77. Kim JW, Gao P, Liu YC, Semenza GL, Dang CV. Hypoxia-inducible factor 1 and dysregulated c-Myc cooperatively induce vascular endothelial growth factor and metabolic switches hexokinase 2 and pyruvate dehydrogenase kinase 1. Mol Cell Biol. 2007;27(21):7381–7393. doi:10.1128/MCB.00440-07
78. Le A, Cooper CR, Gouw AM, et al. Inhibition of lactate dehydrogenase A induces oxidative stress and inhibits tumor progression. Proc Natl Acad Sci U S A. 2010;107(5):2037–2042. doi:10.1073/pnas.0914433107
79. Robichaud N, Sonenberg N, Ruggero D, Schneider RJ. Translational control in cancer. Cold Spring Harb Perspect Biol. 2019;11(7):a032896. doi:10.1101/cshperspect.a032896
80. Lum JJ, Bui T, Gruber M, et al. The transcription factor HIF-1alpha plays a critical role in the growth factor-dependent regulation of both aerobic and anaerobic glycolysis. Genes Dev. 2007;21(9):1037–1049. doi:10.1101/gad.1529107
81. Bartrons R, Caro J. Hypoxia, glucose metabolism and the Warburg’s effect. J Bioenerg Biomembr. 2007;39(3):223–229. doi:10.1007/s10863-007-9080-3
82. Weber A, Wasiliew P, Kracht M. Interleukin-1 (IL-1) pathway. Sci Signal. 2010;3(105):cm1.
83. Taneja N, Coy PE, Lee I, Bryson JM, Robey RB. Proinflammatory interleukin-1 cytokines increase mesangial cell hexokinase activity and hexokinase II isoform abundance. Am J Physiol Cell Physiol. 2004;287(2):C548–c557. doi:10.1152/ajpcell.00126.2003
84. Riera MF, Galardo MN, Pellizzari EH, Meroni SB, Cigorraga SB. Participation of phosphatidyl inositol 3-kinase/protein kinase B and ERK1/2 pathways in interleukin-1β stimulation of lactate production in Sertoli cells. Reproduction. 2007;133(4):763–773. doi:10.1530/rep.1.01091
85. Shikhman AR, Brinson DC, Valbracht J, Lotz MK. Cytokine regulation of facilitated glucose transport in human articular chondrocytes. J Immunol. 2001;167(12):7001–7008. doi:10.4049/jimmunol.167.12.7001
86. Huang Q, Lan F, Wang X, et al. IL-1β-induced activation of p38 promotes metastasis in gastric adenocarcinoma via upregulation of AP-1/c-fos, MMP2 and MMP9. Mol Cancer. 2014;13:18. doi:10.1186/1476-4598-13-18
 © 2021 The Author(s). This work is published and licensed by Dove Medical Press Limited. The full terms of this license are available at https://www.dovepress.com/terms.php and incorporate the Creative Commons Attribution - Non Commercial (unported, v3.0) License.
By accessing the work you hereby accept the Terms. Non-commercial uses of the work are permitted without any further permission from Dove Medical Press Limited, provided the work is properly attributed. For permission for commercial use of this work, please see paragraphs 4.2 and 5 of our Terms.
© 2021 The Author(s). This work is published and licensed by Dove Medical Press Limited. The full terms of this license are available at https://www.dovepress.com/terms.php and incorporate the Creative Commons Attribution - Non Commercial (unported, v3.0) License.
By accessing the work you hereby accept the Terms. Non-commercial uses of the work are permitted without any further permission from Dove Medical Press Limited, provided the work is properly attributed. For permission for commercial use of this work, please see paragraphs 4.2 and 5 of our Terms.