")
Back to Journals » International Journal of Nanomedicine » Volume 11
Increasing roughness of the human breast cancer cell membrane through incorporation of gold nanoparticles
Authors Lara-Cruz C, Jiménez-Salazar JE , Ramón-Gallegos E, Damian-Matsumura P, Batina N
Received 18 March 2016
Accepted for publication 10 June 2016
Published 7 October 2016 Volume 2016:11 Pages 5149—5161
DOI https://doi.org/10.2147/IJN.S108768
Checked for plagiarism Yes
Review by Single anonymous peer review
Peer reviewer comments 3
Editor who approved publication: Dr Thomas Webster
Supplementary video
Views: 503
C Lara-Cruz,1 JE Jiménez-Salazar,1 E Ramón-Gallegos,2 P Damian-Matsumura,1 N Batina3
1Department of Biology of Reproduction, Metropolitan Autonomous University, 2Department of Morphology, National School of Biological Sciences, National Polytechnic Institute, 3Department of Chemistry, Nanotechnology and Molecular Engineering Laboratory, Metropolitan Autonomous University, Mexico City, Mexico
Abstract: Gold nanoparticles (AuNPs) have been proposed for use in the treatment of different types of cancer, including breast cancer. At present, neither the mechanisms of AuNP interaction with the plasma membrane surface and their delivery and intracellular distribution in cancer cells nor their effect on the plasma membrane so as to allow cell incorporation of larger amounts of AuNPs is known. The objective of this work was to study the interaction of bare 20 nm diameter AuNPs with the plasma membrane of human MCF-7 breast cancer cells, as well as their uptake, intracellular distribution, and induction of changes on the cell surface roughness. The dynamics of intracellular incorporation and the distribution of AuNPs were observed by confocal laser scanning microscopy. Changes in roughness were monitored in synchronized MCF-7 cells by atomic force microscopy high-resolution imaging at 6 hour intervals for 24 hours during a single cell cycle. The results show that bare AuNPs are capable of emitting fluorescence at 626 nm, without the need for a fluorescent biomarker, which allows monitoring their uptake and intracellular distribution until they reach the nucleus. These results are correlated with changes in cell roughness, which significantly increases at 12 hours of incubation with AuNPs, when compared with control cells. The obtained data provide bases to understand molecular processes of the use of AuNPs in the treatment of different diseases, mainly breast cancer.
Keywords: gold nanoparticles uptake, MCF-7 cells, membrane roughness, atomic force microscopy, confocal laser scanning microscopy
Introduction
The application of nanotechnology in medicine has grown rapidly in recent years. The use of several types of nanoparticles (NPs) against cancer has awakened great interest in the development of methodologies that improve in vivo images for early diagnosis, punctual drug delivery to specific sites of target cells, drug carriers, photothermal agents, contrast agents, and radiosensitizers.1–3 The research for new therapeutic and early diagnosis alternatives involves the use of gold NPs (AuNPs) in the effective therapy of this disease.4 AuNPs have placed themselves at the forefront of breast cancer research in recent years due to their significant physical properties, such as shape, size, easy surface modification, and excellent biocompatibility suitable for clinical environments, and, especially, due to their unique optical properties provided by surface plasmon resonance that mainly depends on the size and shape of NPs.5,6 AuNPs produce maximum light scattering that can be achieved by exciting them at 543 nm wavelength and illuminating them so intensely that they become visible for high-resolution optical microscopy detection systems.7,8 This peculiar photodynamic behavior of AuNPs is very much influenced by their geometry, making them an excellent biomarker for early diagnosis.9 The success of AuNPs in the treatment and diagnosis of breast cancer depends on their appropriate interaction with cancer cells, for which reason their intercellular uptake and distribution must be better understood in order to efficiently exert their cytotoxic effect.
Previous studies have shown that cellular uptake of NPs is a two-stage process. First, NPs adhere onto the plasma membrane surface and are subsequently internalized by the cell through energy-dependent mechanisms. Then, they are incorporated into the cells and transported toward different subcellular compartments, normally ending in lysosomal accumulation.10 The AuNP uptake has also been shown to modulate cell membranes of different, both malignant and normal, cell types as well as subsequent downward intracellular events.11 Some mechanisms of action that cause this effect may be associated with ionic interaction between AuNPs and the membrane surface, a phenomenon related to the negative membrane potential of some cells interacting with AuNPs, which have different positive charge densities, as well as with the focal dissolution of the cell membrane that forms pits and causes perturbation of its internal structure and hence modulates its surface roughness.12–14
Atomic force microscopy (AFM) represents a powerful tool for the study of AuNP interaction with surface membranes of cancer cells.15,16 Previous studies have shown that AFM can perform the analysis of cell membrane surfaces, allowing for dynamic evaluation of AuNP interaction and incorporation into live cells, which is not possible by scanning electron microscopy (SEM) or transmission electron microscopy (TEM).17 The AFM images can be represented three-dimensionally (3D), and this technique is helpful in the measurement of height variations due to the interaction of NPs with the cell surface. The interaction of polymer NPs with plasma membrane of the cells has been shown to generate changes in mechanical properties of cell membrane (roughness), forming pores and allowing for greater permeability of NPs on the membrane.18–21 It is known that intracellular distribution of AuNPs relates the toxicity of these NPs to the damage they induce at the subcellular and molecular level, because their intracellular effects cause modulation of several molecular processes involved in cell survival or death.22,23 In this work, we have studied the effect of uncoated (bare), spherical AuNPs of 20 nm diameter on cell viability in MCF-7 breast cancer cells and the modifications they exert on the plasma membrane through interaction with its surface and the cellular uptake. In addition, intracellular incorporation and distribution of NPs were monitored using confocal laser scanning microscopy (CLSM).
Materials and methods
Chemicals and reagents
Human MCF-7 breast cancer cells were purchased from the American Type Culture Collection (ATCC; Manassas, VA, USA). Culture medium, Dulbecco’s Modified Eagle’s Medium (DMEM), was purchased from Thermo Fisher Scientific (Waltham, MA, USA). Antibodies were purchased from Santa Cruz Biotechnology Inc. (Dallas, TX, USA) or Cell Signaling Technology (Beverley, MA, USA). Trypan blue exclusion reagent was purchased from Thermo Fisher Scientific. Dimethyl sulfoxide was purchased from Merck Millipore (Darmstadt, Germany). The antifungal antibiotic was purchased from Thermo Fisher Scientific. Fetal bovine serum (FBS) was purchased from Thermo Fisher Scientific. All chemicals were research grade.
Spherical colloidal AuNPs, 20 nm in diameter, were acquired from BBI Solutions (Cardiff, UK) for use in research. According to previous literature, these 20 nm AuNPs, often used in studies similar to ours, have already been well characterized by different techniques, such as SEM, and TEM in different culture media.24–30
Cell culture
MCF-7 human breast cancer cells were obtained from the American Type Culture Collection (ATCC), maintained at 37°C, 5% CO2 as monolayer cultures (50% confluence) in DMEM (high glucose and phenol red free; Thermo Fisher Scientific), and supplemented with 10% (v/v) FBS, gentamicin (50 μg/mL), and 100 U penicillin/100 μg/mL streptomycin (Thermo Fisher Scientific). In order to synchronize cell cultures and prior to AuNP treatment, MCF-7 cells were cultured in phenol red-free DMEM containing 2.5% FBS that was previously treated with charcoal–dextran. Control cells were treated with vehicle (Vh) (Milli-Q Ultrapure Water; Merck Millipore, Darmstadt, Germany).
Cell viability assay
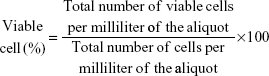
Viability assay by trypan blue exclusion was used to determine the percentage viability of MCF-7 cells incubated with AuNPs. Cells were seeded in 24-well plates (10,000 cells/well) for 24 hours. Subsequently, they were incubated with AuNPs at different concentrations (20 μg/mL, 50 μg/mL, and 80 μg/mL) to finally measure the percentage of cell viability at different incubation times (24 hours, 48 hours, and 72 hours). AuNPs incubated with cells were centrifuged for 5 minutes at 1,000 rpm, and the supernatant was discarded. A cell suspension was made at a suitable dilution (1×10⁵ cells/mL) in phosphate-buffered saline (PBS), and 90 μL of this cell suspension was taken and mixed with 10 μL of 4% trypan blue. The solution was mixed thoroughly and allowed to stand for 3 minutes at room temperature. Subsequently, 20 μL of the mixture was transferred to a hemocytometer (Neubauer chamber), and viable cells were counted as clear cells and dead cells as blue ones. The number of live cells per milliliter was calculated using the following formula:
|
|
Cell morphology was analyzed using an inverted microscope Axioveert 40 CFL (Carl Zeiss Meditec AG, Jena, Germany), equipped with a Cannon PowerShot A640 camera, using the 10× lens.
Atomic force microscopy
AFM images and surface analysis of plasma membrane on MCF-7 cells were acquired in tapping mode AFM, NanoScope IIIa (Veeco Inc., Plainview, NY, USA), using standard clean probes of silicon nitride with an average resonance frequency of 256 kHz and 365 kHz and a spring constant of 20–80 pN/nm. Image acquisition is constantly manually adjusted in order to maintain optimum signal and appropriate resolution. The amplitude values of the cantilever remained at ~1,500 mV and at 1.3 V set point. The scan rate was maintained between 0.3 Hz and 0.9 Hz, and all obtained in air. Cell culture was grown on a single crystal film with Au (111) surface. It is a rectangular glass substrate (area of 1 cm2) 2 mm thick, with 200 nm chrome film, overlying the glass and 2,000 nm upper layer of Au (111) film. To properly position the plate for AFM analysis, regular morphology cells (elongated) were selected by optical microscopy coupled with AFM (Nikon Corporation, Tokyo, Japan). The analysis was first performed on a large area (100 μm2) with a single cell, later heading the cantilever to the cell surface, where images of 50 μm2, 20 μm2, 10 μm2, 5 μm2, 2.5 μm2, and 1 μm2 were obtained sequentially. The same procedure was repeated on at least three different areas of the same cell and in three different cells, with three different AFM acquisition modes: height, phase, and amplitude. Acquisition time for each image varied from 20 minutes to 40 minutes. The image analysis was performed using the AFM-NanoScope III software (Veeco Inc.). Scanning area for all surface roughness analyses was 5 μm2 and 1 μm2.
The gold plates were placed in a 24-well plate and an aliquot of 20 μL of cellular suspension (10,000 cells) was added by direct dripping on the gold surface and led to a final volume of 400 μL with DMEM +5% FBS. The plates were incubated at 37°C for 24 hours to achieve not >70% confluence and the medium with low (2.5%) concentration of FBS, in order to synchronize cells (decrease sequential synchronization). After reaching the optimal time for synchronization, the corresponding treatment consisted of incubating the cells with a mixture of DMEM +5% FBS/AuNP (μg/mL) at different times (0 hours, 6 hours, 12 hours, 16 hours, and 24 hours). Lastly, the cells were fixed in ethanol dehydration train 10%, 20%, 30%, 40%, 50%, 60%, 70%, 80%, and 96% for 2 minutes at each concentration.
Cellular uptake and internal distribution of AuNP
Cells were cultured in eight-well chamber slides (Lab-Tek II Chamber Slides; Thermo Fisher Scientific Inc, Waltham, MA, USA) for 24 hours and subsequently incubated with AuNPs 80 μg/mL for 2 hours, 6 hours, 12 hours, 16 hours, and 24 hours. Control cells, Vh, were incubated with Milli-Q Ultrapure Water. Cells were washed with a PBS solution. The treated MCF-7 cells were fixed with 4% paraformaldehyde in PBS. Subsequently, all cells were incubated with 1 μg/mL 4′,6-diamidino-2-phenylindole (DAPI) (Sigma-Aldrich Co., St Louis, MO, USA) to contrast the nuclei and were mounted with mounting medium for fluorescence (Dako Denmark A/S, Glostrup, Denmark). Images were obtained using a multiphoton confocal microscope (LSM-780 NLO; Carl Zeiss Meditec AG). Fifteen slides of 16.16 μm each were used for the acquisition of Z-stacks.
Statistical analysis
Data were presented as mean ± SD of at least three independent experiments carried out in triplicate. The GraphPad Prism Software (GraphPad Software, Inc., La Jolla, CA, USA) was used for the analysis of variance. Comparisons between groups were carried out using the Tukey–Kramer multiple comparison tests. Differences were considered statistically significant when P-values were <0.05.
Results and discussion
Effect of AuNPs on cell viability and MCF-7 cell morphology
In order to determine sublethal conditions of AuNPs used in incorporation studies, MCF-7 cells were incubated with different concentrations (20 μg/mL, 50 μg/mL, or 80 μg/mL) of AuNPs for different times (24 hours, 48 hours, or 72 hours) before determining the cell viability. The obtained results show that AuNPs do not induce loss of viability when incubated for 24 hours. The significant effects (P<0.05 vs Vh) on MCF-7 cell viability were observed at 48 hours of incubation only with the highest AuNP concentration, ie, at 80 μg/mL, and at 72 hours of incubation with the three concentrations studied (Figure 1A).
 | Figure 1 Sublethal effects of AuNPs on MCF-7 cell viability. |
These results were contrasted with cell morphology studies carried out using optical microscopy, which also show more obvious structural changes in cells incubated with 80 μg/mL AuNPs than during 48 hours and 72 hours, as compared to the cells incubated with Vh (Milli-Q Water). When the cells were incubated with 20 μg/mL and 50 μg/mL concentrations of AuNPs, the effects on cell morphology were seen after 48 hours of incubation (Figure 1B). The observed changes include reduction of cell size, formation of spheroidal structures instead of their normal elongated shape, and subsequent detachment of the substrate, which is characteristic of cell death.
Our results agree with those reported previously, which show that the administration of 13 nm diameter AuNPs at concentration >100 μg/mL during incubation superior to 24 hours causes irreparable damage to both the plasma membrane architecture of human dermal fibroblasts31 and the mitochondria and nuclei of chronic myelogenous leukemia cells (K562).32 These results were reproduced on prostate,33 lung,34 and nasopharyngeal35 cancer cells, which suggest that cell death could be mediated by processes associated with apoptosis or necrosis.
Furthermore, these results allowed us to establish the most appropriate conditions for studying 20 nm spheroidal AuNP incorporation processes at the plasma membrane level, such as 80 μg/mL of the AuNP concentration and incubation time of up to 24 hours.
Detection of AuNPs in MCF-7 cells by AFM
In order to determine the AuNP location on the plasma membrane of MCF-7 cells and on the substrate, tapping mode-height scans were performed using the AFM-Nanoscope III software. The MCF-7 cells were incubated with 80 μg/mL of 20 nm diameter AuNPs at 12 hours of exposure; they were fixed by dehydration process with different concentrations of ethanol to perform the topographic analysis (Figure 2). The AFM revealed features whose sizes ranged between 80 nm and 400 nm in diameter, which suggests the presence of AuNP aggregates (cluster) on the cell surface (Figure 2A and B) rather than individual 20 nm NPs. Indeed, the AuNP aggregates located on the surface of MCF-7 cells have the same dimensions as AuNP agglomerates observed on the surface of the gold-coated plate used for the growth of these cells (Figure 2C).
 | Figure 2 Detection of AuNPs on MCF-7 cells by AFM. |
Our observations agree with those reported by other authors regarding the cell lines of mouse calvarial osteoblasts (MC3T3 E1),36 pancreatic cancer (PK-1, PK-45, and Panc-1),37 and liver cancer (Hep-G2),38 located on the plasma membrane, obtained by TEM, SEM, and CLSM.
AuNP detection by fluorescent emission spectrum
With the aim of corroborating the presence of AuNP agglomerates observed by AFM scans, we have carried out studies using CLSM LSM-780 NLO (Carl Zeiss Meditec AG). The determination was performed on samples of MCF-7 cells that were incubated with 80 μg/mL of bare AuNPs for 6 hours. The spectral analysis was carried out subsequently in the range from 416 nm to 687 nm by CLSM. In order to eliminate background autofluorescence generated by the cells, the emission spectrum was normalized to that emitted by control cells whose nuclei were stained with the nuclear dye DAPI. The whole process is shown in Figure 3A–D.
 | Figure 3 Detection of AuNPs in MCF-7 cells by fluorescence emission. |
Figure 3A shows emission spectrum images of AuNPs in MCF-7 cells, at different wavelengths, with a fluorescence signal emitted at 626 nm wavelength, seen as bright white dots (Figure 3B).
The cells incubated with Vh emit low amount of fluorescence in the red spectrum (Figure 3C), without bright dots. Therefore, this low amount was established as basal value of the background fluorescence for all further measurements. The last inset of spectral analyses of both experiments shows the sum of all analyzed channels and final image reconstruction, where fluorescence emission results from the use of DAPI as reference in CLSM (Figure 3A and C).
These results indicate that the greatest incorporation of AuNPs into MCF-7 cells takes place at 6 hours of incubation, and their distribution in the cytoplasm is more evident than in the nucleus. The AuNP aggregates are visualized as differently sized bright dots heterogeneously distributed in the cell (Figure 3B). The 626 nm wavelength signal was not detected in Vh-treated cells (Figure 3D).
Our results are consistent with previous reports showing that AuNPs of different sizes (10 nm, 15 nm, 20 nm, 30 nm, and 50 nm) and shapes (nanorods, nanocages, nanostars, nanosphericals, and nanoshells) are capable of emitting fluorescent signals due to their optical properties at wavelengths ranging between 458 nm and 683 nm, using CLSM9,39 and Raman spectroscopy.40–42 It is worth mentioning that most experiments reported with CLSM require AuNP fictionalization with fluorescent dyes to be detected intracellularly,43,44 whereas Raman spectroscopy generates low-quality images of the fluorescent signal for bare AuNPs in in vitro models.45 The obtained CLSM results support AFM findings that AuNPs agglomerate on the plasma membrane of MCF-7 breast cancer cells and confirm the process of intracellular incorporation of AuNPs. In order to prove the intracellular presence of AuNPs and their penetration up to the nuclei of MCF-7 cells, “Z-stack” analysis was performed at 6 hours of incubation using CLSM.
Cellular uptake and intracellular distribution of AuNPs
To determine intracellular incorporation and distribution of AuNPs, fluorescence analysis was carried out using CLSM at 626 nm, where MCF-7 cells were incubated with either Vh (Figure 4A) or 80 μg/mL of AuNPs (Figure 4B) for 6 hours, 12 hours, or 24 hours. In each case, cell nucleus was stained with DAPI and, therefore, appears blue in images in Figure 4A–D.
 | Figure 4 Cellular uptake and intracellular spatial distribution of AuNPs. |
The obtained data show that after 6 hours of incubation with AuNPs, their intracellular distribution is heterogeneous and also that they are not incorporated in the same proportion by all cells. However, at 12 hours, AuNPs were incorporated into the cell nuclei to a greater extent. Due to overlapping of the fluorescence spectra emitted by AuNPs (red) and by DAPI (blue), the part of nuclei with incorporated AuNPs becomes pink. This effect was proved by “Z-stack” analysis presented in Video S1, which is assembled from 15 slides (16 μm of thickness for each cut) (see Video S1 and Figure S1).
Interestingly, results obtained at 24 hours of AuNPs incubation show lower fluorescence emission (red and pink colors) when compared to those obtained at 12 hours (Figure 4D), which could be due to the cellular expulsion of AuNPs or cell damaging and redistribution of AuNP aggregates. It has been previously reported that after 24 hours, the interaction of AuNPs with the nucleus in MCF-746 and lung47 cells can generate destabilization of the nucleus wrapping, thus altering the function of this organelle and causing cell collapse and death.22,48
Effect of AuNPs on plasma membrane surface roughness of MCF-7 cells
The effect of AuNPs on membrane roughness of MCF-7 cells was determined using AFM and taking into consideration the measuring surface roughness (root mean square) (RMS[Rq]) value as a quantitative parameter. Few possible problems of this method include heterogeneous character/structure of the cell plasma membrane surface and dependence on the cell cycle phase in which the cells are in a particular moment of growth. We take both problems into consideration. First, on each cell, the AFM scanning was performed in three different zones (Figure 5A and B): N region, above the nuclei of MCF-7 cells; E region, at the border between the cell membrane and the gold substrate upon which the cell adheres; and I region, the intermediate (cytoplasmic) region between the N and E regions. In these particular regions, the analyses were performed in scan areas ranging from 20 μm2 to 0.5 μm2, in order to see RMS[Rq] variation with the scan size.
 | Figure 5 Effect of AuNPs on surface roughness of MCF-7 plasma membrane. |
Second, the membrane surface roughness analyses were performed with MCF-7 cells synchronized by serum deprivation, which provided more homogeneous results. It was achieved in each series with at least three different experiments.
The collected data indicate that RMS[Rq] roughness values differ significantly (P<0.05) for each region, the highest being observed for the N region the lowest for the E region (Figure 5C). However, the N region occupies rather small area of the cell surface, which does not allow multiple measurements.
Therefore, we decided to analyze the surface roughness on synchronized MCF-7 cells in the absence and presence of AuNPs (20 nm, 80 μg/mL) by performing scans of 5 μm2 areas in three different places of the I region. Analysis was performed on at least nine individual cells in three to five independent experiments.
Figure 5D shows the topographic analysis of AFM, in height (“tapping” or oscillating) mode, obtained at conditions described earlier. The high-resolution AFM images of each incubation time in the absence and presence of AuNPs are presented in 3D mode, where brighter regions correspond to higher cell areas. Note that detailed inspection of the obtained set of images for different time of exposure to AuNPs allows following qualitatively the tendency of the cell surface roughness to change. The RMS[Rq] values derived from those images show that the roughness of MCF-7 cell plasma membranes increases proportionally over time of incubation up to 12 hours, after which it decreases without reaching the exact initially observed values (Figure 5E).
The effects of AuNPs on the plasma membrane roughness can be easily associated with the MCF-7 cell cycle phases. At 6 hours of incubation, corresponding to G1 phase, the RMS[Rq] values increase by 20% with respect to the initial time, without presenting significant differences between the cells incubated with AuNPs or Vh. Between 12 hours and 16 hours, where the S-to-G2 transition phase is expected, the maximum increase in RMS[Rq] values is observed, being 60% greater with respect to the initial time when incubated with AuNPs and 30% greater with Vh (P<0.05). The effect of incubation with AuNPs on the membrane roughness is seen to decrease at 24 hours, without significant differences between the Vh and experimental groups (P<0.05).
AuNPs induce pore formation in MCF-7 cell membranes
AFM images also showed numerous plasma membrane depressions with depths close to 90 nm, which were observed only on the membranes of cells incubated with AuNPs (mostly at 12 hours and 16 hours), but not on Vh. Figure 6A and B shows images of the Vh cell and another one treated with AuNPs for 12 hours, respectively. The surface of the treated cell is populated with several depressions, holes (dark color). The high-resolution image with scan area of 1 μm2, presented in 3D mode, reveals the circular shape and exact dimension (467.21 nm diameter) of the biggest depression (pore) observed at the cell surface (Figure 6C and cross-section analysis in Figure 6D).
 | Figure 6 The AuNPs induce pore formation in MCF-7 cell membranes. |
This suggests possible “nanopore” formation associated with various mechanisms of cell endocytosis, a phenomenon attributed to the interaction of AuNPs with the surface of plasma membranes. This phenomenon is consistent with previous reports demonstrating that NP interaction with cell surface causes structural plasma membrane modifications21,49 and favors pore formation on plasma membranes for their subsequent uptake by endocytosis.50 Interestingly, it occurred after 12 hours of treatments when we observed that AuNPs incorporate into cell nuclei.
Conclusion
Our work proves that the exposure of 20 nm diameter spherical AuNPs to MCF-7 breast cancer cells generates changes in cell morphology at concentrations <100 μg/mL (20 μg/mL, 50 μg/mL, and 80 μg/mL) without having a lethal effect according to the results obtained in viability analyses. These data were of huge importance because they allowed us to establish correct parameters for monitoring the interaction and incorporation of AuNPs in MCF-7 cells. It was determined that out of the three concentrations employed, the 80 μg/mL concentration was the most appropriate to perform the subsequent studies on AuNP uptake in incubation periods <24 hours.
It was clearly demonstrated that AuNPs produce changes in plasma membrane of MCF-7 cells by increasing their roughness on entering into contact with membrane surface as shown by AFM analysis, and upon being incorporated intracellularly; this phenomenon was demonstrated by fluorescent signal emitted by AuNPs used herein and was detected at 626 nm wavelength by CLSM. Surprisingly, it was determined that with the passing of time, AuNPs distribute heterogeneously in the cell cytoplasm until they reach the periphery of the nucleus and finally get incorporated into it.
Finally, it was demonstrated that there is a narrow relationship between the increase in roughness and the pore formation on the plasma membrane of cancer cells associated with the interaction and uptake of AuNPs, suggesting that this phenomenon is related to the mechanisms of endocytosis of AuNP agglomerates; however, said phenomenon needs to be further investigated since such behavior of plasma membrane of the cells can also be related to a possible process of exocytosis.
Additionally, and as importantly, it was demonstrated that using the methodology and technique developed here, such as AFM and CLSM, one could successfully trace the process of NP incorporation into the cell at the nanometric level. Since AFM and CLSM are not limited to determination of metal particles, as is the case with SEM and TEM, we believe that the methodology presented here has a great potential in studies of interactions and uptake of nonmetallic NPs into cell material and can contribute to a better understanding of the mechanism of action and the use of NPs in medicine, in general.
Acknowledgments
This work was supported by CONACYT, through a PhD grant to CL-C (233333), the CB-2006-1-61242 project to Experimental Biology Graduate Program, UAMI, MEXICO, and Multidisciplinary Nanotechnology Project ICYT-DF-UAM (no 12112055). We are grateful for the technical support from the Confocal Microscopy and the Molecular Biology Laboratories, Division of Biological and Health Sciences, Metropolitan Autonomous University, Iztapalapa Campus, Mexico City, Mexico.
Disclosure
The authors report no conflicts of interest in this work.
References
Wang X, Yang L, Chen Z, Shin DM. Application of nanotechnology in cancer therapy and imaging. CA Cancer J Clin. 2008;58(2):97–110. | ||
Wang X, Wang Y, Chen ZG, Shin DM. Advances of cancer therapy by nanotechnology. Cancer Res Treat. 2009;41(1):1–11. | ||
Jing-Liang L, Min G. Gold-nanoparticle-enhanced cancer photothermal therapy. IEEE J Sel Top Quantum Electron. 2010;16(4):989–996. | ||
Jain S, Hirst DG, O’Sullivan JM. Gold nanoparticles as novel agents for cancer therapy. Br J Radiol. 2012;85(1010):101–113. | ||
Coulter JA, Jain S, Butterworth KT, et al. Cell type-dependent uptake, localization, and cytotoxicity of 1.9 nm gold nanoparticles. Int J Nanomedicine. 2012;7(1):2673–2685. | ||
Xing J, Zeng J, Yang J, et al. Gold-based nanoparticles for breast cancer diagnosis and treatment. IEEE Int Symp ISCAS. 2007:2882–2885. | ||
Jain PK, Eustis S, El-Sayed MA. Plasmon coupling in nanorods assemblies: optical absorption, discrete dipole aproximation simulation, and exiton-coupilng model. J Phys Chem B. 2006;110(37):18243–18253. | ||
Tsai SW, Chen YY, Liaw JW. Compound cellular imaging of laser scanning confocal microscopy by using gold nanoparticles and dyes. Sensor. 2008;8(4):2306–2316. | ||
Nazir S, Hussain T, Ayub A, Rashid U, MacRobert A. Nanomaterials in combating cancer: therapeutic applications and developments. Nanomedicine. 2014;10(1):19–34. | ||
Taylor U, Sabine K, Petersen S, Kues W, Barcikowski S, Rath D. Nonendosomal cellular uptake of ligand-free, positively charged gold nanoparticles. Cytometry A. 2010;77(5):439–446. | ||
Lesniak A, Salvati A, Santos-Martinz MJ, Radomski MW, Dawson KA, Aberg C. Nanoparticles adhesion to the cell membrane and its effect on nanoparticles uptake efficiency. J Am Chem Soc. 2013;135(4):1438–1444. | ||
Rejman J, Oberle V, Zuhorn IS, Hoekstra D. Size-dependent internalization of particles via the pathways of clathrin-and caveolae-mediated endocytosis. Biochem J. 2004;377(1):159–169. | ||
Arvizo RR, Miranda OR, Thompson MA, et al. Effect of nanoparticle surface charge at the plasma membrane and beyond. Nano Lett. 2010;10(7):2543–2548. | ||
Fröhlich E. The role of surface charge in celular uptake and cytotoxicity of medical nanoparticles. Int J Nanomedicine. 2012;7:5577–5591. | ||
Müller DJ, Dufrêne YF. Atomic force microscopy: a nanoscopic window on the cell surface. Trends Cell Biol. 2011;21(8):461–469. | ||
Tapia M, Batina N, Maldonado E, Tanori J, Ramón E. Nanoscopic characterization of membrane surface HeLa cáncer cells in the presence of the gold nanoparticles. Revista Mexicana de Física. 2009;55(1):64–67. | ||
Müller DJ, Helenius J, Alsteens D, Dufrêne YF. Force probing surfaces of living cells to molecular resolution. Nat Chem Biol. 2009;5(6):383–390. | ||
Ding B, Tian Y, Pan Y, et al. Recording the dynamic endocytosis of single gold nanoparticles by AFM-based force tracing. Nanoscale. 2015;7(17):7545–7549. | ||
Shukla R, Bansal V, Chaudhary M, Basu Bhonde AR, Sastry M. Biocompatibility of gold nanoparticles and their endocytotic fate inside the cellular compartment: a microscopic overview. Langmuir. 2005;21(23):10644–10654. | ||
Vasir JK, Labhasetwar V. Quantification of the force of nanoparticle-cell membrane interactions and its influence on intracellular trafficking of nanoparticles. Biomaterials. 2008;29(31):4244–4252. | ||
Hong S, Bielinska AU, Mecke A, et al. Interaction of poly(amidoamine) dendrimers with supported lipid bilayer and cells: hole formation and the relation to transport. Bioconjug Chem. 2004;15(4):774–782. | ||
Kodiha M, Hutter E, Boridy S, Juhas M, Maysinger D, Stochaj U. Gold nanoparticles induce nuclear damage in breast cancer cells, which is further amplified by hyperthermia. Cell Mol Life Sci. 2014;71(21):4259–4273. | ||
Soenen S, Manshian B, Montenegro JM, et al. Cytotoxic effects of gold nanoparticles: a multiparametric study. ACS Nano. 2012;6(7):5767–5783. | ||
Casal E, Pfaller T, Duschl A, Oostingh GJ, Puntes V. Time evolution of the nanoparticle protein corona. ACS Nano. 2010;4(7):3623–3632. | ||
Rhieu SY, Reipa V. Tuning the size of gold nanoparticles with repetitive oxidation-reduction cycles. Am J Nanomater. 2015;3(1):15–21. | ||
Trono JD, Mizuno K, Yusa N, Matsukawa T, Yokoyama K, Uesaka M. Size, concentration and incubation time dependence of gold nanoparticle uptake into pancreas cancer cells and its future application to X-ray drug delivery system. J Radiat Res. 2011;52(1):103–109. | ||
Brun E, Sicard-Roselli C. Could nanoparticle corona characterization help for biological consequence prediction? Cancer Nanotechnol. 2014;5(1):7. | ||
Murthy AK, Stover RJ, Hardin WG, et al. Charged gold nanoparticles with essentially zero serum protein adsorption in undiluted fetal bovine serum. J Am Chem Soc. 2013;135(21):7799–7802. | ||
Brewer SH, Glomm WR, Johnson MC, Knag MK, Frazen S. Probing BSA binding to the citrate-coated gold nanopaticles and surfaces. Langmuir. 2005;21(20):9303–9307. | ||
Sabuncu AC, Grubbs J, Qian S, Abdel-Fattah TM, Stacey MW, Beskok A. Probing nanoparticle interactions in cell culture media. Colloids Surf B Biointerfaces. 2012;95:96–102. | ||
Pernodet N, Fang X, Sun Y, et al. Adverse effects of citrate/gold nanoparticles on human dermal fibroblast. Small. 2006;2(6):766–773. | ||
Huang YC, Yang YC, Yang KC, et al. Pegylated gold nanoparticles induced apoptosis in human chronic myeloid leukemia cells. Biomed Res Int. 2014;2014:182353. | ||
Malugina A, Ghandeharia H. Cellular uptake and toxicity of gold nanoparticles in prostate cancer cells: a comparative study of rods and spheres. J Appl Toxicol. 2009;30(3):212–217. | ||
Liu M, Gu X, Zhang K, Ding Y. Gold nanoparticles trigger apoptosis and necrosis in lung cancer cells with low intracellular glutathione. J Nanopart Res. 2013;15(8):1745–1748. | ||
Lan MY, Hsu YB, Hsu CH, Ho CY, Lin JC, Lee SW. Induction of apoptosis by high dose gold nanoparticles in nasopharyngeal carcinoma cells. Auris Nasus Larynx. 2013;40(6):563–568. | ||
Mustafa T, Watanabe F, Monroe W, et al. Impact of gold nanoparticle concentration on their cellular uptake by MC3t3-e1 mouse osteoblastic cells as analyzed by transmission electron microscopy. J Nanomedic Nanotechnol. 2011;2(6):1000118. | ||
Trono J, Mizuno K, Yusa N, Matsukawa T, Uesaka M. Cellular uptake of gold nanoparticles into normal and cancer cells. World Congress on Medical Physics and Biomedical Engineering, September 7–12, 2009. Munich: Springer Berlin Heidelberg; 2009:202–205. | ||
Panariti A, Miserocchi G, Rivolta I. The effect of nanoparticle uptake on cellular behavior: disrupting or enabling functions? Nanotechnol Sci Appl. 2012;5:87–100. | ||
Rago G, Bauer B, Svedberg F, et al. Uptake of gold nanoparticles in healthy and tumor cells visualized by nonlinear optical microscopy. J Phys Chem B. 2011;115(17):5008–5016. | ||
Shah NB, Dong J, Bischof JC. Cellular uptake and nanoscale localization of gold nanoparticles in cancer using label-free confocal Raman microscopy. Mol Pharm. 2010;8(1):176–184. | ||
Zhen W. Plasmon-resonance gold nanoparticles for cancer optical imaging. Sci China Phys Mech Astron. 2013;56(3):506–513. | ||
Huefner A, Setiadi D, Wilts BD, et al. Gold nanoparticles explore cells: cellular uptake and their use as intracellular probes. Methods. 2014;68(2):354–363. | ||
Gonciar A. Detection of intracellular gold nanoparticles. Biotechnol Mol Biol Nanomed. 2014;2(1):21–25. | ||
Klein S, Petersen S, Taylor U, Rath D, Barcikowski S. Quantitative visualization of colloidal and intracellular gold nanoparticles by confocal microscopy. J Biomed Opt. 2010;15(3):036015. | ||
García CP, Sumbayev V, Gilliland D, et al. Microscopic analysis of the interaction of gold nanoparticles with cells of the innate immune system. Sci Rep. 2013;3:1326. | ||
Selim ME, Hendi AA. Gold nanoparticles induce apoptosis in MCF-7 human breast cancer cells. Asian Pac J Cancer Prev. 2012;13(4):1617–1620. | ||
Liu Z, Wu Y, Guo Z, et al. Effects of internalized gold nanoparticles with respect to cytotoxicity and invasion activity in lung cancer cells. PLoS One. 2014;9(6):e99175. | ||
Kodiha M, Wang YM, Hutter E, Maysinger D, Stochja U. Off to the organelles-killing cancer cells with targeted gold nanoparticles. Theranostics. 2015;5(4):357–370. | ||
Verma A, Stellacci F. Effect of surface properties on nanoparticle–cell interactions. Small. 2009;6(1):12–21. | ||
Tong L, Zhao Y, Huff TB, Hansen MN, Wei A, Cheng JX. Gold nanorods mediate tumor cell death by compromising membrane integrity. Adv Mater. 2007;19(20):3136–3141. |
Supplementary materials
Video S1. Video presenting intercellular incorporation of gold nanoparticles (AuNPs) (red color) and MCF-7 nuclei (blue color) after 6 hours of incubation. When AuNPs entered cell nuclei, they became a pink color. The video is assembled from 15 slides, with 16 μm of thickness for each cut.
 | Figure S1 Ortho image assembled from Z-stack (A) (scale bar: 20 μm), present the place of incorporation of gold nanoparticles (AuNPs) into cell nucleus (crosslink section), after 6 hours of incubation. A 3D view of the ortho image is presented at (B) (scale bar: 20 μm). More details about the incorporated AuNPs can be seen in (C) and (D) on reconstructed images (image sizes: 60×70 μm, and 6×7 μm, respectively). |
 © 2016 The Author(s). This work is published and licensed by Dove Medical Press Limited. The full terms of this license are available at https://www.dovepress.com/terms.php and incorporate the Creative Commons Attribution - Non Commercial (unported, v3.0) License.
By accessing the work you hereby accept the Terms. Non-commercial uses of the work are permitted without any further permission from Dove Medical Press Limited, provided the work is properly attributed. For permission for commercial use of this work, please see paragraphs 4.2 and 5 of our Terms.
© 2016 The Author(s). This work is published and licensed by Dove Medical Press Limited. The full terms of this license are available at https://www.dovepress.com/terms.php and incorporate the Creative Commons Attribution - Non Commercial (unported, v3.0) License.
By accessing the work you hereby accept the Terms. Non-commercial uses of the work are permitted without any further permission from Dove Medical Press Limited, provided the work is properly attributed. For permission for commercial use of this work, please see paragraphs 4.2 and 5 of our Terms.