")
Back to Journals » Infection and Drug Resistance » Volume 17
Immune Dysfunction-Associated Elevated RDW, APACHE-II, and SOFA Scores Were a Possible Cause of 28-Day Mortality in Sepsis Patients
Authors Wang J, He L, Jin Z , Lu G, Yu S, Hu L, Fang M, Jin X
Received 22 October 2023
Accepted for publication 19 March 2024
Published 26 March 2024 Volume 2024:17 Pages 1199—1213
DOI https://doi.org/10.2147/IDR.S442169
Checked for plagiarism Yes
Review by Single anonymous peer review
Peer reviewer comments 2
Editor who approved publication: Professor Suresh Antony
Jing Wang,1,* Lisha He,2,* Zhiyan Jin,1,* Guoguang Lu,1 Sufei Yu,1 Lingling Hu,1 Meidan Fang,1 Xiaxia Jin1
1Department of Clinical Laboratory, Taizhou Hospital of Zhejiang Province Affiliated to Wenzhou Medical University, Linhai, Taizhou, Zhejiang Province, People’s Republic of China; 2Department of Ultrasound, Taizhou Hospital of Zhejiang Province Affiliated to Wenzhou Medical University, Linhai, Taizhou, Zhejiang Province, People’s Republic of China
*These authors contributed equally to this work
Correspondence: Meidan Fang; Xiaxia Jin, Department of Clinical Laboratory, Taizhou Hospital of Zhejiang Province Affiliated to Wenzhou Medical University, Linhai, Taizhou, Zhejiang Province, People’s Republic of China, Tel +86 13586102337; +86 15967063239, Email [email protected]; [email protected]
Objective: To explore the early predictors and their predicting value of 28-day mortality in sepsis patients and to investigate the possible causes of death.
Methods: 127 sepsis patients were included, including 79 cases in the survival group and 48 cases in the death group. The results of all patients on admission were recorded. After screening the risk factors of 28-day mortality, the receiver operating characteristic curve (ROC) was used to determine their predictive value for the 28-day mortality rate on admission, and the Kaplan-Meier curve was drawn to compare the 28-day mortality rate between groups. Finally, patients with cytokine and lymphocyte subsets results were included for investigating the possible causes of death through correlation analysis.
Results: APACHE II (acute physiology and chronic health evaluation II), SOFA (Sequential Organ Failure Assessment) and red blood cell distribution width (RDW) were the risk factors for 28-day mortality in sepsis patients (OR: 1.130 vs.1.160 vs.1.530, P < 0.05). The area under the curve (AUC), sensitivity and specificity of APACHE II, SOFA and RDW in predicting the mortality rate at 28 days after admission in sepsis patients were 0.763 vs 0.806 vs 0.723, 79.2% vs 68.8% vs 75.0%, 65.8% vs 89.9% vs 68.4%. The combined predicted AUC was 0.873, the sensitivity was 89.6%, and the specificity was 82.3%. The Kaplan-Meier survival curve showed that the 28-day mortality rates of sepsis patients with APACHE II≥ 18.5, SOFA≥ 11.5 and RDW≥ 13.8 were 58.5%, 80.5% and 59.0%, respectively. In the death group, APACHE II was positively correlated with SOFA, IL-2, and IL-10, and RDW was positively correlated with PLT, TNF-α, CD3+ lymphocyte count, and CD8+ lymphocyte count.
Conclusion: Sepsis patients with high APACHE II, SOFA and RDW levels at admission have an increased 28-day mortality rate. The elevation of these indicators in dead patients are related to immune dysfunction.
Keywords: sepsis, APACHE II, SOFA, red blood cell distribution width, mortality, immune dysfunction
Introduction
Sepsis is a syndrome of physiological, pathological and biochemical abnormalities caused by infection1 and is a significant public health problem. The consensus on sepsis in 1991 declared that sepsis was caused by systemic inflammatory response syndrome (SIRS) of the host against infection.2 Sepsis complicated with organ dysfunction is known as the severe type, which can progress to septic shock.3 With the lack of further understanding of sepsis, its definition was gradually revised and improved. In 2016, sepsis was redefined as life-threatening organ dysfunction caused by the uncontrolled inflammatory response of the body. Judging by the acute increase of the SOFA score > 2 points, as described in Sepsis 3.0.4
Sepsis patients have a high mortality rate. More than 250,000 sepsis patients die yearly in the United States, and the inpatient mortality rate is about 26%.5 However, timely targeted interventions can improve the outcome of sepsis patients.6 Therefore, identifying sepsis patients with a high risk of death in the early stage has significant clinical value.
Research has shown that sepsis can be divided into an initial immune activation stage and a chronic immune suppression stage, ultimately leading to immune cell death. Due to the lack of specific treatment methods for sepsis, sustained damage to the host’s immune system can lead to an increase in sepsis-related mortality.7 In addition, studies have found that during sepsis, the inhibitor proteins of the immune checkpoint were usually up-regulated and could be used as potential targets for diagnosing and treating sepsis and helped reduce sepsis mortality.8 However, our knowledge of immune physiology related to sepsis is limited; most studies only focused on a specific type of immune cell at once, and the timeline of immune changes in sepsis was not yet clear.9 Therefore, dynamic tracking of immune cell count and cytokines in sepsis patients had specific clinical value for early identification and intervention of sepsis patients, thereby reducing their mortality.
In this study, we retrospectively collected hospitalized sepsis patients. We recorded the patients’ clinical information and laboratory index results on admission to explore the early predictors and analyze their value in predicting the risk of 28-day mortality in sepsis patients. At the same time, we analyzed the related factors that cause death due to the increase of the above indicators, and we also followed all available immune cell counts and cytokine data during hospitalization for all patients, which will provide a new basis for early intervention, improvement of prognosis and reduction of mortality in sepsis patients with high risk of death.
Materials and Methods
Cohorts
A total of 196 sepsis inpatients from January to June 2022 were retrospectively collected. Patients who died within 48 hours of admission (n=22), transferred to a superior hospital (n=18), with incomplete indicators required for scoring (n=16), and were unable to obtain a survival state at 28 days after admission (n=13) were excluded, and 127 patients were finally included. According to their survival status 28 days after admission, they were divided into a survival group (79 cases) and a death group (48 cases). 53 males and 26 females were in the survival group, aged 69.0 (55.5–82.0) years old. In the death group, there were 37 males and 11 females, aged 73.5 (57.5–81.3) years old. 46 patients with simultaneous cytokine and lymphocyte subsets were included, including 27 cases in the survival group and 19 cases in the death group (Figure 1).
 |
Figure 1 Flowchart of the cohorts. |
Diagnostic Criteria of Sepsis and Septic Shock
Sepsis and septic shock were diagnosed according to the International Consensus of Sepsis-Version 3 (Sepsis −3.0).10
Methods
The results of complete blood count, biochemistry, coagulation function and inflammation index at admission of all patients were recorded. First, the clinical and laboratory data of the survival group and death group were compared, and the risk factors related to the 28-day mortality of sepsis patients were screened. Then, the risk factors were further determined by univariate and multivariate logistic regression analysis. The ROC curve was used to assess its predictive value for the 28-day mortality rate on the admission of patients. The Kaplan-Meier curve was drawn for grouping patients according to the cutoff value to compare the 28-day mortality rate between groups. To further screen patients who have the results of organ function-related indicators, cytokines and lymphocyte subsets count simultaneously and analyze the correlation between APACHE, SOFA, and RDW with cytokines and lymphocyte subsets.
Patients with dynamic cytokine data were divided into high and low groups based on the cutoff values of APACHE II, SOFA, and RDW and the dynamic changes in cytokines of survival and death patients in the high and low groups.
Laboratory Instruments and Reagent
The complete blood count and CRP were detected using a 6800-plus (Mindray, China) automatic blood cell analyzer and supporting reagents. The AU5800 automated biochemical analyzer (Beckman Coulter, USA) and supporting reagents detected biochemical indicators. The coagulation function was detected using the STAGO STA-R Max (Stago, France) automatic coagulation analyzer and supporting reagents. PCT was detected using the Roche Infinity (Roche Diagnostics, Germany) electrochemiluminescence Analyzer and its supporting reagents.
Measurement of cytokine levels (IL-2, IL-4, IL-6, IL-10, TNF- α and IFN- γ) and lymphocyte subsets using flow cytometry (FACS Canto TM II, BD, New Jersey, USA). The percentage of lymphocyte subsets was calculated using BD FACSCanto clinical software and BD FACSDiva software.
Statistical Processing
R (4.0.2) was used for data analysis and drawing. The continuous variables were expressed as m (P25–P75), and the Mann–Whitney U-test was used to compare groups. The ROC curve was used to analyze the predictive value of indicators for the 28-day mortality rate of sepsis patients. The Kaplan-Meier correlation coefficient of survival analysis was used to compare the 28-day mortality rate of sepsis patients in different groups on admission. Spearman correlation analysis was used to compare the correlation between death risk factors and other laboratory indicators. P<0.05 indicated a statistical difference.
Results
Comparison of Baseline Characteristics on Admission of Sepsis Patients Between Survival Group and Death Group
The proportion of septic shock, respiratory failure, ventilator use, and CRRT in the death group was higher than that in the survival group (P<0.05), and the APACHE II and SOFA scores were also higher in the death group (P < 0.05). Among the laboratory indexes, RDW, PDW, ALT, AST and Crea were higher in the death group, while PLT, eGFR, TP and TC were lower (P<0.05). There was no statistical difference in sex, age, underlying disease and inflammation index between groups (Table 1).
 |
Table 1 Baseline Characteristics and Laboratory Indexes Comparison of Sepsis Patients Between the Survival Group and Death Group |
Screening of Risk Factors for 28-Day Mortality in Sepsis Patients
Univariate and multivariate logistic regression analysis showed that APACHEII score, SOFA score, and RDW were the risk factors for 28-day mortality in sepsis patients (Table 2).
 |
Table 2 Risk Factors for 28-Day Mortality in Sepsis Patients |
Predictive Value of APACHE II Score, SOFA Score and RDW for the 28-Day Mortality Rate in Sepsis Patients
The ROC curve showed that the area under the curve (AUC) of the APACHE II score predicting the 28-day mortality rate in sepsis patients was 0.763, the cutoff value was 18.5, and the sensitivity and specificity were 79.2% and 65.8%, respectively. The AUC of the SOFA score was 0.806, and the cutoff value was 11.5, with a sensitivity of 68.8% and specificity of 89.9%. The AUC of RDW was 0.723, the cutoff value was 13.8, and the sensitivity and specificity were 75.0% and 68.4%, respectively. The combined AUC of APACHE II, SOFA, and RDW is 0.873, with a sensitivity of 89.6% and a specificity of 82.3% (Figure 2).
 |
Figure 2 The ROC curve of APACHE II, SOFA score, and RDW predict the 28-day mortality rate in sepsis patients on admission. (A) ROC curve of APACHE II score predicting the 28-day mortality rate of sepsis patients on admission; (B) ROC curve of SOFA score predicting the 28-day mortality rate of sepsis patients on admission; (C) ROC curve of RDW predicting the 28-day mortality rate of sepsis patients on admission; (D) ROC curve of combined of APACHE II score, SOFA score, and RDW in predicting 28-day mortality rate in sepsis patients. |
Comparison of Survival Curves Between High and Low APACHE II, SOFA Scores, and RDW Groups
Patients were divided into two groups according to the cutoff value of APACHE II, SOFA score and RDW. The survival curve shows that the mortality rate of patients with APACHE II≥18.5 at 28 days after admission is 58.5%, while that of patients with APACHE II<18.5 is 16.1%. The 28-day mortality rate was 80.5% in patients with SOFA≥11.5, while that was 17.4% in patients with SOFA<11.5. The 28-day mortality rate was 59.0% for patients with RDW≥13.8 and 18.2% for patients with RDW<13.8 (Figure 3).
 |
Figure 3 Comparison of 28-day mortality rates among sepsis patients in different APACHE II, SOFA scores, and RDW groups. (A) 28-day survival curve for sepsis patients with APACHE II ≥ 18.5 and APACHE II<18.5 on admission. (B) 28-day survival curve for sepsis patients with SOFA ≥ 11.5 and SOFA<11.5 on admission. (C) 28-day survival curve for sepsis patients with RDW ≥ 13.8 and RDW<13.8 on admission. |
Correlation of APACHE II, SOFA Scores and RDW with Other Laboratory Indexes Between Survival and Death Groups
The APACHE II score in the survival group was positively correlated with PCT and Crea and negatively correlated with eGFR. The APACHE II score in the death group was positively correlated with IL-2 and IL-10 and negatively correlated with WBC, neutrophil, D-D, eGFR, and CD3+ lymphocyte ratios.
SOFA score in the survival group was positively correlated with PCT and Crea. In the death group, SOFA scores positively correlated with CK, IL-2, IL-6, and IL-10 and negatively correlated with PLT, TP, eGFR, and CD3+ lymphocyte ratio.
In the survival group, RDW was positively correlated with AST, LDH, IL-2, and CD3+ lymphocyte ratio and negatively correlated with TP, Alb, and CD19+ lymphocyte count and percentage. In the death group, RDW was positively correlated with PLT, TNF-α, CD3+ lymphocyte count and CD8+ lymphocyte count and negatively associated with AST, IL-6 and IL-10 (Figure 4).
 |
Figure 4 Correlation between APACHE II, SOFA, and RDW with other laboratory indicators in sepsis patients in the survival and death groups. (A) Survival group; (B) Death group. |
Comparisons of Cytokines and Lymphocyte Subsets Between High and Low APACHE II, SOFA, and RDW Subgroups of Surviving and Dead Patients
According to the trend difference of the heat map, the count and proportion of cytokines and lymphocyte subsets in dead patients were higher than in surviving patients.
Among the surviving patients, the number of lymphocyte subsets was higher in the high APACHE II group than in the low APACHE II group, but no significant trend difference was observed in cytokine expression. The levels of IL-10, TNF-α and IFN-γ in the high RDW group were higher than those in the low RDW group, and no significant trend differences were observed in other indicators. There was no significant trend difference between the high and low SOFA groups.
Among the dead patients, the cytokine expression in the high APACHE II group was higher than that in the low APACHE II group, but no significant trend difference was observed in each lymphocyte subset between the groups. Patients with high SOFA had higher cytokine expression than those in the low SOFA group, while the lymphocyte subset count had an opposite expression trend. The cytokine expressions and lymphocyte subset count in patients with high RDW were higher than those in the low RDW group (Figure 5).
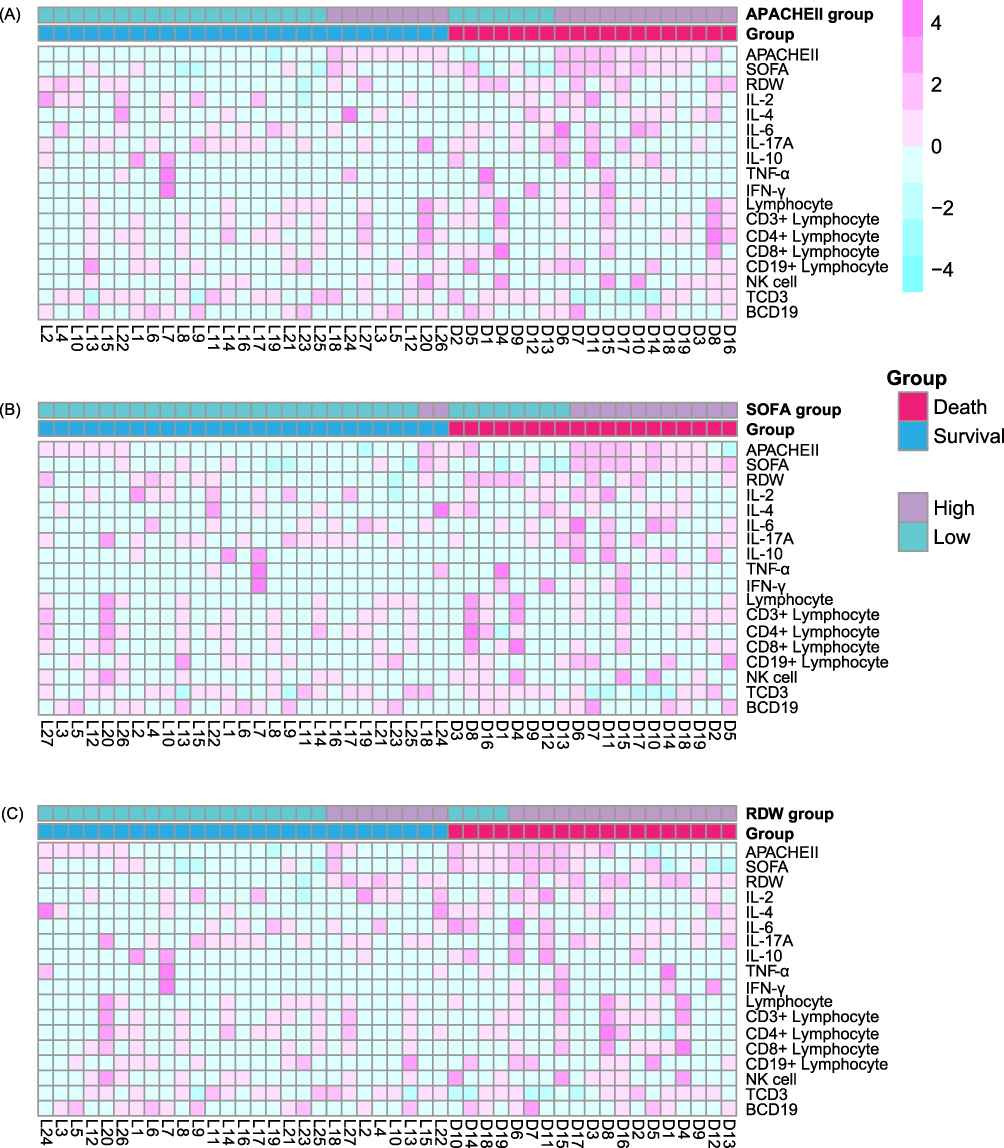 |
Figure 5 Comparison of cytokines and lymphocyte subset counts between high and low APACHE II, SOFA, and RDW groups in the survival and death patients. (A) Comparison between high and low APACHEII groups; (B) Comparison between high and low SOFA groups; (C) Comparison between high and low RDW groups. |
Dynamic Change of Cytokines Between High and Low APACHE II, SOFA, and RDW Subgroups of Surviving and Dead Patients
The trend of cytokine changes in survival and death patients in different APACHE II and SOFA groups was similar but different from those in RDW groups.
Among patients in the high APACHE II and SOFA group, dead patients had higher IL-2, IL-6, and IL-10 values in the first week of sepsis diagnosis, while surviving patients had higher IL-4 levels three weeks after sepsis diagnosis.
Dead patients in the high RDW group showed higher levels of IL-6, IL-17A, IL-10, and IFN-γ values on the first day of confirmed sepsis, with consistently high IFN-γ within two weeks after diagnosis. Survival patients had higher IL-2 and lower IL-6 IL-10 levels within four weeks after diagnosis (Figure 6).
 |
Figure 6 Dynamic change of cytokines between high and low APACHE II, SOFA, and RDW subgroups of surviving and dead patients. |
Discussion
This study found that high APACHE II, SOFA, and RDW on admission were risk factors for the 28-day mortality of sepsis patients. If the above indicators are used to independently predict the mortality rate of sepsis patients at 28 days after admission, they either have lower sensitivity or specificity, and the sensitivity and specificity for combined prediction were above 80%. The 28-day mortality rates in sepsis patients with APACHEII≥18.5, SOFA≥11.5, and RDW≥13.8 were 58.5%, 80.5%, and 59.0%, respectively. The elevations of APACHE II, SOFA, and RDW in the deceased patient may be related to immune dysfunction.
Sepsis can arise from various infections, including community and intra-hospital infections, and 80% of patients are community-originated.3 In 2017, sepsis-related mortality accounted for 19.7% of all deaths worldwide.6 The treatment of sepsis is controversial, but it is recognized that early recognition and intervention are of great value in improving the prognosis.11 Therefore, we believe that early recognition of sepsis patients with a high risk of death can also reduce the mortality of patients. In this study, we found that high APACHE II score, SOFA score and RDW at admission were the risk factors for the 28-day mortality of sepsis patients.
The APACHE II score and SOFA score are widely used to monitor the mortality risk of sepsis patients.12 The results of this study showed that the APACHE II score was less specific for predicting the 28-day mortality rate in sepsis patients, while the SOFA score was less sensitive for predicting the mortality rate. Moreover, these two systems involve more clinical and laboratory indexes, especially the SOFA score that needs to be performed on the second day of admission.13 Some particular patients may not be able to measure some indicators, leading to an inability to score or inaccurate scoring. Therefore, routine and easily obtained laboratory parameters were added to the risk factor screening, and the results showed that the RDW value at the time of admission was also a predictor of the 28-day mortality rate in sepsis patients.
RDW is a parameter reflecting the heterogeneity of red blood cell volume. In clinics, RDW is often used for the auxiliary diagnosis of anemia. In recent years, more and more studies have found that RDW plays an essential role in the treatment of cardiovascular diseases,14 venous thromboembolism,15 cancer,16 diabetes,17 and lung disease.18 Studies have shown that a combination of baseline RDW values and increased RDW can predict adverse outcomes in patients with sepsis,19 supporting this study’s results.
The cutoff value, sensitivity, and specificity of APACHE II, SOFA, and RDW at the time of patient admission to predict the 28-day mortality rate in sepsis patients were analyzed in this study alone and in combination. The Kaplan-Meier survival curve showed that the 28-day mortality rate of sepsis patients with APACHE II≥18.5, SOFA≥11.5 and RDW≥13.8 was all above 50% and that of patients with SOFA≥11.5 reached 80.5%. The 28-day mortality rate in sepsis patients with APACHE II<18.5, SOFA<11.5, and RDW<13.8 was less than 20%. Therefore, dynamic changes in APACHE II score, SOFA score and RDW in sepsis patients should be closely monitored, and medical intervention should be actively carried out if the cutoff values of the above indicators are reached.
The factors leading to the patient’s death due to the increased APACHE II score, SOFA score and RDW on admission were also explored in this study. Other previous studies have revealed that cytokines and lymphocyte subsets have a specific correlation with the development of sepsis, in which macrophage polarization plays a vital role in regulating the host immune balance and inflammatory response in sepsis.20 The macrophage polarization can produce two phenotypes with different functions: M1 and M2.21 In the early stage of sepsis, pro-inflammatory factors such as IFN-γ and lipopolysaccharide in the host induced the production of M1-like macrophage polarization, and the number of M1-like macrophages continued to increase and released a large number of inflammatory factors that caused severe inflammatory reactions, such as IL-1, TNF-α and IL-6. In contrast, an excessive increase of M2-like macrophages in late sepsis stimulated the release of large amounts of IL-10, transforming growth factor-β and other immunosuppressive anti-inflammatory cytokines.22 In this study, the parameters with a correlation coefficient above 0.3 and below −0.3 were screened. The results showed that the increases in the above three indicators in the survival group were mainly related to severe infection, nutritional deficiency and organ function impairment. However, the increases in APACHE II score and SOFA score in the death group were associated with the elevation of cytokines such as IL-2, IL-6, and IL-10, while the increases of RDW were related to the elevation of TNF-α, CD3+ lymphocyte count, CD8+ lymphocyte count and the decreases of IL-6 and IL-10. Therefore, we speculate that the increase in APACHE II score, SOFA score and RDW in sepsis patients at admission is related to immune dysfunction. In particular, in the dead patients with high APACHE II score, SOFA score and RDW group, secretion disturbance of cytokines and lymphocyte subsets are more pronounced.
We also tracked the dynamic changes of cytokines in sepsis patients after diagnosis. We found that the changes in various cytokines in different subgroups grouped according to APACHE II score and SOFA score were similar, while the RDW subgroup had a particular change trend. Among patients in different subgroups of APACHE II score and SOFA score, it seems that patients with higher IL-2 and IL-6 levels within one week of onset had a higher risk of death, especially those with high APACHE II score and SOFA score. For patients with low APACHE II score and SOFA scores, their mortality may be related to high levels of IL-4 and IFN- γ within one week of onset. Among RDW subgroups, patients with higher levels of IL-2, IL-6, IL-17A, IL-10, and IFN- γ within one week of onset seem to have higher mortality. Research has shown that the immune response to sepsis is highly variable23 and may change over time or be characterized by sustained inflammation or immunosuppression development.24 In addition, an increase in RDW may reflect chronic inflammation, ultimately leading to changes in iron homeostasis and resistance to erythropoietin. The association between RDW and interleukin-6 has been confirmed in heart failure, and in participants with human immunodeficiency virus infection, RDW is associated with tumor necrosis factor in sepsis patients.25 However, overall, the mechanism by which these biomarkers are associated with sepsis patient mortality is not fully understood. We speculate that sepsis patients with high and low APACHE II scores, SOFA scores, and RDW groups have different cytokine elevation patterns and timing, possibly related to the pathogen, course, severity, and personal immunity of the infection. Therefore, further basic experiments should be designed to explore different monitoring indicators and treatment targets for different subgroups, including patients of different ages and pathogens, to provide early and accurate diagnosis and treatment for sepsis patients and reduce mortality.
This study has four advantages. First, we screened out three indicators that can predict the risk of death of sepsis patients when admitted to the hospital and determined the risk value and risk probability, respectively. At the same time, we also evaluated the performance of the joint prediction of three indicators. Second, RDW was directly obtained from a complete blood count test and had a short turn-around time and easy access. Unlike the APACHE II score and SOFA score, which had many included indicators and were complex to calculate, and there were few missing values, RDW had a high sensitivity in predicting the mortality of 28 days in sepsis and could be used as a rapid screening indicator. Thirdly, we also explored the factors associated with the death of sepsis patients due to the elevated APACHE II score, SOFA score, and RDW at the time of admission. Fourth, we dynamically tracked and compared the dead and surviving sepsis patients’ cytokine and lymphocyte subsets between high and low APACHE II scores, SOFA scores, and RDW groups on admission and during treatment.
This study also has certain limitations. First, it was a retrospective design, and the number of cytokine and lymphocyte subset detection cases in the cohort was small. Second, the clinical and laboratory data analyzed in this study were based on results within 48 hours of admission and were not analyzed for dynamic changes in relevant data.
Conclusion
In summary, the APACHE II score, SOFA score, and RDW at admission can predict the 28-day mortality. Sepsis patients with APACHE II≥18.5, SOFA≥11.5, and RDW≥13.8 have a higher risk of 28-day mortality. The increases in these indicators in dead patients are related to immune dysfunction.
Ethical Approval
The research related to human use has complied with all the relevant national regulations, institutional policies and is in accordance with the tenets of the Helsinki Declaration, and has been approved by the Ethics Committee of Taizhou Hospital in Zhejiang Province. As a retrospective study, this study only collected and analyzed clinical data of patients and did not affect the diagnosis and treatment process and outcomes of patients. Therefore, the Ethics Committee waived informed consent. Researchers will hide all identifiable patient information to avoid disclosing personal privacy.
Acknowledgments
We thank the medical staff of the ICU for the diagnosis and treatment of sepsis patients.
Author Contributions
All authors made a significant contribution to the work reported, whether that is in the conception, study design, execution, acquisition of data, analysis and interpretation, or in all these areas; took part in drafting, revising or critically reviewing the article; gave final approval of the version to be published; have agreed on the journal to which the article has been submitted; and agree to be accountable for all aspects of the work. Jing Wang, Lisha He, and Zhiyan Jin contributed equally to this work and shared the first authorship.
Funding
This work was supported by grants from the Medical Science and Technology Project of Zhejiang Province (2022KY1378, 2021KY1204) and the Scientific Research Foundation of Taizhou Enze Medical Center (Group) (21EZD15, 23EZB08). The funders of the study had no role in study design, data collection, data analysis, data interpretation, or writing of the manuscript.
Disclosure
The authors report no conflicts of interest in this work.
References
1. Kaukonen KM, Bailey M, Pilcher D, et al. Systemic inflammatory response syndrome criteria in defining severe sepsis. New Engl J Med. 2015;372(17):1629–1638. doi:10.1056/NEJMoa1415236
2. Bone RC, Balk RA, Cerra FB, et al. Definitions for sepsis and organ failure and guidelines for the use of innovative therapies in sepsis. The ACCP/SCCM Consensus Conference Committee. American College of Chest Physicians/Society of Critical Care Medicine. Chest. 1992;101(6):1644–1655. doi:10.1378/chest.101.6.1644
3. Cecconi M, Evans L, Levy M, Rhodes A. Sepsis and septic shock. Lancet. 2018;392(10141):75–87. doi:10.1016/S0140-6736(18)30696-2
4. Singer M. The new sepsis consensus definitions (Sepsis-3): the good, the not-so-bad, and the actually-quite-pretty. Intensive Care Med. 2016;42(12):2027–2029. doi:10.1007/s00134-016-4600-4
5. Rhee C, Dantes R, Epstein L, et al. Incidence and trends of sepsis in US Hospitals Using Clinical vs Claims Data, 2009–2014. JAMA. 2017;318(13):1241–1249. doi:10.1001/jama.2017.13836
6. Rudd KE, Johnson SC, Agesa KM, et al. Global, regional, and national sepsis incidence and mortality,1990–2017: analysis for the Global Burden of Disease Study. Lancet. 2020;395(10219):200–211. doi:10.1016/S0140-6736(19)32989-7
7. Nedeva C. Inflammation and cell death of the innate and adaptive immune system during sepsis. Biomolecules. 2021;11(7):1011. doi:10.3390/biom11071011
8. Hensler E, Petros H, Gray CC, Chung CS, Ayala A, Fallon EA. The neonatal innate immune response to sepsis: checkpoint proteins as novel mediators of this response and as possible therapeutic/diagnostic levers. Front Immunol. 2022;13:940930. doi:10.3389/fimmu.2022.940930
9. Rubio I, Osuchowski MF, Shankar-Hari M, et al. Current gaps in sepsis immunology: new opportunities for translational research. Lancet Infect Dis. 2019;19(12):e422–e436. doi:10.1016/S1473-3099(19)30567-5
10. Singer M, Deutschman CS, Seymour CW, et al. The third international consensus definitions for sepsis and septic shock (sepsis-3). JAMA. 2016;315(8):801–810. doi:10.1001/jama.2016.0287
11. Adams R, Henry KE, Sridharan A, et al. Prospective, multi-site study of patient outcomes after implementation of the TREWS machine learning-based early warning system for sepsis. Nature Med. 2022;28(7):1455–1460. doi:10.1038/s41591-022-01894-0
12. Quintairos A, Pilcher D, Salluh JIF. ICU scoring systems. Intensive Care Med. 2023;49(2):223–225. doi:10.1007/s00134-022-06914-8
13. Ferreira FL, Bota DP, Bross A, Mélot C, Vincent JL. Serial evaluation of the SOFA score to predict outcome in critically ill patients. JAMA. 2001;286(14):1754–1758. doi:10.1001/jama.286.14.1754
14. Tajuddin SM, Nalls MA, Zonderman AB, Evans MK. Association of red cell distribution width with all-cause and cardiovascular-specific mortality in African American and white adults: a prospective cohort study. J Transl Med. 2017;15(1):208. doi:10.1186/s12967-017-1313-6
15. Maino A, Abbattista M, Bucciarelli P, et al. Red cell distribution width and the risk of cerebral vein thrombosis: a case-control study. Eur J Internal Med. 2017;38:46–51. doi:10.1016/j.ejim.2016.10.017
16. Pereira-Veiga T, Bravo S, Gómez-Tato A, et al. Red blood cells protein profile is modified in breast cancer patients. Mol Cell Proteomics. 2022;21(12):100435. doi:10.1016/j.mcpro.2022.100435
17. Hong J, Hu X, Liu W, et al. Impact of red cell distribution width and red cell distribution width/albumin ratio on all-cause mortality in patients with type 2 diabetes and foot ulcers: a retrospective cohort study. Cardiovasc Diabetol. 2022;21(1):91. doi:10.1186/s12933-022-01534-4
18. Lan W, Liu E, Sun D, et al. Red cell distribution in critically ill patients with chronic obstructive pulmonary disease. Pulmonology. 2022;2022:1.
19. Kim CH, Park JT, Kim EJ, et al. An increase in red blood cell distribution width from baseline predicts mortality in patients with severe sepsis or septic shock. Critical Care. 2013;17(6):R282. doi:10.1186/cc13145
20. Schappe MS, Szteyn K, Stremska ME, et al. Chanzyme TRPM7 mediates the Ca(2+) influx essential for lipopolysaccharide-induced toll-like receptor 4 endocytosis and macrophage activation. Immunity. 2018;48(1):59–74.e5. doi:10.1016/j.immuni.2017.11.026
21. Arora H, Wilcox SM, Johnson LA, et al. The ATP-binding cassette gene ABCF1 functions as an E2 ubiquitin-conjugating enzyme controlling macrophage polarization to dampen lethal septic shock. Immunity. 2019;50(2):418–431.e6. doi:10.1016/j.immuni.2019.01.014
22. Chen X, Liu Y, Gao Y, et al. The roles of macrophage polarization in the host immune response to sepsis. Int Immunopharmacol. 2021;96:107791. doi:10.1016/j.intimp.2021.107791
23. Hotchkiss RS, Moldawer LL, Opal SM, Reinhart K, Turnbull IR, Vincent JL. Sepsis and septic shock. Nat Rev Dis Primers. 2016;2(1):16045. doi:10.1038/nrdp.2016.45
24. Kaewarpai T, Ekchariyawat P, Phunpang R, et al. Longitudinal profiling of plasma cytokines in melioidosis and their association with mortality: a prospective cohort study. Clin Microbiol Infect. 2020;26(6):783.e1–783.e8. doi:10.1016/j.cmi.2019.10.032
25. Zidar DA, Al-Kindi SG, Liu Y, et al. Association of lymphopenia with risk of mortality among adults in the US general population. JAMA Network Open. 2019;2(12):e1916526. doi:10.1001/jamanetworkopen.2019.16526
 © 2024 The Author(s). This work is published and licensed by Dove Medical Press Limited. The full terms of this license are available at https://www.dovepress.com/terms.php and incorporate the Creative Commons Attribution - Non Commercial (unported, v3.0) License.
By accessing the work you hereby accept the Terms. Non-commercial uses of the work are permitted without any further permission from Dove Medical Press Limited, provided the work is properly attributed. For permission for commercial use of this work, please see paragraphs 4.2 and 5 of our Terms.
© 2024 The Author(s). This work is published and licensed by Dove Medical Press Limited. The full terms of this license are available at https://www.dovepress.com/terms.php and incorporate the Creative Commons Attribution - Non Commercial (unported, v3.0) License.
By accessing the work you hereby accept the Terms. Non-commercial uses of the work are permitted without any further permission from Dove Medical Press Limited, provided the work is properly attributed. For permission for commercial use of this work, please see paragraphs 4.2 and 5 of our Terms.