")
Back to Journals » Journal of Inflammation Research » Volume 17
Identification of VRK1 as a Novel Potential Biomarker for Prognosis and Immunotherapy in Hepatocellular Carcinoma
Authors He X, Zai G, Zhou L, Chen S, Wang G
Received 30 November 2023
Accepted for publication 8 March 2024
Published 14 March 2024 Volume 2024:17 Pages 1671—1683
DOI https://doi.org/10.2147/JIR.S452505
Checked for plagiarism Yes
Review by Single anonymous peer review
Peer reviewer comments 2
Editor who approved publication: Professor Ning Quan
Xiaoyan He,1 Guozhen Zai,1 Lidan Zhou,2 Shengyang Chen,3 Guizhi Wang1
1Department of Pathology, the Fifth Affiliated Hospital of Zhengzhou University, Zhengzhou, Henan, People’s Republic of China; 2Department of Radiology, the Fifth Affiliated Hospital of Zhengzhou University, Zhengzhou, Henan, People’s Republic of China; 3Department of Hepatobiliary Pancreatic Surgery, the Fifth Affiliated Hospital of Zhengzhou University, Zhengzhou, Henan, People’s Republic of China
Correspondence: Guizhi Wang, Email [email protected]
Background: Research has indicated that VRK1 is essential for the tumor cell cycle. However, its prognostic and immunotherapeutic predictive significance has not been documented in hepatocellular carcinoma (HCC).
Methods: The TCGA, ICGC, and GSE14520 datasets were used to investigate VRK1 expression and its predictive significance of survival outcomes. The qRT-PCR and immunohistochemistry (IHC) were used to confirm the findings. The immunotherapeutic response of VRK1 was anticipated by the IMvigor210 cohort. Lastly, the association between immune infiltration, m6A modification, and functional enrichment of differentially expressed genes (DEGs) was investigated in connection to VRK1 expression.
Results: VRK1 expression was markedly elevated on both the mRNA and protein levels in HCC. In HCC patients, a high expression of VRK1 was linked to a poor prognosis. Furthermore, there was a substantial positive correlation seen between increased VRK1 expression and the response rate to anti-PD-L1 immunotherapy. Relationships between VRK1 and m6A-related genes as well as different immune cells were shown by correlation studies. Lastly, enrichment analysis revealed a tight relationship between VRK1 and important biological functions, including DNA replication, cell cycle control, and fatty acid metabolism.
Conclusion: Our research reveals the potential of VRK1 as a novel biomarker for prognosis and immunotherapy response in HCC patients.
Keywords: VRK1, immune infiltration, immunotherapy, m6A, HCC
Introduction
A member of the vaccine-related kinase (VRK) family of serine/threonine protein kinases, VRK1 exhibits unusual activity similar to that of nucleosome kinase, chromatin kinase Mars, or Ser-Thr kinase.1 Through stable and direct interactions with various chromatin proteins implicated in carcinogenesis, VRK1 can take part in biological processes on the cell cycle, apoptosis, and autophagy regulation.2 Research has demonstrated that VRK1 was significantly expressed in a large number of human malignancies and could influence patient prognosis. High VRK1 expression was closely associated with poor prognosis of bladder cancer patients, while down-regulation of VRK1 significantly inhibited bladder cancer cell proliferation.3 The lung squamous cell carcinoma cells’ motility, apoptosis, proliferation, and cell cycle progression were all greatly impacted by the downregulation of VRK1, which implies that VRK1 is a good therapy target.4 By initiating the p53 signaling pathway, luteolin could decrease the expression of VRK1, causing cell proliferation to be inhibited and apoptosis and cell cycle arrest at G2/M in ovarian cancer.5 In HCC, by regulating the amounts of cell cycle regulators linked to the G1/S transition, VRK1 encouraged tumor development.6 Unfortunately, no research has documented a connection between VRK1, immune cell infiltration, and the response to immunotherapy in HCC, which deserves further investigation.
In this study, we explored the expression profiles and potential prognostic value of VRK1 in multiple publicly available datasets and further validated them in clinical samples using qRT-PCR and IHC to systematically investigate the relationship between VRK1 and pathological features and clinical prognosis of HCC patients. In addition, the study evaluated the predictive value of VRK1 expression on immunotherapy response in HCC patients. Finally, the study also explored the correlation between VRK1 expression and immune infiltration and m6A-related genes. These findings provide important insights into the potential significance of VRK1 in HCC.
Methods
Samples Collection
We downloaded the normalized expression data as well as relevant clinical features of HCC and normal samples from The Cancer Genome Atlas-LIHC cohort (TCGA, https://xenabrowser.net/), International Cancer Genome Consortium-LIRI-JP cohort (ICGC, https://dcc.icgc.org/) and Gene Expression Omnibus-GSE14520 (GEO, https://www.ncbi.nlm.nih.gov/geo) databases, respectively. The log2 (FPKM+1) transformation was used to standardize the transcriptome data. The clinical features of these patients are shown in Supplementary Table S1.
2.2 qRT-PCR and Immunohistochemistry (IHC) Assay
The VRK1 mRNA expression was determined in tumor tissues and paracancerous tissues from 50 HCC patients using the qRT-PCR technique, as was previously done.7 The primer synthesized sequences of VRK1 were as follows: forward: 5ʹ-CCTCGTGTAAAAGCAGCTCAA-3ʹ, reverse: 5ʹ- GCCAATGGGTAATCCTACTTTCC-3ʹ. Paraffin-embedded tissues from HCC patients were subjected to independent IHC assays using anti-VRK1 (Proteintech, China). After secondary antibodies were added to the slides, a Leica DM 2500 microscope was used to capture images. The necessary proteins’ immunostaining intensity was assessed and ranked independently by two different observers. A final score was obtained by adding the extent of expression score (no positive cells = 0, <10% = 1, 10–50% = 2, positive staining of >50% = 3) and intensity score (negative = 0, weak = 1, moderate = 2, strong = 3) was used to distinguish between negative (≤4) and positive (>4) expression of VRK1 protein in HCC and paracancerous tissues.
Immune Cell Infiltration Analysis
The infiltration of different kinds of immune cells in tumor microenvironment (TME) employing the CIBERSORT,8 xCELL,9 MCPcounter,10 TIMER databases,11 and single-sample genome enrichment analysis (ssGSEA) algorithm was done to better investigate the variability in HCC.
Immunotherapy Analysis
We examined the variations in the expression of numerous immunomodulatory genes between the VRK1-positive and VRK1-negative subgroups. As there are fewer clinical cohorts of immunotherapy for HCC patients, we further determined the predictive role of VRK1 for immunotherapy using an anti-PD1/PD-L1 inhibitor cohort (IMVigor 210) with considerable richness of transcriptomic data and information on response to immunotherapy. Based on their response to immunotherapy, individuals in the IMvigor 210 cohort were divided into four groups: stable disease (SD), partial response (PR), disease progression (PD), and complete response (CR). We examined the disparities between patients with low and high expression of VRK1 in terms of survival outcomes and responses to anti-PD-L1 immunotherapy. Finally, we also compared the difference in neoantigen burden between the two groups.
Potential Tumor-Sensitive Drug Prediction
In particular, we examined the relationships between VRK1 expression and medications included in the CellMiner database.12 If a medication’s adjusted P-value is less than one in a thousand and its Pearson correlation coefficient is greater than four-tenths, the medication is deemed tumor-sensitive. To show therapeutic sensitivity, the half-maximal inhibitor dose (IC50) of the targeted drug was then estimated using gene expression levels.
The Pathway Richness Analysis
To assess the variation in biological processes between the VRK1-negative and VRK1-positive subgroups in the TGCA cohort, we used Gene Set Variation Analysis (GSVA) and Gene Set Enrichment Analysis (GSEA) with the R package “GSVA” and “ClusterProfiler”, respectively.
Statistical Analysis
All statistical analyses were carried out by R-4.2.1. In the context of quantitative data, variables with non-normal distributions were analyzed for statistical significance using the Wilcoxon rank sum test, while variables with regular distributions were checked for statistical significance using the Student’s t-test. The Benjamini-Hochberg approach was used to adjust the false discovery rate (FDR) for multiple hypothesis testing in all two-sided comparisons with an alpha level of 0.05.
Results
VRK1 Was Highly Elevated in HCC and Linked to Poor Progression
We performed gene expression analysis using RNA sequencing data obtained from the three publicly available datasets and showed that VRK1 was significantly higher in HCC than in normal tissues (Figure 1A). We also evaluated the ability of VRK1 to distinguish cancer from normal samples using ROC curves and found that VRK1 was able to distinguish HCC tissues from the neighboring normal tissues well, with AUC values of 0.878, 0.865, and 0.878, respectively (Figure 1B). In addition, a significant difference in the protein expression of VRK1 in normal tissues and HCC tissues was observed in the Human Protein Atlas database (https://www.proteinatlas.org/) (Figure 1C). The results of the qRT-PCR (Figure 1D) and IHC (Figure 1E) assay in clinical samples were further validated by their consistency with the bioinformatics analysis. Furthermore, the expression of VRK1 was found to be mainly localized in the nucleus by immunofluorescence staining analysis (Figure 1F). Finally, we explored the relationship between VRK1 expression and clinicopathological characteristics of HCC patients and found that VRK1 expression was closely associated with tumor recurrence (Figure 2A), Grade stage (Figure 2B), TNM stage (Figure 2C), T stage (Figure 2D), and Alpha-fetoprotein (AFP) value (Figure 2E), while it was not associated with gender (Figure 2F), cirrhosis (Figure 2G), and microvascular invasion status (Figure 2H). According to the results above, VRK1 was overexpressed in HCC and has a favorable correlation with tumor progression.
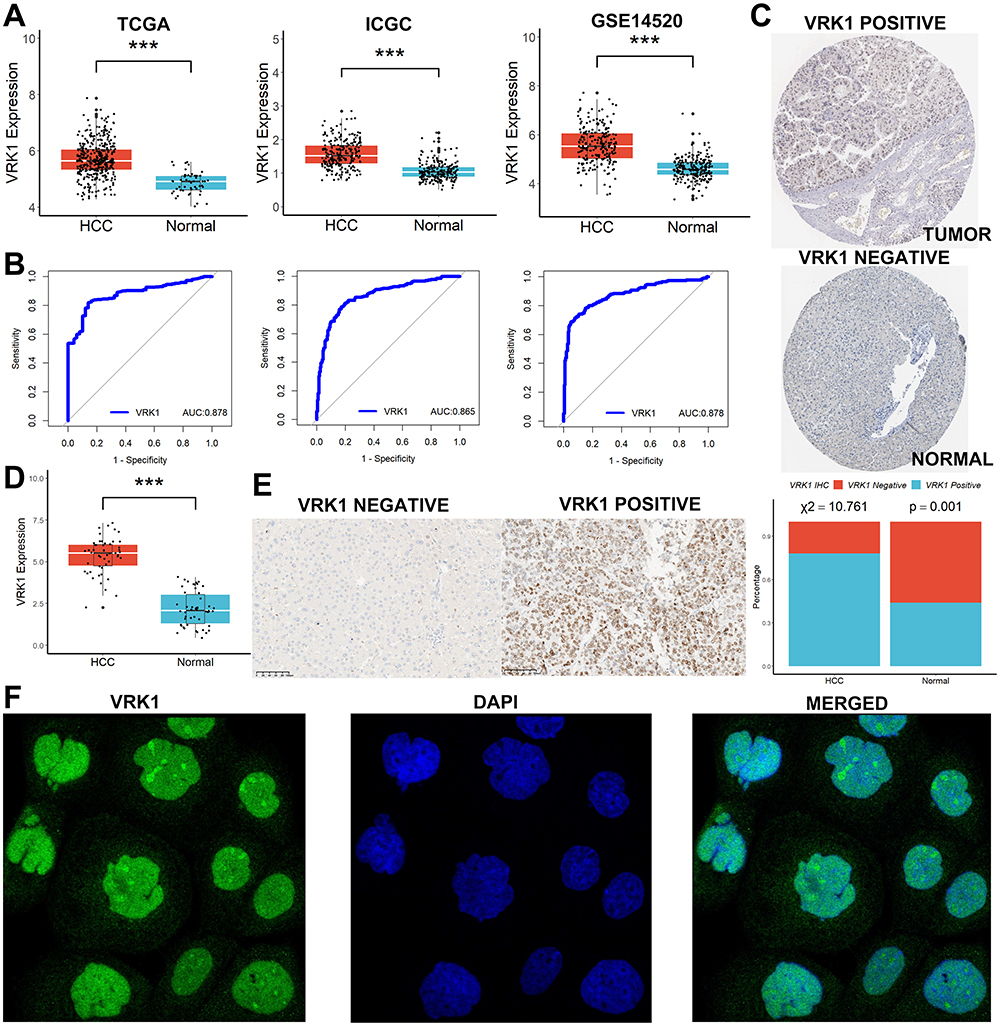 |
Figure 1 VRK1 was highly elevated in HCC. (A) VRK1 was significantly higher in HCC than in normal tissues in the three publicly available datasets. (B) VRK1 was able to distinguish HCC tissues from the neighboring normal tissues well. (C) A significant difference in the protein expression of VRK1 in normal tissues and HCC tissues was observed in the Human Protein Atlas database. (D–E) The results of the qRT-PCR and IHC assay in clinical samples. (F) Immunofluorescence staining analysis. ***p < 0.001. |
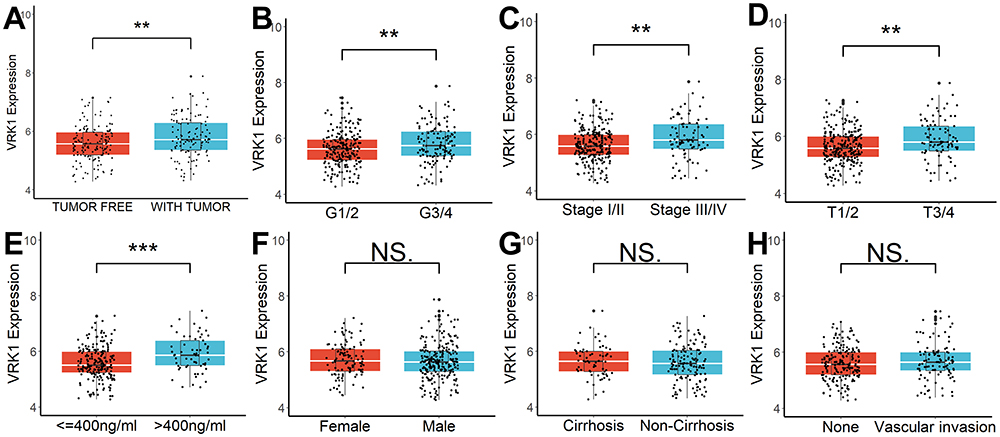 |
Figure 2 VRK1 was linked to poor progression in HCC. (A) VRK1 expression was closely associated with tumor recurrence, (B) Grade stage, (C) TNM stage, (D) T stage, and (E) AFP value, while it was not associated with (F) gender, (G) cirrhosis, and (H) microvascular invasion status. NS, not significant; **p <0.01; ***p < 0.001. |
VRK1 Was a Novel Potential Prognosis Biomarker for HCC
Kaplan-Meier survival analysis demonstrated that high VRK1 expression was strongly associated with poor survival outcomes in HCC patients, and the higher the VRK1 expression, the shorter the survival time of the patients (Figure 3A). Moreover, VRK1 expression was also a good predictor of 1-, 2- and 3-year survival in HCC patients (Figure 3B). Finally, due to the univariate Cox regression analysis (Figure 3C) and multivariate Cox regression analysis (Figure 3D), increased VRK1 was an independent effector of poor prognosis in HCC patients. According to the results above, increased VRK1 was a notable effector in HCC patients who had a poor survival outcome.
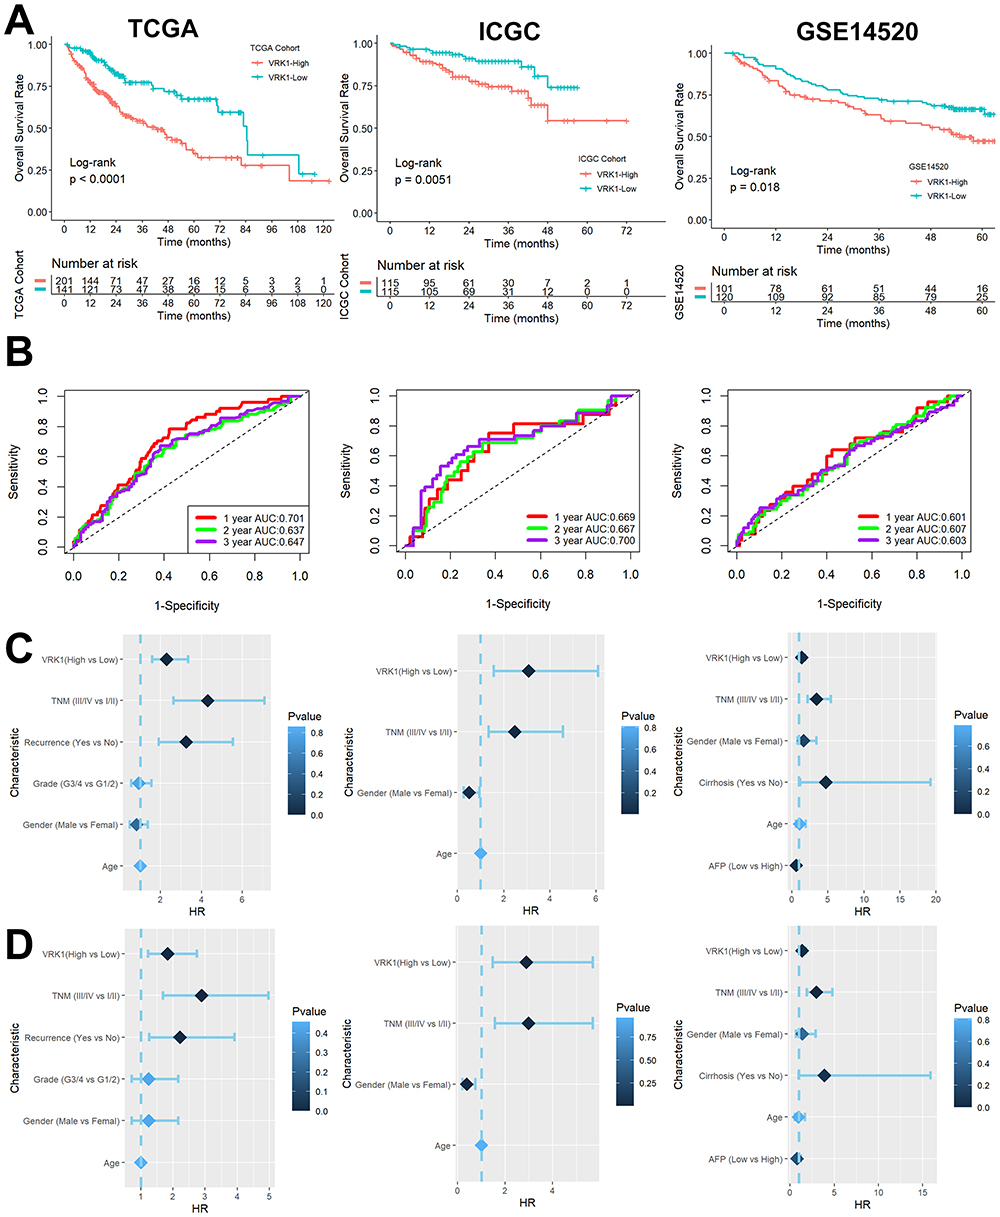 |
Figure 3 VRK1 was a novel potential prognosis biomarker for HCC. (A) Kaplan-Meier survival analysis. (B) VRK1 expression was also a good predictor of 1-, 2- and 3-year survival in HCC patients. (C–D) Univariate Cox regression analysis and multivariate Cox regression analysis. |
Relationship Between VRK1 Expression and TME
The results of TIMER (Figure 4A), MCPcounter (Figure 4B), CIBERSORT (Figure 4C), Xcell (Figure 4D), and ssGSEA (Figure 4E) analyses showed that the infiltration levels of multiple immune cells were also higher in the TME of samples with high VRK1 expression. Furthermore, samples with higher VRK1 tended to have higher major histocompatibility complexes (MHCs) expression than those with lower VRK1 (Figure 4F). Considering that CD8 T cells differed in all five methods, we evaluated their infiltration in HCC clinical samples using IHC and found that the level of CD8 T cell infiltration was significantly higher in VRK1-positive samples than in VRK1-negative samples (Figure 4G). According to the results above, compared to samples with lower VRK1, those with higher VRK1 often exhibited a stronger immune infiltration in TME.
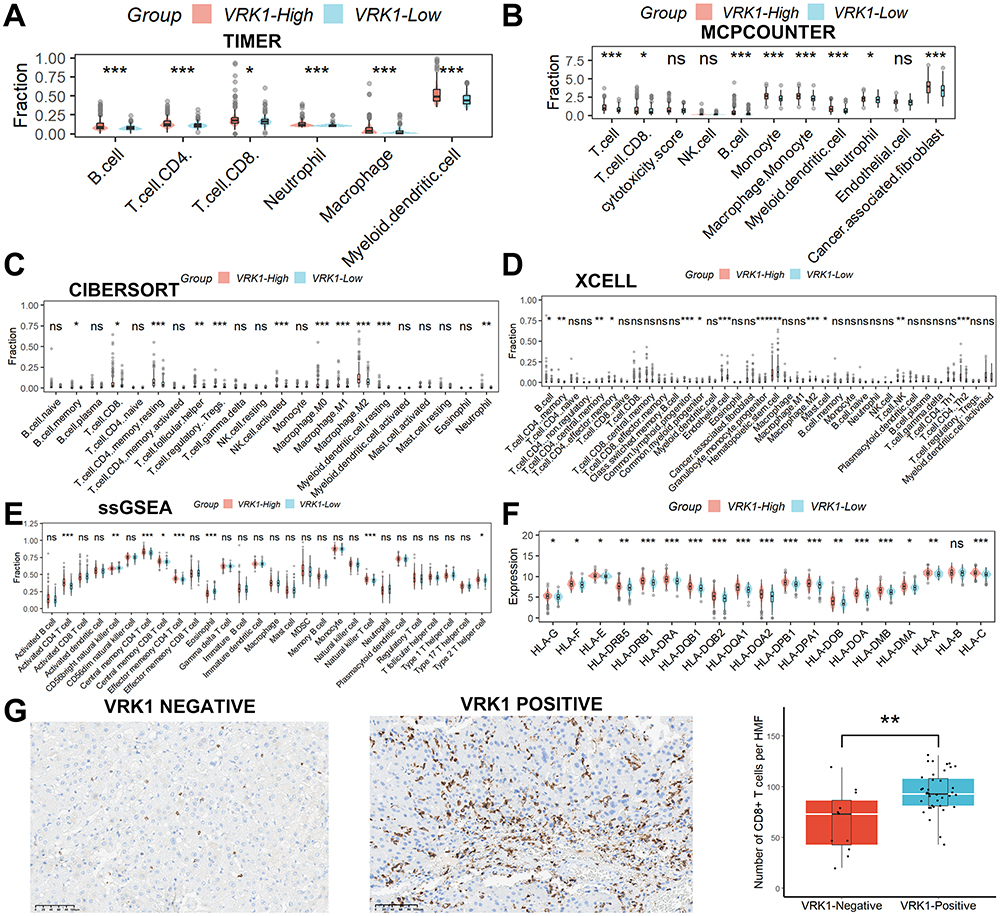 |
Figure 4 Relationship between VRK1 expression and TME. The results of TIMER (A), MCPcounter (B), CIBERSORT (C), Xcell (D), and ssGSEA (E). (F) Samples with higher VRK1 tended to have higher MHCs expression than those with lower VRK1. (G) The level of CD8 T cell infiltration was significantly higher in VRK1-positive samples than in VRK1-negative samples. ns, not significant; *p < 0.05; **p <0.01; ***p < 0.001. |
Relationship Between VRK1 Expression and Immunotherapy Sensitivity
To explore potential sensitivity to immunotherapy, we compared the expression of several immunomodulatory genes, including PD1-related genes, CTLA4-related genes, and other antagonists or agonists of T cell activation-related genes, in samples with high or low VRK1 expression. The results showed that the expression of these genes was upregulated in VRK1 high-expressing samples (Figure 5A–C), suggesting that HCC patients with high VRK1 expression may be more sensitive to immunotherapy. We subsequently validated this speculation in the IMvigor210 cohort. After receiving anti-PD1/PD-L1 therapy, patients with high VRK1 expression had a better prognosis (Figure 5D) and were more likely to respond favorably to anti-PD1/PD-L1 therapy (Figure 5E). In addition, we found that neoantigen burden was also higher in samples with high VRK1 expression (Figure 5F). Finally, we examined the expression levels of PD1 and PD-L1 in 50 clinical HCC samples and found that although there was no correlation between VRK1 and PD1, there was a strong positive correlation between VRK1 and PD-L1 (Figure 5G), and PD1 and PD-L1 expression was higher in VRK1-positive samples compared to VRK1-negative samples (Figure 5H). According to the results above, HCC patients with high VRK1 expression may have better survival outcomes with anti-PD-L1 immunotherapy.
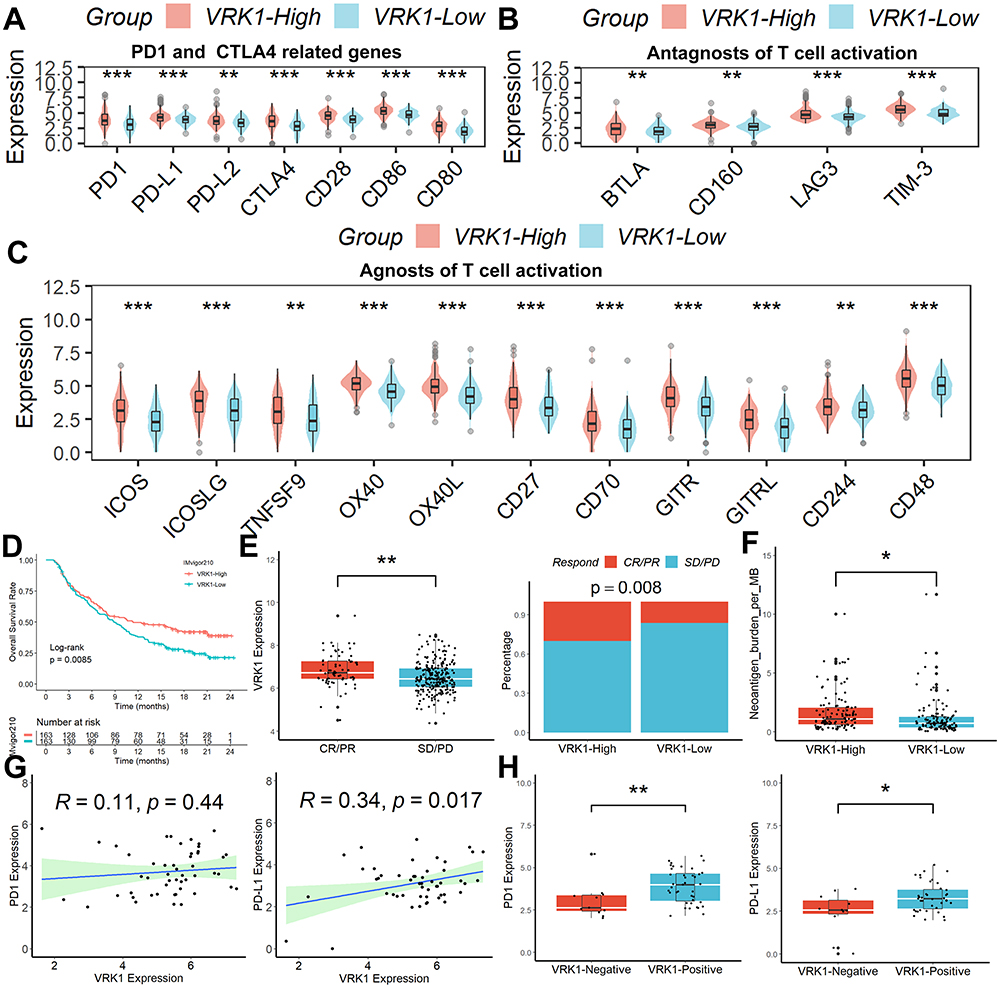 |
Figure 5 Relationship between VRK1 expression and immunotherapy sensitivity. The expression of (A) PD1 and CTLA4-related genes, and other antagonists (B) or agonists of T cell activation-related genes (C) were upregulated in VRK1 high-expressing samples. (D–E) After receiving anti-PD1/PD-L1 therapy, patients with high VRK1 expression had a better prognosis and were more likely to respond favorably to anti-PD1/PD-L1 therapy. (F) Neoantigen burden was also higher in samples with high VRK1 expression. (G) There was a strong positive correlation between VRK1 and PD-L1. (H) PD1 and PD-L1 expression was higher in VRK1-positive samples compared to VRK1-negative samples. *p < 0.05; **p <0.01; ***p < 0.001. |
Prediction of Tumor-Sensitive Drugs Targeting VRK1
Based on the results of CellMiner analysis, we identified six tumor-sensitive drugs (Figure 6A), in which Chelerythrine and Nelarabine were significantly positively correlated with the expression of VRK1, while INK-128, GDC-0349, LY-3023414, and PQR-620 were significantly negatively correlated with the expression of VRK1. Among these six drugs, only the IC50 values of LY-3023414 and PQR-620 were differentiated between the samples with high or low VRK1 expression (Figure 6B). All these suggest that LY-3023414 and PQR-620 may be more effective in antitumor therapy for patients with high VRK1 expression.
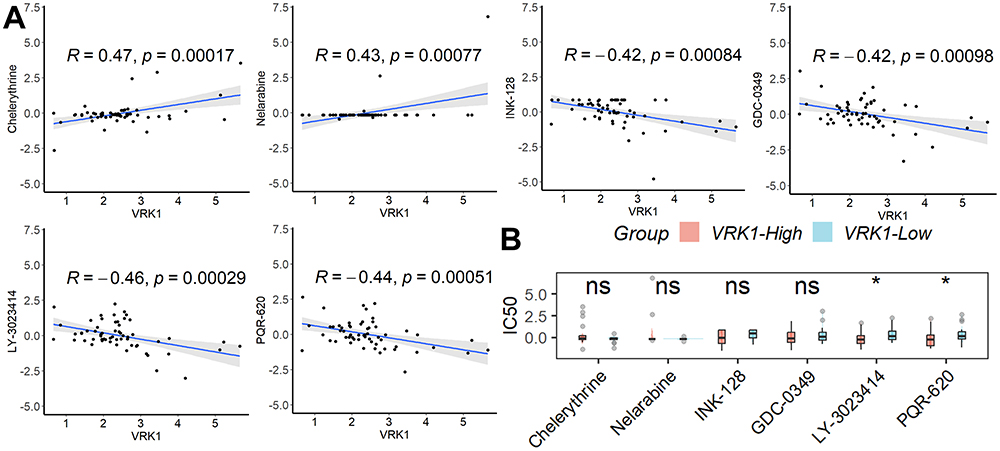 |
Figure 6 Prediction of tumor-sensitive drugs targeting VRK1. (A) Six tumor-sensitive drugs targeting VRK1. (B) Among these six drugs, only the IC50 values of LY-3023414 and PQR-620 were differentiated between the samples with high or low VRK1 expression. ns, not significant; *p < 0.05. |
Relationship Between VRK1 Expression and m6A-Related Genes
Considering that m6A modification plays a crucial role in HCC progression, we analyzed the relationship between the expression of 20 m6A-related genes and VRK1 expression.13 It was found that the expression of these m6A-related genes was not only significantly and positively correlated with VRK1 expression (Figure 7A), but their expression was also significantly elevated in samples with high VRK1 expression (Figure 7B). All these suggest that VRK1 may be involved in the progression of HCC by mediating m6A modifications.
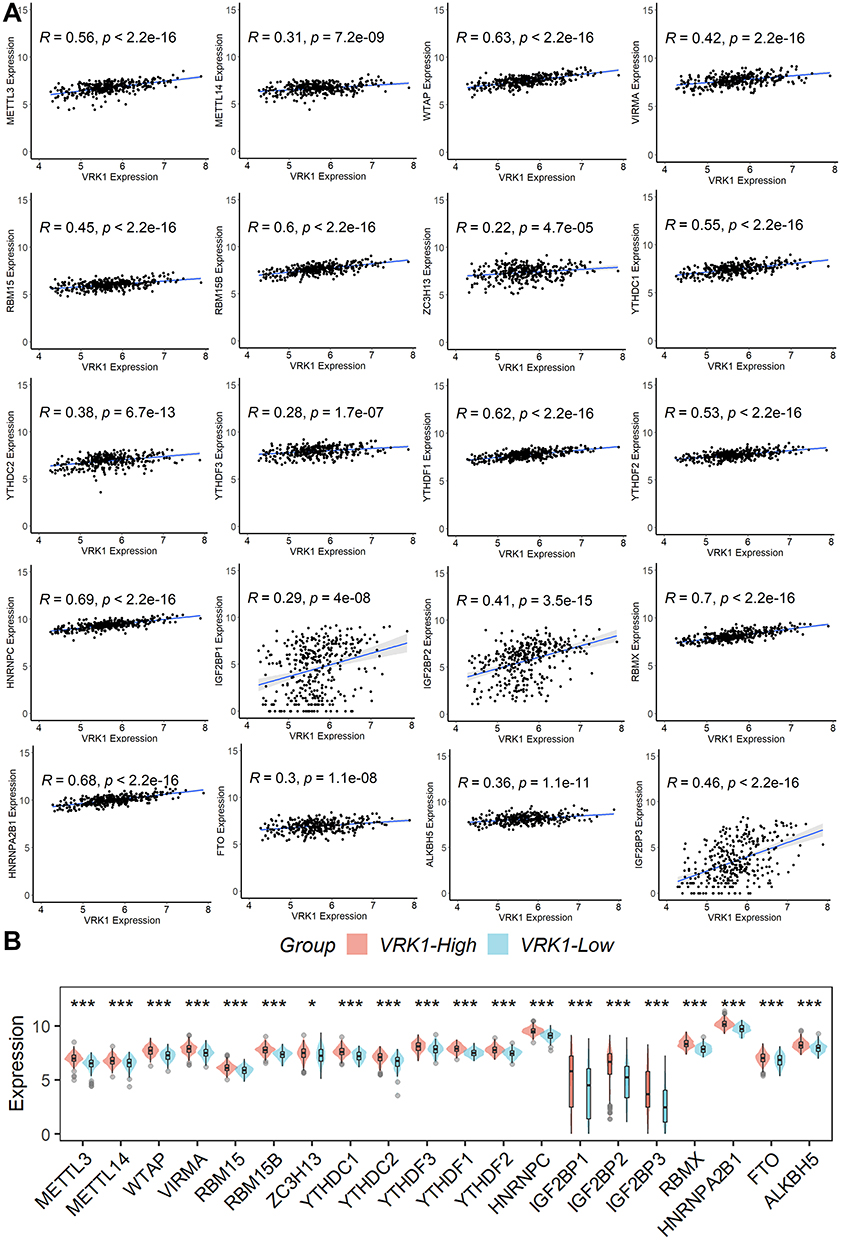 |
Figure 7 Relationship between VRK1 expression and m6A-related genes. (A) The expression of these m6A-related genes was not only significantly and positively correlated with VRK1 expression, (B) but their expression was also significantly elevated in samples with high VRK1 expression. *p < 0.05; ***p < 0.001. |
Prognostic Nomogram Construction
Considering that the TNM stage was also an independent factor influencing the poor prognosis of HCC patients in all three publicly available datasets, we constructed a nomogram including the TNM stage and VRK1 expression to predict the overall survival of HCC patients separately (Figure 8A). Subsequently, we further validated the predictive performance of the nomogram in the three datasets and found that the nomogram predicted well (Figure 8B) and its prediction was better than either the TNM stage or VRK1 (Figure 8C). All these suggest that the nomogram could independently predict survival outcomes of HCC patients very well.
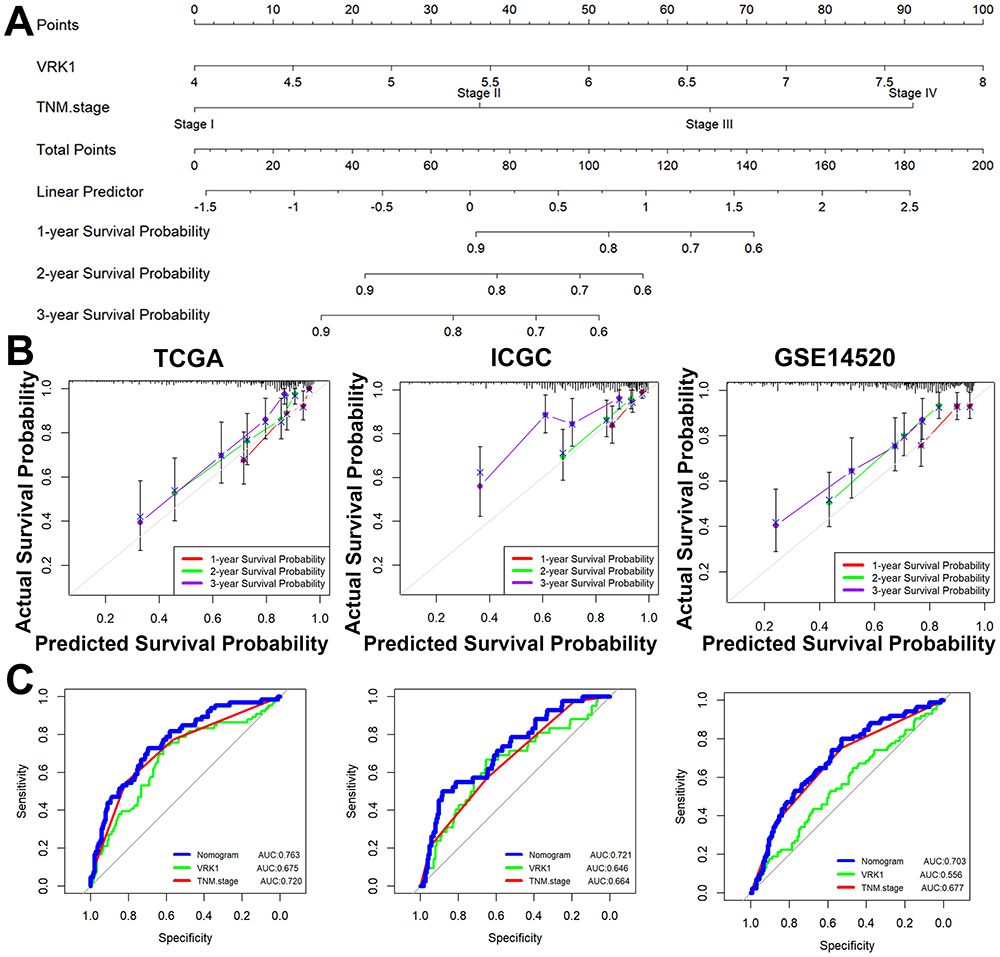 |
Figure 8 Prognostic nomogram construction. (A) We constructed a nomogram including the TNM stage and VRK1 expression to predict the overall survival of HCC patients separately. (B) The nomogram predicted well in the three datasets. (C) The nomogram was better than either the TNM stage or VRK1. |
Function Enrichment Analyses
To explore the potential functions of VRK1, we performed enrichment analysis of DEGs between HCC samples with higher or lower VRK1 expression. A total of 512 up-regulated and 12 down-regulated DEGs were identified at logFC >1 and p < 0.05 (Figure 9A). GSEA analysis revealed that these DEGs were mainly associated with DNA replication, cell cycle control, and fatty acid metabolism (Figure 9B), which was consistent with the results of GSVA analysis (Figure 9C).
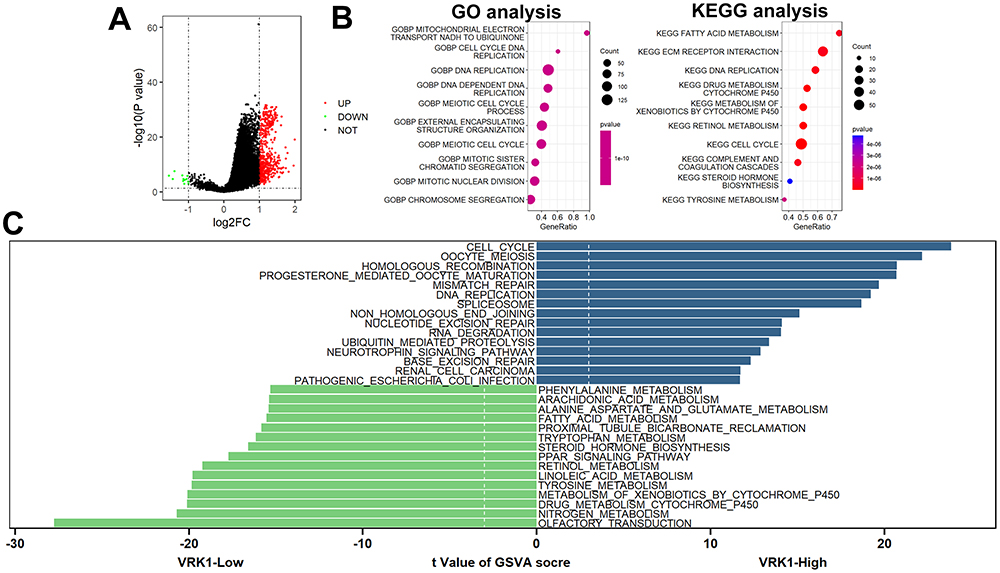 |
Figure 9 Function enrichment analyses. (A) A total of 512 up-regulated and 12 down-regulated DEGs were identified. (B) GSEA analysis. (C) GSVA analysis. |
Discussion
HCC is a main pathological form of liver cancer with a high death rate, poor clinical prognosis, and a propensity for metastasis and recurrence. Immunosuppressive TME is caused by massive interaction between antitumor, stromal, tumor parenchymal, and immunosuppressive cells. This reduces the frequency and function of antitumor cells while increasing that of related pro-tumorigenic cells, which ultimately leads to the spread of malignant tumors.14 Immunotherapy is becoming more and more popular as a cutting-edge treatment option for HCC because of the shortcomings of traditional medicines and the absence of reliable early detection techniques.15 To identify additional important targets and particular biomarkers and to create more efficient early diagnostic and tailored treatment strategies for hepatocellular carcinoma, it is imperative to clarify and comprehend the signaling pathways and molecular processes of cellular crosstalk in TME. This study revealed, for the first time, that there were variations in VRK1 expression not only between tumor and paracancerous tissues described in publicly accessible databases but also in the clinical tissue samples we collected. HCC patients who expressed high levels of VRK1 molecules had a worse prognosis and exhibited a stronger immune infiltration in TME. VRK1 expression was an independent risk factor affecting the prognosis of HCC. Additionally, patients with high expression levels of VRK1 were better candidates for anti-PD-L1 immunotherapy. These findings consistently show how important it may be to use VRK1 to determine the prognosis of HCC.
Immune cells can infiltrate tumor tissues and change their metabolism and function, which can improve immunosuppression and immune evasion.16 Researchers have shown that the existence of many immune cells, including macrophages, T cells, and B cells, within tumor tissues is linked to a poor prognosis in HCC patients.17–21 Our findings demonstrated that VRK1 expression may be associated with the microenvironment. Interestingly, CD8+ T cells often have anti-tumor effects, whereas patients with high VRK1 expression have a poorer prognosis, suggesting that CD8+ T cells infiltrated in our VRK1 high-expression samples are likely to be in a state of exhaustion, and these deserve further experimental validation in future work.
Growing interest has been shown in immunotherapy to stop tumor growth by targeting the TME. The TME expresses several targets linked to immunotherapy, including PDCD1, PD-L1, LAG3, and CTLA4, which makes it easier to treat HCC with immunotherapy. When treating HCC, a range of immune checkpoint drugs that target PD1 and PDL1 are more effective than sorafenib and have a promising future.22,23 At the same time, immunotherapy resistance in HCC is a result of immune system complexity, and one of the biggest unmet challenges in immunotherapy research is the absence of specific biomarkers to predict the impact of immunotherapy in HCC. Therefore, there is an urgent need to explore new biomarkers for accurately predicting the efficacy of immunotherapy in HCC patients. The expression of several immunomodulatory genes was upregulated in VRK1-overexpressing samples, including PD1-related genes, CTLA4-related genes, and other antagonists or agonists of T-cell-activation-related genes, and patients with VRK1-overexpressing patients had a better prognosis in the IMvigor210 cohort, suggesting that patients with VRK1-overexpressing HCC may have a better survival outcome after receiving anti-PD-L1 immunotherapy. Moreover, since m6A-modified genes typically have an oncogenic function in cancer, m6A-related therapies, such as m6A modification modulation or inhibition, may provide promising cancer treatment approaches.24 In this investigation, we discovered a favorable correlation between m6A modification genes and VRK1 expression. Moreover, there was a substantial increase in these m6A modifier genes in HCC samples that had high VRK1 expression. These findings imply that VRK1 may be involved in the prediction of m6A-related treatments for the management of HCC.
Ly3023414, also known as Samotolisib, is a PI3K/mTOR pathway inhibitor that has been used in a variety of clinical antitumor therapies, such as prostate cancer,25,26 endometrial cancer,27 pancreatic adenocarcinoma,28 and skin squamous cell carcinoma cell.29 Unfortunately, Samotolisib has not been reported for antitumor therapy in patients with HCC. Similarly, PQR620 is an mTOR kinase inhibitor that has shown promising anti-tumor activity in non-small cell lung cancer30 and lymphomas.31 In this study, we found that VRK1 was strongly and positively correlated with Samotolisib and PQR620 in the CellMiner database, and the IC50 of Samotolisib and PQR620 was lower in samples with high VRK1 expression, suggesting that HCC patients with high VRK1 expression are more sensitive to Samotolisib or PQR620 treatment, which, of course, needs to be verified by recruiting a certain number of HCC patients for clinical drug trials in the future.
Conclusion
In conclusion, abnormally elevated VRK1 in HCC is associated with the immune microenvironment and may serve as a novel biomarker for predicting the prognosis of HCC patients as well as their response to immunotherapy.
Abbreviations
HCC, hepatocellular carcinoma; IHC, immunohistochemistry; DEGs, differentially expressed genes; TCGA, The Cancer Genome Atlas-LIHC; ICGC, International Cancer Genome Consortium; ssGSEA, single-sample genome enrichment analysis; TME, tumor microenvironment; IC50, half-maximal inhibitor dose; GSVA, Gene Set Variation Analysis; GSEA, Gene Set EnrichmentAnalysis.
Data Sharing Statement
The datasets used and/or analyzed during the current study (TCGA-LIHC, ICGC-LIRI-JP, GSE14520, and IMvigor210 cohorts) are available from the corresponding author upon reasonable request.
Ethics Approval and Consent to Participate
This study was supported by the Ethics Committees of The Fifth Affiliated Hospital of Zhengzhou University (KY2024008). Written informed consent was obtained from all patients. All methods were performed following the relevant guidelines and regulations. The manuscript is consistent with the Declaration of Helsinki.
Funding
There is no funding to report.
Disclosure
All authors declare no conflicts of interest in this work.
References
1. Campillo-Marcos I, García-González R, Navarro-Carrasco E, Lazo PA. The human VRK1 chromatin kinase in cancer biology. Cancer Lett. 2021;503:117–128. doi:10.1016/j.canlet.2020.12.032
2. Kim W, Chakraborty G, Kim S, et al. Macro histone H2A1.2 (macroH2A1) protein suppresses mitotic kinase VRK1 during interphase. J Biol Chem. 2012;287(8):5278–5289.
3. Wu J, Li T, Ji H, Chen Z, Zhai B. VRK1 predicts poor prognosis and promotes bladder cancer growth and metastasis in vitro and in vivo. Front Pharmacol. 2022;13:874235. doi:10.3389/fphar.2022.874235
4. Du N, Zhang B, Zhang Y. Downregulation of VRK1 inhibits progression of lung squamous cell carcinoma through DNA damage. Can Respir J. 2023;2023:4533504. doi:10.1155/2023/4533504
5. Chang X, Tamauchi S, Yoshida K, et al. Downregulating vaccinia-related kinase 1 by luteolin suppresses ovarian cancer cell proliferation by activating the p53 signaling pathway. Gynecologic Oncol. 2023;173:31–40. doi:10.1016/j.ygyno.2023.04.003
6. Lee N, Kwon JH, Kim YB, et al. Vaccinia-related kinase 1 promotes hepatocellular carcinoma by controlling the levels of cell cycle regulators associated with G1/S transition. Oncotarget. 2015;6(30):30130–30148. doi:10.18632/oncotarget.4967
7. Zhang G. Regulatory T-cells-related signature for identifying a prognostic subtype of hepatocellular carcinoma with an exhausted tumor microenvironment. Front Immunol. 2022;13:975762. doi:10.3389/fimmu.2022.975762
8. Gentles AJ, Newman AM, Liu CL, et al. The prognostic landscape of genes and infiltrating immune cells across human cancers. Nature Med. 2015;21(8):938–945. doi:10.1038/nm.3909
9. Aran D, Hu Z, Butte AJ. xCell: digitally portraying the tissue cellular heterogeneity landscape. Genome Biol. 2017;18(1):220. doi:10.1186/s13059-017-1349-1
10. Zhu K, Xiaoqiang L, Deng W, Wang G, Fu B. Development and validation of a novel lipid metabolism-related gene prognostic signature and candidate drugs for patients with bladder cancer. Lipids Health Dis. 2021;20(1):146. doi:10.1186/s12944-021-01554-1
11. Li T, Fan J, Wang B, et al. TIMER: a web server for comprehensive analysis of tumor-infiltrating immune cells. Cancer Res. 2017;77(21):e108–e110. doi:10.1158/0008-5472.CAN-17-0307
12. Reinhold WC, Sunshine M, Liu H, et al. CellMiner: a web-based suite of genomic and pharmacologic tools to explore transcript and drug patterns in the NCI-60 cell line set. Cancer Res. 2012;72(14):3499–3511. doi:10.1158/0008-5472.CAN-12-1370
13. Du A, Li S, Zhou Y, et al. M6A-mediated upregulation of circMDK promotes tumorigenesis and acts as a nanotherapeutic target in hepatocellular carcinoma. Mol Cancer. 2022;21(1):109. doi:10.1186/s12943-022-01575-z
14. Liu P, Kong L, Liu Y, Li G, Xie J, Lu X. A key driver to promote HCC: cellular crosstalk in tumor microenvironment. Front Oncol. 2023;13:1135122. doi:10.3389/fonc.2023.1135122
15. Jiang D, Ma X, Zhang X, et al. New techniques: a roadmap for the development of HCC immunotherapy. Front Immunol. 2023;14:1121162. doi:10.3389/fimmu.2023.1121162
16. Wu X, Peng M, Huang B, et al. Immune microenvironment profiles of tumor immune equilibrium and immune escape states of mouse sarcoma. Cancer Lett. 2013;340(1):124–133. doi:10.1016/j.canlet.2013.07.038
17. Song H, Huang XF, Hu SY, Lu LL, Yang XY. The LINC00261/MiR105-5p/SELL axis is involved in dysfunction of B cell and is associated with overall survival in hepatocellular carcinoma. PeerJ. 2022;10:e12588. doi:10.7717/peerj.12588
18. Bai X, Zhou Y, Yokota Y, et al. Adaptive antitumor immune response stimulated by bio-nanoparticle based vaccine and checkpoint blockade. J Exp Clin Cancer Res. 2022;41(1):132. doi:10.1186/s13046-022-02307-3
19. Wang H, Zhang H, Wang Y, et al. Regulatory T-cell and neutrophil extracellular trap interaction contributes to carcinogenesis in non-alcoholic steatohepatitis. J Hepatol. 2021;75(6):1271–1283. doi:10.1016/j.jhep.2021.07.032
20. Pang N, Shi J, Qin L, et al. IL-7 and CCL19-secreting CAR-T cell therapy for tumors with positive glypican-3 or mesothelin. J Hematol Oncol. 2021;14(1):118. doi:10.1186/s13045-021-01128-9
21. Ning WR, Jiang D, Liu XC, et al. Carbonic anhydrase XII mediates the survival and prometastatic functions of macrophages in human hepatocellular carcinoma. J Clin Invest. 2022;132(7). doi:10.1172/JCI153110
22. Yau T, Park JW, Finn RS, et al. Nivolumab versus sorafenib in advanced hepatocellular carcinoma (checkmate 459): a randomised, multicentre, open-label, Phase 3 trial. Lancet Oncol. 2022;23(1):77–90. doi:10.1016/S1470-2045(21)00604-5
23. Finn RS, Qin S, Ikeda M, et al. Atezolizumab plus bevacizumab in unresectable hepatocellular carcinoma. New Engl J Med. 2020;382(20):1894–1905. doi:10.1056/NEJMoa1915745
24. Li D, Li K, Zhang W, et al. The m6A/m5C/m1A regulated gene signature predicts the prognosis and correlates with the immune status of hepatocellular carcinoma. Front Immunol. 2022;13:918140. doi:10.3389/fimmu.2022.918140
25. Choudhury AD. PTEN-PI3K pathway alterations in advanced prostate cancer and clinical implications. Prostate. 2022;82(Suppl 1):S60–s72. doi:10.1002/pros.24372
26. Sweeney CJ, Percent IJ, Babu S, et al. Phase Ib/II study of enzalutamide with samotolisib (LY3023414) or placebo in patients with metastatic castration-resistant prostate cancer. Clin Cancer Res. 2022;28(11):2237–2247. doi:10.1158/1078-0432.CCR-21-2326
27. Rubinstein MM, Hyman DM, Caird I, et al. Phase 2 study of LY3023414 in patients with advanced endometrial cancer harboring activating mutations in the PI3K pathway. Cancer. 2020;126(6):1274–1282. doi:10.1002/cncr.32677
28. Chiorean EG, Picozzi V, Li CP, et al. Efficacy and safety of abemaciclib alone and with PI3K/mTOR inhibitor LY3023414 or galunisertib versus chemotherapy in previously treated metastatic pancreatic adenocarcinoma: a randomized controlled trial. Cancer Med. 2023;12(20):20353–20364. doi:10.1002/cam4.6621
29. Zou Y, Ge M, Wang X. Targeting PI3K-AKT-mTOR by LY3023414 inhibits human skin squamous cell carcinoma cell growth in vitro and in vivo. Biochem Biophys Res Commun. 2017;490(2):385–392. doi:10.1016/j.bbrc.2017.06.052
30. Zha JH, Xia YC, Ye CL, et al. The anti-non-small cell lung cancer cell activity by a mtor kinase inhibitor PQR620. Front Oncol. 2021;11:669518. doi:10.3389/fonc.2021.669518
31. Tarantelli C, Gaudio E, Hillmann P, et al. The novel TORC1/2 kinase inhibitor PQR620 has anti-tumor activity in lymphomas as a single agent and in combination with venetoclax. Cancers. 2019;11(6):775. doi:10.3390/cancers11060775
 © 2024 The Author(s). This work is published and licensed by Dove Medical Press Limited. The full terms of this license are available at https://www.dovepress.com/terms.php and incorporate the Creative Commons Attribution - Non Commercial (unported, v3.0) License.
By accessing the work you hereby accept the Terms. Non-commercial uses of the work are permitted without any further permission from Dove Medical Press Limited, provided the work is properly attributed. For permission for commercial use of this work, please see paragraphs 4.2 and 5 of our Terms.
© 2024 The Author(s). This work is published and licensed by Dove Medical Press Limited. The full terms of this license are available at https://www.dovepress.com/terms.php and incorporate the Creative Commons Attribution - Non Commercial (unported, v3.0) License.
By accessing the work you hereby accept the Terms. Non-commercial uses of the work are permitted without any further permission from Dove Medical Press Limited, provided the work is properly attributed. For permission for commercial use of this work, please see paragraphs 4.2 and 5 of our Terms.