")
Back to Journals » Neuropsychiatric Disease and Treatment » Volume 20
Identification and Analysis of ZIC-Related Genes in Cerebellum of Autism Spectrum Disorders
Authors Li H, Cui J, Hu C, Li H, Luo X, Hao Y
Received 14 November 2023
Accepted for publication 9 February 2024
Published 22 February 2024 Volume 2024:20 Pages 325—339
DOI https://doi.org/10.2147/NDT.S444138
Checked for plagiarism Yes
Review by Single anonymous peer review
Peer reviewer comments 4
Editor who approved publication: Dr Yuping Ning
Heli Li,1,* Jinru Cui,1,* Cong Hu,1 Hao Li,2 Xiaoping Luo,3 Yan Hao1
1Division of Child Healthcare, Department of Pediatrics, Tongji Hospital, Tongji Medical College, Huazhong University of Science and Technology, Wuhan, 430030, People’s Republic of China; 2Tongji Medical College, Huazhong University of Science and Technology, Wuhan, 430030, People’s Republic of China; 3Department of Pediatrics, Tongji Hospital, Tongji Medical College, Huazhong University of Science and Technology, Wuhan, 430030, People’s Republic of China
*These authors contributed equally to this work
Correspondence: Yan Hao, Email [email protected]
Objective: Autism spectrum disorder (ASD) is a complex neurodevelopmental disorder with significant genetic heterogeneity. The ZIC gene family can regulate neurodevelopment, especially in the cerebellum, and has been implicated in ASD-like behaviors in mice. We performed bioinformatic analysis to identify the ZIC gene family in the ASD cerebellum.
Methods: We explored the roles of ZIC family genes in ASD by investigating (i) the association of ZIC genes with ASD risk genes from the Simons Foundation Autism Research Initiative (SFARI) database and ZIC genes in the brain regions of the Human Protein Atlas (HPA) database; (ii) co-expressed gene networks of genes positively and negatively correlated with ZIC1, ZIC2, and ZIC3, Kyoto Encyclopedia of Genes and Genomes (KEGG) pathway enrichment, and receiver operating characteristic (ROC) curve analysis of genes in these networks; and (iii) the relationship between ZIC1, ZIC2, ZIC3, and their related genes with cerebellar immune cells and stromal cells in ASD patients.
Results: (i) ZIC1, ZIC2, and ZIC3 were associated with neurodevelopmental disorders and risk genes related to ASD in the human cerebellum and (ii) ZIC1, ZIC2, and ZIC3 were highly expressed in the cerebellum, which may play a pathogenic role by affecting neuronal development and the cerebellar internal environment in patients with ASD, including immune cells, astrocytes, and endothelial cells. (iii) OLFM3, SLC27A4, GRB2, TMED1, NR2F1, and STRBP are closely related to ZIC1, ZIC2, and ZIC3 in ASD cerebellum and have good diagnostic accuracy. (iv) ASD mice in the maternal immune activation model demonstrated that Zic3 and Nr2f1 levels were decreased in the immune-activated cerebellum.
Conclusion: Our study supports the role of ZIC1, ZIC2, and ZIC3 in ASD pathogenesis and provides potential targets for early and accurate prediction of ASD.
Keywords: autism, ZIC1, ZIC2, ZIC3, cerebellum, biomarkers
Introduction
Autism spectrum disorder (ASD) is a spectrum of neurodevelopmental disorders characterized by repetitive and restrictive patterns of behavior, interest, and impairment in social interactions.1 The overall ASD prevalence in 8-year-olds is 1 in 36, as reported by the American Centers for Disease Control and Prevention in 2023, and the diagnosis rate is rising rapidly,2 but little is known about its etiology, risk factors, and disease progression. The heterogeneity of ASDis influenced by factors such as genetic variation, gender, and co-morbidity.3 Among these factors, genetic variation is considered to be the primary contributor. This encompasses single gene disorders, copy number variants (CNVs), inherited and de novo rare variants, as well as common sequence variants.4,5 The variations in these genetic factors result in genetic heterogeneity within the ASD population. However, the genetic etiology and pathogenesis of ASD remain unclear, and efforts are urgently needed to translate genetic research on autism into clinical practice.
Growing research highlights the cerebellum as a pathological region of the brain in patients.6–8 The development of the human cerebellum begins at the seventh gestational week, and the cerebellum can grow until late childhood.9 The long-time window of cerebellar maturation results in the developing cerebellum being exposed to more genetic and environmental risk factors.7 A recent study conducted a genome-wide association study (GWAS) on 33,265 individuals identified single nucleotide polymorphisms associated with the reduced cerebellar volume and increased ASD risk.10 Numerous mouse studies have linked abnormal gene expression in the cerebellum to ASD-like behavior. For example, POGZ-deficient mice with abnormal sociability, learning, and motor behaviors exhibit significantly upregulated gene expression in the cerebellum.11 JUN and PDGFRA are upregulated in the cerebellum and are associated with ASD-like behaviors.12
ZIC family proteins, include ZIC 1–5, have impact on multiple processes in neural network wiring, including neuronal migration, axon guidance, and terminal refinement.13 The ZIC family of genes are becoming promising candidates for ASD due to their significant role in regulating cerebellum development. ZIC gene expression initiates prior to the formation of the cerebellar primordium during early neurodevelopment and exhibits dynamic patterns of expression,14 that coordinate cerebellar development.15–17 For example, heterozygous deletions containing the ZIC1 locus have been found in a subset of individuals with Dandy-Walker malformation (DWM), which is a common cerebellar birth defect.16 According to clinical case reports, ASD is a common complication of DWM.18 ZIC gene expression profiling findings in multiple animal models indicate that ZIC proteins are involved in multiple behavioral abnormalities.19 ZIC1 and ZIC3 mutant mice exhibit hypotonia and reduced motor activity.14,19 ZIC2 hypomorphic mutant mice exhibit behavioral abnormalities, such as cognitive impairment, defects in sensorimotor gating, and social behavior,20 which are common symptoms of ASD.1 Additionally, it is worth noting that ZIC2 and ZIC3 can also act as co-factors, binding to proteins from the lymphatic enhancer family and inhibiting Wnt signaling.21
Here, we performed a network-based bioinformatics analysis to analyze the roles of ZIC family genes in ASD patients. Next, we identified the expression of ZIC family genes and related hub genes in the cerebellum of ASD mice. Our study provides candidate genes for the diagnosis of ASD and is of great significance for further exploring the pathogenic role of ZIC family genes in ASD.
Materials and Methods
Microarray Source
Gene expression data from microarray studies of ASD were downloaded from the Gene Expression Omnibus (GEO) database using the terms “autism” and “cerebellum”. Only two microarray studies using RNA obtained from postmortem cerebellum from autistic and control individuals were selected for analysis. GSE28521 from GPL6883 contained samples from the cerebellum of 10 patients with ASD and 11 typical development controls (TD) from the Autism Tissue Project (ATP, www.brainbank.org/) and the Harvard Brain Bank (http://www.autismtissueprogram.org).22 GSE38322 from GPL10558 contains samples from the cerebellum of 8 ASD patients with ASD and 8 controls from ATP, the Harvard Brain Bank and the National Institute for Child Health and Human Development (NICHD) Brain and Tissue Bank(www.btbank.org).23 GSE142670 from GPL16791 contained samples of induced pluripotent stem cell (iPSC)-derived neural progenitor cells (NPC) (16 clones from six ASD patients and 13 clones from six controls) and iPSC-derived neurons (12 clones from five ASD patients and 11 clones from four controls).24 All autism patients are diagnosed by DSM-IV (the diagnostic and statistical manual of mental disorders, DSM). The microarray results analyzed in this study are presented in Table 1. All datasets were preprocessed using log2 transformation and quantile normalization, and the association of genes with ZIC family genes was analyzed using the R package.
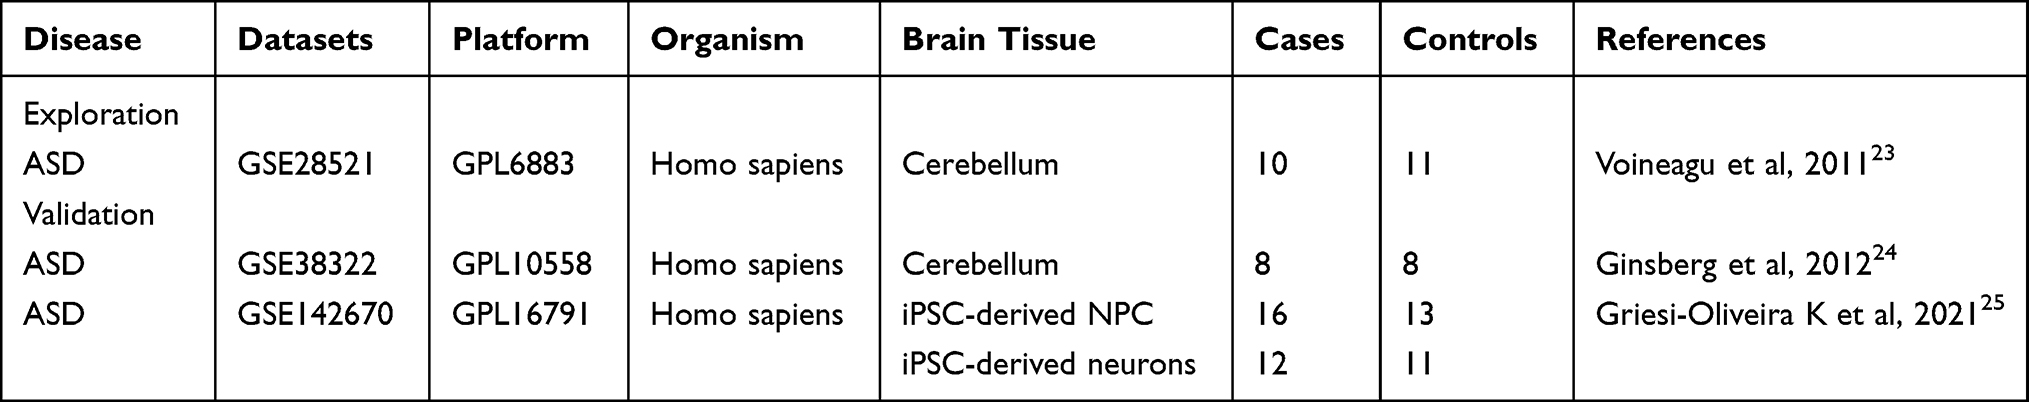 |
Table 1 Gene Expression Datasets Used in This Study |
Network Analysis
Cerebellum network analysis and KEGG pathway enrichment were performed using Network Analyst, a site capable of creating tissue-specific Protein–Protein Interaction Networks (PPI) and gene co-expression networks.25 The depth of a node’s color is positively related to the number of neighbors of the node. Degree of centrality (DC) is the number of connections a node has with other nodes, and betweenness of centrality (BC) measures the number of shortest paths through a node.
SFARI
SFARI Base (http://sfari.org/resources/sfari-base) is a research data repository funded by the Simons Foundation Autism Research Initiative, which contains large-scale behavioral and biological data of autistic individuals. We extracted ASD risk genes from the SFARI database and analyzed the correlation between ZIC family genes and the risk genes.
The Human Protein Atlas (HPA)
The HPA (https://proteinatlas.org/) includes information on human gene expression profiles at various protein levels.26 We investigate the expression patterns of ZIC1-3, OLFM3, SLC27A4, GRB2, TMED1, NR2F1, and STRBP in various brain regions of the GTEx human brain RNA-Seq dataset from HPA.
In silico Immune Cell Type Enrichment Analysis
xCell, a gene signature-based method reliably portraying the cellular heterogeneity landscape of tissue expression profiles, was performed to calculate the immune cell infiltration abundance.27 The R package PerformanceAnalytics was utilized to ascertain the correlation between genes and the infiltration abundance of immune cells.
Mice
Adult C57BL/6 mice, 6–8 weeks, were purchased from HFK Bioscience (Beijing, China) and housed under specific pathogen-free conditions. All animal protocols were approved by the Ethics Committee of Tongji Hospital of Tongji Medical College of Huazhong University of Science and Technology, and the animal experiments were conducted in accordance with the National Institutes of Health Laboratory Animal Care and Use Guidelines (NIH Publication No. 80–23).
Maternal Immune Activation (MIA)
The cerebellar tissue obtained from the offspring of MIA mice was previously identified as ASD.12 Briefly, mice were mated overnight, and females were checked every morning for seminal plugs, recorded as embryonic Day 0.5 (E0.5). On E12.5, pregnant mice were weighed and injected with a single dose of poly(I:C) (20 mg/kg) (#P9582, Sigma). All male offspring from each litter were used for behavior tested at 6 weeks of age, with 3–5 litters used for each treatment group. The open field experiment was used to evaluate the depression-like behavior. Mice were placed in an open field (43.2 × 43.2 cm). The activity and position of each mouse within the open field were measured for 5 minutes. Data were analyzed by the MED Associates’ Activity Monitor Data Analysis software. Social behavior was measured using the three-chambered arena (40 × 60 cm). In Phase 1, the test mouse could explore the whole arena (habituation). The test mouse was allowed to explore the empty cage or the unfamiliar mouse (stranger 1) for 10 minutes in the central chamber during Phase 2. In Phase 3, the stranger 1 was replaced with another unfamiliar mouse (stranger 2) and the stranger 1 was placed in the other cage. Time spent in each chamber and the sniffing zones was recorded by Ethovision XT 10 system (Noldus).
Quantitative Real-Time PCR
Cerebellar tissues of ASD mice were obtained from previously obtained MIA mouse models.12 Total RNA from the entire cerebellum of ASD mice in the MIA model (6 weeks, n = 3) was extracted using TRIzol Reagent (Invitrogen) and cDNA was synthesized using the RevertAid First Strand cDNA Synthesis Kit (Thermo Fisher Scientific). qRT-PCR was performed using a SYBR Green real-time PCR kit (Toyobo, Osaka, Japan) on a LightCycler (Bio-Rad Laboratories, Hercules, CA, USA). The primers used were as follows: 5’-TCTCCACACCTATGGTGCAA-3’ and 5’-CAAGAAACAGGGGAGCTGAG-3’(GAPDH), 5’- TAAATGGATCGAGCCGGAGC −3’ and 5’-CTTGAAGGGCTTCTCCCCTG-3’ (Zic1); 5’-CTCGCAGAACGTGCTCAATG-3’ and 5’-CCGCATGTAGCGGAAAAAGG-3’ (Zic2); 5’-GCAGGGTTCAGGTTATGCCA-3’ and 5’-GCAGGGTTCAGGTTATGCCA-3’ (Zic3); 5’-CTTACACATGCCGTGCCAAC-3’ and 5’-CTTACACATGCCGTGCCAAC-3’ (Nr2f1); and 5’-GAAAGTGGCCAAGGCAAGTG-3’ and 5’-GAAAGTGGCCAAGGCAAGTG-3’ (Strbp).
Statistical Analysis
The values and graphs of the Pearson correlation and ROC curves were obtained using the R software. A p-value <0.05 and | r | >0.3 was considered statistically significant and relevant. Data were presented as means and standard deviations (SDs) or medians and quantiles depending on the distribution of data. qRT-PCR were performed thrice, and representative results are shown.
Results
ZIC1, ZIC2 and ZIC3 Were Related to Neurodevelopmental Disorders and Human ASD Risk Genes in Cerebellum
First, we explored the association between the ZIC family genes with risk genes. As shown in Figure 1A, correlation analysis of ZIC family genes and human ASD risk genes in the SFARI database showed that ZIC1, ZIC2, and ZIC3 were associated with various proven ASD risk genes, such as CTNNB1, TP53, and ESR1. According to gene-disease association analysis, ZIC1, ZIC2, and ZIC3 related genes in the cerebellum were related to a variety of neurodevelopmental disorders, such as autistic disorder, bipolar disorder, schizophrenia, and mental retardation (Figure 1B). According to HPA, ZIC1, ZIC2, and ZIC3 are detectable in all regions of the human brain. Interestingly, ZIC1, ZIC2, and ZIC3 were mainly expressed in the cerebellum, and the expression of ZIC1 in the cerebellum was significantly higher than that of ZIC2 and ZIC3 (Figure 1C). Therefore, we mainly focused on the roles of ZIC1, ZIC2, and ZIC3 in ASD cerebellum.
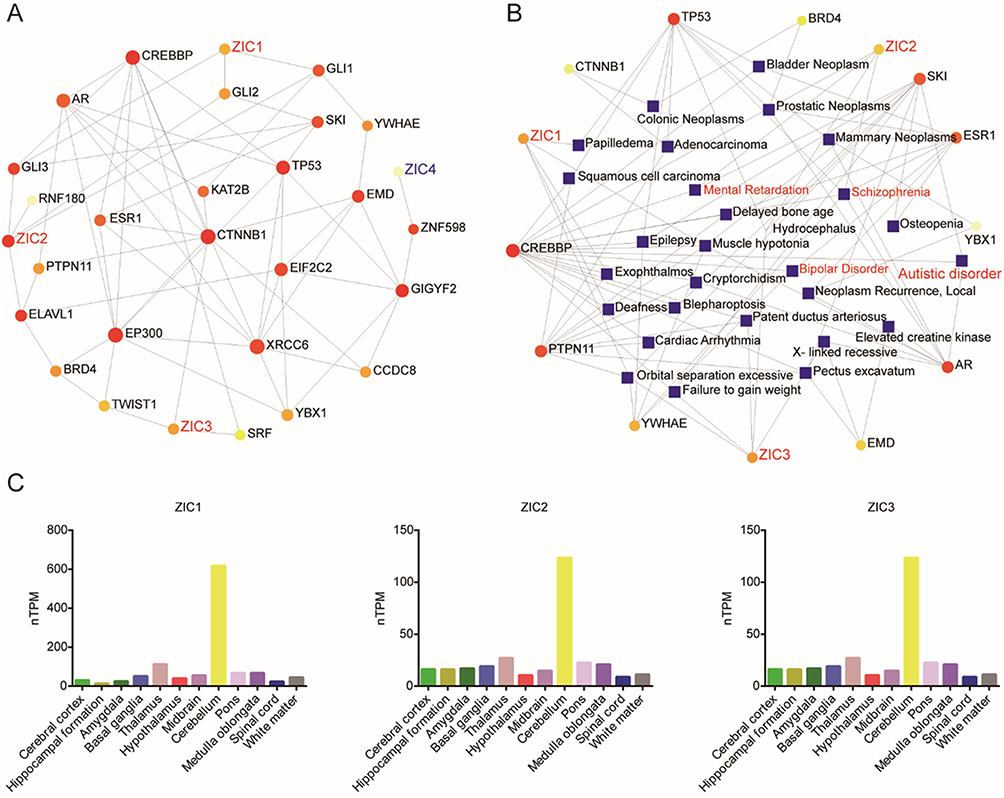 |
Figure 1 ZIC1, ZIC2 and ZIC3 are associated with ASD and highly expressed in the cerebellum. (A) Network of human ASD risk gene network associated with ZIC family genes in the cerebellum. (B) Network of human ASD risk genes associated with ZIC1, ZIC2 and ZIC3 in the cerebellum from the gene-disease association database in NetworkAnalyst. (C) The expression of ZIC1, ZIC2 and ZIC3 in the brain regions of the GTEx human brain RNA-Seq dataset in HPA. |
Networks and KEGG Analysis of Genes Positively and Negatively Associated with ZIC1, ZIC2 and ZIC3
The expression of ZIC1, ZIC2, and ZIC3 occurs during cerebellar development, and their regulation of cerebellar development is similar but also different.13 To explore the biological processes associated with ZIC1, ZIC2, and ZIC3 in the cerebellum of ASD patients, we analyzed all genes that were positively and negatively associated with ZIC1, ZIC2, and ZIC3 in the cerebellum of patients from GSE28521 using NetworkAnalyst. DC and BC indicated that these three genes have distinct positive and negative co-expression networks, respectively. Nodes with higher DC and BC were potential hub genes in the network. The most highly ranked node in the positively associated network of ZIC1 was APP (DC = 127; BC = 7974.5; Figure 2A). The KEGG analysis of the network included Alzheimer’s disease, dopaminergic synapses, and Parkinson’s (Table 2). The most highly ranked node in the network that was negatively associated with ZIC1 was NXF1 (DC = 74; BC = 2685.5; Figure 2A). KEGG analysis of the network included the neurotrophin signaling pathway, ubiquitin-mediated proteolysis, and VEGF signaling pathway (Table 2).
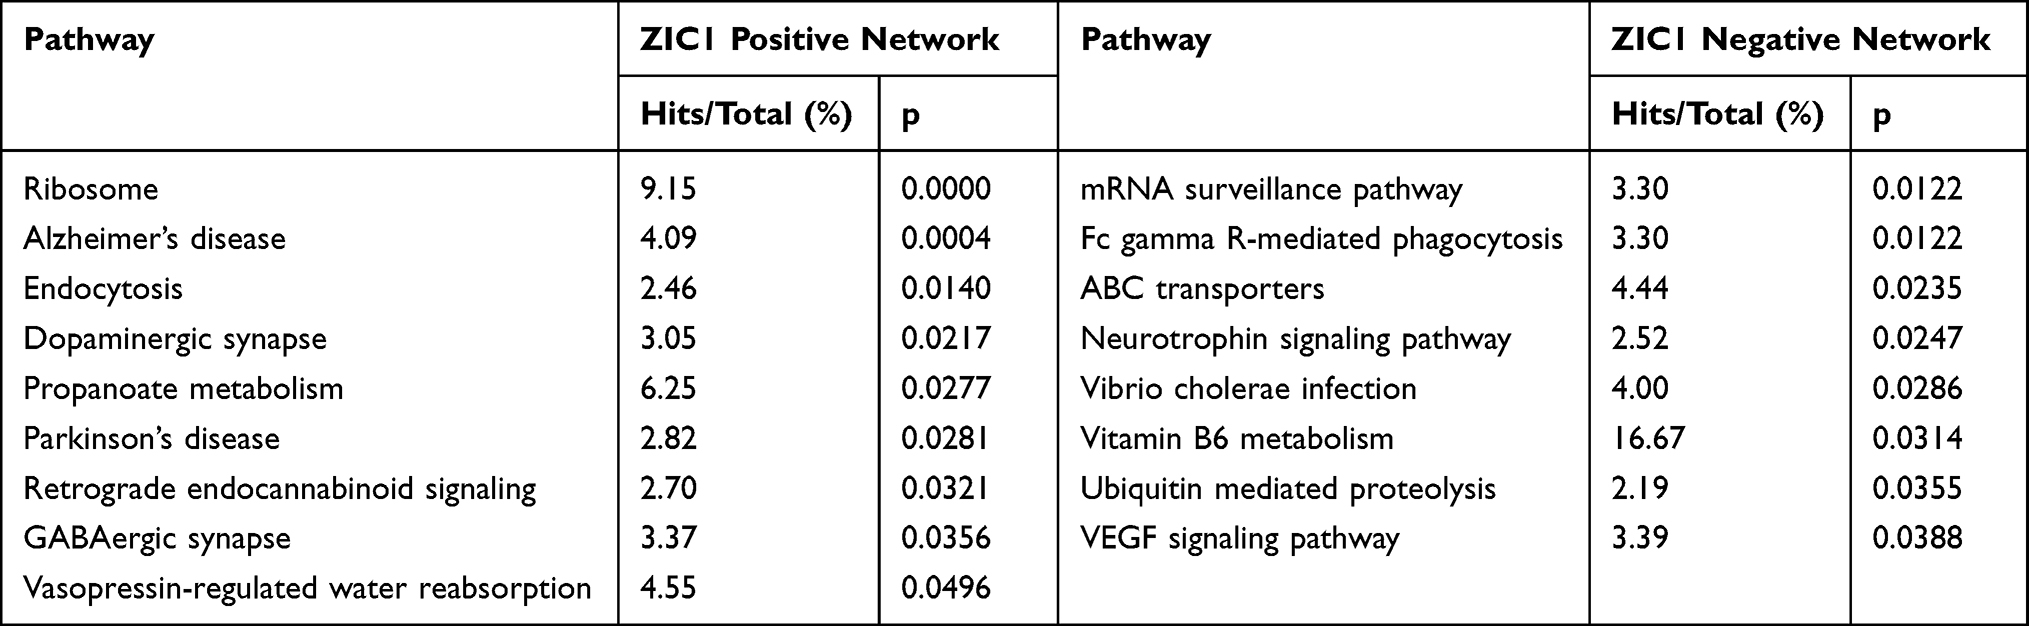 |
Table 2 KEGG Analysis of the Genes Associated with ZIC1 in Cerebellum of GSE28521 |
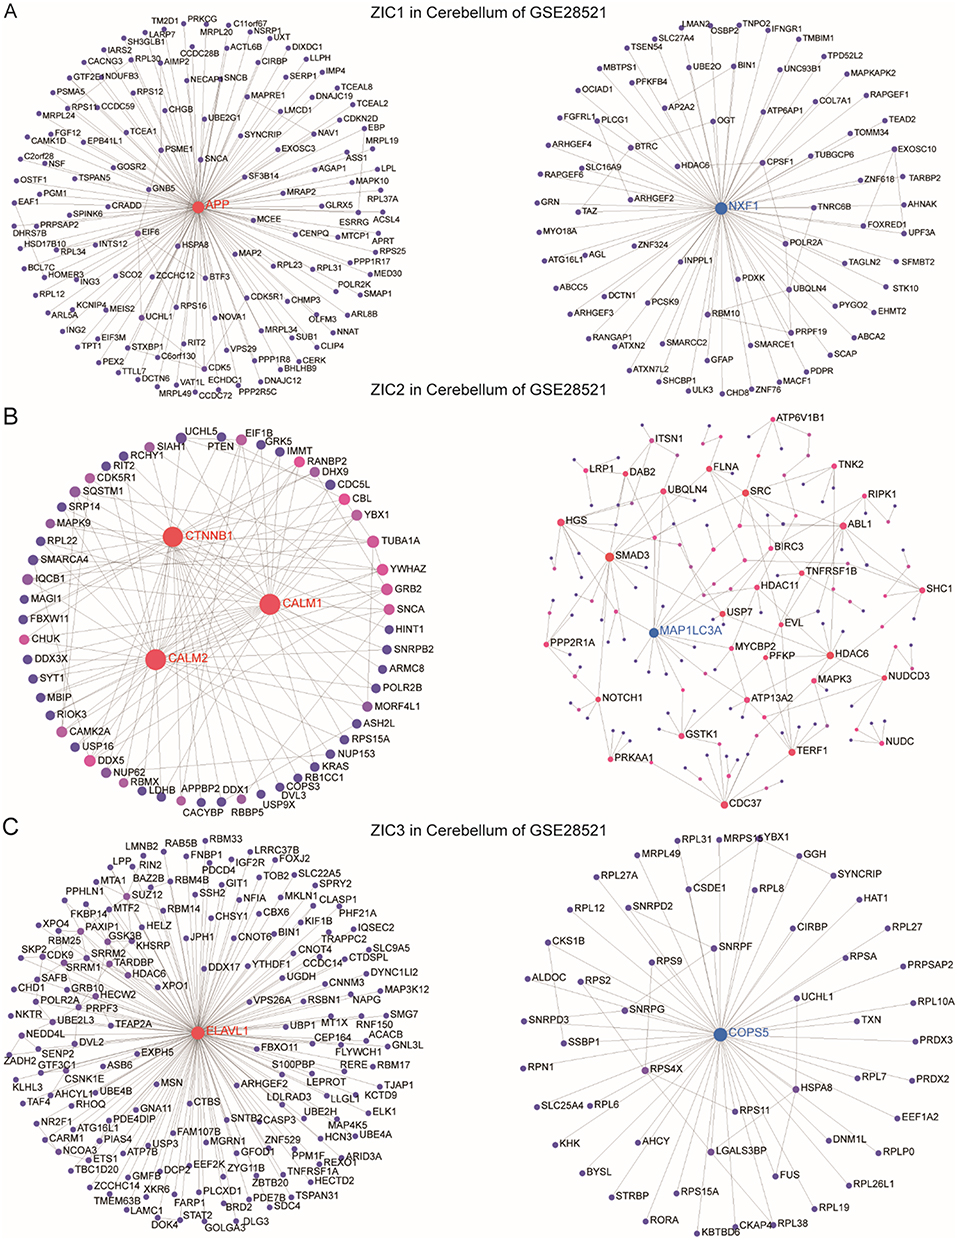 |
Figure 2 Networks of genes positively and negatively associated with ZIC1, ZIC2 and ZIC3. The first up-regulated and the down-regulated network of genes associated with ZIC1 (A), ZIC2 (B) and ZIC3 (C) in the cerebellum of ASD patients. |
The most highly ranked nodes in the positively associated network of ZIC2 were CALM1 (DC = 31; BC = 463.61; Figure 2B) and CALM2 (DC = 31; BC = 463.61), followed by CTNNB1 (DC = 28; BC = 710.81). KEGG analysis of the network included the GnRH, melanogenesis, Wnt, neurotrophin, and ErbB signaling pathways (Table 3). The most highly ranked node in the network negatively associated with ZIC2 was MAP1LC3A (DC = 15; BC = 2082.71; Figure 2B), followed by SMAD3 (DC = 13; BC = 4653.44). KEGG analysis of the network included the ErbB signaling pathway and tight junctions (Table 3).
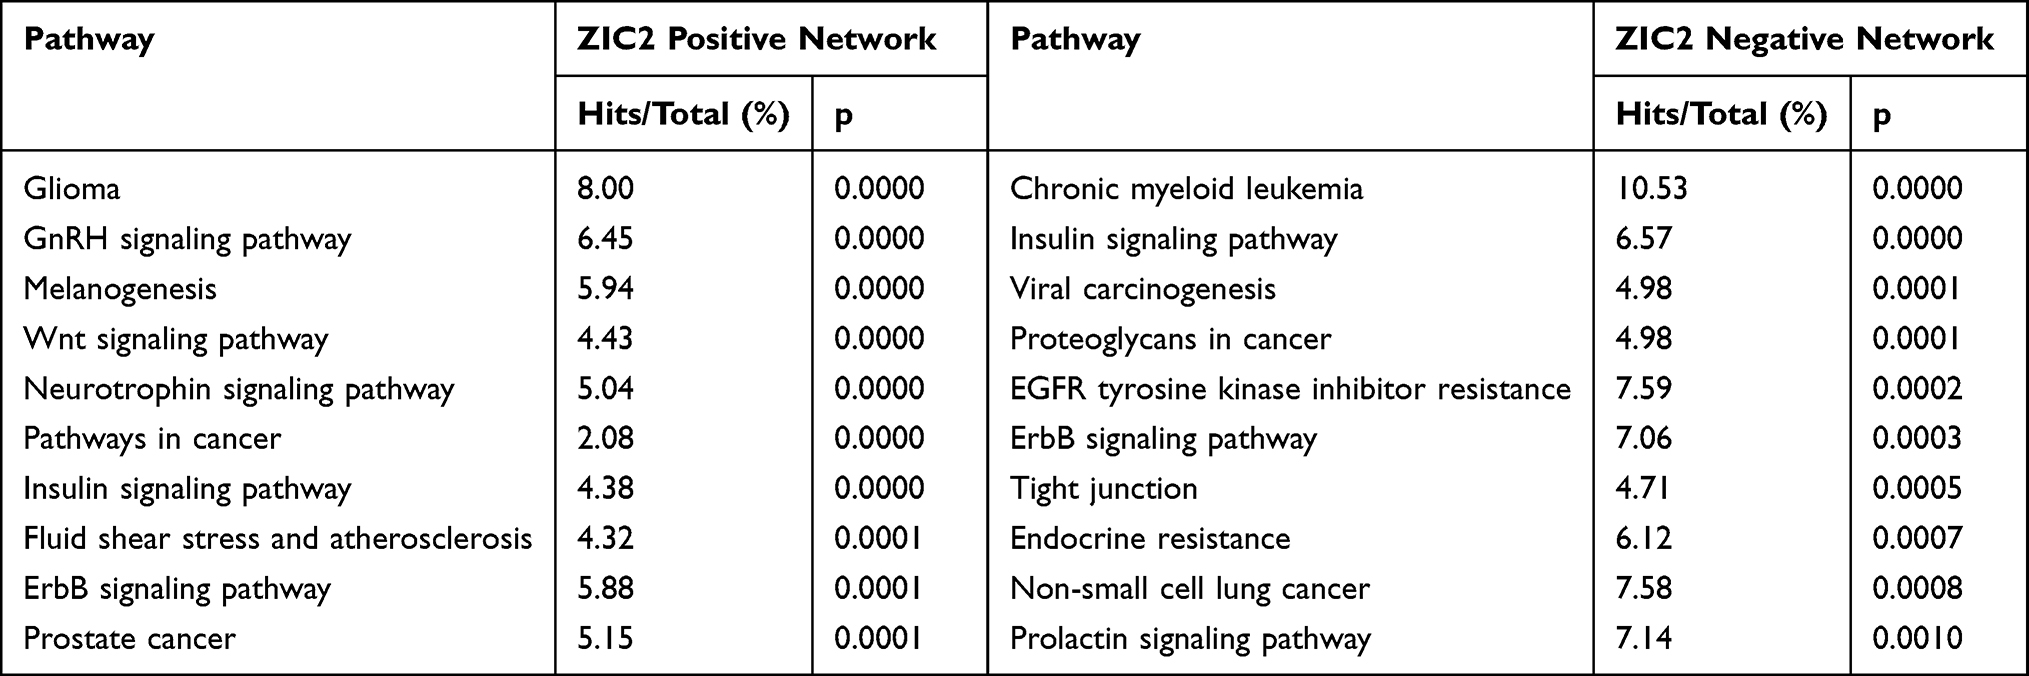 |
Table 3 KEGG Analysis of the Genes Associated with ZIC2 in Cerebellum of GSE28521 |
The most highly ranked node in the positively network of ZIC3 was ELAVL1 (DC = 149, BC = 10,920.67; Figure 2C). KEGG analysis of the network included tight junctions, the mTOR signaling pathway, and the Hippo signaling pathway (Table 4). The most highly ranked node in the negatively associated network of ZIC3 was COPS5(DC = 52; BC = 1304.5; Figure 2C). KEGG analysis of the network revealed folate biosynthesis and circadian rhythms (Table 4). These results indicate that ZIC1, ZIC2, and ZIC3 are involved in important biological processes in the cerebellum of patients with ASD and suggest potential roles for several signaling pathways in which ZIC1, ZIC2, and ZIC3 function as hub genes.
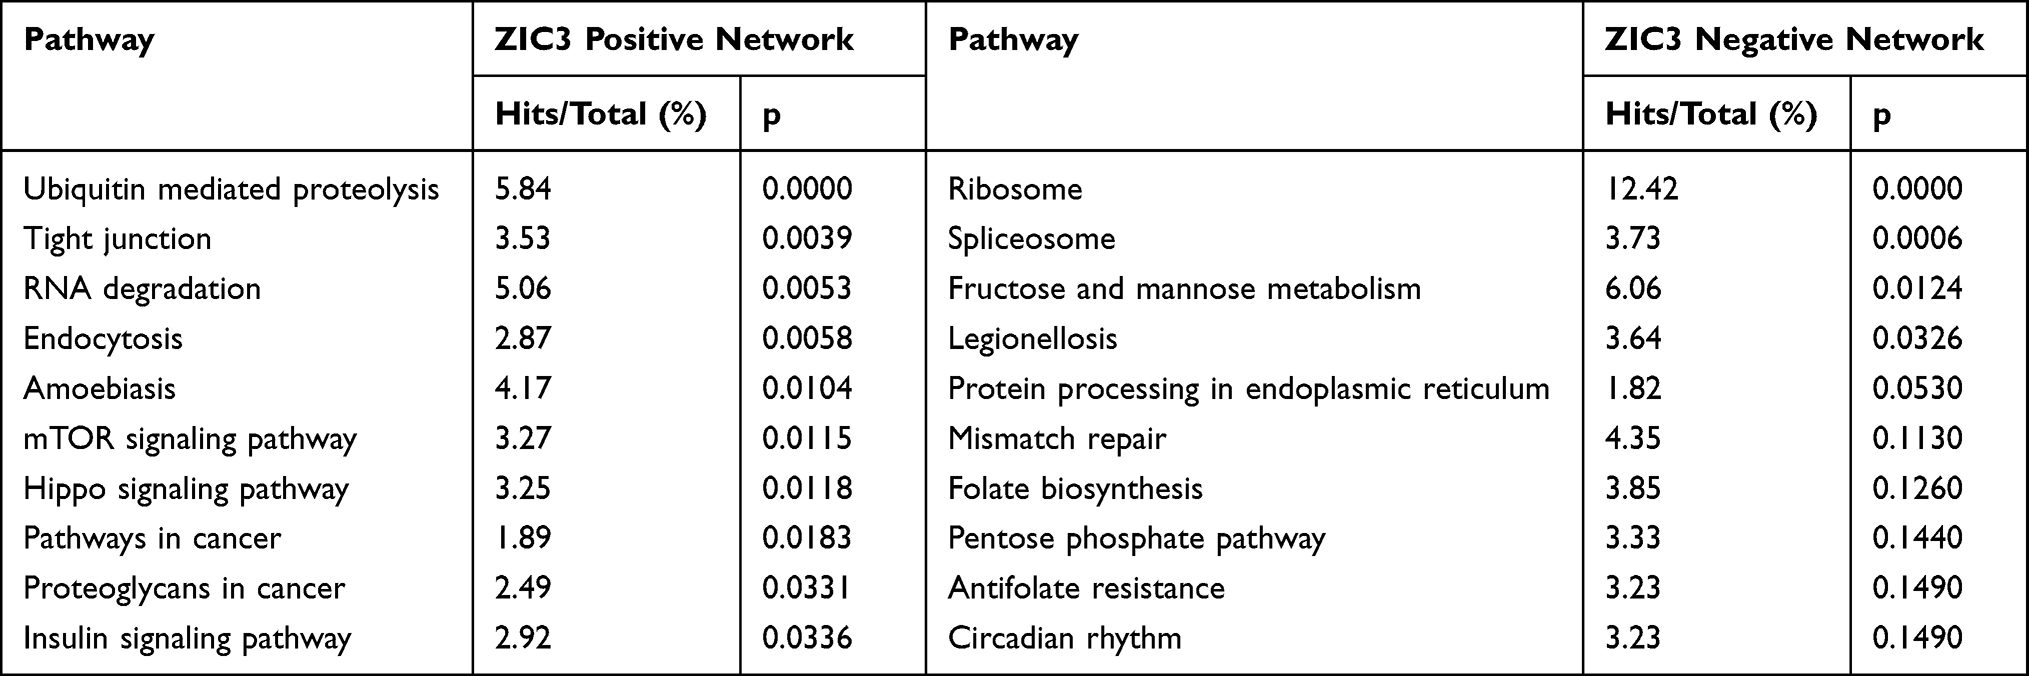 |
Table 4 KEGG Analysis of the Genes Associated with ZIC3 in Cerebellum of GSE28521 |
Evaluation of ZIC1, ZIC2 and ZIC3 Associated Genes in Cerebellum as Biomarkers for ASD
To verify the results acquired from the networks, we performed ROC analysis for all the genes related to ZIC1, ZIC2, and ZIC3. Venn diagrams of the genes with an area under the curve (AUC) > 0.7 and genes positively or negatively associated with ZIC1 (Figure 3A), ZIC2 (Figure 3B), and ZIC3 (Figure 3C) are shown. OLFM3 (AUC = 0.809), SLC27A4 (AUC = 0.709) (Figure 3D), GRB2 (AUC = 0.709), TMED1 (AUC = 0.791) (Figure 3E), NR2F1 (AUC = 0.805), and STRBP (AUC = 0.745) (Figure 3F) exhibiting the highest AUC values within the positive and negative correlation networks of ZIC1, ZIC2, and ZIC3 were selected as the diagnostic biomarkers.
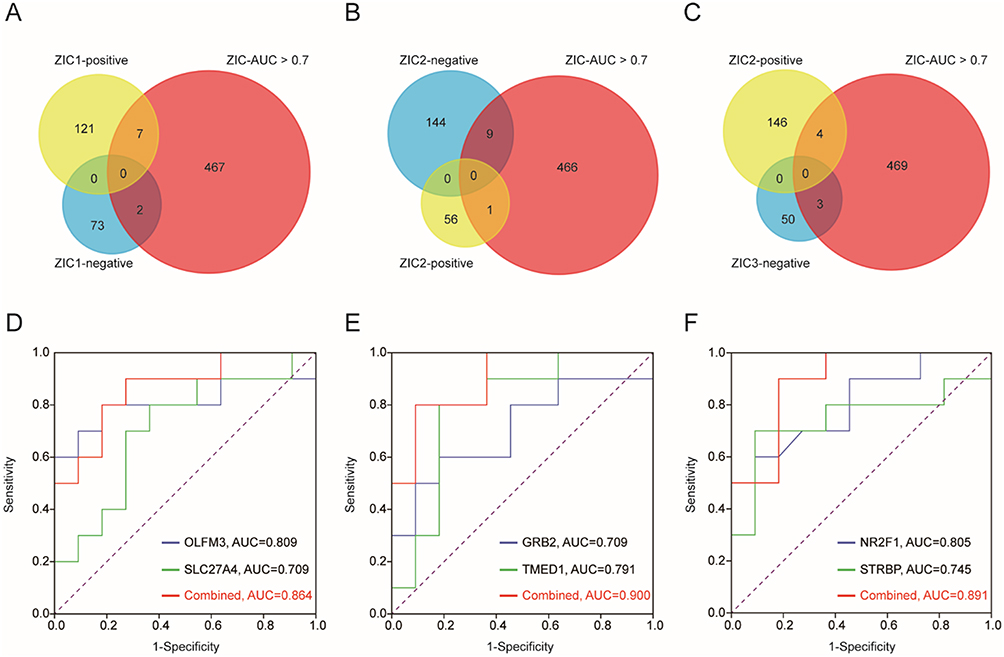 |
Figure 3 Evaluation of ZIC1, ZIC2 and ZIC3 associated genes in cerebellum as biomarkers for ASD. (A) Venn diagrams of the genes with AUC > 0.7 and genes positively or negatively associate with ZIC1 (A), ZIC2 (B) and ZIC3 (C). ROC analysis for OLFM3 and SLC27A4 from ZIC1 networks (D), GRB2 and TMED1 from ZIC2 networks (E), NR2F1 and STRBP from ZIC3 networks (F). |
Validation of ZIC1, ZIC2 and ZIC3 Associated Genes in Cerebellum, NPC and Neurons of ASD Patients
To validate the results obtained from the ROC analysis, we further explored the diagnostic accuracy of OLFM3, SLC27A4, GRB2, TMED1, NR2F1, and STRBP in the cerebellum of ASD patients from GSE38322, and iPSC-derived NPC and neurons of ASD patients from GSE142670. As shown in Figure 4A, ROC analysis for OLFM3 and SLC27A4 resulted in AUC of 0.563 and 0.641, respectively, with a combined AUC value of 0.703. ROC analysis for GRB2 and TMED1 resulted in AUC of 0.750 and 0.469, respectively, with a combined AUC value of 0.750. ROC analysis for NR2F1 and STRBP revealed AUC of 0.734 and 0.594, respectively, and a combined AUC value of 0.781.
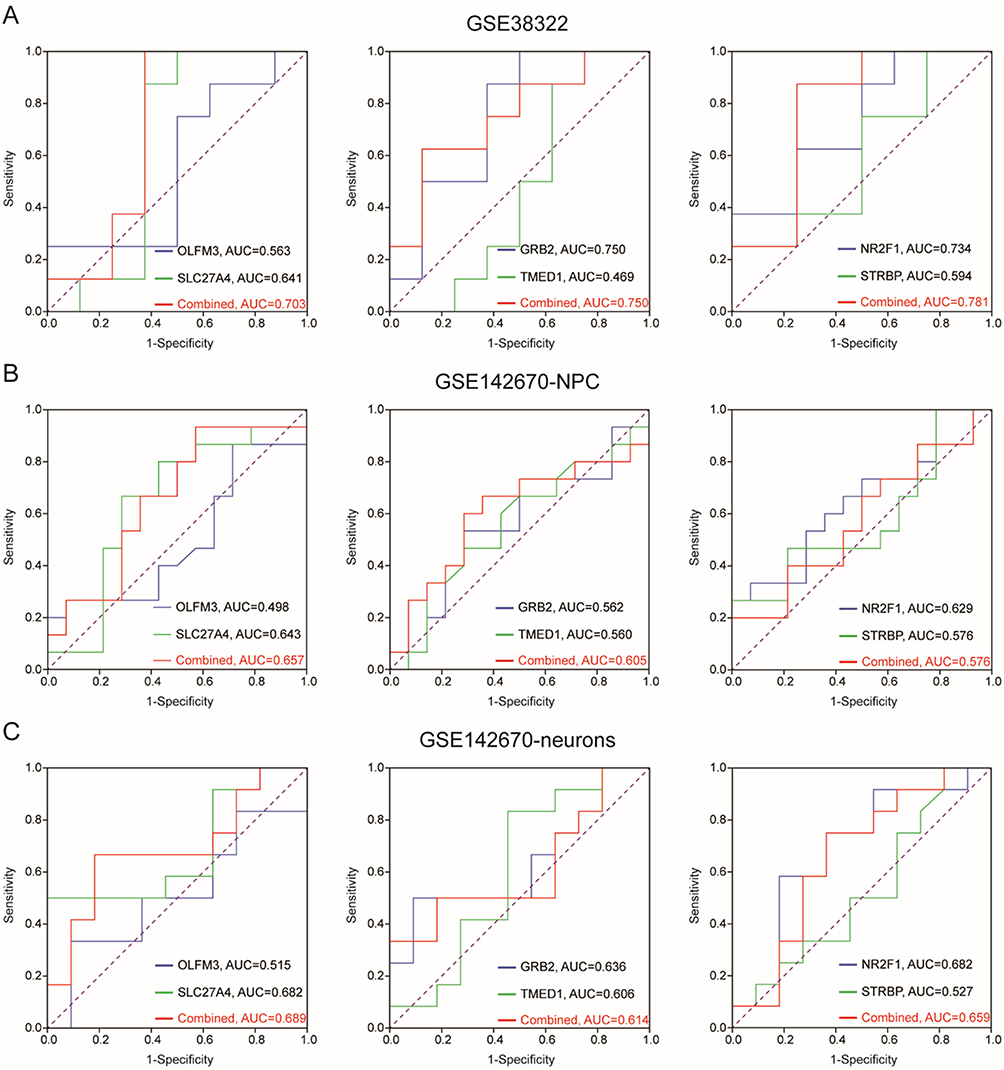 |
Figure 4 Validation of ZIC1, ZIC2 and ZIC3 associated genes in cerebellum, NPC and neurons of ASD patients. ROC analysis of OLFM3, SLC27A4, GRB2, TMED1, NR2F1 and STRBP in cerebellum of ASD patients from GSE38322 (A), and iPSC derived NPC (B) and neurons (C) of ASD patients from GSE142670. |
However, compared with the results in the ASD cerebellum from GSE38322, all the combined AUC values >0.7, AUC values of all biomarkers in iPSC-derived NPC or neurons of ASD patients were lower than 0.7. As shown in Figure 4B, ROC analysis for OLFM3 and SLC27A4 resulted in AUC values of 0.498 and 0.643, respectively, and combined AUC of 0.657. ROC analysis for GRB2 and TMED1 resulted in AUC values of 0.562 and 0.560, respectively, and combined AUC of 0.605. ROC analysis for NR2F1 and STRBP resulted in AUC values of 0.629 and 0.576, respectively, and combined AUC of 0.576. As shown in Figure 4C, ROC analysis for OLFM3 and SLC27A4 resulted in AUC values of 0.515 and 0.682, respectively, and combined AUC of 0.689. ROC analysis for GRB2 and TMED1 resulted in AUC values of 0.636 and 0.606, respectively, and combined AUC of 0.614. ROC analysis for NR2F1 and STRBP resulted in AUC values of 0.682 and 0.527, respectively, and combined AUC of 0.659.
These results suggest that, in addition to affecting the function of neurons in the cerebellum of ASD patients, ZIC1, ZIC2, and ZIC3 may affect the function of other immune and stromal cells in the cerebellum.
ZIC1, ZIC2 and ZIC3 Associated Genes are Related to Immune Cells in Cerebellum of ASD
To explore the association of ZIC1, ZIC2, and ZIC3 with immune and stromal cells in the cerebellum of patients with ASD, an xCell analysis was performed. As shown in Figure 5A and B, ZIC1 was positively associated with CD4+ memory T cells, Th1 cells, Tregs, neurons, and astrocytes and negatively associated with CD8+ Tem, M2, DC, NKT, mast cells, and endothelial cells. ZIC2 was positively associated with Th1 cells, Tregs, neurons, and astrocytes and negatively associated with CD8+ Tem, M2, DC, NKT, and endothelial cells. ZIC3 was positively associated with CD8+ Tem, CD4+ naïve T-cells, CD4+ Tcm, memory B cells, B cells, DC, mast cells, and endothelial cells and negatively associated with CD4+ memory T cells, Th1 cells, M1, Tregs, and neurons.
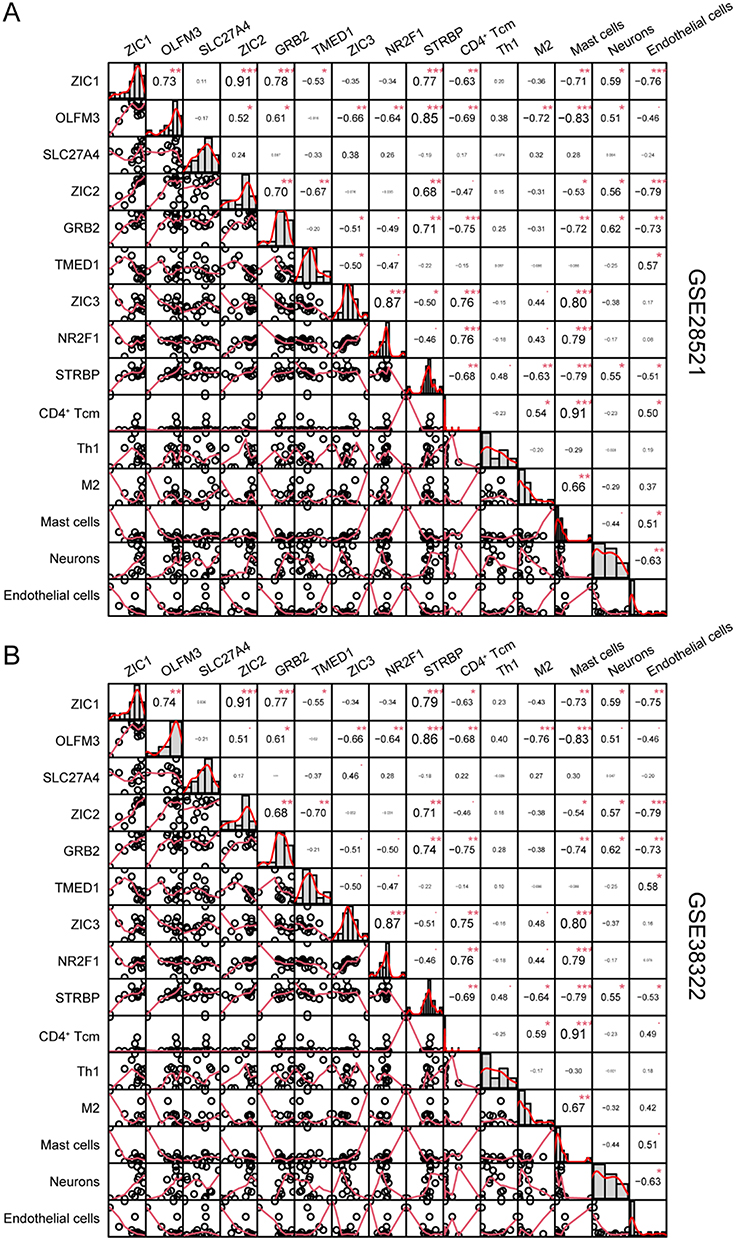 |
Figure 5 ZIC1, ZIC2 and ZIC3 associated genes are related to immune cells in cerebellum of ASD. Pearson’s correlation coefficient was utilized to analyze the correlations between genes and xCell scores from the datasets GSE28521(A) and GSE38322(B) using the R package PerformanceAnalytics. (*P<0.05, **P<0.01, ***P<0.001). Abbreviations: Tem, Effective memory T cell; Tcm, Central memory T cell; Tregs, Regulatory T cells; M1, M1 macrophages; M2, M2 macrophages; DC, Dendritic cells; NKT, Natural killer T cell. |
Decreased Expression of Zic3 and Nr2f1 in the Cerebellum of ASD Mice of MIA Model
Maternal immune activation (MIA) is one of the most commonly studied models, in which prenatal exposure to poly(I: C) alone leads to ASD like behavior and significant immune abnormalities in the cerebellum of offspring.12 To identify the expression of ZIC1, ZIC2, ZIC3, and related genes in the cerebellum of ASD mice, we used cerebellar tissue from the offspring of MIA mice previously identified as ASD.12 qPCR assays showed that Zic3 (CON, 1.202 ± 0.2341; Poly(I:C), 0.1860 ± 0.01296; p=0.0123) expression was significantly decreased in the cerebellum of ASD mice, but there was no significant difference between Zic1 (CON, 1.024 ± 0.08789; Poly(I:C), 1.421 ± 0.2384; p=0.1930) and Zic2 (CON, 1.199 ± 0.2331; Poly(I:C), 0.9892 ± 0.2968; p=0.6084) (Figure 6A). Furthermore, Nr2f1 (p<0.01), which was positively correlated with the expression of Zic3, was downregulated (Figure 6B). These results suggest that the decrease in Zic3 and Nr2f1 was associated with immune inflammation and autism-like behavior in the cerebellum of ASD mice in the MIA model.
 |
Figure 6 Decreased expression of Zic3 and Nr2f1 in the cerebellum of ASD mice of MIA model. qPCR for Zic1, Zic2, Zic3 (A) and Zic3 associated genes, Nr2f1, Strbp (B), in the cerebellum of ASD mice of MIA model (n = 3, *p < 0.05, **p < 0.01). Representative data from three independent experiments were shown. |
Discussion
Enhancing the clinical diagnosis and treatment of ASD requires a deeper understanding of the complex pathogenesis and the exploration of key regulators and signaling pathways. Here, we identified ZIC1, ZIC2, and ZIC3 as candidate hub genes in ASD patients by network and ROC analyses of cerebellum samples from GSE28521, and selected OLFM3, SLC27A4, GRB2, TMED1, NR2F1, and STRBP as diagnostic biomarkers. In addition, the accuracy and stability of these hub genes was validated in the cerebellum of ASD patients from GSE38322 and iPSC iPSC-derived NPC and neurons of ASD patients from GSE142670. xCell analysis indicated that ZIC1, ZIC2, and ZIC3 not only affect neurons but also affect immune cells, endothelial cells, and astrocytes.
Accumulating studies have shown that the ZIC genes are associated with multiple neurodevelopmental disorders. For example, ZIC1 and ZIC2 can inhibit dopaminergic fate in the postnatal dorsal lineage,28 which involved in ASD,29 Parkinson’s disease (PD)30 and Alzheimer’s disease (AD).31 Similar to our analysis results (Figure 2A and Table 2), ZIC1 is associated with the AD and PD signaling pathways and the key pathogenic genes (APP) of AD.32 Notably, we found the ZIC genes in the cerebellum were related to autistic disorder, bipolar disorder, schizophrenia, and mental retardation (Figure 1B).
NXF1, the most highly ranked gene in the downregulated network associated with ZIC1, functions as a ubiquitously expressed essential mRNA nuclear export factor. NXF1 has been shown to affect mRNA surveillance33 and ubiquitin-mediated proteolysis34 thus, it may be involved in diverse neuropsychiatric disorders, including schizophrenia and ASD.35 OLFM3, with the highest AUC value among the genes positively associated with ZIC1, is also considered one of the major differential proteins in the AD.36 The olfactomedin structural domain family protein OLFM3, which is present in neurons, promotes the formation of tight junctions.37 An increased risk of ASD is associated with disruption of the tight junctions, one of the vital components of the blood–brain barrier (BBB).38 SLC27A4, with the highest AUC value among the genes negatively associated with ZIC1, is a member of the fatty acid transport family of proteins involved in the translocation of fatty acids across the BBB. As fatty acids are required for brain development, SLC27A4 dysfunction may impair early brain development in ASD.39 Although the exact mechanism is unclear, this evidence suggests a role of ZIC1 and its related genes in ASD pathogenesis.
ZIC2 mutations are the predominant disease mechanism in human holoprosencephaly40 and play a role in suppressing Wnt/β-catenin signaling.41 Notably, Wnt/β-catenin-dependent signaling affects axonal remodeling in cerebellar granule cells and excitatory and inhibitory synaptic transmission, which has become increasingly important in the study of ASD.42 Consistent with our analysis (Figure 2B), CTNNB1 (β-catenin) was enriched in the network of ZIC2 associated genes, and linked to chromatin remodeling, Wnt signaling during development, and synaptic function in ASD.43 Moreover, CALM1 and CALM2 encode calcium-binding proteins and are implicated in calcium homeostasis, which can also regulate Wnt signaling.44 MAP1LC3/LC3, a hub gene in the network of ZIC2 associated down-regulated genes, is an autophagy marker closely related to Wnt and mTOR signaling pathways,45,46 which decreased in several ASD mouse models and is related to autism-like behaviors in mice.47–49 GRB2, with the highest AUC value among the genes positively associated with ZIC2, functions as an integrator of multiple signaling pathways, such as Wnt signaling50 and the neurotrophin signaling pathway, to promote neuron growth,51 and also has an impact on synapse formation and synaptic plasticity through the ErbB signaling pathway.52 Therefore, the mutated ZIC2 gene may affect cerebellar neuron development, synapse formation, and BBB maturation, mainly through the Wnt pathway, thereby increasing the risk of ASD.
In the human brain, the BBB localizes to microvascular endothelial cells, and differentiation of these unique endothelia is identified to be precisely initiated by the Wnt/β-catenin pathway.53 ZIC3 is involved in refining and maintaining barrier characteristics in the mature BBB,53 and is a downstream signal of the Wnt pathway.54 The loss of NR2F1, the highest AUC value in the network of positively associated genes of ZIC3, was accompanied by the Wnt pathway,55 causing mild-to-moderate intellectual disability and exhibiting reproducible polymicrogyria-like brain malformations.56 Zhang et al indicated that Nr2f1 mutation promotes inhibitory neuron differentiation and abnormal behavioral deficits related to ASD in mice.57 Figure 6A and B shows that Zic3 and Nr2f1 levels decreased in the cerebellum of ASD mice, which is consistent with these results. According to the strong positive correlation of ZIC3 and NR2F1 in the cerebellum of ASD patients (Figure 5A and B), the deficiency of NR2F1 leads to a decrease in the function of ZIC3, which may be a potential pathogenic mechanism in ASD. Additionally, DNA mismatch repair plays a role in ASD.58 STRBP, the highest AUC value in the network of negatively associated genes of ZIC3, is highly expressed in the brain and affects DNA recombination and repair events.59 In mice, the Strbp mutation results in high mortality and abnormal grasping reflexes.59 These results suggest that ZIC3 and its related genes play a role in the pathogenesis of ASD by affecting the Wnt pathway, BBB function, and DNA mismatch repair.
Additionally, BBB disruption is a prominent mechanism in ASD, which can lead to increased infiltration of peripheral substances into the brain, ultimately leading to neuroinflammation. Cytokines secreted by activated monocytes and macrophages recruit immune cells and aggravate BBB disruption.60 ASD patients often have activation of lymphocytes (T lymphocytes, B lymphocytes, monocytes, NK cells, and DCs), resulting in the generation of autoantibodies, cytokine/chemokine imbalance, and BBB breakage.61 Signs of inflammation have been reported in the cerebellum of ASD people.62 Immune cells in ASD brains are predominantly CD3+ and CD8+ T cells, with fewer populations of CD4+ T and CD20+ B cells.63 Interestingly, our study suggested that all diagnostic markers were associated with cell subtypes other than neurons to achieve diagnostic accuracy and that ZIC1-3 was associated with endothelial cells, which maintained BBB function and integrity. Although the exact mechanism is unknown, these phenomena indicate that immune cells, particularly CD8+ Tem cells in the cerebellum, may be biomarkers for certain patients with ASD. However, in the current transcriptome analysis, we cannot confirm the regulatory effect of ZIC genes on ASD like behavior; further, research in animal models would be meaningful and direct. The ongoing updates in SFRAI and HPA databases will result in the identification of additional risk genes related to ZIC genes.
Conclusion
Our study suggests that ZIC1, ZIC2, and ZIC3 are hub genes in the cerebellum of ASD patients and highlights OLFM3, SLC27A4, GRB2, TMED1, NR2F1, and STRBP as diagnostic biomarkers of ASD. These biomarkers not only affect the development of the BBB and cerebellum but may also affect the cerebellar environment of patients with ASD, including immune cells, astrocytes, and endothelial cells. Additionally, the decrease in co-expression of ZIC3 and NR2F1 may be a significant mechanism for the occurrence of behavioral abnormalities in ASD. Our analysis provides valuable insights and further understanding of the mechanisms of ZIC1, ZIC2, and ZIC3 in ASD pathogenesis.
Data Sharing Statement
Data used to support the findings of this study are available from the corresponding author upon request.
Ethics Statement
The study was approved by the Ethics Committee of Tongji Hospital, Tongji Medical College of Huazhong University of Science and Technology. This study was conducted in accordance with the ethics of the 2013 Helsinki World Medical.
Acknowledgments
We would like to thank all participants for their important contributions to this research.
Author Contributions
All authors made substantial contributions to conception and design, acquisition of data, or analysis and interpretation of data; took part in drafting the article or revising it critically for important intellectual content; agreed to submit to the current journal; gave final approval of the version to be published; and agree to be accountable for all aspects of the work.
Funding
This work was supported by the Key Project of Independent Innovation Research Fund of the Huazhong University of Science and Technology (<grant number 2017KFYXJJ100>) and the Scientific Research Fund cultivation Project of Tongji Hospital (<grant number 2023B14>).
Disclosure
The authors declare that they have no competing interests.
References
1. Battle DE. Diagnostic and Statistical Manual of Mental Disorders (DSM). Codas. 2013;25(2):191–192. doi:10.1590/s2317-17822013000200017
2. Maenner MJ, Warren Z, Williams AR, et al. Prevalence and characteristics of autism spectrum disorder among children aged 8 years - autism and developmental disabilities monitoring network, 11 sites, United States, 2020. MMWR Surveill Summ. 2023;72(2):1–14. doi:10.15585/mmwr.ss7202a1
3. Schaefer GB, Mendelsohn NJ. Genetics evaluation for the etiologic diagnosis of autism spectrum disorders. Genet Med. 2008;10(1):4–12. doi:10.1097/GIM.0b013e31815efdd7
4. Masi A, DeMayo MM, Glozier N, Guastella AJ. An overview of autism spectrum disorder, heterogeneity and treatment options. Neurosci Bull. 2017;33(2):183–193. doi:10.1007/s12264-017-0100-y
5. Shen L, Liu X, Zhang H, Lin J, Feng C, Iqbal J. Biomarkers in autism spectrum disorders: current progress. Clin Chim Acta. 2020;502:41–54. doi:10.1016/j.cca.2019.12.009
6. Kelly E, Meng F, Fujita H, et al. Regulation of autism-relevant behaviors by cerebellar-prefrontal cortical circuits. Nat Neurosci. 2020;23(9):1102–1110. doi:10.1038/s41593-020-0665-z
7. Sathyanesan A, Zhou J, Scafidi J, Heck DH, Sillitoe RV, Gallo V. Emerging connections between cerebellar development, behaviour and complex brain disorders. Nat Rev Neurosci. 2019;20(5):298–313. doi:10.1038/s41583-019-0152-2
8. Carta I, Chen CH, Schott AL, Dorizan S, Khodakhah K. Cerebellar modulation of the reward circuitry and social behavior. Science. 2019;363(6424). doi:10.1126/science.aav0581
9. Sussman D, Leung RC, Chakravarty MM, Lerch JP, Taylor MJ. The developing human brain: age-related changes in cortical, subcortical, and cerebellar anatomy. Brain Behav. 2016;6(4):e00457. doi:10.1002/brb3.457
10. Chambers T, Escott-Price V, Legge S, et al. Genetic common variants associated with cerebellar volume and their overlap with mental disorders: a study on 33,265 individuals from the UK-Biobank. Mol Psychiatry. 2022;27(4):2282–2290. doi:10.1038/s41380-022-01443-8
11. Suliman-Lavie R, Title B, Cohen Y, et al. Pogz deficiency leads to transcription dysregulation and impaired cerebellar activity underlying autism-like behavior in mice. Nat Commun. 2020;11(1):5836. doi:10.1038/s41467-020-19577-0
12. Li H, Wang X, Hu C, et al. JUN and PDGFRA as crucial candidate genes for childhood autism spectrum disorder. Front Neuroinf. 2022;16:800079. doi:10.3389/fninf.2022.800079
13. Herrera E. Rodent zic genes in neural network wiring. Adv Exp Med Biol. 2018;1046:209–230.
14. Aruga J, Millen KJ. ZIC1 function in normal cerebellar development and human developmental pathology. Adv Exp Med Biol. 2018;1046:249–268.
15. Bataller L, Wade DF, Fuller GN, Rosenfeld MR, Dalmau J. Cerebellar degeneration and autoimmunity to zinc-finger proteins of the cerebellum. Neurology. 2002;59(12):1985–1987. doi:10.1212/01.WNL.0000038352.01415.CE
16. Blank MC, Grinberg I, Aryee E, et al. Multiple developmental programs are altered by loss of Zic1 and Zic4 to cause Dandy-Walker malformation cerebellar pathogenesis. Development. 2011;138(6):1207–1216. doi:10.1242/dev.054114
17. Frank CL, Liu F, Wijayatunge R, et al. Regulation of chromatin accessibility and Zic binding at enhancers in the developing cerebellum. Nat Neurosci. 2015;18(5):647–656. doi:10.1038/nn.3995
18. Budisteanu M, Papuc SM, Streata I, et al. The phenotypic spectrum of 15q13.3 region duplications: report of 5 patients. Genes. 2021;12(7):1025. doi:10.3390/genes12071025
19. Aruga J. Zic family proteins in emerging biomedical studies. Adv Exp Med Biol. 2018;1046:233–248.
20. Hatayama M, Ishiguro A, Iwayama Y, et al. Zic2 hypomorphic mutant mice as a schizophrenia model and ZIC2 mutations identified in schizophrenia patients. Sci Rep. 2011;1(1):16. doi:10.1038/srep00016
21. Ali RG, Bellchambers HM, Warr N, et al. WNT-responsive SUMOylation of ZIC5 promotes murine neural crest cell development, having multiple effects on transcription. J Cell Sci. 2021;134(9). doi:10.1242/jcs.256792
22. Voineagu I, Wang X, Johnston P, et al. Transcriptomic analysis of autistic brain reveals convergent molecular pathology. Nature. 2011;474(7351):380–384. doi:10.1038/nature10110
23. Ginsberg MR, Rubin RA, Falcone T, Ting AH, Natowicz MR, Landsberger N. Brain transcriptional and epigenetic associations with autism. PLoS One. 2012;7(9):e44736. doi:10.1371/journal.pone.0044736
24. Griesi-Oliveira K, Fogo MS, Pinto B, et al. Transcriptome of iPSC-derived neuronal cells reveals a module of co-expressed genes consistently associated with autism spectrum disorder. Mol Psychiatry. 2021;26(5):1589–1605. doi:10.1038/s41380-020-0669-9
25. Zhou G, Soufan O, Ewald J, Hancock R, Basu N, Xia J. NetworkAnalyst 3.0: a visual analytics platform for comprehensive gene expression profiling and meta-analysis. Nucleic Acids Res. 2019;47(W1):W234–W241. doi:10.1093/nar/gkz240
26. Uhlén M, Fagerberg L, Hallström BM, et al. Proteomics. Tissue-based map of the human proteome. Science. 2015;347(6220):1260419. doi:10.1126/science.1260419
27. Aran D, Hu Z, Butte AJ. xCell: digitally portraying the tissue cellular heterogeneity landscape. Genome Biol. 2017;18(1):220. doi:10.1186/s13059-017-1349-1
28. Tiveron MC, Beclin C, Murgan S, et al. Zic-proteins are repressors of dopaminergic forebrain fate in mice and C. elegans. J Neurosci. 2017;37(44):10611–10623. doi:10.1523/JNEUROSCI.3888-16.2017
29. Bian WJ, Brewer CL, Kauer JA, de Lecea L. Adolescent sleep shapes social novelty preference in mice. Nat Neurosci. 2022;25(7):912–923. doi:10.1038/s41593-022-01076-8
30. Kalia LV, Lang AE. Parkinson’s disease. Lancet. 2015;386(9996):896–912. doi:10.1016/S0140-6736(14)61393-3
31. Wile DJ, Agarwal PA, Schulzer M, et al. Serotonin and dopamine transporter PET changes in the premotor phase of LRRK2 parkinsonism: cross-sectional studies. Lancet Neurol. 2017;16(5):351–359. doi:10.1016/S1474-4422(17)30056-X
32. Pang K, Jiang R, Zhang W, et al. An App knock-in rat model for Alzheimer’s disease exhibiting Aβ and tau pathologies, neuronal death and cognitive impairments. Cell Res. 2022;32(2):157–175. doi:10.1038/s41422-021-00582-x
33. Zhang M, Wang Q, Huang Y. Fragile X mental retardation protein FMRP and the RNA export factor NXF2 associate with and destabilize Nxf1 mRNA in neuronal cells. Proc Natl Acad Sci U S A. 2007;104(24):10057–10062. doi:10.1073/pnas.0700169104
34. Stutz F, Izaurralde E. The interplay of nuclear mRNP assembly, mRNA surveillance and export. Trends Cell Biol. 2003;13(6):319–327. doi:10.1016/S0962-8924(03)00106-5
35. Nunomura A, Lee HG, Zhu X, Perry G. Consequences of RNA oxidation on protein synthesis rate and fidelity: implications for the pathophysiology of neuropsychiatric disorders. Biochem Soc Trans. 2017;45(5):1053–1066. doi:10.1042/BST20160433
36. Bai B, Wang X, Li Y, et al. Deep multilayer brain proteomics identifies molecular networks in Alzheimer’s disease progression. Neuron. 2020;105(6):975–991.e7. doi:10.1016/j.neuron.2019.12.015
37. Tang S, Wang T, Zhang X, et al. Olfactomedin-3 enhances seizure activity by interacting with AMPA receptors in epilepsy models. Front Cell Dev Biol. 2020;8:722. doi:10.3389/fcell.2020.00722
38. Yousefi B, Kokhaei P, Mehranfar F, et al. The role of the host microbiome in autism and neurodegenerative disorders and effect of epigenetic procedures in the brain functions. Neurosci Biobehav Rev. 2022;132:998–1009. doi:10.1016/j.neubiorev.2021.10.046
39. Maekawa M, Iwayama Y, Ohnishi T, et al. Investigation of the fatty acid transporter-encoding genes SLC27A3 and SLC27A4 in autism. Sci Rep. 2015;5:16239. doi:10.1038/srep16239
40. Barratt KS, Arkell RM. ZIC2 in holoprosencephaly. Adv Exp Med Biol. 2018;1046:269–299.
41. Pourebrahim R, Houtmeyers R, Ghogomu S, et al. Transcription factor Zic2 inhibits Wnt/β-catenin protein signaling. J Biol Chem. 2011;286(43):37732–37740. doi:10.1074/jbc.M111.242826
42. Caracci MO, Avila ME, Espinoza-Cavieres FA, López HR, Ugarte GD, De Ferrari GV. Wnt/β-catenin-dependent transcription in autism spectrum disorders. Front Mol Neurosci. 2021;14:764756. doi:10.3389/fnmol.2021.764756
43. Krumm N, O’Roak BJ, Shendure J, Eichler EE. A de novo convergence of autism genetics and molecular neuroscience. Trends Neurosci. 2014;37(2):95–105. doi:10.1016/j.tins.2013.11.005
44. Das SK, Tan J, Raja S, Halder J, Paria BC, Dey SK. Estrogen targets genes involved in protein processing, calcium homeostasis, and Wnt signaling in the mouse uterus independent of estrogen receptor-alpha and -beta. J Biol Chem. 2000;275(37):28834–28842. doi:10.1074/jbc.M003827200
45. Lorzadeh S, Kohan L, Ghavami S, Azarpira N. Autophagy and the Wnt signaling pathway: a focus on Wnt/β-catenin signaling. Biochim Biophys Acta Mol Cell Res. 2021;1868(3):118926. doi:10.1016/j.bbamcr.2020.118926
46. Qin L, Dai X, Yin Y. Valproic acid exposure sequentially activates Wnt and mTOR pathways in rats. Mol Cell Neurosci. 2016;75:27–35. doi:10.1016/j.mcn.2016.06.004
47. Zhang Y, Xiang Z, Jia Y, He X, Wang L, Cui W. The Notch signaling pathway inhibitor Dapt alleviates autism-like behavior, autophagy and dendritic spine density abnormalities in a valproic acid-induced animal model of autism. Prog Neuropsychopharmacol Biol Psychiatry. 2019;94:109644. doi:10.1016/j.pnpbp.2019.109644
48. Dana H, Bayramov KK, Delibaşı N, et al. Disregulation of autophagy in the transgenerational Cc2d1a mouse model of autism. Neuromolecular Med. 2020;22(2):239–249. doi:10.1007/s12017-019-08579-x
49. Gawande DY, Narasimhan KKS, Bhatt JM, et al. Glutamate delta 1 receptor regulates autophagy mechanisms and affects excitatory synapse maturation in the somatosensory cortex. Pharmacol Res. 2022;178:106144. doi:10.1016/j.phrs.2022.106144
50. Crampton SP, Wu B, Park EJ, et al. Integration of the beta-catenin-dependent Wnt pathway with integrin signaling through the adaptor molecule Grb2. PLoS One. 2009;4(11):e7841. doi:10.1371/journal.pone.0007841
51. Zhou L, Talebian A, Meakin SO. The signaling adapter, FRS2, facilitates neuronal branching in primary cortical neurons via both Grb2- and Shp2-dependent mechanisms. J Mol Neurosci. 2015;55(3):663–677. doi:10.1007/s12031-014-0406-4
52. Ma L, Huang YZ, Pitcher GM, et al. Ligand-dependent recruitment of the ErbB4 signaling complex into neuronal lipid rafts. J Neurosci. 2003;23(8):3164–3175. doi:10.1523/JNEUROSCI.23-08-03164.2003
53. Ben-Zvi A, Liebner S. Developmental regulation of barrier- and non-barrier blood vessels in the CNS. J Intern Med. 2022;292(1):31–46. doi:10.1111/joim.13263
54. Gastfriend BD, Nishihara H, Canfield SG, et al. Wnt signaling mediates acquisition of blood-brain barrier properties in naïve endothelium derived from human pluripotent stem cells. Elife. 2021;10:1.
55. Rodriguez-Tirado C, Kale N, Carlini MJ, et al. NR2F1 is a barrier to dissemination of early-stage breast cancer cells. Cancer Res. 2022;82(12):2313–2326. doi:10.1158/0008-5472.CAN-21-4145
56. Bertacchi M, Romano AL, Loubat A, et al. NR2F1 regulates regional progenitor dynamics in the mouse neocortex and cortical gyrification in BBSOAS patients. EMBO J. 2020;39(13):e104163. doi:10.15252/embj.2019104163
57. Zhang K, Yu F, Zhu J, et al. Imbalance of excitatory/inhibitory neuron differentiation in neurodevelopmental disorders with an NR2F1 point mutation. Cell Rep. 2020;31(3):107521. doi:10.1016/j.celrep.2020.03.085
58. Deshmukh AL, Caron MC, Mohiuddin M, et al. FAN1 exo- not endo-nuclease pausing on disease-associated slipped-DNA repeats: a mechanism of repeat instability. Cell Rep. 2021;37(10):110078. doi:10.1016/j.celrep.2021.110078
59. Pires-daSilva A, Nayernia K, Engel W, et al. Mice deficient for spermatid perinuclear RNA-binding protein show neurologic, spermatogenic, and sperm morphological abnormalities. Dev Biol. 2001;233(2):319–328. doi:10.1006/dbio.2001.0169
60. Kealy J, Greene C, Campbell M. Blood-brain barrier regulation in psychiatric disorders. Neurosci Lett. 2020;726:133664. doi:10.1016/j.neulet.2018.06.033
61. De Giacomo A, Gargano CD, Simone M, et al. B and T immunoregulation: a new insight of B regulatory lymphocytes in autism spectrum disorder. Front Neurosci. 2021;15:732611. doi:10.3389/fnins.2021.732611
62. Pangrazzi L, Balasco L, Bozzi Y. Oxidative stress and immune system dysfunction in autism spectrum disorders. Int J Mol Sci. 2020;21(9):3293. doi:10.3390/ijms21093293
63. DiStasio MM, Nagakura I, Nadler MJ, Anderson MP. T lymphocytes and cytotoxic astrocyte blebs correlate across autism brains. Ann Neurol. 2019;86(6):885–898. doi:10.1002/ana.25610
 © 2024 The Author(s). This work is published and licensed by Dove Medical Press Limited. The full terms of this license are available at https://www.dovepress.com/terms.php and incorporate the Creative Commons Attribution - Non Commercial (unported, v3.0) License.
By accessing the work you hereby accept the Terms. Non-commercial uses of the work are permitted without any further permission from Dove Medical Press Limited, provided the work is properly attributed. For permission for commercial use of this work, please see paragraphs 4.2 and 5 of our Terms.
© 2024 The Author(s). This work is published and licensed by Dove Medical Press Limited. The full terms of this license are available at https://www.dovepress.com/terms.php and incorporate the Creative Commons Attribution - Non Commercial (unported, v3.0) License.
By accessing the work you hereby accept the Terms. Non-commercial uses of the work are permitted without any further permission from Dove Medical Press Limited, provided the work is properly attributed. For permission for commercial use of this work, please see paragraphs 4.2 and 5 of our Terms.