")
Back to Journals » International Journal of Nanomedicine » Volume 14
Human serum albumin-based probes for molecular targeting of macrophage scavenger receptors
Authors Ahmed M, Baumgartner R, Aldi S, Dusart P, Hedin U, Gustafsson B , Caidahl K
Received 29 December 2018
Accepted for publication 1 March 2019
Published 21 May 2019 Volume 2019:14 Pages 3723—3741
DOI https://doi.org/10.2147/IJN.S197990
Checked for plagiarism Yes
Review by Single anonymous peer review
Peer reviewer comments 2
Editor who approved publication: Dr Thomas Webster
Mona Ahmed,1 Roland Baumgartner,2 Silvia Aldi,3 Philip Dusart,4 Ulf Hedin,1 Björn Gustafsson,1 Kenneth Caidahl1,5
1Department of Molecular Medicine and Surgery, Karolinska Institutet, SE 17176, Stockholm, Sweden; 2Department of Medicine Solna, Karolinska Institutet, SE 17176, Stockholm, Sweden; 3Section for Medical Inflammation Research, Department of Medical Biochemistry and Biophysics, Karolinska Institutet, SE 17177, Stockholm, Sweden; 4Department of Cellular and Clinical Proteomics, Science for Life Laboratory, Kungliga Tekniska Högskolan (KTH), SE 17165, Stockholm, Sweden; 5Department of Molecular and Clinical Medicine, Institute of Medicine, Sahlgrenska Academy, University of Gothenburg, SE 41345, Gothenburg, Sweden
Background: Inflammation and accumulation of macrophages are key features of unstable atherosclerotic plaques. The ability of macrophages to take up molecular probes can be exploited in new clinical imaging methods for the detection of unstable atherosclerotic lesions. We investigated whether modifications of human serum albumin (HSA) could be used to target macrophages efficiently in vitro.
Materials and methods: Maleylated and aconitylated HSA were compared with unmodified HSA. Fluorescent or radiolabeled (89Zr) modified HSA was used in in vitro experiments to study cellular uptake by differentiated THP-1 cells and primary human macrophages. The time course of uptake was evaluated by flow cytometry, confocal microscopy, real-time microscopy and radioactivity measurements. The involvement of scavenger receptors (SR-A1, SR-B2, LOX-1) was assessed by knockdown experiments using RNA interference, by blocking experiments and by assays of competition by modified low-density lipoprotein.
Results: Modified HSA was readily taken up by different macrophages. Uptake was mediated nonexclusively via the scavenger receptor SR-A1 (encoded by the MSR1 gene). Knockdown of CD36 and ORL1 had no influence on the uptake. Modified HSA was preferentially taken up by human macrophages compared with other vascular cell types such as endothelial cells and smooth muscle cells.
Conclusions: Modified 89Zr-labeled HSA probes were recognized by different subsets of polarized macrophages, and maleylated HSA may be a promising radiotracer for radionuclide imaging of macrophage-rich inflammatory vascular diseases.
Keywords: atherosclerosis, inflammation, macrophage, molecular imaging, scavenger receptor, zirconium
Introduction
The coupling of imaging probes to albumin is a well-established strategy to improve the performance of the probes in molecular imaging.1,2 Albumin has several favorable characteristics as a drug/probe carrier because it is neither toxic nor immunogenic. It has been explored as a carrier in the field of oncology, but it may also be applied to imaging of atherosclerosis-related pathologies because the half-life of the targeting ligand in the circulation is prolonged when it is coupled to albumin.3 Three different types of albumin have been used for imaging and drug applications: bovine serum albumin (BSA), human serum albumin (HSA) and recombinant human albumin (rHSA) obtained from a methylotrophic yeast, Pichia pastoris.4 Modification of albumin through maleylation promotes its recognition by macrophages and its uptake via macrophage scavenger receptors.5–14
Macrophages are the prevalent inflammatory cells in all stages of atherosclerosis from disease initiation to late-stage disease complications such as myocardial infarction and ischemic stroke. This makes them strategic targets for imaging vascular inflammation.15,16 One of their main functions in this disease is the uptake and clearance of modified low-density lipoproteins (LDLs) via scavenger receptors.17
Scavenger receptors constitute a group of membrane proteins18 involved in the uptake of molecules and particles, eg, apoptotic cells, pathogens and modified LDL.5,8,17 They are categorized into eight different classes based on their structural architecture.19–23 Scavenger receptor class A (SR-A) is expressed mainly by mature macrophages and has been implicated in atherogenesis.18,24,25 The SR-A1 receptor alternatively spliced into SR-A1.1 and SR-A1.2, is encoded by the MSR1 gene and has a broad range of polyanionic ligands,26,27 including modified LDLs and maleylated or glycosylated albumin.28–30 SR-A1 expression is absent in endothelial cells lining normal human blood vessels,18 but is present within the fibrous cap of human atherosclerotic plaques.31,32 SR-A expression has also been detected in oxidized LDL (oxLDL)-stimulated smooth muscle cells33 and endothelial cells during oxidative stress.34 Other scavenger receptors that have been shown to interact with LDL and play a role in atherosclerosis include lectin-like oxidized LDL-receptor (LOX-1) also named SR-E1 and encoded by the ORL1 gene, scavenger receptor B2 (SR-B2) encoded by the CD36 gene, and SR-A6 encoded by the macrophage receptor with collagenous structure (MARCO) gene.22,23,35
We hypothesized that modified, labeled albumin can be taken up by macrophages in atherosclerotic lesions and serve as a tracers for molecular imaging of inflammation in atherosclerosis. We investigated two different modifications of HSA, maleylated (Mal-) and aconitylated (Aco-) HSA, and studied their cellular interactions and the specificity and mechanisms of ligand uptake in different subsets of macrophages and other vascular cell types. Our findings establish a scientific foundation for the development of new diagnostic tools that target macrophage-rich inflammation in vascular diseases.
Material and methods
Probe preparation, FITC conjugation and radiolabeling
Syntheses and characterization
HSA (Sigma-Aldrich, Saint Louis, MO, USA) was first covalently coupled to fluorescein isothiocyanate (FITC, Sigma-Aldrich) as previously reported7 or to para-isothiocyanatobenzyl deferoxamine (p-NCS-Bz-DFO; Chematech, Dijon, France) using the following procedures. Briefly, FITC in anhydrous dimethyl sulfoxide (DMSO, Invitrogen, Carlsbad, CA, USA; 10 mg/ml) was slowly added to a solution of HSA in carbonate/bicarbonate buffer (20 mg/ml, pH 9) to a molar ratio of 9:1. It was then stirred for 2 h at room temperature in darkness and purified on a Sephadex® G-50 (fine, Sigma-Aldrich) desalting column and then freeze-dried. Alternatively, p-NCS-Bz-DFO in anhydrous DMSO (33 mg/ml) was slowly added to a solution of HSA in 0.1 M tetramethylammonium phosphate (TMAP) buffer (20 mg/ml, pH 9) to a molar ratio of 15:1 at room temperature. The final pH was adjusted to 8.5 by addition of 2.5% (CH3)4NOH-solution (Sigma-Aldrich) and then stirred for 47 h. The reaction mixture was then purified on a Sephadex G-50 desalting column and freeze-dried. For conjugation with the cyclic anhydrides, maleic anhydride (MalA, Sigma-Aldrich)6 and cis-aconitic anhydride (AcoA, Sigma-Aldrich) with the following procedures were used. HSA-DFO or HSA-FITC was dissolved (2 mg/ml) in TMAP, pH 9 and MalA was slowly added to a molar ratio of 416:1, while stirring at room temperature and maintenance of the pH at 8.5–8.7 by addition of 2.5% (CH3)4NOH-solution. The reaction was considered complete when the pH was stable. For conjugation with AcoA the solid anhydride was added to a solution of HSA-DFO or HSA-FITC (2 mg/ml) in phosphate buffered saline (PBS), pH 8, at a molar ratio of 433:1, during stirring at room temperature and maintenance of pH at 8.0–8.2 by additions of 3 M NaOH solution. The reaction was considered complete when the pH was stable. The probes were then purified by dialyzing 4–5 times against 10 l of ultrapure water, sterile filtered through a 0.2 μm filter and freeze-dried. The HSA, HSA-DFO, HSA-FITC, Mal-HSA-DFO, Mal-HSA-FITC, Aco-HSA-DFO and Aco-HSA-FITC were then analyzed by mass spectrometry (MS) to evaluate their molecular masses and the number of conjugated FITC, DFO, Mal and Aco per HSA.
Mass spectrometry
Mass spectrometry (Bruker UltrafleXtreme MALDI TOF/TOF with Smartbeam-II™ laser, using FlexControl software and FlexAnalysis [Bruker Daltonik, Bremen, Germany]) was used to analyze the number of FITC, DFO, Mal and Aco groups that were conjugated to HSA and to determine the molecular masses of the final products. A sample preparation of 0.5 μl of analyte (1 μmol/l in 30:70 acetonitrile:0.1% trifluoroacetic acid [TA30]) was mixed with 0.5 μl 2,5-dihydroxybenzoic acid (20 mg/ml in TA30). The droplet on the target plate was dried at room temperature before analysis and the sample was analyzed by matrix-assisted laser desorption ionization (MALDI) and the resulting ions analyzed by time-of-flight (TOF) MS. By comparison of the average molecular mass of the different HSA modifications with that of pure HSA, the approximate average number of FITC, DFO, Mal and Aco groups per HSA molecule could be determined. The method accuracy was estimated as ±300 g/mol.
Dynamic light scattering (DLS)
The particle size and ζ-potential of the three DFO-labeled probes were measured with a Zetasizer Nano (Malvern Instruments, Malvern, UK). Two separate samples of each probe were measured three times at 25 °C. For size measurements, 40 μl of the sample (1 mg/ml in ddH2O) was transferred to a microcuvette (ZEN2112) and for ζ-potential measurements 0.8 ml of sample (1 mg/ml in ddH2O) was transferred to a single-use cuvette (DTS1061).
Radiolabeling with zirconium-89
Radiolabeling of HSA was performed according to the method described by Vosjan et al.36 For labeling of 0.3 mg of R-HSA-DFO (R=Mal, Aco or nonmodified) with 89Zr, a radioactivity dose of 80–100 MBq of 89Zr(IV) in 1 M oxalic acid (Perkin Elmer, BV Cyclotron VU, Amsterdam, The Netherlands) was used and neutralized with 1 M sodium carbonate. The 89Zr-solution pH was adjusted to 6.9–7.1 with 1 M C2H2O4 or 1 M Na2CO3 as necessary and added to 300 μl solution of R-HSA-DFO (1 mg/ml, 1 M HEPES, Thermo Fisher Scientific, Waltham MA, USA) in a 2-ml Eppendorf tube. Incubation at 21 °C and agitation at 450 rpm for 1 h followed. The radiotracers were analyzed and purified using high-performance liquid chromatography (HPLC, LC-10AD VP, Shimadzu, Kyoto, Japan and a Superdex 75 10/300 GL column, 0.5 ml/min in PBS, 210 nm) with radiodetector (Model 170 Radioisotope Detector, Beckman Instruments, Pasadena, CA, USA). The fractions with the highest radioactivity peak were collected for use in experiments.
LDL isolation and modification
LDL (ρ=1.019–1.063 g/ml) was isolated by sequential ultracentrifugation from pooled plasma of healthy donors as previously described.37 Briefly, after the first round of ultracentrifugation, the chylomicrons and very low-density lipoprotein fraction were discarded, and the density of the LDL/high-density lipoprotein fraction was adjusted with potassium bromide to roughly 1.063 g/ml. LDL was collected after ultracentrifugation and cleared using PD-10 columns (GE Healthcare, Chicago, IL, USA) equilibrated with PBS. LDL concentration was determined by Bradford assay (Bio-Rad Laboratories, Hercules, CA, USA) and subsequently modified as follows. Oxidized LDL (oxLDL) was generated using CuSO4 (5 μmol/l per one mg of LDL protein; 18 h; 37 °C). Malondialdehyde (MDA)-generation and modification of LDL was performed as previously described.38 MDA was generated from malondialdehyde bis(dimethyl acetal) (Sigma-Aldrich) by acid hydrolysis and 0.5 M MDA was incubated with LDL at a ratio of 100 μl/mg LDL for 3 h at 37 °C. Acetylated LDL (acLDL) was generated as described previously39 by diluting LDL in a 1:1 ratio with saturated sodium acetate solution and the addition of 1 μl acetic anhydride/mg LDL every 15 min for 1 h with gentle stirring on ice. Modified LDL was cleared once more by gel filtration using PD-10 columns; protein concentration was determined by Bradford assay. LDL preparations were stored at 4 °C and used within 4 weeks.
Cell culture and cytokine stimulation
THP-1 cells (ATCC®, TIB-202™, ATCC, Manassas, VA, USA), a human monocytic leukemia-derived cell line, were stimulated for 48 h with 0.1 µM phorbol 12-myristate 13-acetate (PMA) (Sigma-Aldrich) to differentiate them into THP-1 macrophages.40 For differentiation into foam cells, THP-1 macrophages were further stimulated with 50 µg/ml acLDL for 48 h and stained with Oil-Red-O (ORO) (Sigma-Aldrich) to confirm lipid accumulation (online protocol:
RNA silencing
To downregulate scavenger receptors in macrophages, THP-1 were first differentiated into macrophages for 48 h with PMA. Cells were washed with PBS, and medium without serum was added to the cells. Predesigned siRNAs (Silencer_1 MSR1 siRNA ID# s8987, Silencer_2 MSR1 siRNA ID# s8989, Silencer_1 CD36 siRNA ID# s2646, Silencer_2 CD36 siRNA ID# s2647, Silencer_1 OLR1 siRNA ID# s9842, Silencer_2 OLR1 siRNA ID# s9843 and a negative control siRNA; all purchased from Thermo Fisher Scientific) were prepared and diluted to 100 nM in medium without serum. Cells were transiently transfected using HiPerfect (Qiagen, Venlo, The Netherlands). The transfection complexes were added dropwise onto the cells and incubated for 6 h. Then, RPMI1640 medium containing 20% serum and antibiotics was added for 48 h. After 48 h, cells were washed twice with PBS and collected either for RNA and protein extraction or for further experimental evaluation.
Quantitative PCR
Quantitative PCR (qPCR) was performed as described previously.42 Briefly, RNA was extracted from cell cultures with QIAzol Lysis Reagent (Qiagen) and reverse-transcribed using a High Capacity RNA-to-cDNA kit (4387406, Applied Biosystems). PCR amplification was performed in 96-well plates using a 7900 HT real-time PCR system (Applied Biosystems) and TaqMan® Universal PCR Master Mix (Applied Biosystems) and TaqMan® Gene Expression Assays (hCD36 [#4351372, Assay ID: Hs01567188_g1], hSRA [#4331182, Assay ID: Hs00234007_m1], hLOX-1 [#4331182, Assay ID: Hs01552593_m1], Applied Biosystems). Samples were measured in duplicate. For analysis, results were normalized to an equal mass of total RNA and to the Ct values of ribosomal protein lateral stalk subunit P0 (RPLP0) housekeeping control (#4331182, Assay ID: Hs99999902_m1, Applied Biosystems). The relative amount of target gene mRNA was calculated by the 2–ΔΔCt method and results are presented as fold change compared with baseline expression.
Immunoblotting
Immunoblotting was performed as previously described.43 In brief, total protein lysates (25–30 μg/lane) were prepared in 4× Laemmli buffer supplemented with β-mercaptoethanol (Bio-Rad) and preheated (at 90 °C) for separation by sodium dodecyl sulfate–polyacrylamide gel electrophoresis in 4–20% gels (Bio-Rad). Polyvinylidene difluoride membranes (Hybond TM-P, GE Healthcare) were probed with anti-human SR-AI/MSR monoclonal mouse IgG2b, anti-human CD36/SR-B3 monoclonal mouse IgG1 (R&D Systems), anti-human LOX-1 monoclonal mouse IgG2aκ (EMD Millipore, Merck, Burlington, MA, USA) at a dilution of 1:500 overnight. Horseradish peroxidase (HRP)-labeled goat anti-mouse (Invitrogen) was used as secondary antibody at a dilution of 1:5000 and incubated with samples at room temperature for 45 min. Anti-human β-actin HRP-conjugated antibody (Alpha Diagnostic International, San Antonio, TX, USA) was used as a loading control at a dilution of 1:20,000. Proteins of interest were detected using Amersham ECL Prime Western Blotting Detection Reagent (GE Healthcare).
Flow cytometry
Cells were incubated with FITC-conjugated probes in 6-well Costa Corning plates. THP-1 macrophages were incubated with FITC-labeled probes alone or in combination with modified LDL particles. After 1 h incubation with the probe, cells were washed and stained with live–dead staining solution (LIVE/DEADTM Fixable Aqua Dead Cell Stain Kit, for 405 nm excitation, Invitrogen) for 15 min at 4 °C. The reaction was stopped by washing with 1% BSA followed by PBS. Cells were fixed with 4% formaldehyde (FA, Agar Scientific, Stansted, Essex, UK) at room temperature for 20 min and then washed and scraped off the plastic for flow cytometry analysis. Analyses were performed on a BD LSRFortessa™ (BD Biosciences, Franklin Lakes, NJ, USA). For THP-1 macrophages, each condition was measured in triplicate and the experiment repeated at least once. For human macrophages, six donors were used, each of which was measured in duplicate.
Real-time imaging
For real-time uptake studies, cells were incubated as described in the figure legends with 0.1 μM of either FITC-labeled Mal-HSA or FITC-labeled HSA for the indicated time. Uptake was monitored with IncuCyte (Essen BioScience, Ann Arbor, MI, USA) using a 20× objective, and phase-contrast and green-fluorescence images were recorded. Each condition was measured in triplicate and nine images per well were acquired. The experiment was repeated at least once. The total green object integrated intensity (green calibration unit × area, or GCU × μm2) was normalized to the measured cell confluence of each image, and the average was plotted against time.
Immunofluorescence microscopy
Immunofluorescence staining was performed as previously described.43 In brief, THP-1 macrophages were plated in Ibidi μ-slide VI0.4 chambers (Ibidi GmbH, Martinsried, Germany). Cells were incubated with 0.1 μM FITC-conjugated probes for 3 h at 37 °C in a 5% CO2, 95% air humidified atmosphere. Cells were washed and fixed with 4% FA for 15 min. After fixation, cells were permeabilized with 0.1% Triton X-100/PBS for 5 min at room temperature, followed by blocking with 5% goat serum/PBS for 1 h at room temperature. Primary LAMP-2/CD107b antibody (H4B4) (Novus Biologics, Littleton, CO, USA), was diluted in 2% goat serum and incubated with cells for 1 h at room temperature. After incubation, cells were washed and incubated with goat anti-mouse Alexa Fluor 568 (1:500) secondary antibody or rhodamine Phalloidin, TRITC (1:500) (Thermo Fisher Scientific) for 30 min at RT. Cells were mounted in Vectashield antifade mounting medium with DAPI for nuclear staining (Vector Laboratories, Burlingame, CA, USA). Z-stack images, with a slice thickness of 1 μm, were acquired with a Leica TCS SP5 confocal microscope (Leica Microsystems, Wetzlar, Germany) using a 60× oil immersion objective. Each condition was measured in duplicate and experiments were repeated at least three times.
Receptor blocking studies
Class A scavenger receptor blocker dextran sulfate (100 μg/ml) and actin inhibitor cytochalasin D (10 μM) (Sigma-Aldrich) were used to block phagocytosis in THP-1 macrophages. Cells were preincubated with these inhibitors for 30 min prior to the addition of modified HSA probes. Cells were incubated for 3 h at 37 °C in a 5% CO2, 95% air humidified atmosphere. Then, cells were washed and fixed with 4% FA for 15 min and mounted with Vectashield Antifade mounting medium containing DAPI and imaged with a confocal microscope as described above. Each condition was measured in duplicate. Five images per well were acquired, and experiments were repeated at least once. The analyses were performed using the Fiji ImageJ cell counter plugin.
For blocking of SR-A1, we used primary human monocytes differentiated into M0, M1 and M2 macrophages as described earlier. Cells were preincubated with a mouse monoclonal anti-human SR-A1/MSR1 blocking antibody (4 μg/ml) or mouse monoclonal IgG1 isotype control (4 μg/ml) (R&D systems) and compared with cells incubated with 0.1 μM probe for 1 h without prior blocking. Cells were analyzed using IncuCyte time-lapse imaging every 30 min for 24 h with a 20× fluorescence imaging microscope. Each condition was measured using cells from three donors and technical triplicates, and nine images per well were acquired at each time point. The experiment was repeated at least once.
Radiotracer experiments evaluated by gamma counter
For each condition, 1 ml (1 MBq/ml, ~0.1 μM) of the 89Zr-labeled probe (radiotracer) was added to THP-1 macrophages and incubated for different times. Radiotracer uptake was also evaluated after oversaturation of receptors by preincubation with 1 mg “cold” probe without 89Zr for 15 min, prior to addition of the radiotracer for 1 h. After incubation, supernatant and washes were saved. Cells were scraped off the wells, counted and analyzed for radiotracer uptake in a gamma counter (Wallac™ Wizard 3” 1480, Perkin Elmer). Gamma counter measurements were decay corrected and expressed as radioactivity uptake per 100,000 cells. Each condition was measured in triplicate and experiments were repeated at least once.
Statistical analysis
SPSS (version 24 for Macintosh) was used to test normality using the Shapiro–Wilk test and distribution of data was also evaluated by histograms, Q–Q plots and checked for skewness. GraphPad Prism (version 7 for Macintosh) was used to test differences between two groups by Student’s t-test, and those between more than two groups by analysis of variance (ANOVA); significant differences were tested using Dunnett’s or Tukey’s post hoc tests. Linear regression was applied to test relationships. Two-tailed P-values are reported and unless stated otherwise, a P-value <0.05 was considered significant.
Ethics approval
No ethics permits were necessary for this work. Peripheral blood was obtained from healthy volunteers at the Blood Center of Karolinska University Hospital, Stockholm, Sweden.
Results
Probe characterization
The purified probes were analyzed by MS (MALDI-TOF), yielding an average m/z: [M+] HSA 66 799; HSA-FITC4 68 146; HSA-DFO5 70 155; Mal51-HSA-FITC4 73 321; Mal65-HSA-DFO5 76 770; Aco28-HSA-FITC4 72 177; Aco50-HSA-DFO5 77 385.
Sizes and ζ-potentials of HSA-DFO5, Aco50-HSA-DFO5 and Mal65-HSA-DFO5 were measured using DLS; the average probe size was 3.8 nm for HSA-DFO5, 7.9 nm for Aco50-HSA-DFO5 and 9.9 nm for Mal65-HSA-DFO5 and the average ζ-potential in MilliQ-water was –24.7 mV for HSA-DFO5, –6.6 mV for Aco50-HSA-DFO5 and –31.6 mV for Mal65-HSA-DFO5. A schematic drawing of the HSA probes is presented in Figure S1.
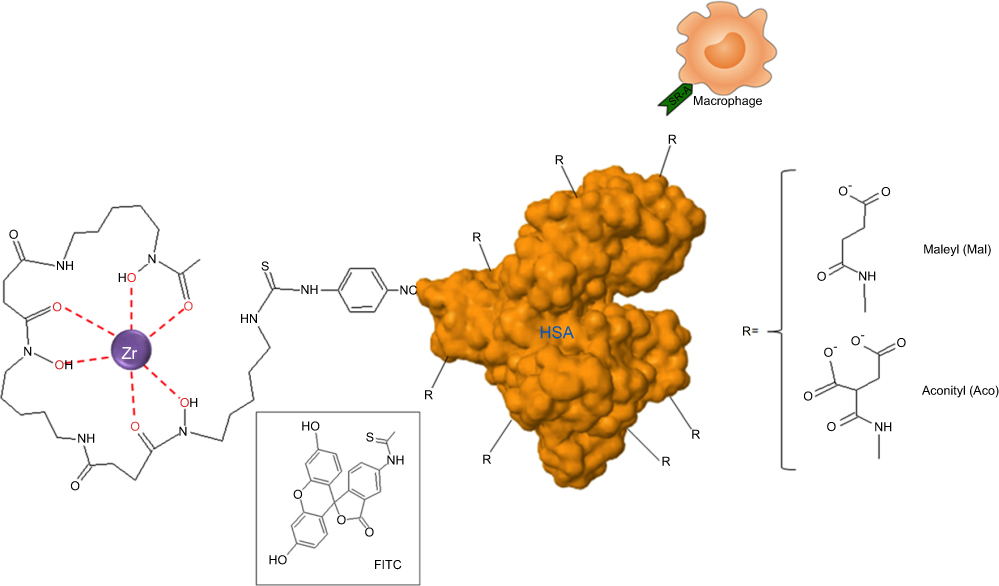 | Figure S1 Schematic drawing of the HSA-DFO-probe labeled with 89Zr or FITC. |
Cellular uptake and cellular distribution
To investigate the uptake of modified and unmodified HSA, three different concentrations of the probes were tested in THP-1 macrophages. Both chemical modifications of HSA increased the cellular uptake after 1 h incubation in THP-1 macrophages even at the lowest concentration (P<0.001) (Figure 1A). Overall Mal-HSA showed better uptake than Aco-HSA in each tested concentration. For further experiments, the lowest concentration was used to avoid nonspecific uptake of the probe. Interestingly, Mal-HSA probes were localized in granular-shaped structures inside the cytoplasm of cells (Figure 1B). To examine the biological fate of the probes after cellular uptake, we co-stained for lysosomes. Z-stacked images showed colocalization of LAMP-2 and the FITC-labeled Mal-HSA probe (Figure 2). Moreover, since the aim of these studies was to investigate probes targeted to macrophages localized in atherosclerotic plaques, we conducted a series of experiments in lipid overloaded macrophage foam cells in vitro. For this, we incubated THP-1 macrophages with acLDL and after 48 h incubation; cells showed the typical cytoplasmic lipid droplets accumulation (Figure 3C). We monitored Mal-HSA uptake over 24 h using real-time microscopy. We first noted that the uptake of modified HSA increased over the entire duration of the experiment without reaching a peak. Interestingly there was a significant difference between the uptake of Mal-HSA-FITC by THP-1 foam cells compared to THP-1 macrophages (P<0.0001), although both cell types recognized the probe. Uptake of unmodified HSA was undetectable even after 24 h (Figure 3).
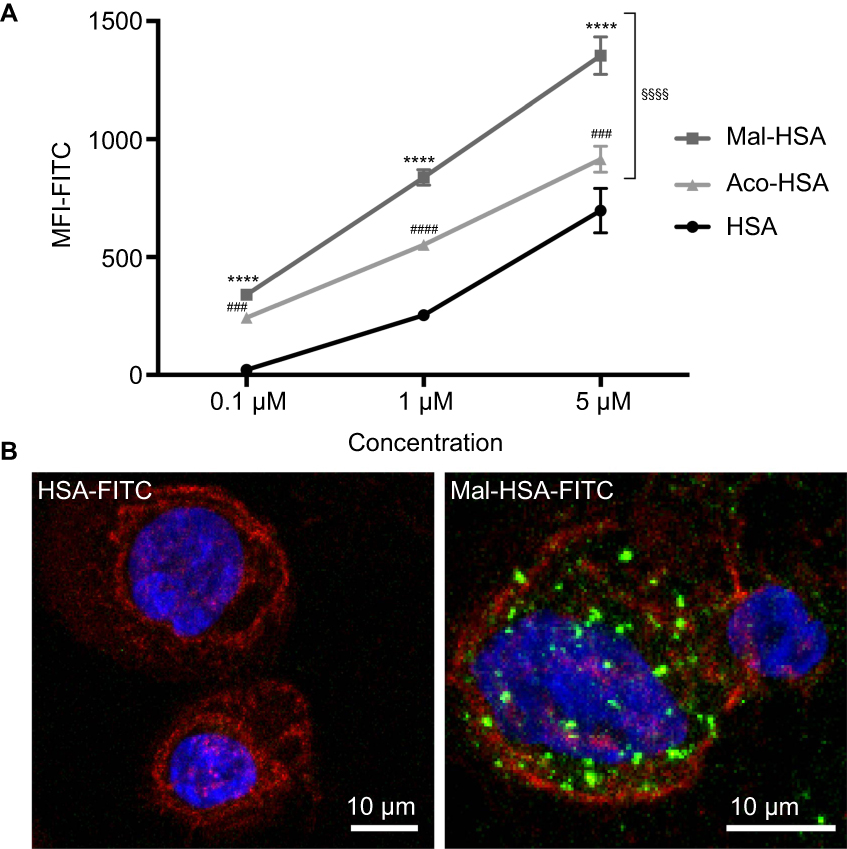 | Figure 1 Evaluation of probe uptake in THP-1 macrophages.Notes: (A) Flow cytometry analysis of uptake of three different concentrations (0.1 μM, 1 μM and 5 μM) of FITC-conjugated probes. Significantly higher uptake of Mal-HSA-FITC and Aco-HSA-FITC than of HSA-FITC by THP-1 macrophages was observed for all tested concentrations. Uptake of Mal-HSA showed significantly higher FITC MFI than that of Aco-HSA at all tested concentrations. The FITC MFI increased significantly with increasing concentrations of each probe P<0.0001. The results are pooled data from two independent experiments (triplicate wells). Data are presented as mean FITC MFI ± SD. ****P<0.0001 for Mal-HSA vs HSA; ###P<0.001, ####P<0.0001 for Aco-HSA vs HSA; §§§§P<0.0001 for Mal-HSA vs Aco-HSA (ordinary two-way ANOVA (factors: treatment and concentration) and Tukey’s multiple comparison test). (B) Confocal Z-stack maximum intensity projection images; left panel: (0.1 μM) HSA-FITC incubation, right panel (0.1 μM) Mal-HSA-FITC. Images show probes (FITC green), actin staining (phalloidin, TRITC red), cell nuclei staining (DAPI, blue). Abbreviations: HSA, human serum albumin; MFI, median fluorescence intensity. |
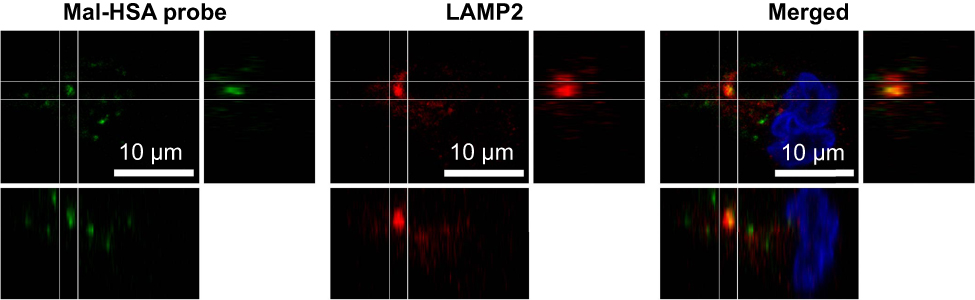 | Figure 2 A representative confocal image of THP-1 macrophages showing yellow clusters of colocalized Mal-HSA-FITC (green) probe and LAMP2 lysosome staining (red—Alexa Fluor 568) shown in the merged image. The white lines outline the area of colocalization and enhanced images of orthogonal views.Abbreviation: HSA, human serum albumin. |
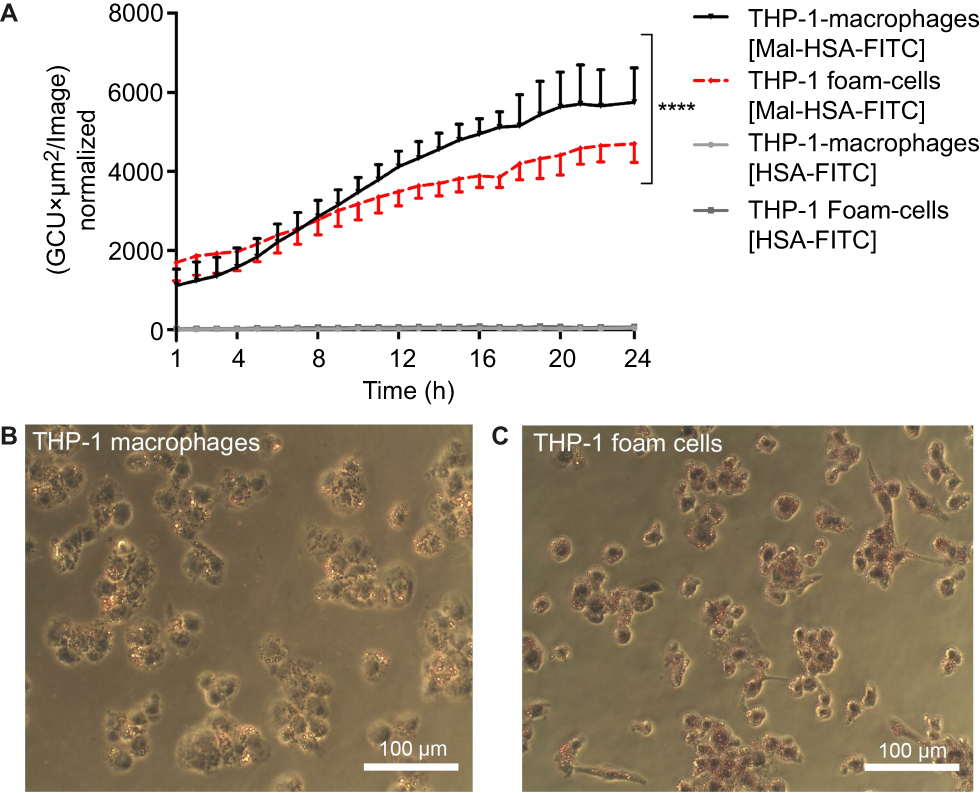 | Figure 3 Real-time microscopy comparing Mal-HSA-FITC uptake by THP-1 macrophages with that by THP-1 foam cells over 24 h.Notes: (A) A significant difference between the time-dependent Mal-HSA-FITC uptake by THP-1 foam cells and THP-1 macrophages was noted by comparing the slope coefficients. No uptake of HSA-FITC probes (gray lines) was observed in either cell subtype. The results shown are pooled data from two independent experiments (triplicate wells). Nine images per well were acquired for each time point. The graph shows mean and SEM. Linear regression analysis showed significantly different slopes of the lines for THP-1 macrophages and THP-1 foam cells (****P<0.0001). (B, C) Light microscopy images were taken after ORO-staining (red) with a 20× objective of (B) THP-1 macrophages and (C) THP-1 foam cells, showing stronger ORO-staining compared with THP-1 macrophages. Abbreviations: HSA, human serum albumin; GCU, green calibration unit; ORO, Oil-Red-O. |
Receptor specificity
Next, we investigated the involvement of scavenger receptors in the modified HSA uptake by macrophages. RNA interference was used to silence the genes encoding the three main scavenger receptors in macrophages, SR-A1 (encoded by MSR1), SR-B2 (encoded by CD36) and LOX-1 (encoded by ORL1). Knockdown was confirmed at the RNA and protein levels (Figure S2). Two siRNA constructs were tested per scavenger receptor, and samples were analyzed for RNA and protein expression (Figure S2). For further studies, siRNA construct number one was used for MSR1 and CD36, and siRNA construct number two was applied for ORL1 silencing. Uptake of modified HSA measured by flow cytometry was significantly reduced only when MSR1 was knocked down (P<0.01) (Figure 4). When MSR1 was silenced, uptake of modified HSA probes decreased by 30%. Silencing of CD36 and ORL1 had no significant effect on receptor-mediated uptake of modified HSA (Figure 4).
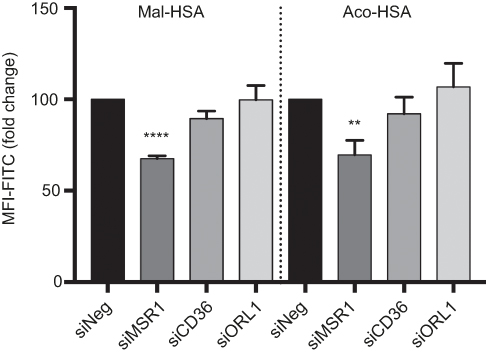 | Figure 4 Flow cytometry analysis of uptake of FITC-conjugated probes after 1h incubation, showing a significant 30% decrease in modified HSA probe uptake when MSR1 (SR-A1 gene) was silenced in THP-1 macrophages.Notes: No significant decrease in modified HSA probe uptake was observed when CD36 and ORL1 (LOX-1 gene) receptor expression was silenced. The results shown are pooled data from two independent experiments (triplicate wells). Data are presented as mean fold change in FITC MFI and SD. **P<0.01, ****P≤0.0001 (ordinary one-way ANOVA and Dunnett’s multiple comparison test (siRNA compared with siNeg control)). Abbreviations: HSA, human serum albumin; siNeg, siNegative; MFI, median fluorescence intensity. |
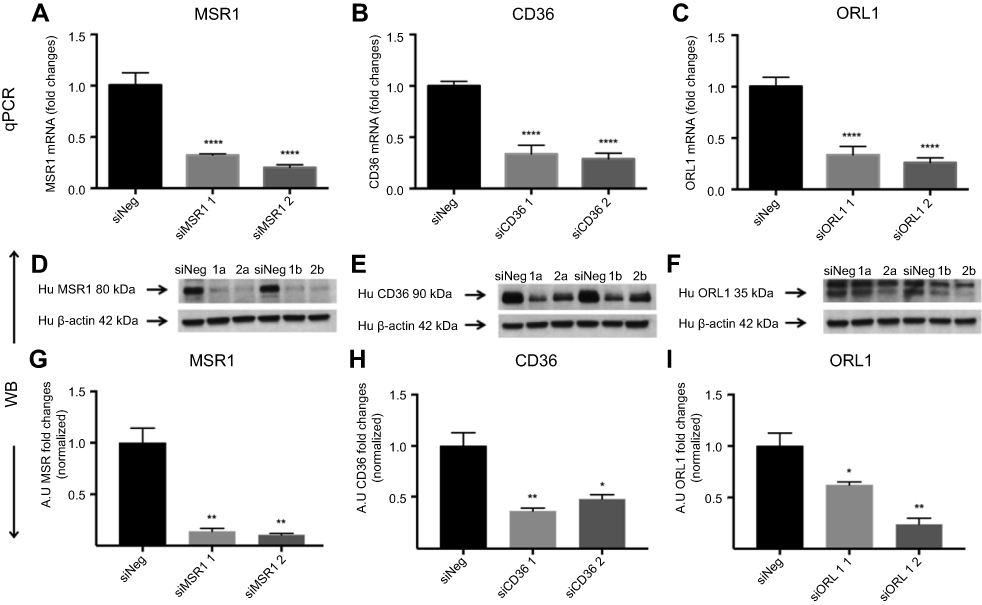 | Figure S2 Receptor silencing. (A–C) represent comparisons of qPCR data and fold changes in siRNA levels for MSR1, CD36 and ORL1 for two different silencers per gene. Data showed a 60–80% reduction compared with siNeg control. (D–F) show immunoblotting data for the same siRNAs. (G–I) Band intensities were measured in Fiji ImageJ.Notes: Bar charts show the decrease in protein expression levels after silencing presented as arbitrary units (AU) and normalized for loading controls. The results are pooled data from two independent experiments (technical duplicates) with mean and SD. *P<0.05, **P<0.01, ****P≤0.0001 (ordinary one-way ANOVA and Dunnett’s multiple comparison test (siRNA compared with siNeg)). Abbreviation: siNeg, siNegative. |
Results of experiments using pharmacologic inhibition of receptor-mediated uptake confirmed these findings. Blockage of class A receptors using dextran sulfate resulted in a modest but significant 16% decrease in the uptake of Mal-HSA by THP-1 macrophages (P<0.05), and interference with phagocytosis by cytochalasin D reduced uptake of Mal-HSA probe by approximately 36% compared with vehicle (P<0.05) (Figure S3).
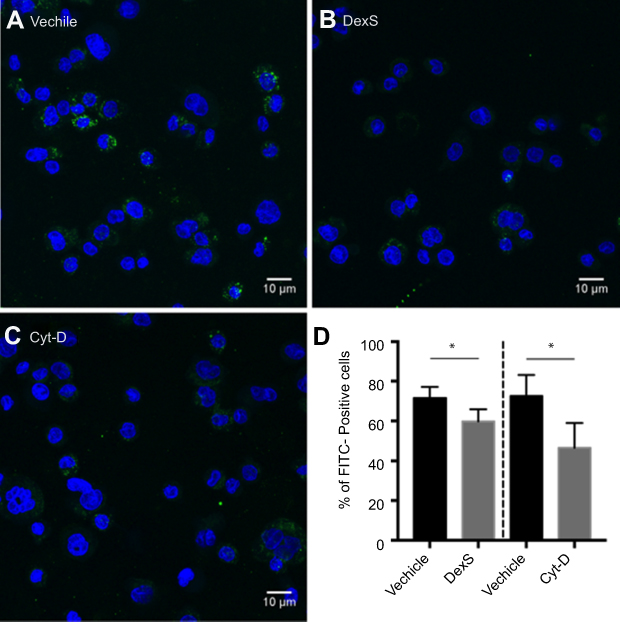 | Figure S3 Blocking of phagocytic activity. Confocal images of THP-1 macrophages incubated with Mal-HSA-FITC for 3 h and pretreated with (A) vehicle, (B) DexS or (C) Cyt-D for 30 min.Notes: Nuclear staining DAPI (blue), FITC-conjugated Mal-HSA (green). (D) Data showed a significant decrease in cellular uptake of FITC-labeled Mal-HSA probes pretreated with DexS or Cyt-D. No uptake of FITC-labeled HSA probes was observed (results not shown). Results shown are pooled data from technical duplicates (5 images/well) presented as mean and SD. *P<0.05 (unpaired t-test with Welch’s correction). Abbreviations: DexS, dextran sulfate; Cyt-D, cytochalasin D. |
In competition studies using modified LDL particles that bind preferentially to different scavenger receptors (oxLDL→CD36, MDA-LDL→SR-A),44 a significant (P<0.05) decrease in uptake by macrophages was observed when modified HSA was incubated together with MDA-LDL but not when it was incubated with oxLDL (Figure 5) or native LDL (Figure S4). Together, these data suggested that SR-A1 is the major receptor involved in uptake of Mal- or Aco-modified HSA by macrophages.
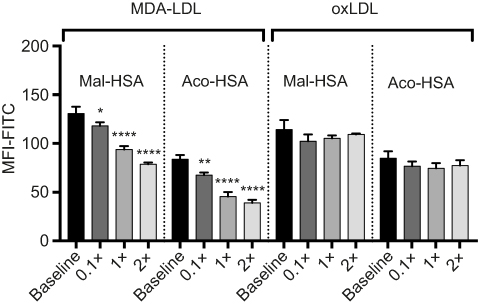 | Figure 5 Flow cytometry analysis of FITC-conjugated probe uptake in relation to the addition of increasing concentrations of MDA-LDL (x=0.1 μM). MDA-LDL competed with Mal- and Aco-HSA for receptor-mediated uptake via SR-A1.Notes: Addition of twice the concentration of MDA-LDL resulted in significant 40% and 53% decreases in the uptake of Mal-HSA and Aco-HSA, respectively compared with baseline (0.1 μM of modified HSA probe) after 1 h incubation. No significant competition was observed with oxLDL. The results shown are pooled data from two independent experiments (triplicate wells). Data are presented as mean FITC MFI and SD. *P<0.05, **P<0.01, ****P≤0.0001 (ordinary one-way ANOVA and Dunnett’s multiple comparison test). Each probe was analyzed separately. Abbreviation: MFI, median fluorescence intensity. |
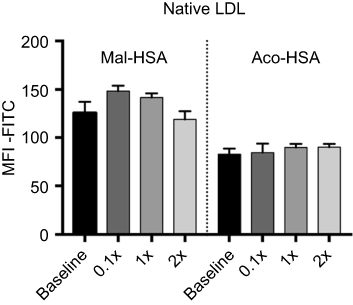 | Figure S4 Flow cytometry analysis of FITC-conjugated probe uptake in the presence of increasing concentrations of native LDL.Notes: Data are presented as mean FITC MFI and SD. No significant competition was observed with native LDL (x=0.1 μM) (ordinary one-way ANOVA). Abbreviation: MFI, median fluorescence intensity. |
Cellular uptake of radiolabeled probes
To allow their possible clinical application in radionuclide imaging, probes were labeled with 89Zr and the time course of their uptake by THP-1 macrophages evaluated. Radiotracer uptake was measured using a gamma counter and counts were adjusted for the number of cells, radioactive decay and added activity (1 MBq). Results were consistent with those for FITC-labeled probes, indicating that it is the carboxyl group modification that contributes to the phagocytosis, not the HSA or FITC. The uptake of radiotracers with modified HSA increased with incubation time (Figure 6A). Preincubation with 1 mg of nonradiolabeled modified HSA probes significantly (P<0.01) reduced radiotracer uptake by THP-1 macrophages (Figure 6B), indicating a limit to the uptake of the modified HSA radiotracers. Because Mal-HSA performed better than Aco-HSA in several experimental protocols we decided to use only Mal-HSA for human primary macrophage studies.
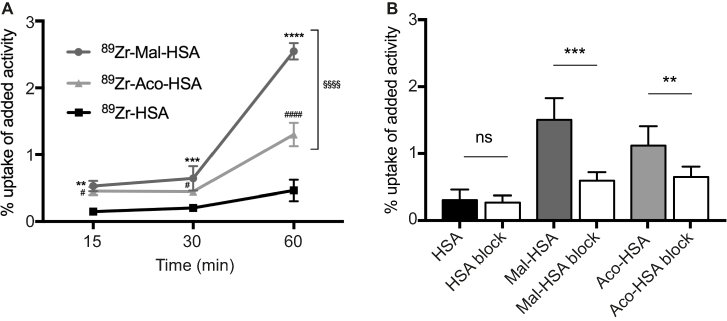 | Figure 6 Evaluation of radiolabeled probes by 89Zr-gamma radiation measurements.Notes: (A) Uptake of modified HSA probes by THP-1 macrophages was already detectable at 15 min and increased over time. All modified probes 89Zr-Mal-HSA and 89Zr-Aco-HSA showed significant differences compared with 89Zr-HSA. **P<0.01, ***P<0.001, ****P<0.0001 for Mal-HSA vs HSA; #P<0.05, ####P<0.0001 for Aco-HSA vs HSA, §§§§P<0.0001 for Mal-HSA vs Aco-HSA (ordinary two-way ANOVA (factors: treatment and time) and Tukey’s multiple comparisons test). (B) In vitro blocking: Uptake of 89Zr-Mal-HSA and 89Zr-Aco-HSA decreased approximately 60% and 40%, respectively, after 15 min blocking followed by 1 h probe incubation. No significant differences were observed between HSA and HSA-block. (ns=nonsignificant **P<0.01, ***P<0.001 (unpaired t-test with Welch’s correction). The results shown in (A) and (B) are pooled data from two independent experiments (triplicate wells). Data show mean percentage uptake of added radioactivity per 100,000 cells and SD.Abbreviation: HSA, human serum albumin. |
Uptake in primary human macrophages
Probe uptake was also studied in cytokine-polarized macrophages. Different subsets of macrophages were able to recognize Mal-HSA, and its uptake was significantly (P<0.0001) higher in M0 and M2 human macrophages than in M1 human macrophages (Figure 7). Interestingly, uptake was fastest in M0 but reached a plateau after 2 h, while uptake in M2 increased constantly over the experimental period. Blocking SR-A1 using a specific anti-SR-A1 antibody resulted in a reduction in probe uptake by M0 and M2 macrophages of 40–50%, consistent with previous results (Figure 8).
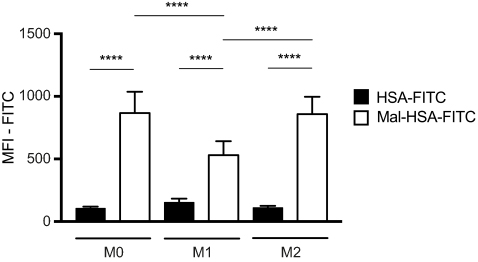 | Figure 7 Flow cytometry analysis of probe uptake in three different types of polarized macrophages.Notes: M0 and M2 take up Mal-HSA probes significantly better than M1 after 1 h probe incubation. No significant differences were observed between M0 and M2 cells incubated with Mal-HSA-FITC. The results represent data from six donors in technical duplicates. Data are presented as mean FITC MFI and SD. ****P<0.0001 (ordinary two-way ANOVA (factors: treatment and cell phenotype) and Tukey’s multiple comparison test). Abbreviations: HSA, human serum albumin; MFI, median fluorescence intensity. |
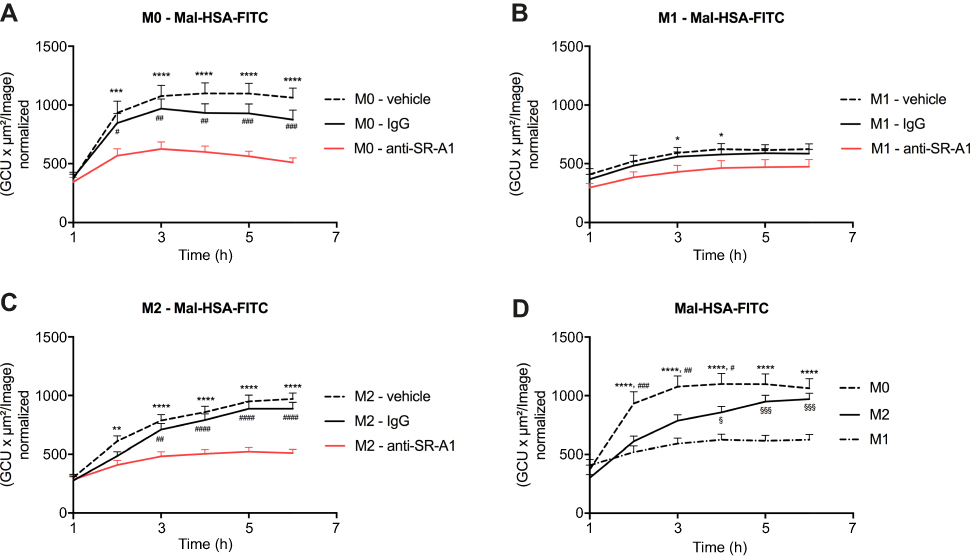 | Figure 8 Receptor blocking. Evaluation of Mal-HSA-FITC uptake over time by human primary macrophages measured by real-time microscopy.Notes: (A) M0, (B) M1 and (C) M2 polarized macrophages preincubated with either vehicle control (dashed line), anti-SR-A1 blocking antibody (red), or IgG1 isotype control (continuous line). (D) Comparison of the uptake capability of differently polarized macrophages. The results represent data from three donors in technical triplicates (9 images/well and timepoint) and are presented as mean and SEM. In (A–C): *P<0.05, **P<0.01, ***P<0.001, ****P<0.0001 for vehicle vs anti-SR-A1; #P<0.05, ##P<0.01, ###P<0.001, ####P<0.0001 for IgG vs anti-SR-A1. In (D) ****P<0.0001 for M0 vs M1; #P<0.05, ##P<0.01, ###P<0.001 for M0 vs M2; §P<0.05, §§§P<0.001 for M2 vs M1 (repeated measures two-way ANOVA (factors: treatment and time) and Tukey’s multiple comparison test). Abbreviations: HSA, human serum albumin; GCU, green calibration unit. |
We also tested probe uptake by other types of vascular cells. Almost no uptake of the modified HSA probe was observed with either cultured primary HCtSMCs or HUVECs (Figure 9). There was no obvious effect of probe incubation on the morphological features of these cells.
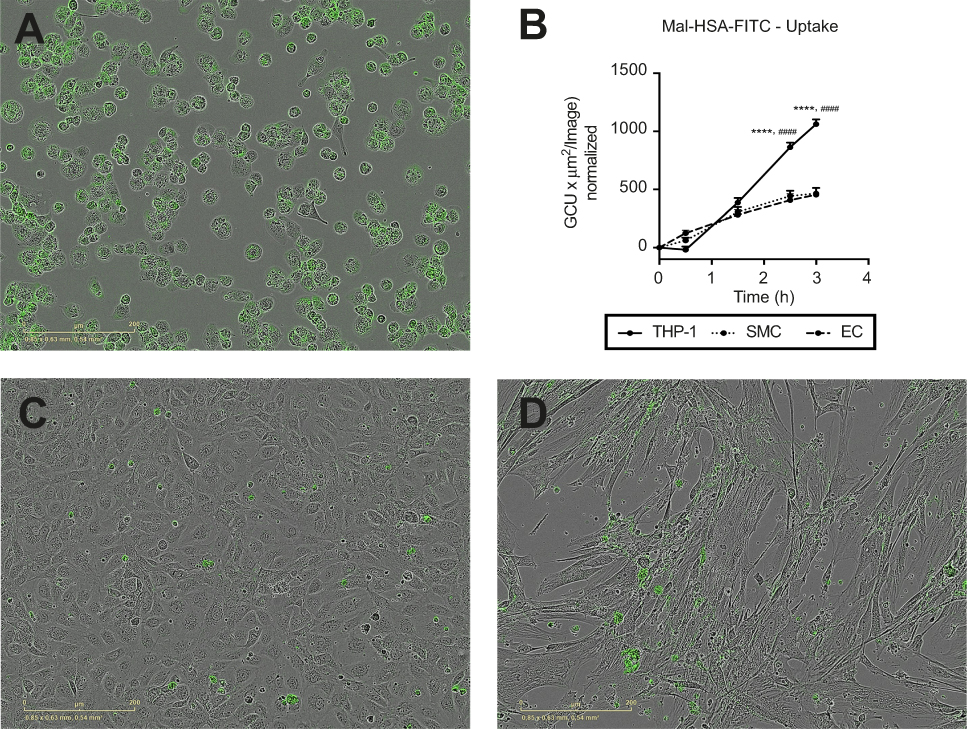 | Figure 9 Evaluation of Mal-HSA-FITC uptake by different cell types. Fluorescence microscopy images of Mal-HSA-FITC probes (green) incubated for 3 h with (A) THP-1 macrophages, (C) HUVECs (EC), and (D) HCtSMCs (SMC). (B) Mal-HSA-FITC uptake by different cell types plotted against time. The results represent data from technical triplicates (9 images/well and timepoint) and are presented as mean and SEM. Data show significantly increased uptake of modified HSA probes by THP-1 cells compared with HUVEC (****P<0.0001) and HCtSMCs (####P<0.0001) at 2.5 h and 3 h. None of the cell types recognized HSA-FITC (data not shown) (repeated measures two-way ANOVA (factors: cell type and time) and Tukey’s multiple comparison test).Abbreviations: HSA, human serum albumin; GCU, green calibration unit. |
Discussion
In this study, we present two modifications of HSA that promote its uptake by macrophages via scavenger receptor-mediated pathways, especially those mediated by the SR-A1 receptor. We showed that the Mal-HSA probe was recognized by different subsets of macrophages, and demonstrated the potential utility of 89Zr-labeled HSA radiotracers for imaging of inflammation in atherosclerosis.
All the FITC-, DFO-, Mal- and Aco-moieties bind mainly to the approximately 60 available lysyl amine groups, but can also bind to other available amine groups, eg, arginyl. It has previously been shown that the targeting efficiency increased with increasing numbers of maleylated amine sites.6,7,45 Therefore, to ensure the highest possible uptake by macrophages, we aimed for fully maleylated or aconitylated HSA. Mal-HSA was taken up slightly more efficiently than Aco-HSA, possibly because of the saturation of the available amine binding sites on HSA.2,46 Increasing the number of targeting motifs might improve the targeting efficacy of Aco-HSA. Other factors that may influence uptake are the size and ζ-potential of the probe. The latter depends on the particle charge, ionic strength and pH of the solution. Further, the accessibility of the targeting motifs that trigger phagocytosis is dependent on the macroscopic morphology of the HSA, ie, the folding of the protein of the different probes.8
We used human albumin-based probes based on the hypothesis that they would be more biocompatible for human molecular imaging applications than the previously reported Mal-BSA-based probes. Our findings add to previously reported studies on Mal-BSA probes by us and others,6–11,13,47 and provide new information about the binding of the SR-A receptor to Mal-HSA compared with Mal-BSA.11 This and other reports indicate that SR-A receptors are involved in Mal-HSA uptake,8,11 and our experiments using specific siRNA and blocking antibody against SR-A1 suggest that SR-A1 is the main receptor for specific uptake of Mal- and Aco-HSA by cultured macrophages. These findings were supported by the experiments with MDA-LDL, which competes for binding to the same receptor (SR-A1),11,47,48 and significantly decreased the uptake of Mal- and Aco-HSA. Although SR-A1 seems to be the main route of cellular uptake of modified HSA, a possible limitation is that we cannot exclude nonspecific uptake, and other receptors may also be involved in receptor-mediated uptake of both Mal-HSA and Aco-HSA.11,49 The silencing experiments resulted in an ~80% reduction of SR-A1 protein expression, but only a ~30% decrease in Mal-HSA uptake could be seen, indicating contribution from phagocytosis or macropinocytosis. Results from the Cytochalasin D inhibition also support this assumption. However, neither CD36/SR-B2 nor ORL1/LOX-1 detectably contributed to Mal-HSA uptake, and Mal-HSA did not appear to compete with oxLDL.
Finally, the relatively low probe concentration required for robust detectable uptake (0.1 μM in vitro) and its sorting into the endolysosomal compartment support the hypothesis that uptake is receptor mediated.
A mixed population of differently polarized macrophages is present throughout the course of atherosclerotic plaque evolution.31 Our data suggest that different subsets of primary human macrophages recognize Mal-HSA, indicating the probe’s potential to target lesional macrophages. In vitro polarized M2 and M0 macrophages incorporate FITC-labeled probes significantly more efficiently than M1 macrophages. This finding was predicted because typi-cal M1 macrophages downregulate SR-A1 expression (Available from:
Normal endothelial cells and smooth muscle cells (SMCs) do not express SR-A1,18,25 restricting their ability to take up Mal-HSA, and expression of SR-A1 is reported to be strongly but not exclusively associated with macrophages (Available from:
High specificity to target, low immunogenicity and toxicity are key requirements for imaging probes. HSA as well as maleylated albumin has been reported to have a low toxicity profile.2,3,7 Both Mal-HSA and Aco-HSA have shown high specificity to target. Other important features are the contrast-to-noise ratio of the radiolabeled probe as well as the stability of the 89Zr-DFO complex in vivo, which must be further optimized for clinical practice. However, DFO is the most commonly used chelator for 89Zr-complexation and good manufacturing practice (GMP)-compliant 89Zr is already commercially available, enabling the introduction in clinical routine.59 The positron emitter 89Zr is widely used in preclinical and clinical studies within the field of cancer medicine in conjugation to antibodies as a radionuclide for immuno-positron emission tomography (PET),59,60 and might have potential for vascular imaging applications.61–63 Molecular imaging of inflammation in atherosclerosis by targeting macrophages could help identify vulnerable plaques and monitor the effect of treatment. Development of new target-specific radiotracers could help direct individual patient-tailored diagnostics and treatment. This could shed light on the suitability of therapeutic interventions and identify patients who would benefit from newly developed anti-inflammatory drugs. 89Zr provides a long half-life of 78.41 h compared with other clinically available PET tracers, and is beneficial when imaging molecular processes in case of slowly-accumulating radiopharmaceuticals.59,64 However, a longer half-life is a potential limitation as it means higher radiation dose, which may limit the dose that could be administered for certain applications. An interesting future possibility is to modify albumin-based probes for use in dual-imaging applications, such as PET/magnetic resonance imaging (MRI), by radiolabeling and coupling paramagnetic gadolinium to the amine groups.13 We plan to evaluate the applicability of the modified probes as targeted tracers for in vivo radionuclide imaging of inflammation in atherosclerotic plaques as a step toward increasing the accuracy of prediction of vulnerable plaques and risk assessment.
Conclusion
Mal-HSA is taken up by different types of polarized macrophages. The cellular interaction is mainly driven by receptor-mediated uptake, primarily involving SR-A1 receptors. Both Mal- and Aco-HSA are promising probes for targeting macrophage scavenger receptors. The probes have potential as carriers of metal ions, enabling nuclear imaging and/or MRI applications, eg, PET/MRI of macrophage-rich vascular inflammation.
Acknowledgments
The study was supported by the Swedish Research Council (22036); the Swedish Heart Lung Foundation (20150423, 20170669); the Swedish state under the agreement between the Swedish government and the county councils, the ALF-agreement (20150517, 447561, 726481); Stiftelsen för Gamla Tjänarinnor; Stiftelsen för Ålderssjukdomar vid Karolinska Institutet; and Karolinska Institutet. We also thank Daniel Ketelhuth for scientific discussions and Malin Kronqvist for qPCR protocols and Harald Lund for material supply.
Author contributions
All authors contributed toward data analysis, drafting and revising the paper, gave final approval of the version to be published and agree to be accountable for all aspects of the work.
Disclosure
The authors report no conflicts of interest in this work.
References
1. Cao W, Lu X, Cheng Z. The advancement of human serum albumin-based molecular probes for molecular imaging. Curr Pharm Des. 2015;21(14):1908–1915.
2. Lee P, Wu X. Review: modifications of human serum albumin and their binding effect. Curr Pharm Des. 2015;21(14):1862–1865.
3. Sleep D, Cameron J, Evans LR. Albumin as a versatile platform for drug half-life extension. Biochim Biophys Acta. 2013;1830(12):5526–5534. doi:10.1016/j.bbagen.2013.04.023
4. Chuang VT, Kragh-Hansen U, Otagiri M. Pharmaceutical strategies utilizing recombinant human serum albumin. Pharm Res. 2002;19(5):569–577.
5. Goldstein JL, Ho YK, Basu SK, Brown MS. Binding site on macrophages that mediates uptake and degradation of acetylated low density lipoprotein, producing massive cholesterol deposition. Proc Natl Acad Sci U S A. 1979;76(1):333–337.
6. Gustafsson B, Hedin U, Caidahl K. Glycolaldehyde and maleyl conjugated human serum albumin as potential macrophage-targeting carriers for molecular imaging purposes. Contrast Media Mol Imaging. 2015;10(1):37–42. doi:10.1002/cmmi.1598
7. Gustafsson B, Youens S, Louie AY. Development of contrast agents targeted to macrophage scavenger receptors for MRI of vascular inflammation. Bioconjug Chem. 2006;17(2):538–547. doi:10.1021/bc060018k
8. Haberland ME, Fogelman AM. Scavenger receptor-mediated recognition of maleyl bovine plasma albumin and the demaleylated protein in human monocyte macrophages. Proc Natl Acad Sci U S A. 1985;82(9):2693–2697.
9. Haberland ME, Fong D, Cheng L. Malondialdehyde-altered protein occurs in atheroma of Watanabe heritable hyperlipidemic rabbits. Science. 1988;241(4862):215–218.
10. Haberland ME, Rasmussen RR, Fogelman AM. Receptor recognition of maleyl-albumin induces chemotaxis in human monocytes. J Clin Invest. 1986;78(3):827–831. doi:10.1172/JCI112647
11. Haberland ME, Rasmussen RR, Olch CL, Fogelman AM. Two distinct receptors account for recognition of maleyl-albumin in human monocytes during differentiation in vitro. J Clin Invest. 1986;77(3):681–689. doi:10.1172/JCI112362
12. Hamblin MR, Miller JL, Ortel B. Scavenger-receptor targeted photodynamic therapy. Photochem Photobiol. 2000;72(4):533–540.
13. Jarrett BR, Correa C, Ma KL, Louie AY. In vivo mapping of vascular inflammation using multimodal imaging. PLoS One. 2010;5(10):e13254. doi:10.1371/journal.pone.0013254
14. Kelley JL, Ozment TR, Li C, Schweitzer JB, Williams DL. Scavenger receptor-A (CD204): a two-edged sword in health and disease. Crit Rev Immunol. 2014;34(3):241–261.
15. Libby P. Assisted living in the atheroma: elderly macrophages promote plaques. Cell Metab. 2016;24(6):779–781. doi:10.1016/j.cmet.2016.11.013
16. Packard RR, Libby P. Inflammation in atherosclerosis: from vascular biology to biomarker discovery and risk prediction. Clin Chem. 2008;54(1):24–38. doi:10.1373/clinchem.2007.097360
17. Platt N, Gordon S. Is the class A macrophage scavenger receptor (SR-A) multifunctional? - The mouse’s tale. J Clin Invest. 2001;108(5):649–654. doi:10.1172/JCI13903
18. de Winther MP, van Dijk KW, Havekes LM, Hofker MH. Macrophage scavenger receptor class A: A multifunctional receptor in atherosclerosis. Arterioscler Thromb Vasc Biol. 2000;20(2):290–297.
19. Canton J, Neculai D, Grinstein S. Scavenger receptors in homeostasis and immunity. Nat Rev Immunol. 2013;13(9):621–634. doi:10.1038/nri3515
20. Krieger M. The other side of scavenger receptors: pattern recognition for host defense. Curr Opin Lipidol. 1997;8(5):275–280.
21. Murphy JE, Tedbury PR, Homer-Vanniasinkam S, Walker JH, Ponnambalam S. Biochemistry and cell biology of mammalian scavenger receptors. Atherosclerosis. 2005;182(1):1–15. doi:10.1016/j.atherosclerosis.2005.03.036
22. Prabhudas M, Bowdish D, Drickamer K, et al. Standardizing scavenger receptor nomenclature. J Immunol. 2014;192(5):1997–2006. doi:10.4049/jimmunol.1490003
23. PrabhuDas MR, Baldwin CL, Bollyky PL, et al. A consensus definitive classification of scavenger receptors and their roles in health and disease. J Immunol. 2017;198(10):3775–3789. doi:10.4049/jimmunol.1700373
24. Bieghs V, Verheyen F, van Gorp PJ, et al. Internalization of modified lipids by CD36 and SR-A leads to hepatic inflammation and lysosomal cholesterol storage in Kupffer cells. PLoS One. 2012;7(3):e34378. doi:10.1371/journal.pone.0034378
25. Hughes DA, Fraser IP, Gordon S. Murine macrophage scavenger receptor: in vivo expression and function as receptor for macrophage adhesion in lymphoid and non-lymphoid organs. Eur J Immunol. 1995;25(2):466–473. doi:10.1002/eji.1830250224
26. Ben J, Zhu X, Zhang H, Chen Q. Class A1 scavenger receptors in cardiovascular diseases. Br J Pharmacol. 2015;172(23):5523–5530. doi:10.1111/bph.13105
27. Zani IA, Stephen SL, Mughal NA, et al. Scavenger receptor structure and function in health and disease. Cells. 2015;4(2):178–201. doi:10.3390/cells4020178
28. Gough PJ, Gordon S. The role of scavenger receptors in the innate immune system. Microbes Infect. 2000;2(3):305–311.
29. Platt N, Haworth R, Darley L, Gordon S. The many roles of the class A macrophage scavenger receptor. Int Rev Cytol. 2002;212:1–40.
30. Pluddemann A, Neyen C, Gordon S. Macrophage scavenger receptors and host-derived ligands. Methods. 2007;43(3):207–217. doi:10.1016/j.ymeth.2007.06.004
31. Linton MF, Fazio S. Class A scavenger receptors, macrophages, and atherosclerosis. Curr Opin Lipidol. 2001;12(5):489–495.
32. Nakata A, Nakagawa Y, Nishida M, et al. CD36, a novel receptor for oxidized low-density lipoproteins, is highly expressed on lipid-laden macrophages in human atherosclerotic aorta. Arterioscler Thromb Vasc Biol. 1999;19(5):1333–1339.
33. Mietus-Snyder M, Gowri MS, Pitas RE. Class A scavenger receptor up-regulation in smooth muscle cells by oxidized low density lipoprotein. Enhancement by calcium flux and concurrent cyclooxygenase-2 up-regulation. J Biol Chem. 2000;275(23):17661–17670.
34. Loboda A, Jazwa A, Jozkowicz A, Molema G, Dulak J. Angiogenic transcriptome of human microvascular endothelial cells: effect of hypoxia, modulation by atorvastatin. Vascul Pharmacol. 2006;44(4):206–214. doi:10.1016/j.vph.2005.11.007
35. Moore KJ, Freeman MW. Scavenger receptors in atherosclerosis: beyond lipid uptake. Arterioscler Thromb Vasc Biol. 2006;26(8):1702–1711. doi:10.1161/01.ATV.0000229218.97976.43
36. Vosjan M, Perk LR, Visser GWM, et al. Conjugation and radiolabeling of monoclonal antibodies with zirconium-89 for PET imaging using the bifunctional chelate p-isothiocyanatobenzyl-desferrioxamine. Nat Protoc. 2010;5(4):739–743. doi:10.1038/nprot.2010.13
37. Laguna-Fernandez A, Checa A, Carracedo M, et al. ERV1/ChemR23 signaling protects against atherosclerosis by modifying oxidized low-density lipoprotein uptake and phagocytosis in macrophages. Circulation. 2018;138(16):1693–1705. doi:10.1161/CIRCULATION-AHA.117.032801
38. Zhou X, Paulsson G, Stemme S, Hansson GK. Hypercholesterolemia is associated with a T helper (Th) 1/Th2 switch of the autoimmune response in atherosclerotic apo E-knockout mice. J Clin Invest. 1998;101(8):1717–1725. doi:10.1172/JCI1216
39. Chellan B, Reardon CA, Getz GS, Hofmann Bowman MA. Enzymatically modified low-density lipoprotein promotes foam cell formation in smooth muscle cells via macropinocytosis and enhances receptor-mediated uptake of oxidized low-density lipoprotein. Arterioscler Thromb Vasc Biol. 2016;36(6):1101–1113. doi:10.1161/ATVBAHA.116.307306
40. Richter E, Ventz K, Harms M, Mostertz J, Hochgrafe F. Induction of macrophage function in human THP-1 cells is associated with rewiring of MAPK signaling and activation of MAP3K7 (TAK1) protein kinase. Front Cell Dev Biol. 2016;4:21. doi:10.3389/fcell.2016.00021
41. Forteza MJ, Polyzos KA, Baumgartner R, et al. Activation of the regulatory T-Cell/Indoleamine 2,3-dioxygenase axis reduces vascular inflammation and atherosclerosis in hyperlipidemic mice. Front Immunol. 2018;9:950. doi:10.3389/fimmu.2018.00950
42. Matic LP, Jesus Iglesias M, Vesterlund M, et al. Novel multiomics profiling of human carotid atherosclerotic plaques and plasma reveals biliverdin reductase B as a marker of intraplaque hemorrhage. JACC Basic Transl Sci. 2018;3(4):464–480. doi:10.1016/j.jacbts.2018.04.001
43.
44. Ling W, Lougheed M, Suzuki H, Buchan A, Kodama T, Steinbrecher UP. Oxidized or acetylated low density lipoproteins are rapidly cleared by the liver in mice with disruption of the scavenger receptor class A type I/II gene. J Clin Invest. 1997;100(2):244–252. doi:10.1172/JCI119528
45. Takata K, Horiuchi S, Morino Y. Scavenger receptor-mediated recognition of maleylated albumin and its relation to subsequent endocytic degradation. Biochim Biophys Acta. 1989;984(3):273–280.
46. Ahmed N, Dobler D, Dean M, Thornalley PJ. Peptide mapping identifies hotspot site of modification in human serum albumin by methylglyoxal involved in ligand binding and esterase activity. J Biol Chem. 2005;280(7):5724–5732. doi:10.1074/jbc.M410973200
47. Haberland ME, Fogelman AM, Edwards PA. Specificity of receptor-mediated recognition of malondialdehyde-modified low density lipoproteins. Proc Natl Acad Sci U S A. 1982;79(6):1712–1716.
48. Warnecke A, Abele S, Musunuri S, Bergquist J, Harris RA. Scavenger receptor a mediates the clearance and immunological screening of MDA-modified antigen by M2-type macrophages. Neuromolecular Med. 2017;19(4):463–479. doi:10.1007/s12017-017-8461-y
49. Miki Y, Koyama K, Kurusu H, Hirano K, Beppu M, Fujiwara Y. Nucleolin is a receptor for maleylated-bovine serum albumin on macrophages. Biol Pharm Bull. 2015;38(1):116–121. doi:10.1248/bpb.b14-00624
50. Tabas I, Bornfeldt KE. Macrophage phenotype and function in different stages of atherosclerosis. Circ Res. 2016;118(4):653–667. doi:10.1161/CIRCRESAHA.115.306256
51. Ingersoll MA, Spanbroek R, Lottaz C, et al. Comparison of gene expression profiles between human and mouse monocyte subsets. Blood. 2010;115(3):e10–19. doi:10.1182/blood-2009-07-235028
52. Allahverdian S, Francis GA. Cholesterol homeostasis and high-density lipoprotein formation in arterial smooth muscle cells. Trends Cardiovasc Med. 2010;20(3):96–102. doi:10.1016/j.tcm.2010.09.002
53. Chaabane C, Coen M, Bochaton-Piallat ML. Smooth muscle cell phenotypic switch: implications for foam cell formation. Curr Opin Lipidol. 2014;25(5):374–379. doi:10.1097/MOL.0000000000000113
54. Pidkovka NA, Cherepanova OA, Yoshida T, et al. Oxidized phospholipids induce phenotypic switching of vascular smooth muscle cells in vivo and in vitro. Circ Res. 2007;101(8):792–801. doi:10.1161/CIRCRESAHA.107.152736
55. Robbins CS, Hilgendorf I, Weber GF, et al. Local proliferation dominates lesional macrophage accumulation in atherosclerosis. Nat Med. 2013;19(9):1166–1172. doi:10.1038/nm.3258
56. Jaffer FA, Libby P, Weissleder R. Molecular and cellular imaging of atherosclerosis: emerging applications. J Am Coll Cardiol. 2006;47(7):1328–1338. doi:10.1016/j.jacc.2006.01.029
57. Narula J, Garg P, Achenbach S, Motoyama S, Virmani R, Strauss HW. Arithmetic of vulnerable plaques for noninvasive imaging. Nat Clin Pract Cardiovasc Med. 2008;5(Suppl 2):S2–10. doi:10.1038/ncpcardio1247
58. Virmani R, Burke AP, Kolodgie FD, Farb A. Vulnerable plaque: the pathology of unstable coronary lesions. J Interv Cardiol. 2002;15(6):439–446.
59. Fischer G, Seibold U, Schirrmacher R, Wangler B, Wangler C. (89)Zr, a radiometal nuclide with high potential for molecular imaging with PET: chemistry, applications and remaining challenges. Molecules. 2013;18(6):6469–6490. doi:10.3390/molecules18066469
60. Jauw YW, Menke-van der Houven van Oordt CW, Hoekstra OS, et al. Immuno-positron emission tomography with zirconium-89-labeled monoclonal antibodies in oncology: what can we learn from initial clinical trials? Front Pharmacol. 2016;7:131. doi:10.3389/fphar.2016.00323
61. Majmudar MD, Yoo J, Keliher EJ, et al. Polymeric nanoparticle PET/MR imaging allows macrophage detection in atherosclerotic plaques. Circ Res. 2013;112(5):755–761. doi:10.1161/CIRCRESAHA.111.300576
62. Perez-Medina C, Binderup T, Lobatto ME, et al. In vivo PET imaging of HDL in multiple atherosclerosis models. JACC Cardiovasc Imaging. 2016;9(8):950–961. doi:10.1016/j.jcmg.2016.01.020
63. Senders ML, Que X, Cho YS, et al. PET/MR imaging of malondialdehyde-acetaldehyde epitopes with a human antibody detects clinically relevant atherothrombosis. J Am Coll Cardiol. 2018;71(3):321–335. doi:10.1016/j.jacc.2017.11.036
64. Zhang Y, Hong H, Cai W. PET tracers based on Zirconium-89. Curr Radiopharm. 2011;4(2):131–139.
Supplementary materials
 © 2019 The Author(s). This work is published and licensed by Dove Medical Press Limited. The full terms of this license are available at https://www.dovepress.com/terms.php and incorporate the Creative Commons Attribution - Non Commercial (unported, v3.0) License.
By accessing the work you hereby accept the Terms. Non-commercial uses of the work are permitted without any further permission from Dove Medical Press Limited, provided the work is properly attributed. For permission for commercial use of this work, please see paragraphs 4.2 and 5 of our Terms.
© 2019 The Author(s). This work is published and licensed by Dove Medical Press Limited. The full terms of this license are available at https://www.dovepress.com/terms.php and incorporate the Creative Commons Attribution - Non Commercial (unported, v3.0) License.
By accessing the work you hereby accept the Terms. Non-commercial uses of the work are permitted without any further permission from Dove Medical Press Limited, provided the work is properly attributed. For permission for commercial use of this work, please see paragraphs 4.2 and 5 of our Terms.