")
Back to Journals » Diabetes, Metabolic Syndrome and Obesity » Volume 14
High-Throughput Screening of Mouse Gene Knockouts Identifies Established and Novel High Body Fat Phenotypes
Authors Powell DR , Revelli JP , Doree DD, DaCosta CM, Desai U, Shadoan MK, Rodriguez L, Mullens M, Yang QM, Ding ZM, Kirkpatrick LL, Vogel P, Zambrowicz B , Sands AT, Platt KA, Hansen GM , Brommage R
Received 27 May 2021
Accepted for publication 4 August 2021
Published 28 August 2021 Volume 2021:14 Pages 3753—3785
DOI https://doi.org/10.2147/DMSO.S322083
Checked for plagiarism Yes
Review by Single anonymous peer review
Peer reviewer comments 2
Editor who approved publication: Prof. Dr. Antonio Brunetti
David R Powell,1 Jean-Pierre Revelli,1 Deon D Doree,1 Christopher M DaCosta,1 Urvi Desai,1 Melanie K Shadoan,1 Lawrence Rodriguez,2 Michael Mullens,2 Qi M Yang,1 Zhi-Ming Ding,1 Laura L Kirkpatrick,3 Peter Vogel,1 Brian Zambrowicz,1– 3 Arthur T Sands,1– 3 Kenneth A Platt,3 Gwenn M Hansen,3 Robert Brommage1
1Department of Pharmaceutical Biology, Lexicon Pharmaceuticals, Inc, The Woodlands, TX, USA; 2Department of Information Technology, Lexicon Pharmaceuticals, Inc, The Woodlands, Tx, USA; 3Department of Molecular Biology, Lexicon Pharmaceuticals, Inc, The Woodlands, Tx, USA
Correspondence: David R Powell
Department of Pharmaceutical Biology, Lexicon Pharmaceuticals, Inc, 2445 Technology Forest Boulevard, The Woodlands, Tx, 77381, USA
Tel +1 713 249 3972
Fax +1 281 863 8115
Email [email protected]
Purpose: Obesity is a major public health problem. Understanding which genes contribute to obesity may better predict individual risk and allow development of new therapies. Because obesity of a mouse gene knockout (KO) line predicts an association of the orthologous human gene with obesity, we reviewed data from the Lexicon Genome5000TM high throughput phenotypic screen (HTS) of mouse gene KOs to identify KO lines with high body fat.
Materials and Methods: KO lines were generated using homologous recombination or gene trapping technologies. HTS body composition analyses were performed on adult wild-type and homozygous KO littermate mice from 3758 druggable mouse genes having a human ortholog. Body composition was measured by either DXA or QMR on chow-fed cohorts from all 3758 KO lines and was measured by QMR on independent high fat diet-fed cohorts from 2488 of these KO lines. Where possible, comparisons were made to HTS data from the International Mouse Phenotyping Consortium (IMPC).
Results: Body fat data are presented for 75 KO lines. Of 46 KO lines where independent external published and/or IMPC KO lines are reported as obese, 43 had increased body fat. For the remaining 29 novel high body fat KO lines, Ksr2 and G2e3 are supported by data from additional independent KO cohorts, 6 (Asnsd1, Srpk2, Dpp8, Cxxc4, Tenm3 and Kiss1) are supported by data from additional internal cohorts, and the remaining 21 including Tle4, Ak5, Ntm, Tusc3, Ankk1, Mfap3l, Prok2 and Prokr2 were studied with HTS cohorts only.
Conclusion: These data support the finding of high body fat in 43 independent external published and/or IMPC KO lines. A novel obese phenotype was identified in 29 additional KO lines, with 27 still lacking the external confirmation now provided for Ksr2 and G2e3 KO mice. Undoubtedly, many mammalian obesity genes remain to be identified and characterized.
Keywords: obesity, druggable, homologous recombination, gene trapping
Introduction
The obesity pandemic is a major public health problem. The global prevalence of obesity has increased steadily since 1980, and by 2015 108 million children and 604 million adults worldwide were obese.1,2 In the United States, the prevalence of obesity in adults increased from 33.7% in 2007–2008 to 42.4% in 2017–2018.3 These obesity estimates are based on body-mass index (BMI) data, calculated as weight/height2 (kg/meter2), with obesity defined as BMI ≥ 30. High BMI is a risk factor for many chronic diseases; in 2015, high BMI was linked globally to 4 million deaths and 120 million disability-adjusted life years.2,4 Clearly, there is a need for new interventions that effectively decrease the amount of body fat.
Human obesity, as represented by the surrogate measure BMI, has a genetic component that explains ~30% of the variability.5–9 The value in identifying genes responsible for this heritability is the potential to predict individual risk for future obesity and the potential to identify pathways and targets for therapeutic intervention. The first obesity genes were discovered by positional cloning studies using the obese mouse lines ob/ob and db/db, and by studying the agouti yellow obese mouse; these efforts identified leptin (LEP), leptin receptor (LEPR) and melanocortin 4 receptor (MC4R) as integral proteins regulating body fat in mice and humans. Investigating the role of these proteins in neural pathways controlling adiposity resulted in identification of a few additional genes that help to regulate mammalian body fat stores.10–14 To date, identifying these obesity genes has not led to therapies capable of reversing the obesity pandemic.
The inability of early linkage studies to identify loci linked to common obesity suggested correctly that numerous genetic variants make small individual contributions; currently, >250 GWAS loci are identified as minor contributors to BMI variance.8,15–18 Attempts to integrate these GWAS loci into a single genome-wide polygenic score that predicts individual obesity risk had limited success.19 Also, these GWAS loci rarely pinpoint novel therapeutic targets because most reside in introns as clusters of noncoding variants which likely regulate expression, not function, of a causal protein encoded by a gene which may be located far from the locus itself.16 A good example is the locus located in the first intron of FTO (fat mass and obesity associated). A role in obesity for the demethylase enzyme encoded by FTO is supported by loss of function mutations in mice, but not in humans,20,21 and recent studies link these FTO variants to altered expression of the nearby RPGRIP1L and distant IRX3 and IRX5 genes, with loss of function mutations of Irx3 and Rpgrip1l genes altering energy balance in mice.20–22 Of these 4 candidate genes, only FTO encodes a druggable protein by conventional standards, where druggable proteins are either secreted, accessible in vivo to a circulating antibody, or members of a protein family successfully targeted by small molecules.23–25 After a decade of research, the FTO locus has not yielded a mature drug discovery program. Most recently, an exome-wide search for low frequency and rare protein-altering variants (allele frequency < 5%) associated with BMI identified 8 novel obesity genes.16 These variants contributed little to BMI variation due to their rarity. However, this exome-sequencing approach has value over previous GWAS approaches because the genes responsible are identified.
Inactivating mutations in mouse genes often identify genes that regulate human body fat stores,26 clarify the physiologic role of GWAS-associated human genes,27 and mimic phenotypes resulting from human gene mutations.28 Also, mice with knockout (KO) mutations that inactivate the targets of drugs usually exhibit phenotypes consistent with the effects of those drugs in humans; this correlation between effects of genetic manipulation in mice and pharmacologic manipulation in humans suggests conservation of gene function.29,30 This correlation extends to body fat regulation; of 21 obesity gene targets reviewed, most showed a correspondence between KO phenotype and drug effect in rodents, and, when data existed, drug effect in humans.31,32 Together, these data suggest that coordinated KO of all mouse genes followed by phenotyping of viable KO lines for body fat content will identify genes playing a previously unrecognized role in human obesity.
Because mouse global KO phenotypes model drug effects, Lexicon Pharmaceuticals pursued, between 2000 and 2008, the high-throughput Genome5000TM program designed to KO and phenotype the druggable genome and reveal novel drug targets.29,33–37 We have reported the skeletal phenotypes identified by the primary high-throughput screen (HTS).37 The HTS also included assessment of body fat in two independent mouse cohorts fed either high fat diet (HFD) or chow.35 In a preliminary report, we showed that the HTS correctly identified body fat phenotypes in 13 benchmark KO lines.36 The present report extends these observations and summarizes our experience identifying established and novel high body fat phenotypes in our screen of the druggable genome.
Methods
Mouse Care and Study
All animal studies were performed in strict accordance with the recommendations in the Guide for the Care and Use of Laboratory Animals of the National Institutes of Health. Protocols for all studies were approved by the Lexicon Institutional Animal Care and Use Committee (OLAW Assurance Number, A4152-01; AAALAC International Accreditation Number, 001025). General methods for mouse care are published.36,38,39 Briefly, WT and KO mice were housed together, with a maximum of 5 mice/cage, in a temperature-controlled environment on a fixed 12-hour light/12-hour dark cycle and with free access to food and water. Unless stated otherwise, mice received standard rodent chow 9F 5020 (Purina, St. Louis, MO) as our chow diet, D12450B (Research Diets, New Brunswick, NJ) containing 10% of kcals from fat as our low-fat diet (LFD), or D12451 (Research Diets) containing 45% of kcals from fat as our high-fat diet (HFD). In a few studies, mice were fed a high-fat diet containing 60% kcals from fat (60% HFD; D12492, Research Diets). Pair-feeding studies were performed as described previously.40
Generation of Knockout Mice
Our approach to KO and phenotype mouse orthologs of the estimated 5000 potential drug targets in the human genome (Genome 5000TM project) is published.29,34–37,41–43 Briefly, Lexicon generated KO lines for the Genome 5000TM project by manipulating the mouse genome using either gene trapping (OmniBank® I) or homologous recombination technologies. Gene trapping mutagenesis in embryonic stem cells involves inserting DNA elements randomly into endogenous genes leading to transcriptional disruption and introduction of sequence tags. Oligonucleotide primers complementary to the gene-trap vector precisely localize the vector insertion site within the exon-intron organization of the gene, and gene disruption is confirmed using RT-PCR performed with oligonucleotide primers complementary to exons flanking the vector insertion site.37 This method permitted selection of druggable genes for KO generation. Because many factors place an upper limit on the percentage of genes that are efficiently trapped, gene KO by homologous recombination, which allows targeting of selected genes including those not targeted by gene trapping, was also employed. All mutations were generated in strain 129SvEvBrd-derived ES cells. Resulting chimeric mice were bred to C57BL/6J albino mice to generate F1 heterozygous (HET) progeny. These mice were intercrossed to generate F2 wild-type (WT), HET and KO (homozygous mutant) offspring, which were studied in our high-throughput primary phenotypic screen. All mice were on a C57BL/6J X 129SvEvBrd hybrid background. Genotyping was performed on tail DNA as described.44
Supplementary Table 1 lists official names and gene symbols for every gene with a KO line discussed here. The strategies for generating many of these KO lines are published, including Asnsd1;45 Htr2c, Brs3, Mc4r, Mc3r and Tsn;36 Ffar4 or Gpr120;46 G2e3;47 Hdac5;48 Ksr2;36,49 Prlhr;50 Slc6a4 or Sert;51 and Kiss1, Kiss1r, and Sost.37 The Mc3r and Mc4r KO lines were used to generate Mc3r/Mc4r double KO (DKO) mice. Supplementary Table 2 presents homologous recombination strategies for KO lines of Adamts4, Adamts18, Adm2, Ak5, Ankk1, Apln, Aqp7, AU040320, Ccn5, Cxxc4, Dgkg, Dpp8, Gpr45, Gpr61, Gpx7, Itih1, Lrrn2, Lrrtm1, Mfap3l, Ncs1, Npvf, Ntm, Oprm1, P2rx6, Pnpla2, Prok2, Prokr2, Ptprn, Pyy, Resp18, Retn, Retsat, Scg3, Sik2, Tnfsf13b, Usp13, Usp38 and Wnt8b. Supplementary Table 3 describes the location of gene trap insertion vectors for KOs of Adamts4, Adcy3, Aoc3, Ddah1, Enox1, Glrx2, Hdac6, Herc1, Igfbp2, Igdcc4, Kdm3a, Ncoa1, Nr4a1, Pecr, Prdx6, Prmt7, Ptp4a1, Rgs10, Scg3, Srpk2, St3gal2, Tenm3, Tle4, and Tusc3.
Primary High-Throughput Screen (HTS)
Our primary HTS consisted of a battery of tests performed on F2 mice, including audiology, behavior, hematology, serum chemistry, bone densitometry, histopathology, cardiology, metabolism, immunology, oncology and ophthalmology assays.35,37 Briefly, 2 cohorts of mice were studied. A cohort fed chow diet from weaning usually consisted of 4 WT, 4 HET and 8 KO mice, half male and half female, for each project. A cohort fed HFD from weaning consisted of up to 8 WT and 8 KO male mice for each project.
As part of this HTS, body composition was analyzed on both mouse cohorts. A cohort of 14-week old mice fed chow from weaning was screened, usually by dual-energy X-ray absorptiometry (DXA) using a GE/Lunar PIXImus scanner (GE Medical Systems, Madison, WI) but in a few instances by quantitative magnetic resonance (QMR) technology using a Bruker Minispec QMR Analyzer (ECHO Medical Systems, Houston, TX).36 Briefly, for each KO line, the mean KO % body fat/mean wildtype (WT) littermate % body fat ratio was calculated for both male and female mice, and then these male and female values were averaged to yield a normalized % body fat (n%BF) value. For most KO lines, 4 male KO, 2 male WT, 4 female KO and 2 female WT mice were studied. KO lines with fewer than 4 KO or 3 WT mice were excluded, except for X-linked lines where only male data were used, usually from 8 KO and 2 WT mice. A separate cohort of 11-week old male mice fed HFD from weaning was screened by QMR as described previously;49 all lines with between 3 and 8 KO mice and between 3 and 8 WT littermate controls were included in the analysis. The n%BF for each line was calculated as described for the chow-fed cohort. Also, for some KO lines, normalized body fat grams (nBFg) was calculated from BFg data and normalized lean body mass (nLBM) was calculated from LBM data, as described for n%BF. Historical mean and SD values for %BF and BFg were calculated using data from ~14500 WT mice studied in the chow-fed cohorts from 3758 independent KO lines and from ~16000 WT mice studied in the HFD-fed cohorts from 2475 independent KO lines.
Studies Using Additional Cohorts
Selected KO lines with high body fat identified in the primary chow and HFD screens were studied using additional mouse cohorts to determine if the HTS high body fat phenotype was reproducible. Additional KO lines were selected for further study based on published reports linking that KO to obesity. These body composition measurements were made using QMR or DXA technologies as described above. In addition to body composition, additional phenotyping assays were performed; methods for these assays are described below.
Blood Sample Analysis
Unless stated otherwise, blood was obtained from fed mice by retro-orbital bleed and serum assayed for glucose and total cholesterol by Cobas Integra 400 analyzer (Roche Diagnostics, Indianapolis, IN).35,39 Serum leptin levels were measured using an ELISA kit (Mouse Leptin, Crystal Chem, Downers Grove, IL).
VO2 and Physical Activity
VO2 and ambulatory activity were measured in Oxymax chambers (Oxymax, Columbus Instruments, Columbus, OH) as described previously.49 Gross motor activity was measured using the ER-4000 physiological measurement system (Mini Mitter, Bend, OR, USA). Three days after E-mitter transponders were surgically implanted into their peritoneal cavity, mice were placed in individual cages within range of an ER-4000 receiver, which measures activity by sensing the strength of the signal received from the E-mitter. Activity data for each mouse were collected in 10 min intervals for a total of 6 days (144 hours) using the VitalView Data Acquisition System (Mini Mitter); gross motor activity data were normalized such that mean WT activity = 100%.
Glucose Tolerance Tests
Glucose tolerance tests (GTTs) were performed on conscious, unanesthetized mice. After an overnight fast, mice were bled at baseline and then received 2 g/kg glucose by oral gavage (OGTT) or by intraperitoneal injection (IPGTT). Glucose levels from each mouse, obtained on whole blood samples at 0 (baseline), 30, 60, 90 and/or 120 minutes using an ACCU-CHEK Aviva glucometer (Roche, Indianapolis, IN) were used to calculate glucose area under the curve (AUC) values. Two additional serum aliquots obtained at 0 (baseline) and 30 minutes were used to measure insulin levels (Ultra-Sensitive Rat Insulin ELISA Kit, Cat. 90060; Crystal Chem).
Fertility Testing
For each project, 1–3 male and 2–4 female KO mice were examined. Each male KO mouse was bred to 2 WT females for 14 days. Each female KO mouse was bred individually with up to 3 WT males for 60 days. Pregnant females (KO and WT) were monitored daily for births; pups were counted at birth and at postnatal day 4 and were monitored daily for stomach milk content and for growth. Special care was taken not to disturb the litter environment.
Systolic Blood Pressure
Systolic blood pressure (SBP) was measured on conscious 10 to 13 week-old mice using a tail-cuff system (Visitech Systems, Apex, NC, USA). SBP was measured 10 times daily for 4 consecutive days, and the SBP value reported was the mean of the 40 SBP readings.52
Histopathology
Methods for general histopathology are published.49
External Public Database Resources
Human GWAS data identifying clusters of BMI, waist–hip ratio adjusted BMI, body fat percentage, weight and T2D single nucleotide polymorphism variants located within 1.2 MBP 5ʹ or 3ʹ of selected genes were obtained at https://hugeamp.org/ which links to the Common Metabolic Diseases Knowledge Portal; the 1.2 MBP distance was chosen because that is the distance at which FTO intronic variants influence IRX5 expression.22 For each gene, the distance between the cluster variant closest to the gene and the gene exon closest to that variant was calculated. Human gene expression data were obtained using the GTEx Portal at https://gtexportal.org/home/ [GTEx Analysis Release V8 (dbGaP Accession phs000424.v8.p2)]. HTS data for body weight (BW), body fat, fertility and/or total cholesterol levels from selected mutant mouse gene KO lines were obtained using the International Mouse Phenotyping Consortium (IMPC) database at https://www.mousephenotype.org (Data Release Version 14). The IMPC HTS typically examined 7 male and 7 female mutant and WT mice with body composition measured by DXA.53 Catalog designations and additional information on Lexicon KO models available at Taconic Biosciences were found at https://www.taconic.com/find-your-model/.
Statistics
Data are presented as mean ± SD. Comparisons between two groups were analyzed by unpaired Student’s t test; when variances between the two groups were significantly different, the data were analyzed using the nonparametric Mann–Whitney test. Comparisons among three groups were analyzed by one-way ANOVA with Tukey’s test used to correct for multiple comparisons. Two-way ANOVA was performed on body fat and LBM data from Mc3r KO, Mc4r KO, Mc3r/Mc4r DKO and WT littermate mice. Viability of KO lines was determined by chi-square testing of Mendelian ratios obtained at weaning. All statistical tests were performed using PRISM 4.03 (GraphPad Software, Inc., La Jolla, CA, USA). Differences were considered statistically significant when P<0.05.
Results
We obtained HTS body composition data on 3758 independent mouse gene KO lines with viable adult homozygous KO mice. Body fat was measured on chow-fed cohorts of WT and KO littermate mice from all 3758 KOs; 3650 KO lines were studied by DXA and 108 KOs were studied by QMR. For 2488 of these KO lines, body fat was also measured by QMR on an independent cohort of high fat diet-fed WT and KO littermate mice. HET mice, along with their WT littermates, were also examined in our HTS for 755 KO lines exhibiting homozygous lethality. For all but three genes with viable KO mice, the HET data were not analyzed because there were only 4 HET mice/KO line. For Adcy3, which is one of 90 KO lines showing reduced viability of homozygous KO mice prior to 10 weeks of age, data were pooled from 2 KO and 8 HET littermates. For Scg3, which had 2 independent KO lines, and Adamts4, which had 3 independent KO lines, data were pooled from 12 HET and 16 KO littermates, and from 12 HET and 24 KO littermates, respectively. For each of these three genes where data were available for at least 8 HET mice, HET and KO littermate mice showed a similar increase in body fat.
Obese KO Lines Studied with Both HTS and Additional Cohorts
Figure 1 shows HTS normalized percent body fat (n%BF) values for each of these KO lines within the distribution of values for all KO lines fed chow diet from weaning. Table 1 presents pooled n%BF data that combined, for each KO line, the HTS cohort data shown in Figure 1 with data from all additional cohorts. These obese KO lines studied with both HTS and additional cohorts are categorized here as follows: 1) Benchmarks, consisting of the 5 KO lines with increased body fat reported in two external publications that we used previously to validate our HTS,36 a crucial step which showed that, despite examining a small number of mice/KO line, our HTS was unlikely to report many false negatives in which high body fat was missed in specific gene KO lines; 2) KO lines first published by external groups that did not originally serve as benchmarks; and 3) Novel KO lines which consist of KO lines, either published or unpublished, that were first identified at Lexicon. For all normalized data, the mean WT value for each cohort is assigned a value of 100%. Table 2 presents human expression and associated GWAS BMI cluster data for selected non-benchmark KO lines presented in Table 1. Human expression data focus on CNS, hypothalamic and adipose tissues to provide insight into how the targeted gene might regulate body fat, because most obesity genes are expressed in the CNS and likely regulate food intake centrally through hypothalamic relays, while a few may have a direct effect on adipogenesis and/or fat storage by adipocytes.8,54 Data on human GWAS BMI clusters located close to the human orthologs of targeted mouse genes are presented to suggest that these human orthologs may be responsible for the GWAS BMI signals.
 |
Table 1 Normalized % Body Fat Data for KO Lines with Both HTS and Secondary Screen Cohorts |
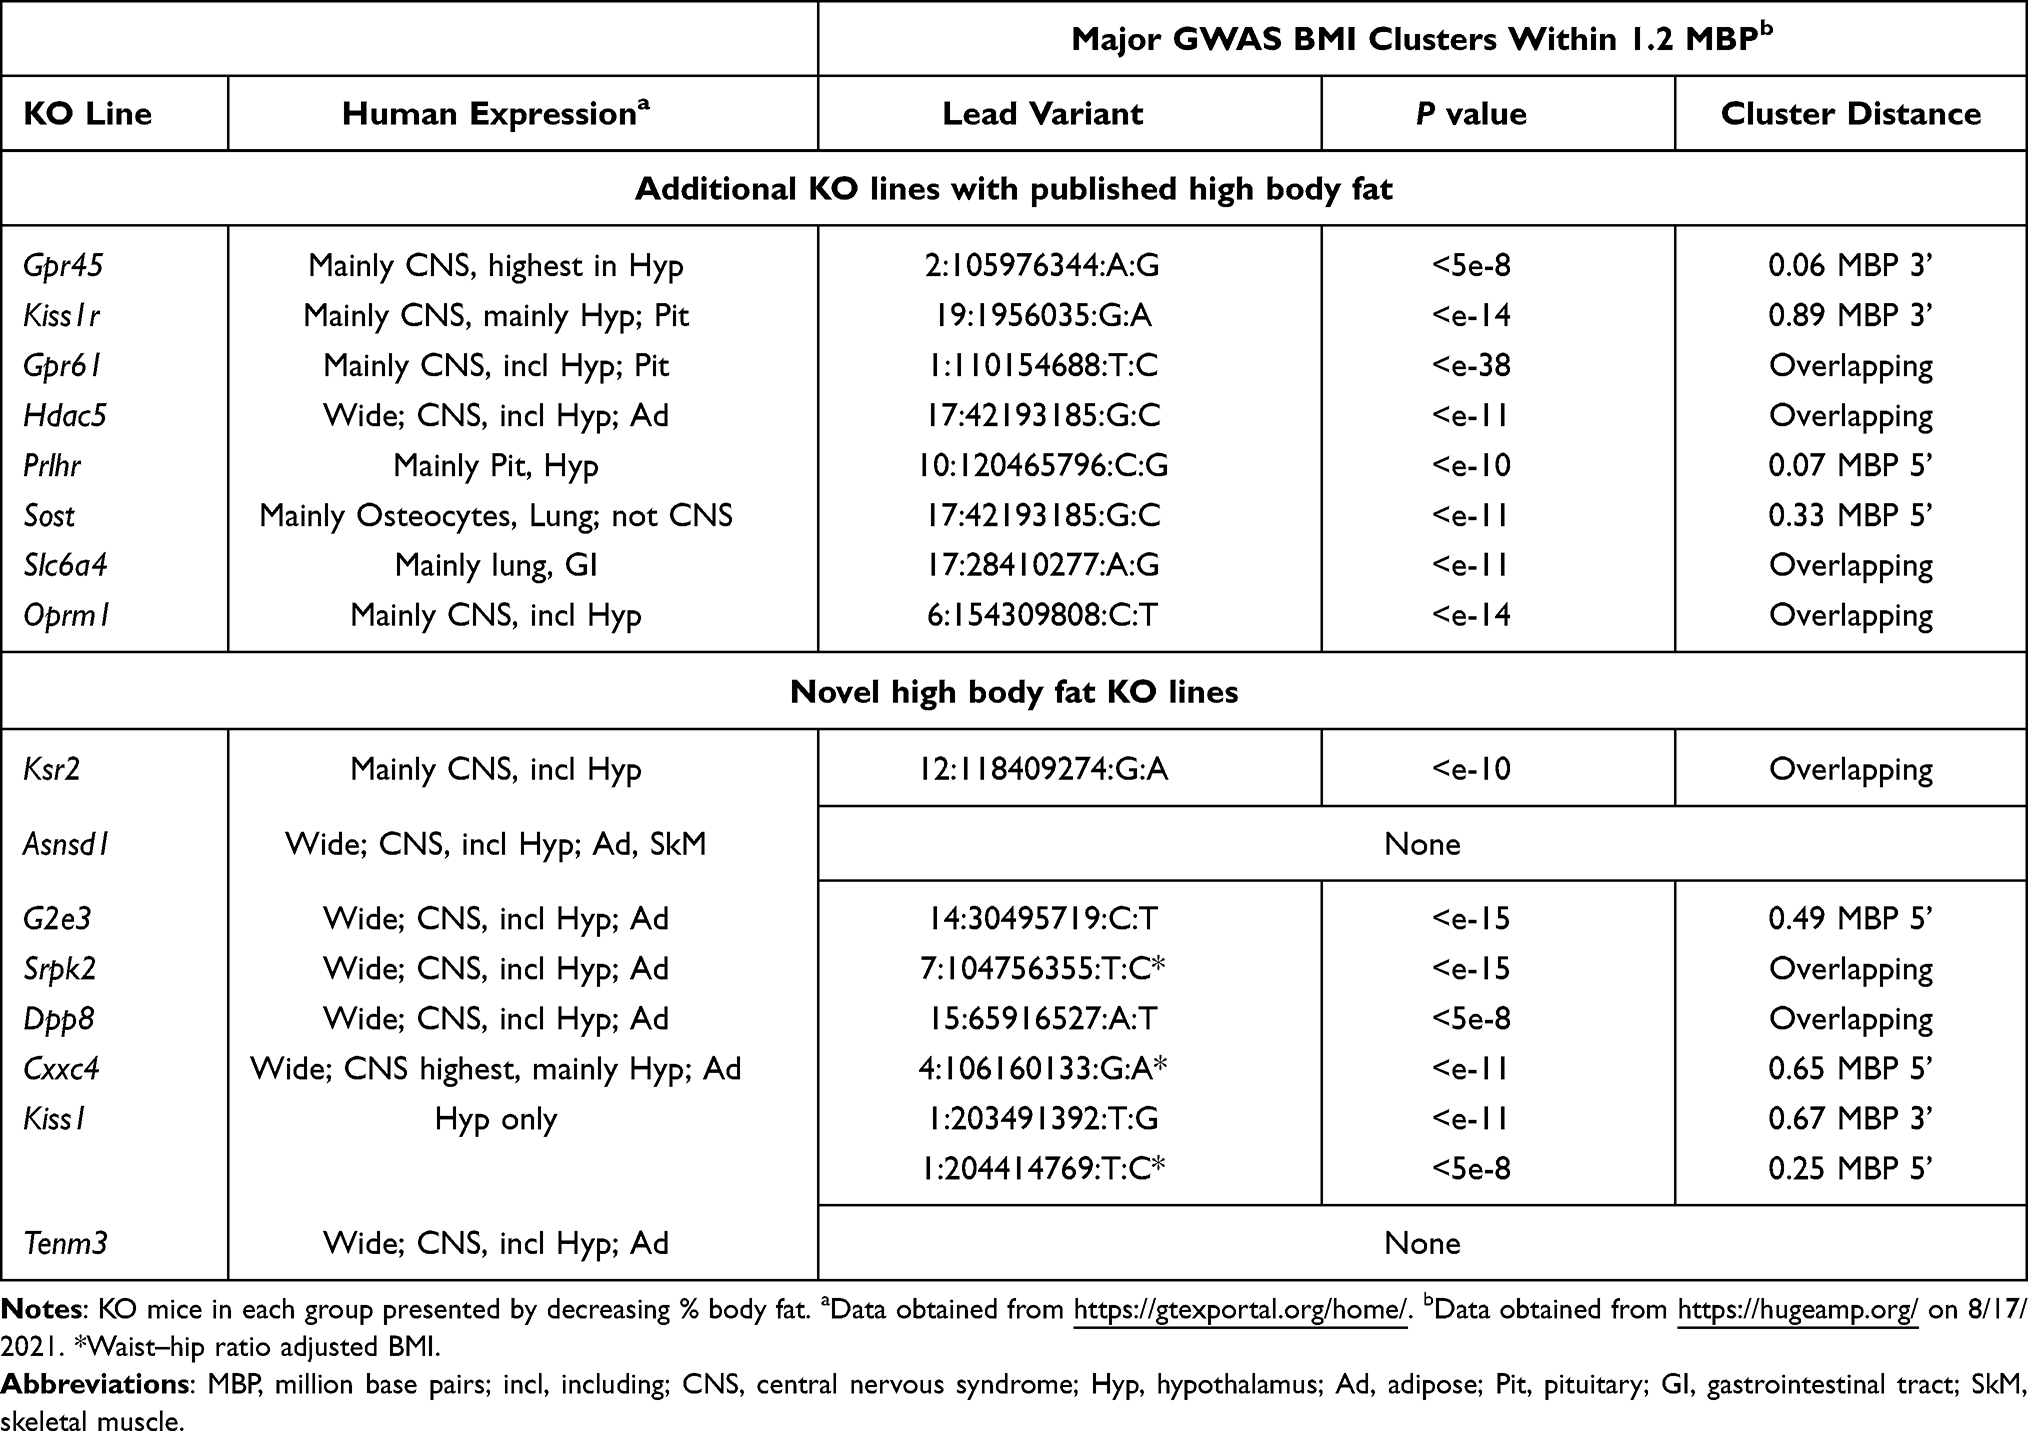 |
Table 2 Human Expression and GWAS Data on Selected Non-Benchmark Obese KO Lines with HTS and Secondary Screen Cohorts |
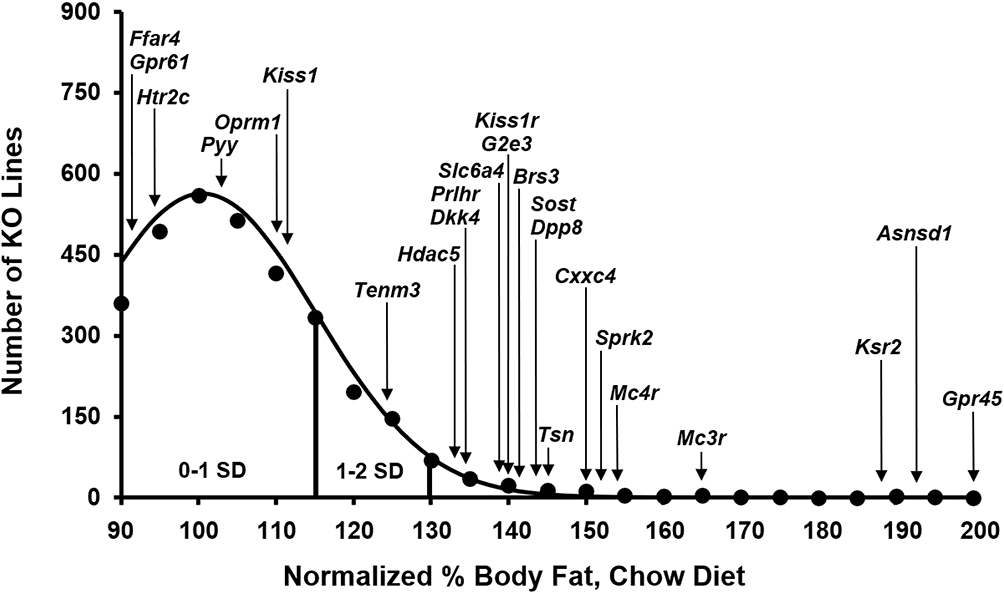 |
Figure 1 High-throughput screen (HTS) normalized %body fat (n%BF) values for individual well-studied KO lines within the distribution of HTS n%BF values for all 3650 individual KO lines maintained on chow diet from weaning. Body composition analyses performed by DXA on 14-week-old mice were used to calculate n%BF for the cohort from each individual KO line. Solid points indicate actual numbers of KO lines within that mean ± 2.5% value of n%BF. Curved line shows the calculated curve. The range for 1 and 2 SD from the population mean is indicated by lines located below the curve, and the mean n%BF value for the HTS cohort from each individual well-studied KO line is indicated by arrows above the curve. Some of these KO lines also had HTS data generated on an independent HFD-fed cohort; these KO lines and their n%BF data from the HFD-fed HTS cohort were: Pyy (101%), Sprk2 (106%), Dkk4 (107%), Htr2c (108%), Tenm3 (110%), Prlhr (111%), Oprm1 (123%), Hdac5 (132%), Dpp8 (134%), Mc4r (159%), Kiss1 (161%), G2e3 (164%), Asnsd1 (167%) and Ksr2 (189%). |
Benchmark KO Lines
We originally showed, using 5 benchmark KO lines with established obesity (Brs3,55,56 Tsn,57,58 Mc4r,13,59,60 Mc3r60–62 and Htr2c63,64) that our HTS correctly predicted the amount of body fat present in additional cohorts.36 Our data confirm published data showing that KO models for Brs3, Tsn, Mc4r, and Mc3r are obese. Our data also confirm that Tsn KO mice have low LBM, with nLBM of KO mice = 89 ± 9 (n=21) vs WT mice = 100 ± 5 (n=13), P<0.001; however, in contrast to published data, our Tsn KO mice had impaired glucose tolerance with OGTT glucose AUC of KO mice = 33227 ± 12131 (n=8) vs WT mice = 22978 ± 4187 mg*min/dL (n=9), P<0.05 by Mann Whitney test. In addition, analysis of our cohort of Mc3r/Mc4r DKO mice showed that the increased BFg of DKO mice is comparable to the combined increase observed in Mc3r and Mc4r KO mice, suggesting independent pathways of fat accumulation, and that only Mc4r KO mice have increased LBM (Supplementary Table 4), all confirming published data.60,62 In contrast, our Htr2c KO mice did not show significantly increased body fat either in the HTS or in additional cohorts36 despite the obesity reported in 2 independent Htr2c KO lines and the ability of the HTR2C inhibitor lorcaserin to both lower body fat in obese humans and lower food consumption in Htr2c WT, but not KO, mice.63–66 A review of HTS data for these benchmark KO lines found that the number of KO mice with %BF or BFg >2 SD above the historic mean, compiled with data from ~14500 WT mice in the chow fed HTS and ~16000 WT mice in the HFD HTS, was 15/16 for Mc4r, 3/8 for Mc3r, Brs3 and Tsn, and 1/16 for Htr2c; in contrast, the number of WT mice was 1/11 for Mc4r, 0/4 for Mc3r, Brs3 and Tsn, and 1/10 for Htr2c. This suggests that KO lines with marked obesity have many KO mice that are quite obese.
Additional Externally Published KO Lines Not Used as Benchmarks
GPR45 is an orphan GPCR with constitutive activity. External Gpr45 KO mice had increased body fat at weaning and developed progressive obesity due mainly to decreased energy expenditure, a conclusion based on studies performed during the development of obesity which showed that KO mice had comparable food intake, decreased energy expenditure and decreased physical activity relative to WT mice; these KO mice were also glucose intolerant with high plasma insulin and leptin levels, and displayed reduced hypothalamic proopiomelanocortin (POMC) expression suggesting a link to the melanocortin pathway.67 Our Gpr45 KO mice, first reported as the LG747 KO line,68 also had increased body fat at weaning and developed progressive obesity that was still present at 87 weeks of age (Supplementary Table 5). Although we did not observe differences in VO2 or physical activity between KO and WT littermates (Supplementary Table 6), a pair feeding study initiated at weaning showed clearly that obesity developed in male and female Gpr45 KO mice despite food intake that was comparable to that of their WT littermates (Supplementary Figure 1). Although we did not observe impaired glucose tolerance in our KO mice, we found increased insulin levels associated with severe insulin resistance, and increased serum levels of leptin, triglycerides and total cholesterol (Supplementary Table 7).
KISS1 is a neuropeptide that activates the hypothalamic-pituitary-gonadal axis by binding the hypothalamic G protein coupled receptor (GPCR) KISS1R; inactivating mutations in either gene result in delayed or absent puberty in mice and humans.69 Our Kiss1 and Kiss1r KO mice exhibited male and female hypogonadism and showed decreased bone mass consistent with hypogonadism.37 Published studies also found increased body fat in Kiss1r KO mice, more striking in females, and decreased LBM, more striking in males; these findings suggest a metabolic role for these genes.69,70 Our data confirm these findings for Kiss1r KO mice and show the same pattern for Kiss1 KO mice except that both male and female Kiss1 KO mice had increased body fat (Supplementary Table 8).
GPR61 is an orphan GPCR with constitutive activity. Gpr61 KO mice were reported as hyperphagic and obese with decreased hypothalamic Pomc expression that potentially links this GPR to the melanocortin pathway.71 Although Gpr61 KO mice were not obese in our HTS (Figure 1), sequence similarity of GPR61 to GPCRs activated by biogenic amines suggested druggability. This led us to study additional cohorts where we found that our Gpr61 KO mice were obese, with a 25% increase in n%BF (Table 1), a 45% increase in nBFg (KO=145 ± 56 vs WT=100 ± 35, P<0.001 by Mann–Whitney test) and a 4% increase in nLBM (KO=104 ± 14 vs WT=100 ± 8, P<0.001 by Mann Whitney test).
HDAC5 is an enzyme that influences hypothalamic leptin signaling, in part by STAT3 deacetylation.72 Our data confirmed that Hdac5 KO mice are obese; our KO mice had a 25% increase in n%BF (Table 1), a 19% increase in nBFg (KO=119 ± 41 vs WT=100 ± 29, P<0.05) and a 12% decrease in nLBM (KO=88 ± 12 vs WT=100 ± 7, P<0.001).
PRLHR is a GPCR that confers the ability of prolactin-releasing peptide (PrRP) to decrease food intake and increase energy expenditure, a role supported by the obesity observed in two independent Prlhr KO models50,73 and on the anorectic effects of PrRP when delivered to rats and Prlhr WT, but not KO, mice.74,75 Our studies confirm obesity in Prlhr KO mice; the KO mice showed a 20% increase in n%BF (Table 1) and a 35% increase in nBFg (KO=135 ± 58 vs WT=100 ± 32, P<0.01).
The serotonin reuptake transporter SLC6A4 regulates serotonin action and is a target of antidepressants that may affect food intake and BW. The obesity observed in KO mice by two groups studying the same Slc6a4 KO mouse model76,77 was confirmed in KO mice from our independent Slc6a4 KO line (Table 1).
RETN, a protein secreted by adipocytes in mice and macrophages in humans, impairs insulin action in rodents.78,79 Retn KO mice did not have increased BW but ob/ob mice lacking RETN were obese compared to ob/ob mice,78 as were transgenic mice expressing a dominant inhibitory form of RETN.79 Our Retn KO mice were modestly obese, consistent with the published data.
The SOST gene encodes sclerostin, an inhibitor of WNT signaling secreted mainly by osteocytes.80 In humans and mice, inactivating Sost mutations increase bone mineral density and strength.37,81 Recently, Sost KO mice and mice receiving sclerostin-neutralizing antibodies were found to have low body fat, while mice overexpressing sclerostin were obese, apparently due to altered WNT signaling in adipocytes.82 However, older work reported obesity in Sost KO mice,83 consistent with the finding that mice with an osteocyte-specific increase in sclerostin release had lower body fat and increased beiging of adipocytes;80 our data support these last two studies, with Sost KO mice showing modest increases of 17% in n%BF (Table 1) and 16% in nBFg (KO=116 ± 38 vs WT=100 ± 36, P<0.05 by Mann–Whitney test). This link between sclerostin and obesity is intriguing given recent evidence that a leptin-independent BW homeostat is dependent on osteocytes.84
The opioid system, particularly OPRM1, participates in neural reward processes leading to addictive behavior; many neural structures involved in addictive behavior are also involved in food reward, and opioid receptor antagonists inhibit intake of both addictive drugs and palatable diet.85 Consistent with these findings, %BF was lower in Oprm1 KO mice maintained on highly palatable HFDs;86,87 surprisingly, however, some but not all past studies found increased BW and/or %BF in Oprm1 KO mice fed less palatable chow diets.86–88 Oprm1 KO mice reported here had increased %BF (Table 1) and nBFg (KO=125 ± 20 vs WT=100 ± 29, P<0.001), with a similar increase in body fat for KO mice fed chow or HFD. These data suggest that Oprm1 KO mice may develop modest obesity when fed certain diets.
PYY is a gastrointestinal peptide that induces central satiety. In some Pyy KO mouse studies, body fat was increased in male KO mice fed chow89 or HFD90 and in female KO mice fed chow90 or HFD,91 but in other studies, body fat was not increased in male KO mice fed chow90–93 or HFD91 and in female KO mice fed chow.91,92 Body fat was not increased in our male and female KO mice fed chow and in our male KO mice fed HFD. These data suggest that PYY deficiency plays little if any role in regulating mammalian body fat, consistent with the lack of obesity in humans with rare genetic PYY variants.54
The GPCR FFAR4, a receptor for long chain free fatty acids (FFAs), purportedly mediates anti-obesity, anti-inflammatory and insulin sensitizing effects in vivo. In one study, BW was increased by 8 weeks of age in Ffar4 KO mice fed HFD, consistent with increased obesity risk in humans with the inactivating FFAR4 variant p.R270H.94 However, BW was not increased in multiple studies of Ffar KO mice fed chow94,95 or HFD,95–97 consistent with lack of obesity in our HFD-fed Ffar4 KO mice. Further, a FFAR4-selective agonist improved insulin sensitivity but not BW in WT mice and did not improve either parameter in Ffar4 KO mice, and recent studies failed to link FFAR4 variants, including p.R270H, to human obesity.98,99 These data suggest FFAR4 plays a minor, if any, role in regulating mammalian body fat.
Table 2 presents human gene expression and GWAS BMI data supporting the possibility that GPR45, GPR61, KISS1, KISS1R, HDAC5, PRLHR, SLC6A4, SOST and OPRM1 variants contribute to obesity in humans as they do in mice.
Novel KO Lines
The obesity of KO mice in nine KO lines reported here, including Kiss1 KO mice discussed above, is either a novel finding or was novel at the time the data were published by Lexicon Pharmaceuticals. KSR2 is a scaffold protein that likely coordinates signaling through kinase cascades. Our Ksr2 KO and HET mice were obese,36,40,49 with 11/12 of HTS KO mice and 0/10 of HTS WT mice >2SD above the historic mean for %BF or BFg. These findings were confirmed in independent internal and external Ksr2 KO models and in humans with KSR2 haploinsufficiency;40,49,100 the human phenotype is consistent with human expression data and with a GWAS cluster of BMI variants that overlaps with the KSR2 gene (Table 2). Here, we extend previous pair-feeding studies40 to show that the obesity is due to both hyperphagia and decreased energy expenditure, and that KO mice survive long term only when pair-fed, with all KO mice dying soon after resuming ad-lib feeding (Supplementary Figure 2).
ASNSD1 is an understudied asparagine synthetase. Asnsd1 KO mice have increased body fat and a progressive degenerative myopathy characterized by sarcopenia and myosteatosis;45 HTS data showed 11/13 KO mice and 0/9 WT mice >2SD above the historic mean for %BF or BFg. Asnsd1 KO mice have reduced viability (114 WT/251 HET/90 KO, P<0.05) that may be related to their seizures and low systolic blood pressure. Additional studies are required to determine the contribution of myosteatosis to the increased body fat. The human ASNSD1 expression pattern is consistent with a role for ASNSD1 deficiency in human obesity and myopathy (Table 2).
G2E3 is a dual function ubiquitin ligase.101 We observed obesity and impaired glucose tolerance in multiple cohorts of G2e3 KO mice;47 HTS data showed 11/16 KO mice and 0/11 WT mice >2SD above the historic mean for %BF or BFg. These data are consistent with IMPC HTS data showing obesity in an independent G2e3 KO model. The human gene resides 0.49 MBP 3ʹ to a GWAS BMI variant cluster and is expressed in a pattern consistent with a role in body fat regulation (Table 2).102–104
SRPK2 is a protein kinase overexpressed in many cancers.105 We observed obesity in each of 7 small cohorts of Srpk2 KO mice; when data were pooled and normalized, Srpk2 KO mice showed a 41% increase in n%BF (Table 1), a 51% increase in nBFg (KO=151 ± 62 vs WT=100 ± 34, P<0.001 by Mann Whitney test) and 5% decrease in nLBM (KO=95 ± 13 vs WT=100 ± 9, P<0.05 by Mann Whitney test). In humans, only the SRPK2 and KMT2E (lysine methyltransferase 2E) genes reside within a cluster of variants for waist–hip ratio adjusted BMI, a surrogate measure of abdominal adiposity;106 these observations, and the SRPK2 expression pattern, suggest that SRPK2 may regulate visceral fat stores (Table 2). In cultured cells with mTORC1 activation, SRPK2 knockdown inhibits de novo lipogenesis,105 reinforcing the need to study additional Srpk2 KO lines to confirm the phenotype reported here.
DPP8 is a cytoplasmic serine amino peptidase implicated in immune responses, cancer biology and cellular energy metabolism.107,108 Our Dpp8 KO mice were obese, with a 33% increase in n%BF (Table 1), a 60% increase in nBFg (KO=160 ± 50 vs WT=100 ± 26, P<0.001), and a nonsignificant 5% increase in nLBM (KO=105 ± 15 vs WT=100 ± 7); HTS data showed 9/16 KO mice and 0/12 WT mice >2SD above the historic mean for %BF or BFg. Dpp8 KO mice also had impaired glucose homeostasis; data pooled from 4 independent cohorts of Dpp8 KO and WT mice showed that KO mice had fasting blood glucose and OGTT AUC values comparable to WT mice but had greater OGTT insulin levels at baseline and at 30 minutes (Supplementary Figure 3). In humans, DPP8 is expressed in multiple tissues including adipose, hypothalamus, basal ganglia and amygdala, and the human gene overlaps with a GWAS BMI cluster, consistent with a role in human body fat regulation (Table 2).
CXXC4, which can inhibit cancer cell growth by inhibiting WNT/β-catenin signaling, contains a CXXC-type zinc finger domain that can modify DNA methylation status.109 Our Cxxc4 KO mice were obese, with a 31% increase in n%BF (Table 1) and a 46% increase in nBFg (KO=146 ± 53 vs WT=100 ± 31, P<0.001 by Mann Whitney test). In humans, CXXC4 is most highly expressed in hypothalamus (Table 2).
TENM3 and other teneurins are transmembrane proteins that participate in development of specific neuronal connectivity patterns.110 Tenm3 KO mice had a 21% increase in n%BF (Table 1) and 24% increase in nBFg (KO=124 ± 43 vs WT=100 ± 34, P<0.05). An independent model of Tenm3 KO mice had normal BW,111 consistent with an insignificant 2% increase in BW of our Tenm3 KO mice. In humans, TENM3 is expressed in many tissues including adipose and in CNS, where it is highly expressed in hypothalamus (Table 2).
Obese KO Lines Studied with HTS Cohorts Only
KO Lines with Significantly Increased Body Fat That Support External Obese KO Lines
For many KO lines with significantly increased body fat in our HTS, confirmatory studies using additional cohorts were not performed, but our data support body fat data from external independent KO lines that were either published or evaluated in the IMPC HTS. Table 3 summarizes our data for these KO lines, and Table 4 presents human gene expression and/or GWAS data consistent with a role for the human orthologs of these targeted genes in regulating body fat.
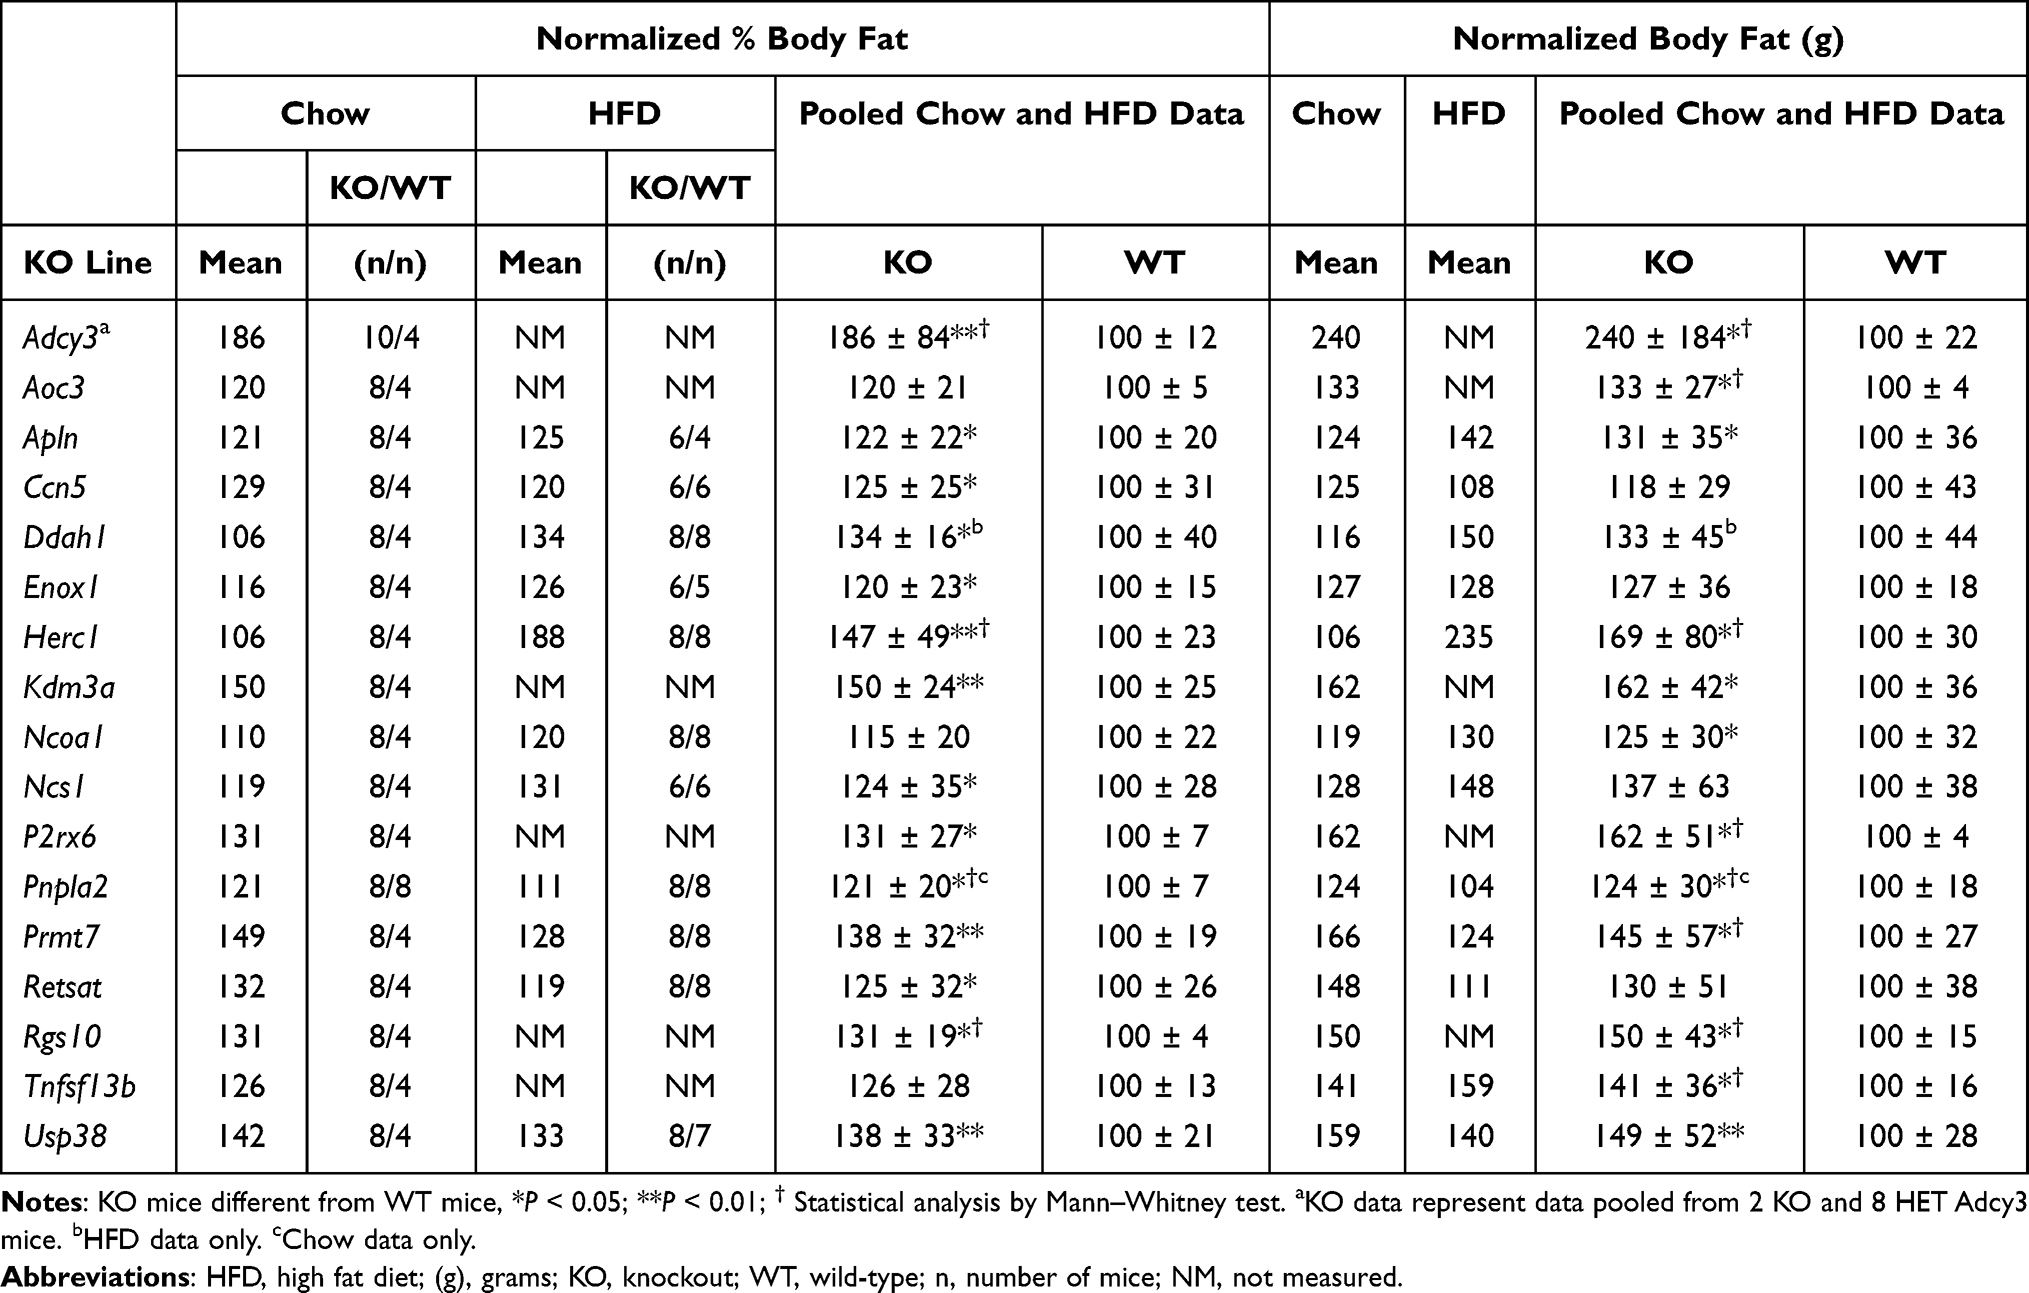 |
Table 3 Body Fat Data for KO Lines with Significantly Increased Body Fat by HTS Only That Supports an External KO Line with High Body Fat |
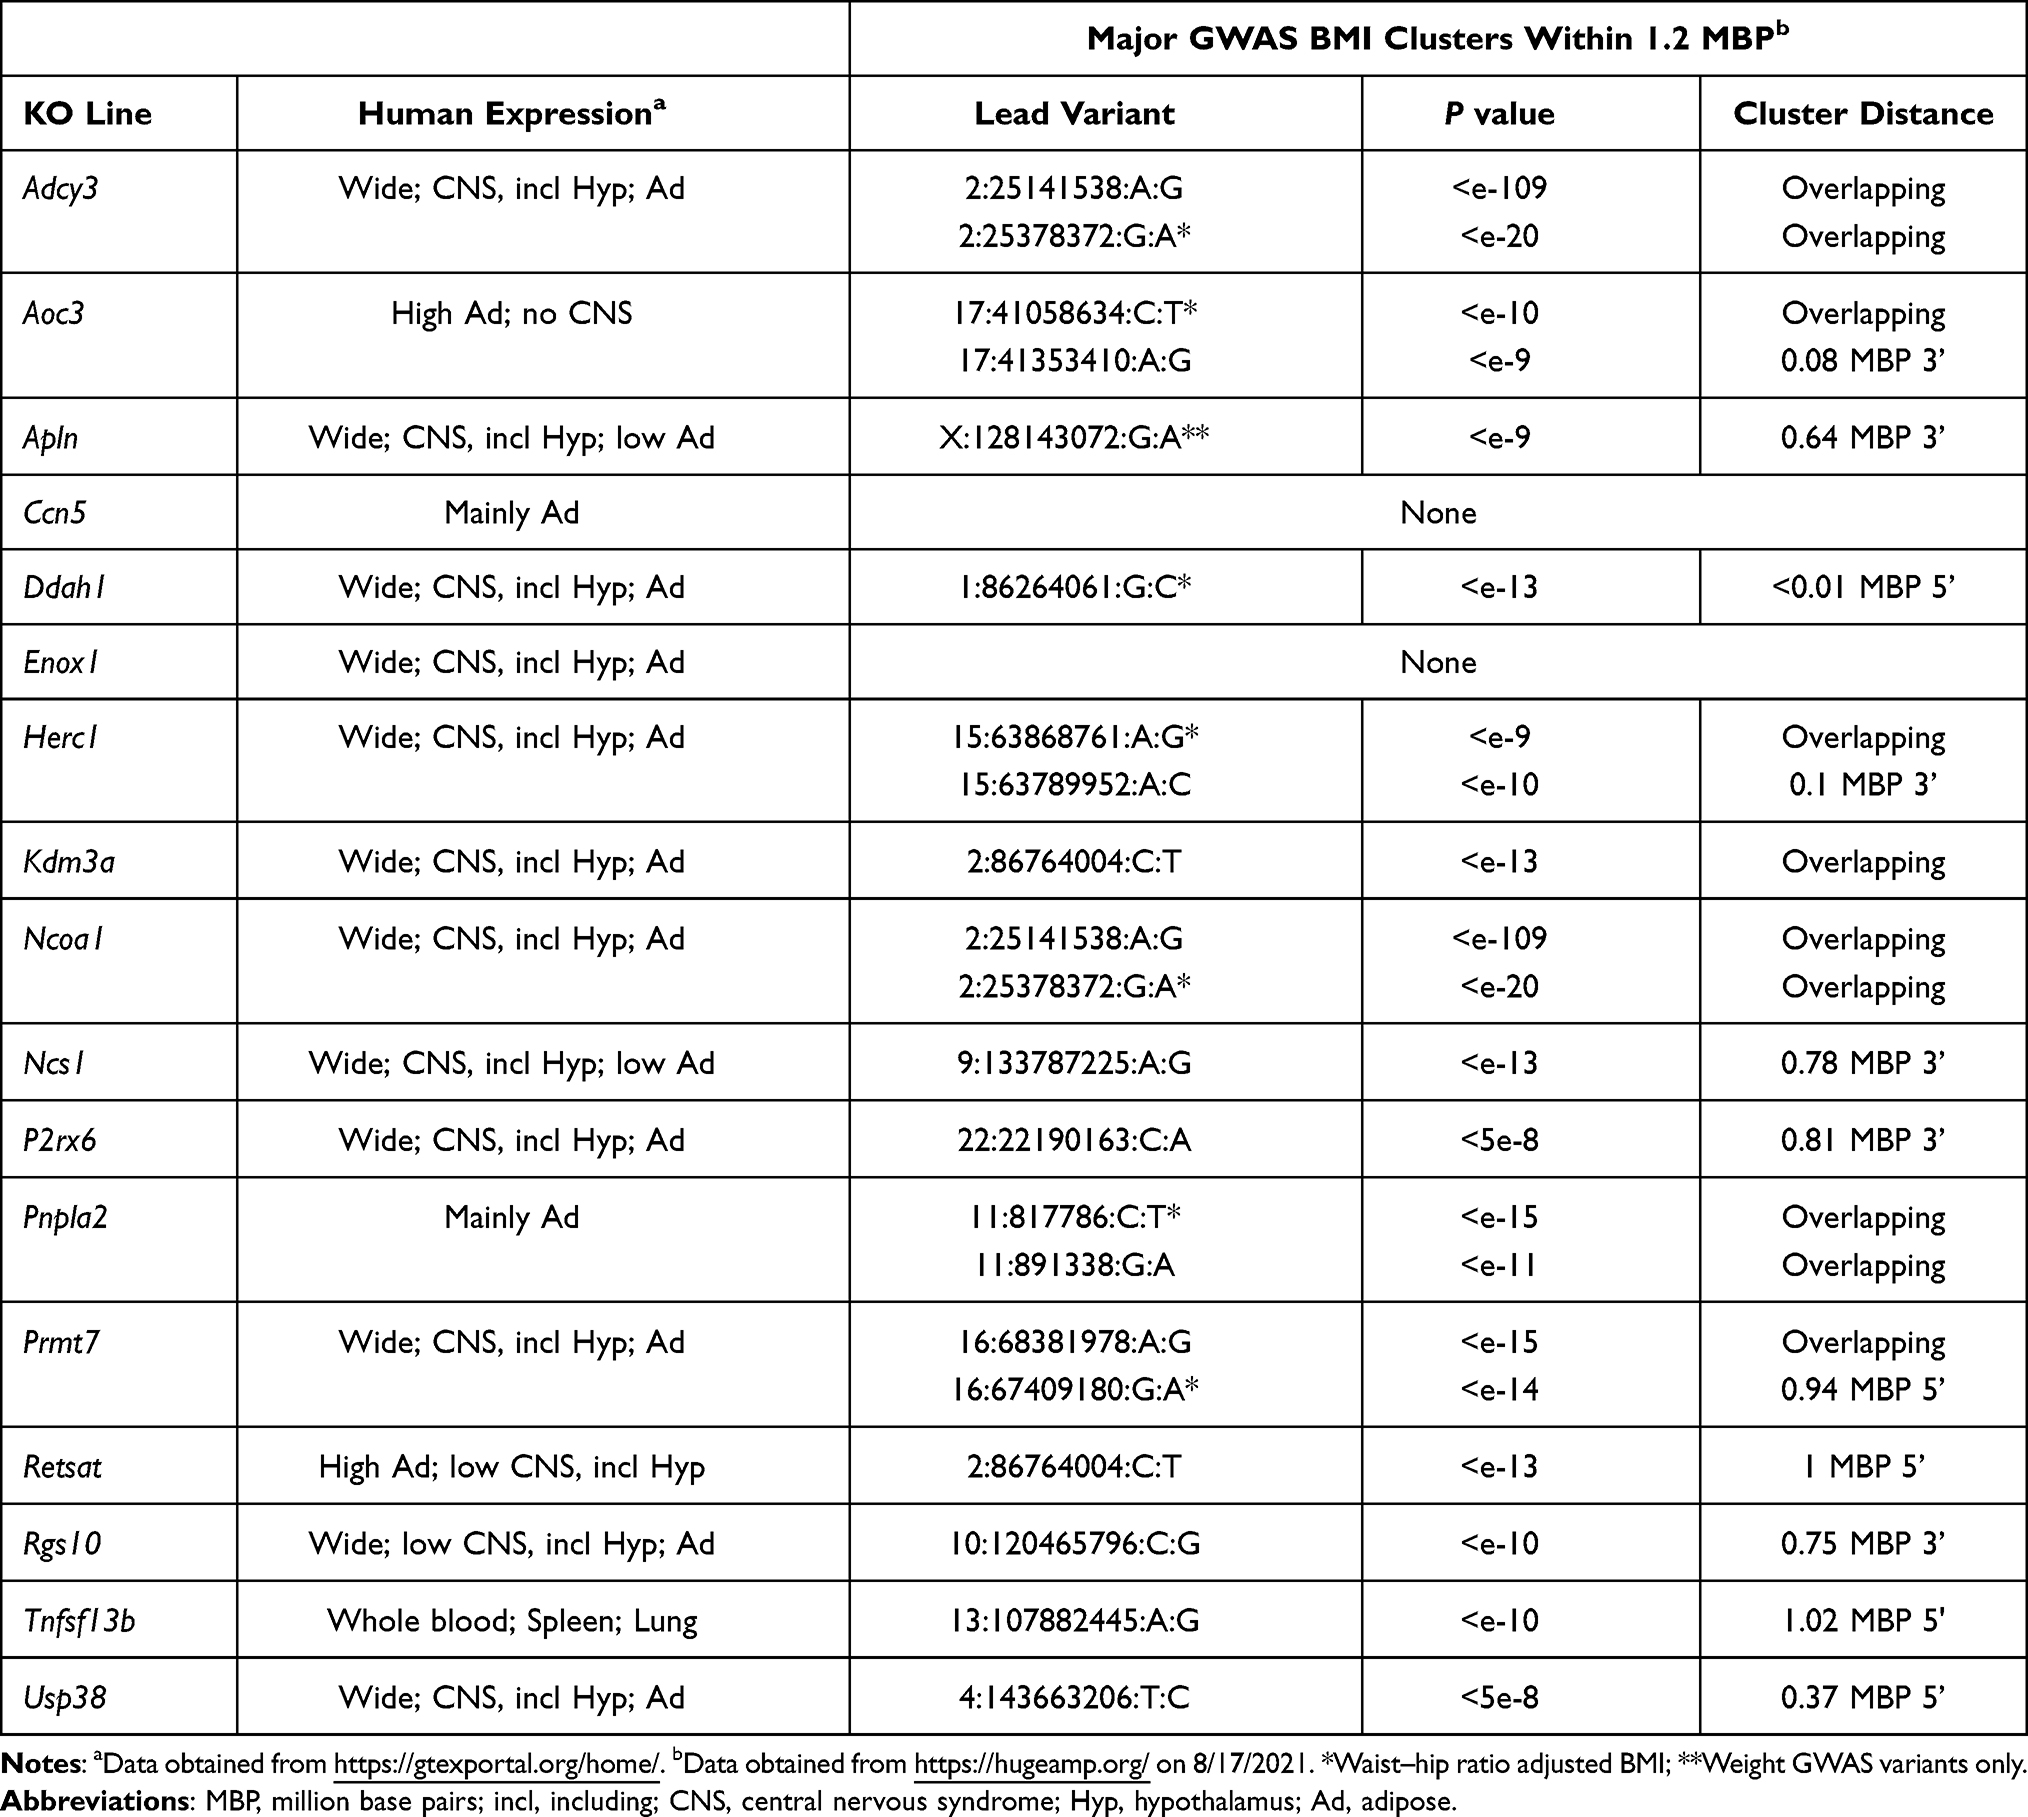 |
Table 4 Human Expression and GWAS Data for KO Lines with Significantly Increased Body Fat by HTS Only That Supports an External KO Line with High Body Fat |
ADCY3 and NCOA1 genes are located near each other on human chromosome 2. Adenylyl cyclases are downstream enzymes for GPCRs, and ADCY3 is a downstream effector for MC4R in hypothalamic neurons.112 Our mice lacking one or both Adcy3 alleles were obese (Table 3), which supported published findings in KO mice,113–115 in mice protected from DIO by gain-of-function Adcy3 mutations,116 and in humans with ADCY3 haploinsufficiency.117,118 The obesity observed in our Ncoa1 KO mice is consistent with published KO data,119 with studies showing NCOA1 modulates function of POMC neurons and energy homeostasis, and with human data linking NCOA1 inactivation to obesity.120 These human data suggest that variants linked to both ADCY3 and NCOA1 contribute to the strong and broad GWAS BMI cluster that overlaps these genes (Table 4).
Mice with KOs of genes encoding the secreted proteins TNFSF13B,121,122 CCN5,123 and APLN124 are obese, consistent with data from our independent KO lines (Table 3). Of note, a third Ccn5 KO line was not obese in the IMPC HTS, which may be consistent with the modest obesity observed in the published,123 and our (Table 3), KO lines.
Two independent KOs of Kdm3a, encoding a histone demethylase, were obese,125–127 findings supported by HTS data from an additional IMPC KO line and from our KO mice (Table 3), where 4/8 KO mice and 0/4 WT mice were >2SD above the historic mean for %BF or BFg. GWAS data show KDM3A sharing a BMI cluster with 2 genes, CHMP3 (charged multivesicular body protein 3) and RNF103 (ring finger protein 103), that lack an obvious link to obesity.
The IMPC HTS reported that KOs of Herc1 and Usp38, which encode enzymes involved in ubiquitination pathways, were obese, consistent with our data (Table 3); body composition was not evaluated in two Usp38 KO publications.128,129 Although some human HERC1 variants are associated with somatic overgrowth, they result in increased, not decreased, HERC1 activation and thus are not relevant here.130,131 Both HERC1 and USP38 reside near BMI clusters in gene-poor chromosomal regions (Table 4), suggesting a possible link to human obesity for each gene.
Mice with a KO of Prmt7, which influences skeletal muscle oxidative metabolism, were obese;132 HTS data on our KO line (Table 3) and an independent KO line from the IMPC support this finding. GWAS data show PRMT7 as the only obesity-linked gene among 5 genes located within in a BMI cluster (Table 4). The published finding that Retsat KO mice were obese133 is confirmed by our KO data (Table 3).
Inactivating mutations in the lipase PNPLA2 result in neutral lipid storage disease with myopathy (NLSDM) in humans and in mice,134–137 with modest obesity observed in chow-fed, but not HFD-fed, Pnpla2 KO mice. Our Pnpla2 KO mice also had NLSDM (data not shown), and the increased body fat data presented in Table 3 are from chow-fed mice only because our KO mice were not obese when fed HFD. Ddah1 KO mice had increased BW on HFD but not on chow,138 consistent with our findings (Table 3); consistent with these findings, chow-fed Ddah1 KO mice were not obese in the IMPC HTS.
Mice with a KO of Aoc3 which encodes VAP-1/SSAO are modestly obese,139,140 consistent with our findings (Table 3); interestingly, the human AOC3 gene is expressed in adipose tissue but not CNS and resides within a waist-hip ratio adjusted BMI cluster (Table 4), suggesting a role for AOC3 in regulating visceral fat mass. Enox1 is a little-studied gene,141 and the finding that Enox1 HET mice were obese in the IMPC HTS is consistent with the obesity observed in our Enox1 KO mice (Table 3).
External KOs for the neuronal calcium sensor Ncs1 and the GTPase-activating protein Rgs10 were obese,142,143 consistent with our findings (Table 3). Although no publications link the P2RX6 channel144 to obesity, the IMPC HTS found that male P2rx6 KO mice were obese; the obesity observed in our P2rx6 KO mice (Table 3) was present in both males and females (data not shown).
KO Lines with Numerically Increased Body Fat That Support External Obese KO Lines
For many KO lines with a numerical, but not statistically significant, body fat increase of at least 15% in our HTS, confirmatory studies using additional cohorts were not performed but our data support external obesity data. Table 5 summarizes our data for these KO lines, and Table 6 presents human gene expression and/or BMI GWAS data consistent with a role for the human orthologs of these targeted genes in regulating body fat.
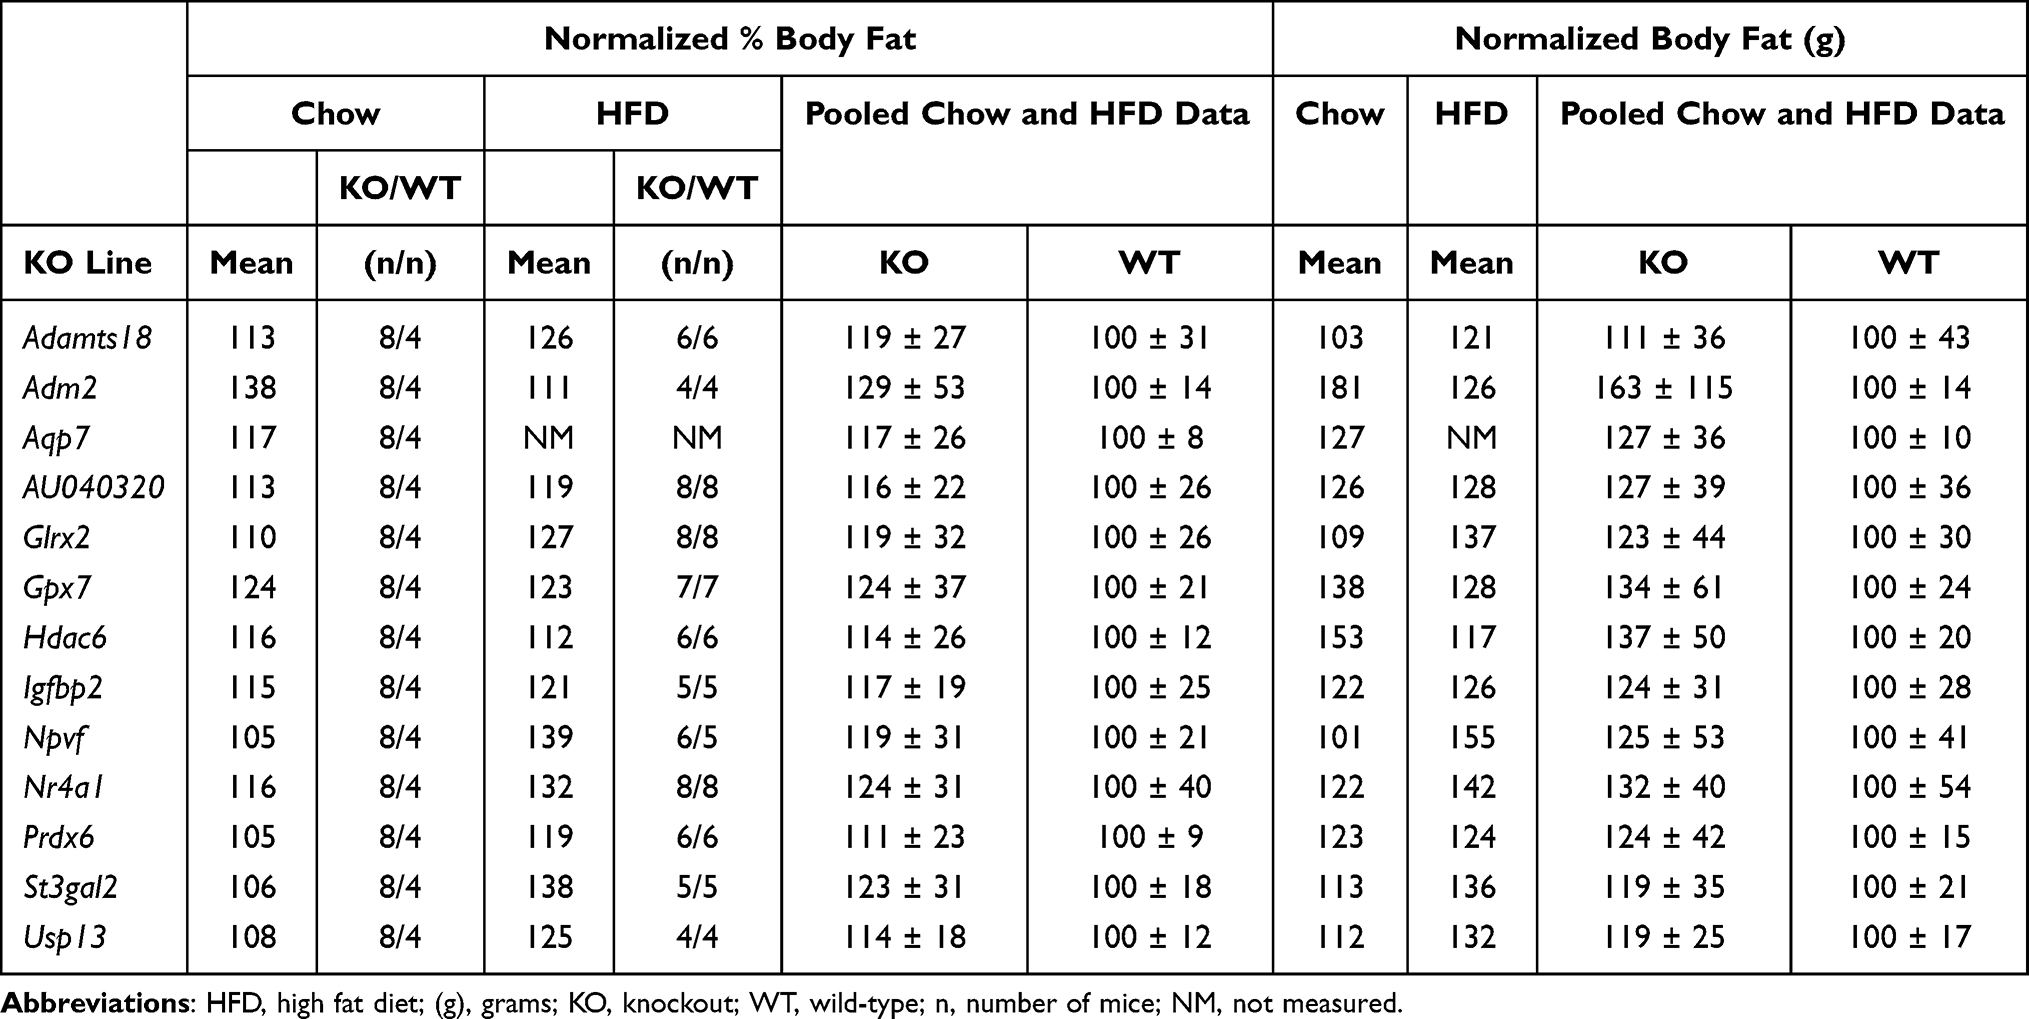 |
Table 5 Body Fat Data for KO Lines with Numerically Increased Body Fat by HTS Only That Supports an External KO Line with High Body Fat |
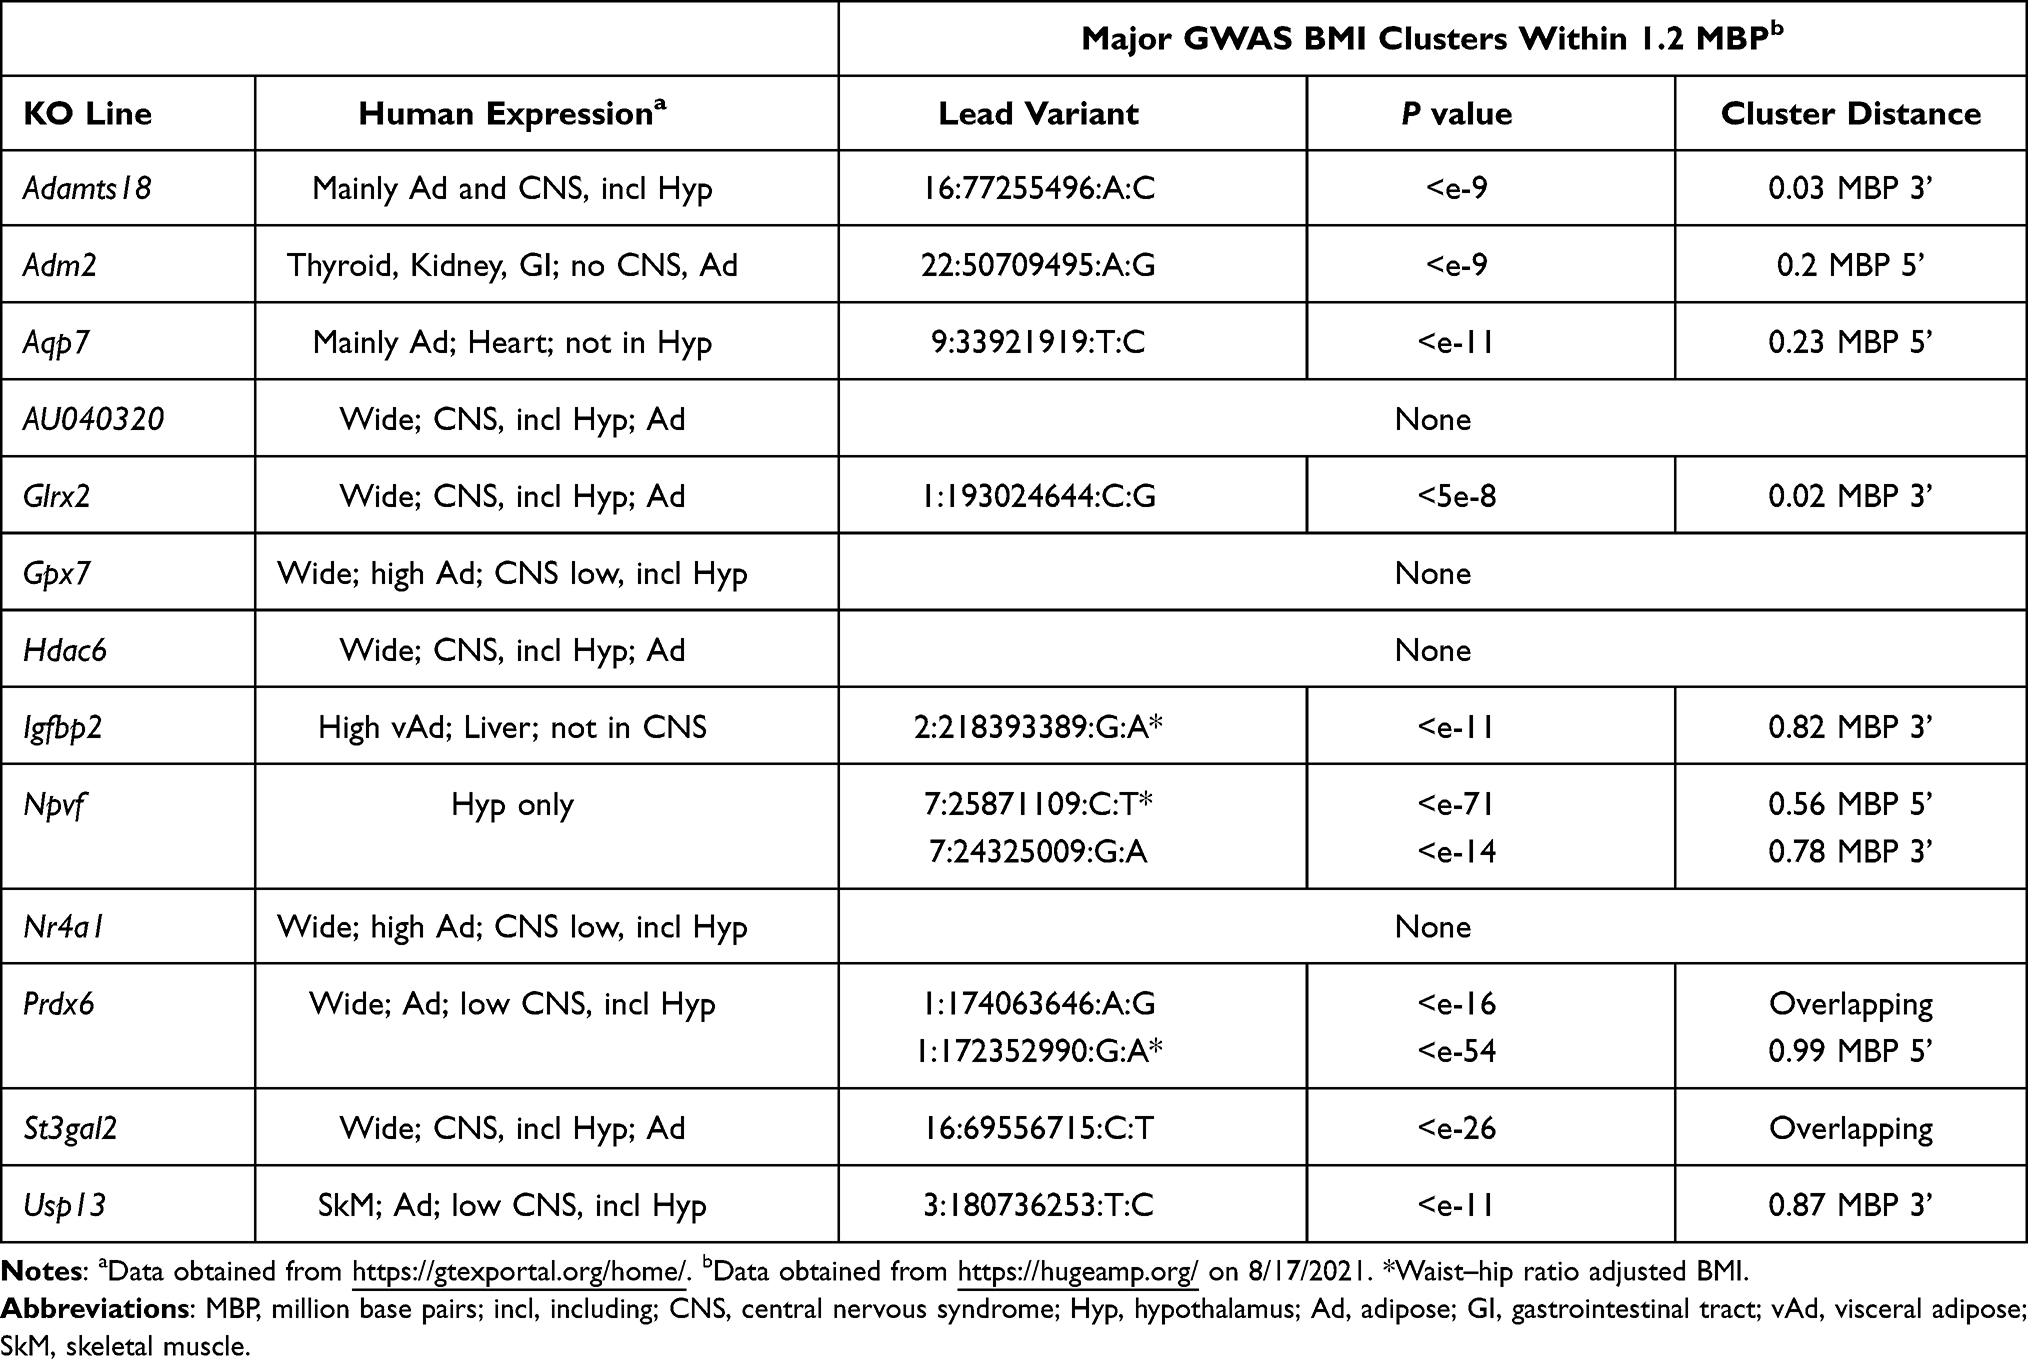 |
Table 6 Human Expression and GWAS Data for KO Lines with Numerically Increased Body Fat by HTS Only That Supports an External KO Line with High Body Fat |
There are 4 secreted proteins in this category. Our HTS data (Table 5) were consistent with the modest obesity observed in Igfbp2 KO mice at 8 weeks of age145 and with IMPC HTS data showing increased body fat in AU040320 KO mice. Male infertility, but no body fat data, was reported in an independent AU040320 KO line,146 consistent with the male infertility of KO mice studied by both the IMPC and Lexicon. Our HTS data were also consistent with the ability of ADM2 to inhibit HFD-induced obesity when overexpressed by adipose tissue of transgenic mice147,148 and to inhibit food intake when delivered subcutaneously to WT mice,149 and with the increased BW of Adm2 HET mice.150 Central delivery of NPVF, encoded by a gene expressed only in hypothalamus (Table 6), induced acute anorexia in chicks,151,152 consistent with our Npvf KO data; of interest, body fat was significantly increased only in our KO mice fed HFD (nBF: KO 157 ± 52 vs WT 100 ± 35, n%BF: KO 139 ± 21 vs WT 100 ± 25, both P<0.05), suggesting that NPVF may regulate intake of palatable diets.
For the 7 enzymes in this category, obesity of KO mice from published St3gal2, Glrx2, Hdac6 and Prdx6 KO lines agrees with our data.153–157 Obesity of KO mice from published Gpx7 and Adamts18 KO lines158,159 is consistent with our data and with GWAS data linking obesity to GPX7158 and to ADAMTS18 which is closely associated with a BMI cluster (Table 6), but not with the absence of obesity in independent Gpx7 and Adamts18 KO lines studied in the IMPC HTS. Our HTS data for Usp13 KO mice are consistent with the obesity of female mice from an independent IMPC Usp13 KO line.
The obesity of mice with a KO of the nuclear hormone receptor Nr4a1160,161 is consistent with our HTS data. AQP7 is the primary glycerol transporter for adipocytes and cardiomyocytes. Our HTS data support the obesity observed in published cohorts of Aqp7 KO mice.162,163 We also observed focal myocardial degeneration in 3 of 4 KO mice (Supplementary Figure 4), consistent with published data showing impaired myocardial response to pressure overload in Aqp7 KO mice.164
KO Lines with Significantly Increased Body Fat and No External Obese KO Lines
For many KO lines with significantly increased body fat in our HTS, confirmatory studies examining additional cohorts were not performed and no supportive external KO data are available. We have many KO lines in this category, but our presentation here is focused on data from KO lines (Table 7) where the human ortholog of the targeted gene is closely associated with a GWAS BMI variant cluster and has an expression pattern consistent with a role for the ortholog in regulating body fat.
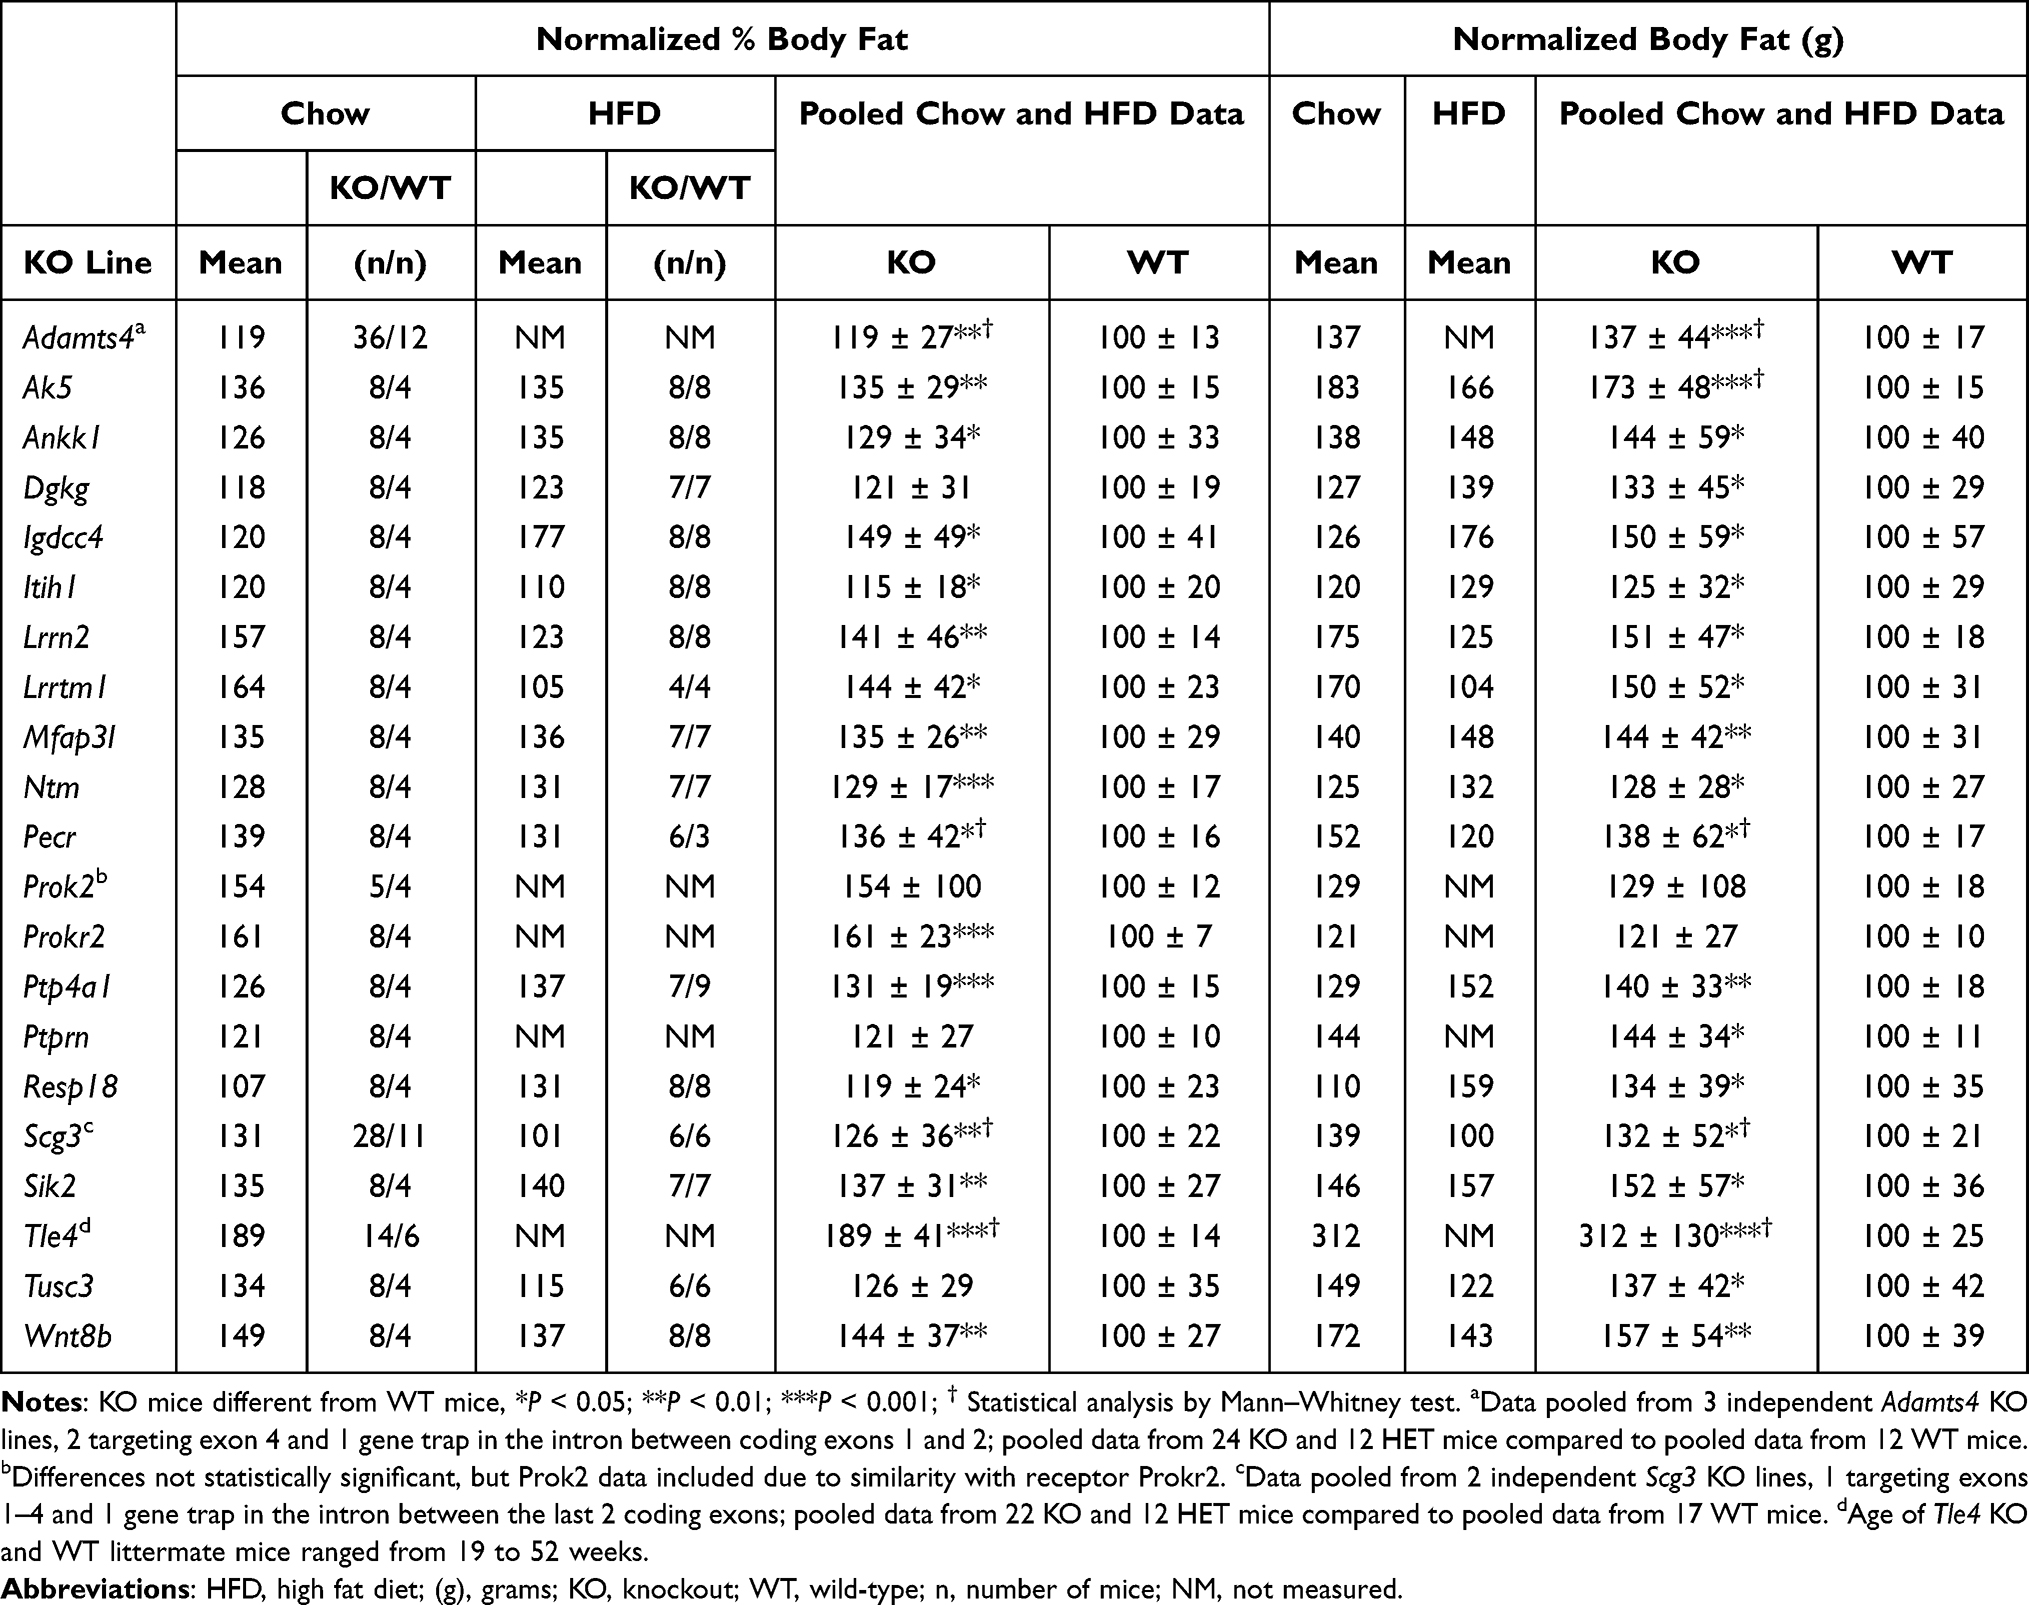 |
Table 7 Body Fat Data for KO Lines with Significantly Increased Body Fat by HTS and No External KO Line with High Body Fat |
Tle4 KO mice showed reduced viability and poor growth in the first few weeks of life.165,166 At weaning, our Tle4 mice had a Mendelian ratio of 37 WT, 78 HET and 24 KO mice that trends toward reduced viability (P=0.1), and BWs of male and female KO mice were lower than those of WT littermates. However, by 8 weeks of age, BWs of KO mice had caught up to or surpassed those of WT littermates (Supplementary Figure 5). This trend continued as the mice aged. Unlike body composition studies of our other HTS KO lines, Tle4 KO mice were older with ages ranging from 19 to 52 weeks; nevertheless, the %BF and BFg for all 6 Tle4 WT mice were within 1 SD of the HTS historic mean, while 13/14 KO mice were >2SD above the historic mean for %BF and BFg. Blood glucose and total cholesterol levels were also higher for KO vs WT littermate mice: for blood glucose, KO = 142±35 (n=19) vs WT = 97±27 mg/dL (n=7), P<0.01; for total cholesterol, KO = 146±51 (n=11) vs WT = 72±19 mg/dL (n=2), P<0.05 by Mann–Whitney test. In humans, GWAS BMI clusters are found within and 0.81 MBP 5ʹ to the TLE4 gene, which resides alone in the middle of a 2.5 MBP stretch of chromosome 9 (Table 8), and a T2D cluster (lead variant 9:81908842:T:C, P<e-22) is found 0.23 MBP 5ʹ to the TLE4 gene (https://hugeamp.org/), further supporting a role for TLE4 in obesity and T2D.
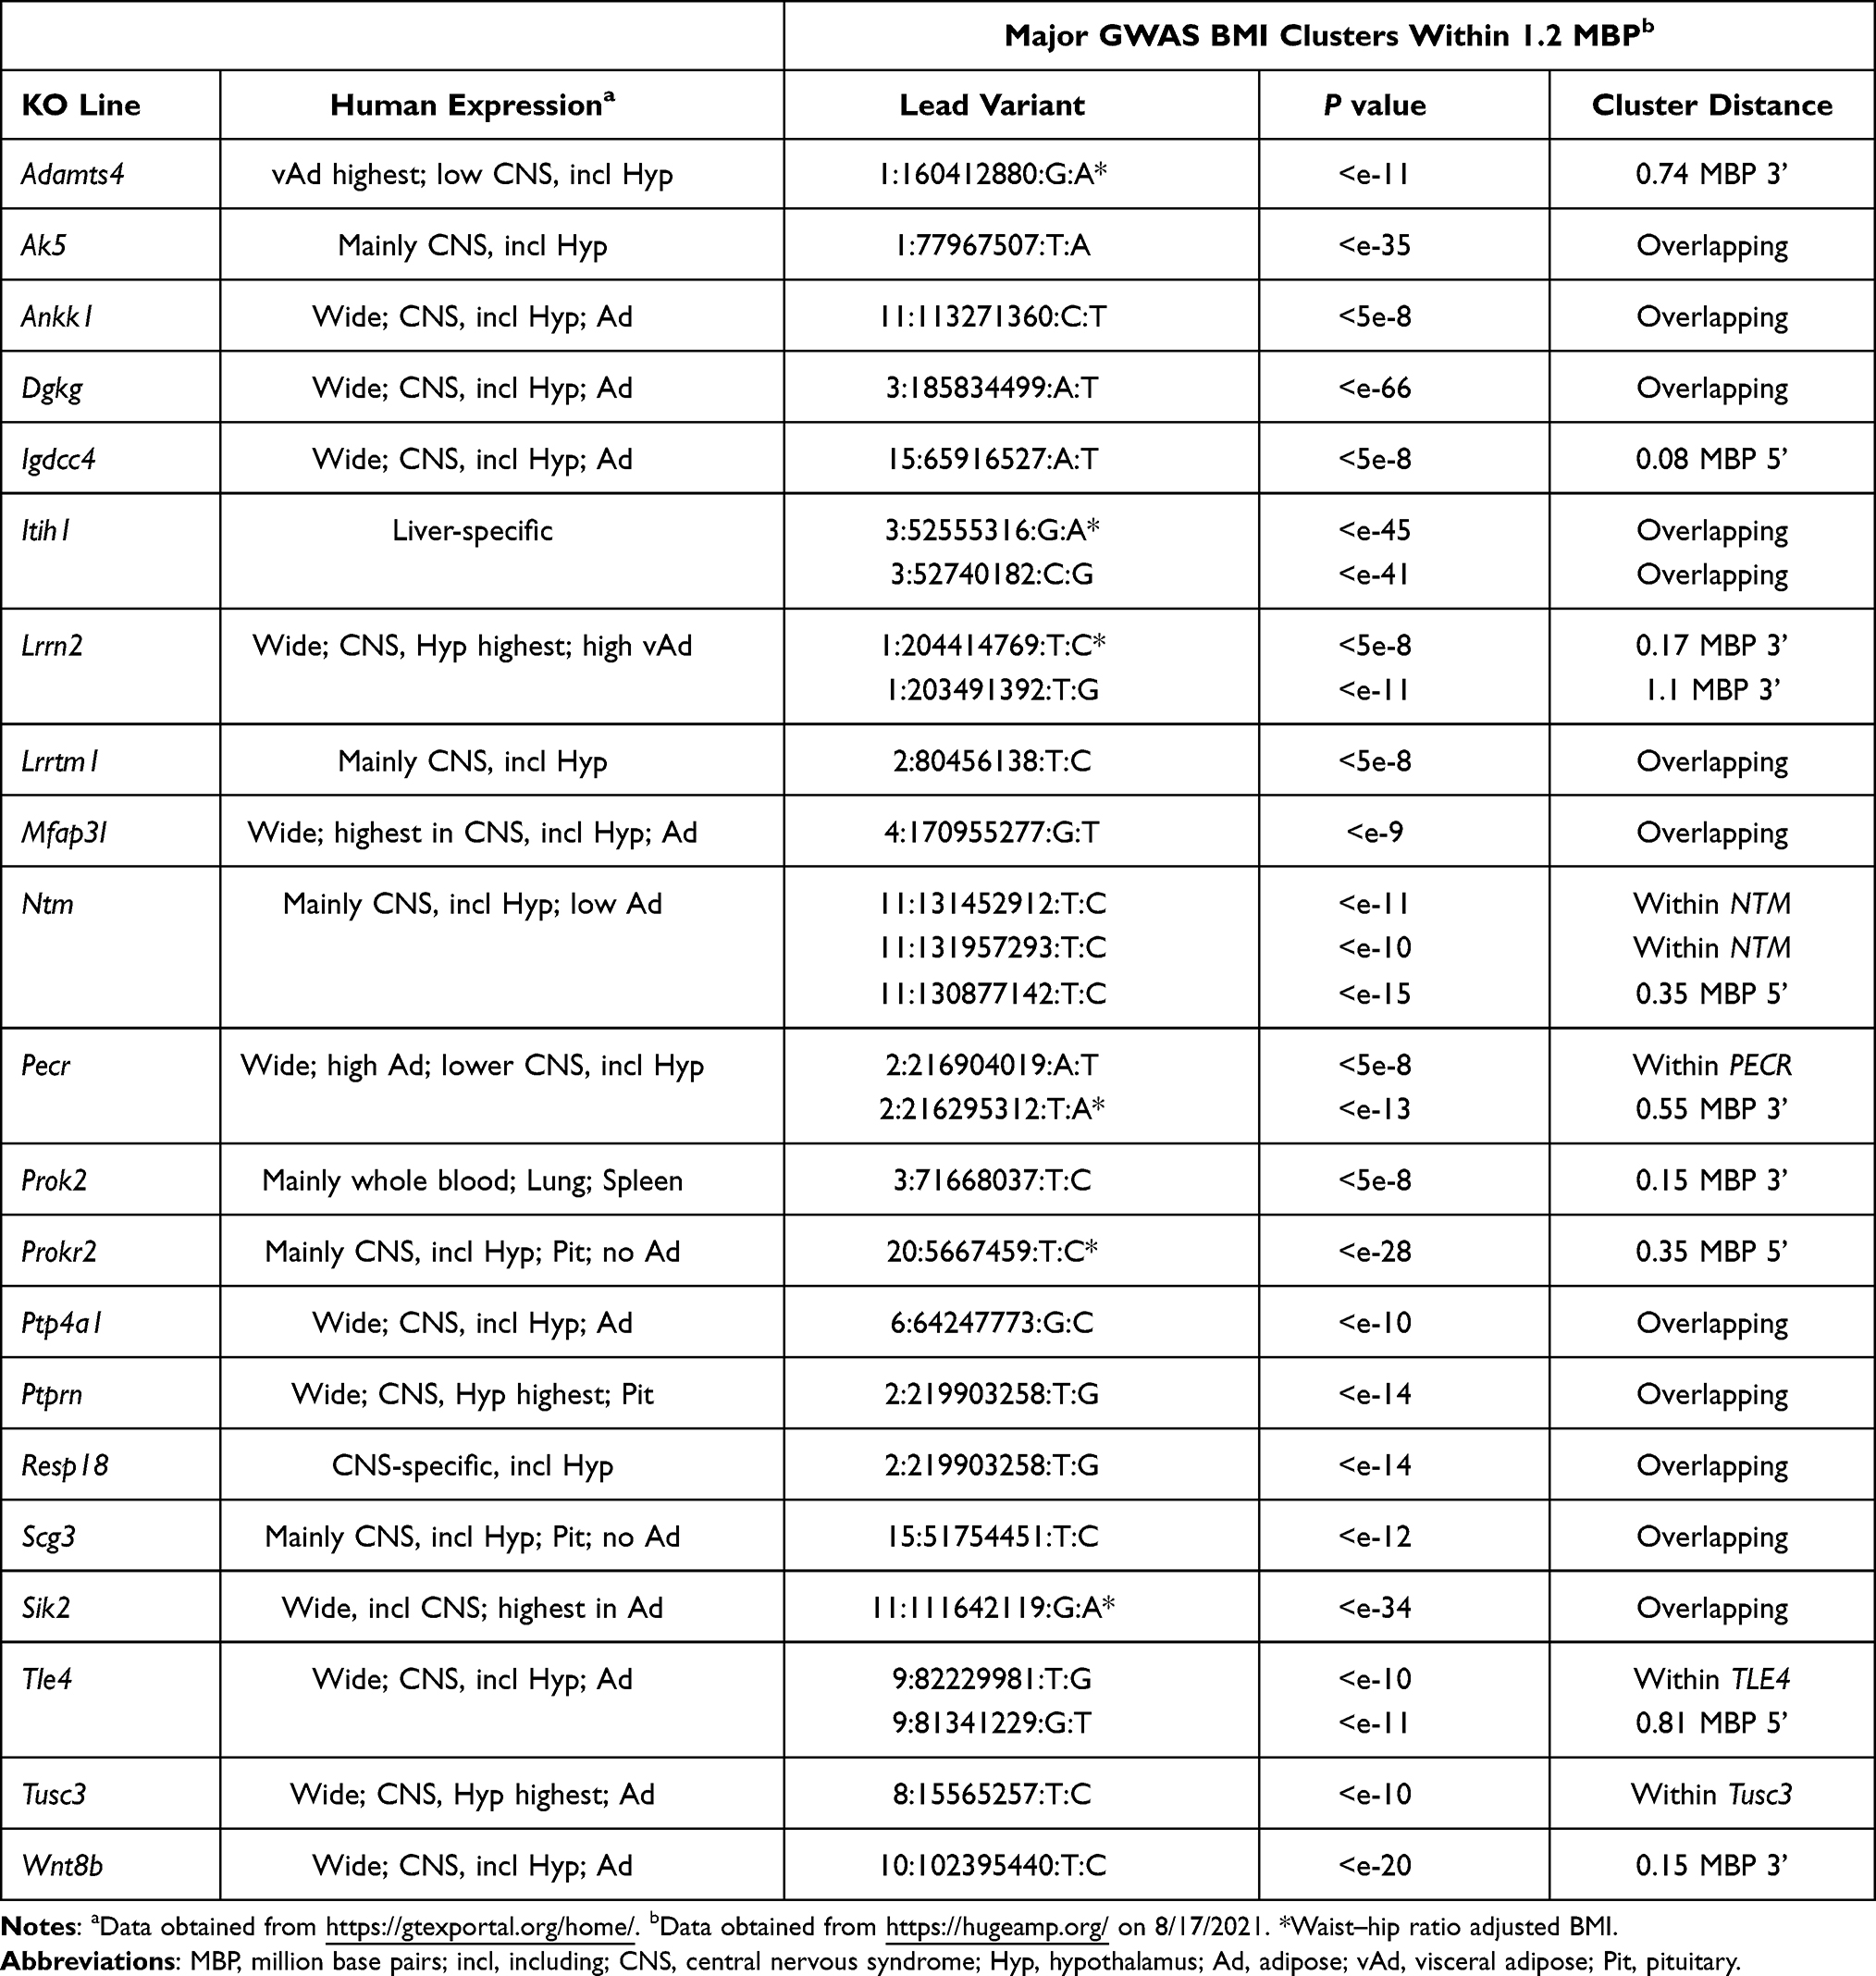 |
Table 8 Human Expression and GWAS Data for KO Lines with Significantly Increased Body Fat by HTS Only and No External KO Line with High Body |
No external KOs or published links to obesity were identified for the kinase AK5,167 but a strong GWAS BMI cluster is found within, and is primarily associated with, the human AK5 gene that is expressed almost exclusively in the CNS (Table 8). No body composition data were presented for an external KO of the cell adhesion molecule encoded by Ntm,168 but two independent GWAS BMI clusters are found within, and are only associated with, the human NTM gene (Table 8). Perinatal lethality occurred in the IMPC KO for Tusc3, which encodes a subunit of the oligosaccharyl transferase responsible for N-glycosylation of nascent proteins;169 no published links to obesity were found for Tusc3 but a BMI cluster is located within, and only associated with, the human TUSC3 gene (Table 8).
There are no external Ankk1 KO lines. The human Taq1A RFLP (rs1800497) linked to the dopamine 2 receptor (DRD2) causes a single amino acid substitution in the ANKK1 substrate-binding domain.170 The A1 allele is associated with 1) obesity,171 2) decreased striatal DRD2 density172 and 3) increased food intake.173 This suggests that, if the A1 allele expresses a less active ANNK1 form, Ankk1 KO mice will be obese,174 a hypothesis consistent with our findings.
A few of our KO lines target genes having human orthologs that share GWAS BMI clusters with other genes that have no published or IMPC HTS data linking them to obesity. No external KO was identified for the cell adhesion protein Igdcc4, which is linked to early childhood adiposity;175 IGDCC4 is located in a BMI cluster (Table 8) shared with DPP8, discussed above, and with 5 other genes with no clear link to obesity. No external KO was identified for Itih1, which encodes a heavy chain for the serine protease inhibitor inter-alpha trypsin inhibitor. Although ITIH1 is expressed only in liver, studies link this secreted protein to mood disorders and report that overexpressed ITIH1 can deposit on hyaluronan surrounding mouse adipose tissue.176,177 ITIH1 is centrally located in, and the landmark for,104 a large BMI cluster which overlaps 14 additional genes, none of which have been linked to obesity. Although external Lrrtm1 KO lines had normal BW,178,179 and body fat was not increased in the IMPC HTS, this KO line is included because of the robust body fat phenotype with 5/12 KO mice and 0/8 WT mice >2SD above the historic mean for %BF or BFg, and because LRRTM1 and CTNNA2 (catenin alpha 2) are the only genes sharing a BMI cluster (Table 8). No external KOs or published links to obesity were identified for the gene encoding the protein kinase Mfap3l;180 MFAP3L and AADAT (aminoadipate aminotransferase) are the only genes sharing a BMI cluster (Table 8). No external KOs or published links to obesity were identified for the gene encoding the short-chain dehydrogenase/reductase PECR;181 PECR and MREG (melanoregulin) share a BMI cluster and are the two closest genes to a body fat percentage cluster (lead variant 2:216661156:G:C, P<e-21) located 0.2 MBP 3ʹ to the PECR gene (https://hugeamp.org/). Although one external KO line for the gene encoding the protein tyrosine phosphatase Ptp4a1182 did not evaluate body fat and a second showed normal body fat in the IMPC HTS, support for our finding of obese KO mice was provided by the link between PTP4A1 and addictive behaviors183 and by a BMI cluster that overlaps PTP4A1 and is shared only by PHF3 (PHD finger protein 3) and EYS (eyes shut homolog) (Table 8). SCG3 is a protein that is co-expressed with, and forms secretory granules with, several appetite-regulating peptides in the hypothalamus; analysis of human genetic variants suggested that decreased SCG3 expression increases obesity risk.8,184 Although an independent IMPC line of Scg3 KO mice was not obese, our finding of obese KO and HET mice in 2 independent Scg3 KO lines (Table 7), one targeted by homologous recombination and the other by gene trapping (Supplementary Tables 2 and 3), and the observation that SCG3 resides within a BMI cluster (Table 8) that is shared with DMXL2 (Dmx like 2) which has no clear link to obesity, support a role for SCG3 in the regulation of body fat.
RESP18 and PTPRN are intracellular proteins that participate in hormone secretion pathways; the genes for these proteins, which share ~40% amino acid similarity over a 200 amino acid stretch of PTPRN, are located adjacent to each other in a head-to-tail orientation in mammalian genomes, suggesting they are evolutionarily related.185,186 Resp18, first identified as a gene coregulated with POMC, is downregulated by dopamine and is highly expressed in the diencephalon, suggesting a role in salt and water balance and/or feeding behavior;185 indeed, a rat Resp18 KO line, although not evaluated for body fat, did show increased SBP.187 PTPRN, also known as IA-2, is an autoantigen linked to T1D but not obesity, and published Ptprn KO mice have normal BW.186 Surprisingly, KO lines for both genes had increased body fat in our agnostic screen, and in addition Resp18 KO mice had increased SBP (KO, n=8, 101±7 vs WT, n=4, 92±7 mmHg, P<0.05) supporting the finding in Resp18 KO rats. PTPRN and RESP18 are the only 2 of 8 genes located in a BMI cluster (Table 8) that are currently linked to obesity.
A few of our KO lines target genes having human orthologs that share a GWAS BMI cluster with other genes linked to obesity. Genes for the kinase Dgkg188 and the neuronal membrane protein Lrrn2189 have no publicly available KO data or published links to obesity despite having increased body fat in our HTS (Table 7). DGKG and ETV5 (ETS variant transcription factor 5) are the only genes sharing a BMI cluster on human chromosome 3, while LRRN2 and MDM4 (MDM4 regulator of p53) are the only genes sharing a BMI cluster on human chromosome 1 (Table 8); the low body fat observed in Etv5 KO mice190 and Mdmx KO mice191 suggests that one or both genes in each of these two BMI clusters may contribute to the GWAS signal. A published KO of Wnt8b192 did not provide body fat data and the limited BW data did not support the finding of obesity that we observed in our KO line (Table 7). WNT8B shares a nearby BMI cluster (Table 8) with 4 other genes including HIF1AN (hypoxia inducible factor 1 subunit alpha inhibitor); the low body fat observed in Hif1an KO mice193 suggests that multiple genes might contribute to this GWAS cluster. External Sik2 KO mice had impaired glucose homeostasis and increased circulating TG and adipocyte size consistent with a role for SIK2 in adipogenesis, but body fat was not increased.194 Our Sik2 KO mice had an insignificant 23% increase in OGTT glucose AUC and a significant 9% increase in HbA1c with KO = 4.8±0.4% (n=8) vs WT = 4.4±0.2% (n=4), P<0.05, consistent with modestly impaired glucose tolerance observed in the published Sik2 KO mice. However, our KO mice also had increased body fat, consistent with high expression of the human SIK2 gene in adipose tissue and the association of this gene with an overlapping waist-hip ratio adjusted BMI cluster (Table 8). This BMI cluster is shared with 11 genes including CRYAB; the possible link of CRYAB to adiposity195 suggests that multiple genes might contribute to this GWAS BMI signal.
In humans, PROK2 is a CNS peptide that binds the GPCR PROKR2; inactivating mutations of either gene can result in Kallmann Syndrome, the combination of hypogonadotropic hypogonadism and anosmia.196 Consistent with these findings, Prok2 and Prokr2 KO mice have hypoplastic olfactory bulbs and atrophic reproductive organs.197,198 Our Prok2 and Prokr2 KO mice confirm these findings, including male and female infertility for Prok2 KO mice, but likely also share an obesity phenotype not previously reported; although our KO mouse numbers were small, 7/8 Prok2 and 3/5 Prokr2 KO mice were >2SD above the historic mean for %BF, compared to 0 WT mice for either cohort. These data are consistent with the ability of PROK2, a hypothalamic peptide, to inhibit food intake and promote weight loss when administered to rats.199 Recent data suggest this link to obesity may also extend to humans.200
Published and IMPC HTS data describing external KOs for the secreted protein Adamts4201 did not provide body fat or BW data supporting the obesity of our mice (Table 7), and the human ortholog is not closely associated with a BMI cluster (Table 8). Adamts4 was included because KO and HET mice from each of our 3 independent KO lines, two targeting exon 4 by homologous recombination and one the result of a gene trapping vector introduced into the intron between coding exons 1 and 2 (Supplementary Tables 2 and 3), showed similar increases in both body fat (pooled data in Table 7) and in total cholesterol, where data pooled from all KO (n=24) and HET (n=12) mice = 143±31 vs data pooled from all WT mice (n=12) = 118±30 mg/dL, P<0.05.
Discussion
We provide data for multiple mouse KO models with established and novel high body fat phenotypes. To better understand the potential value of these observations, we considered 1) if there is fidelity between mouse and human obesity genes; 2) if there is value in identifying obesity genes; and 3) criteria for what constitutes confirmation of a novel mouse KO obesity phenotype.
The High Fidelity Between Mouse and Human Obesity Genes
Mice are considered a good model for human disease,26,202 consistent with our finding that skeletal and other phenotypes are highly conserved between mice and man.28,37 Nevertheless, the limited ability of mouse models to mimic human inflammatory diseases203 demands a thorough analysis of the fidelity between mouse and human obesity genes. As shown in Table 9, inactivating mutations in many human genes are sufficient by themselves to result in obesity; for our purposes here, these are referred to as monogenic obesity genes.40,117,118,120,204–233 For each of these 18 human monogenic obesity genes, inactivating mutations in the orthologous mouse gene closely reproduce the human phenotype;10–13,36,49,59–62,100,114,115,119,220,232,234–261 in fact, 13 of these genes were initially reported as monogenic obesity genes in mice, including Lep,10,204 Lepr,10,207 Mc4r,13,209 Pomc,212,235 Sh2b1,214,238 Bdnf,216,241 Ntrk2,217,243 Ksr2,36,40 Adcy3,114,117,118 Cpe,222,249 Tub,223,249 Ncoa1119,120 and Mc3r.60,61,227,256 In addition, Mrap2,220 Cep19224 and Cartpt225,253 were simultaneously reported as obesity genes in mice and humans. Only Sim1218,245 and Pcsk1228,232,257–261 were first reported as obesity genes in humans. For Mc3r, KO mice are clearly obese with decreased LBM36,60–62 but evidence in humans was weak until recent studies focused on the human C17A+G241A haplotype encoding a partially inactivated receptor that, when homozygous, is associated with increased fat mass and decreased LBM.226,227 This phenotype was recently reproduced in mice homozygous for the human MC3R containing this haplotype compared to mice homozygous for WT human MC3R; of interest, this mouse phenotype is less severe than that observed in Mc3r KO mice.226,256
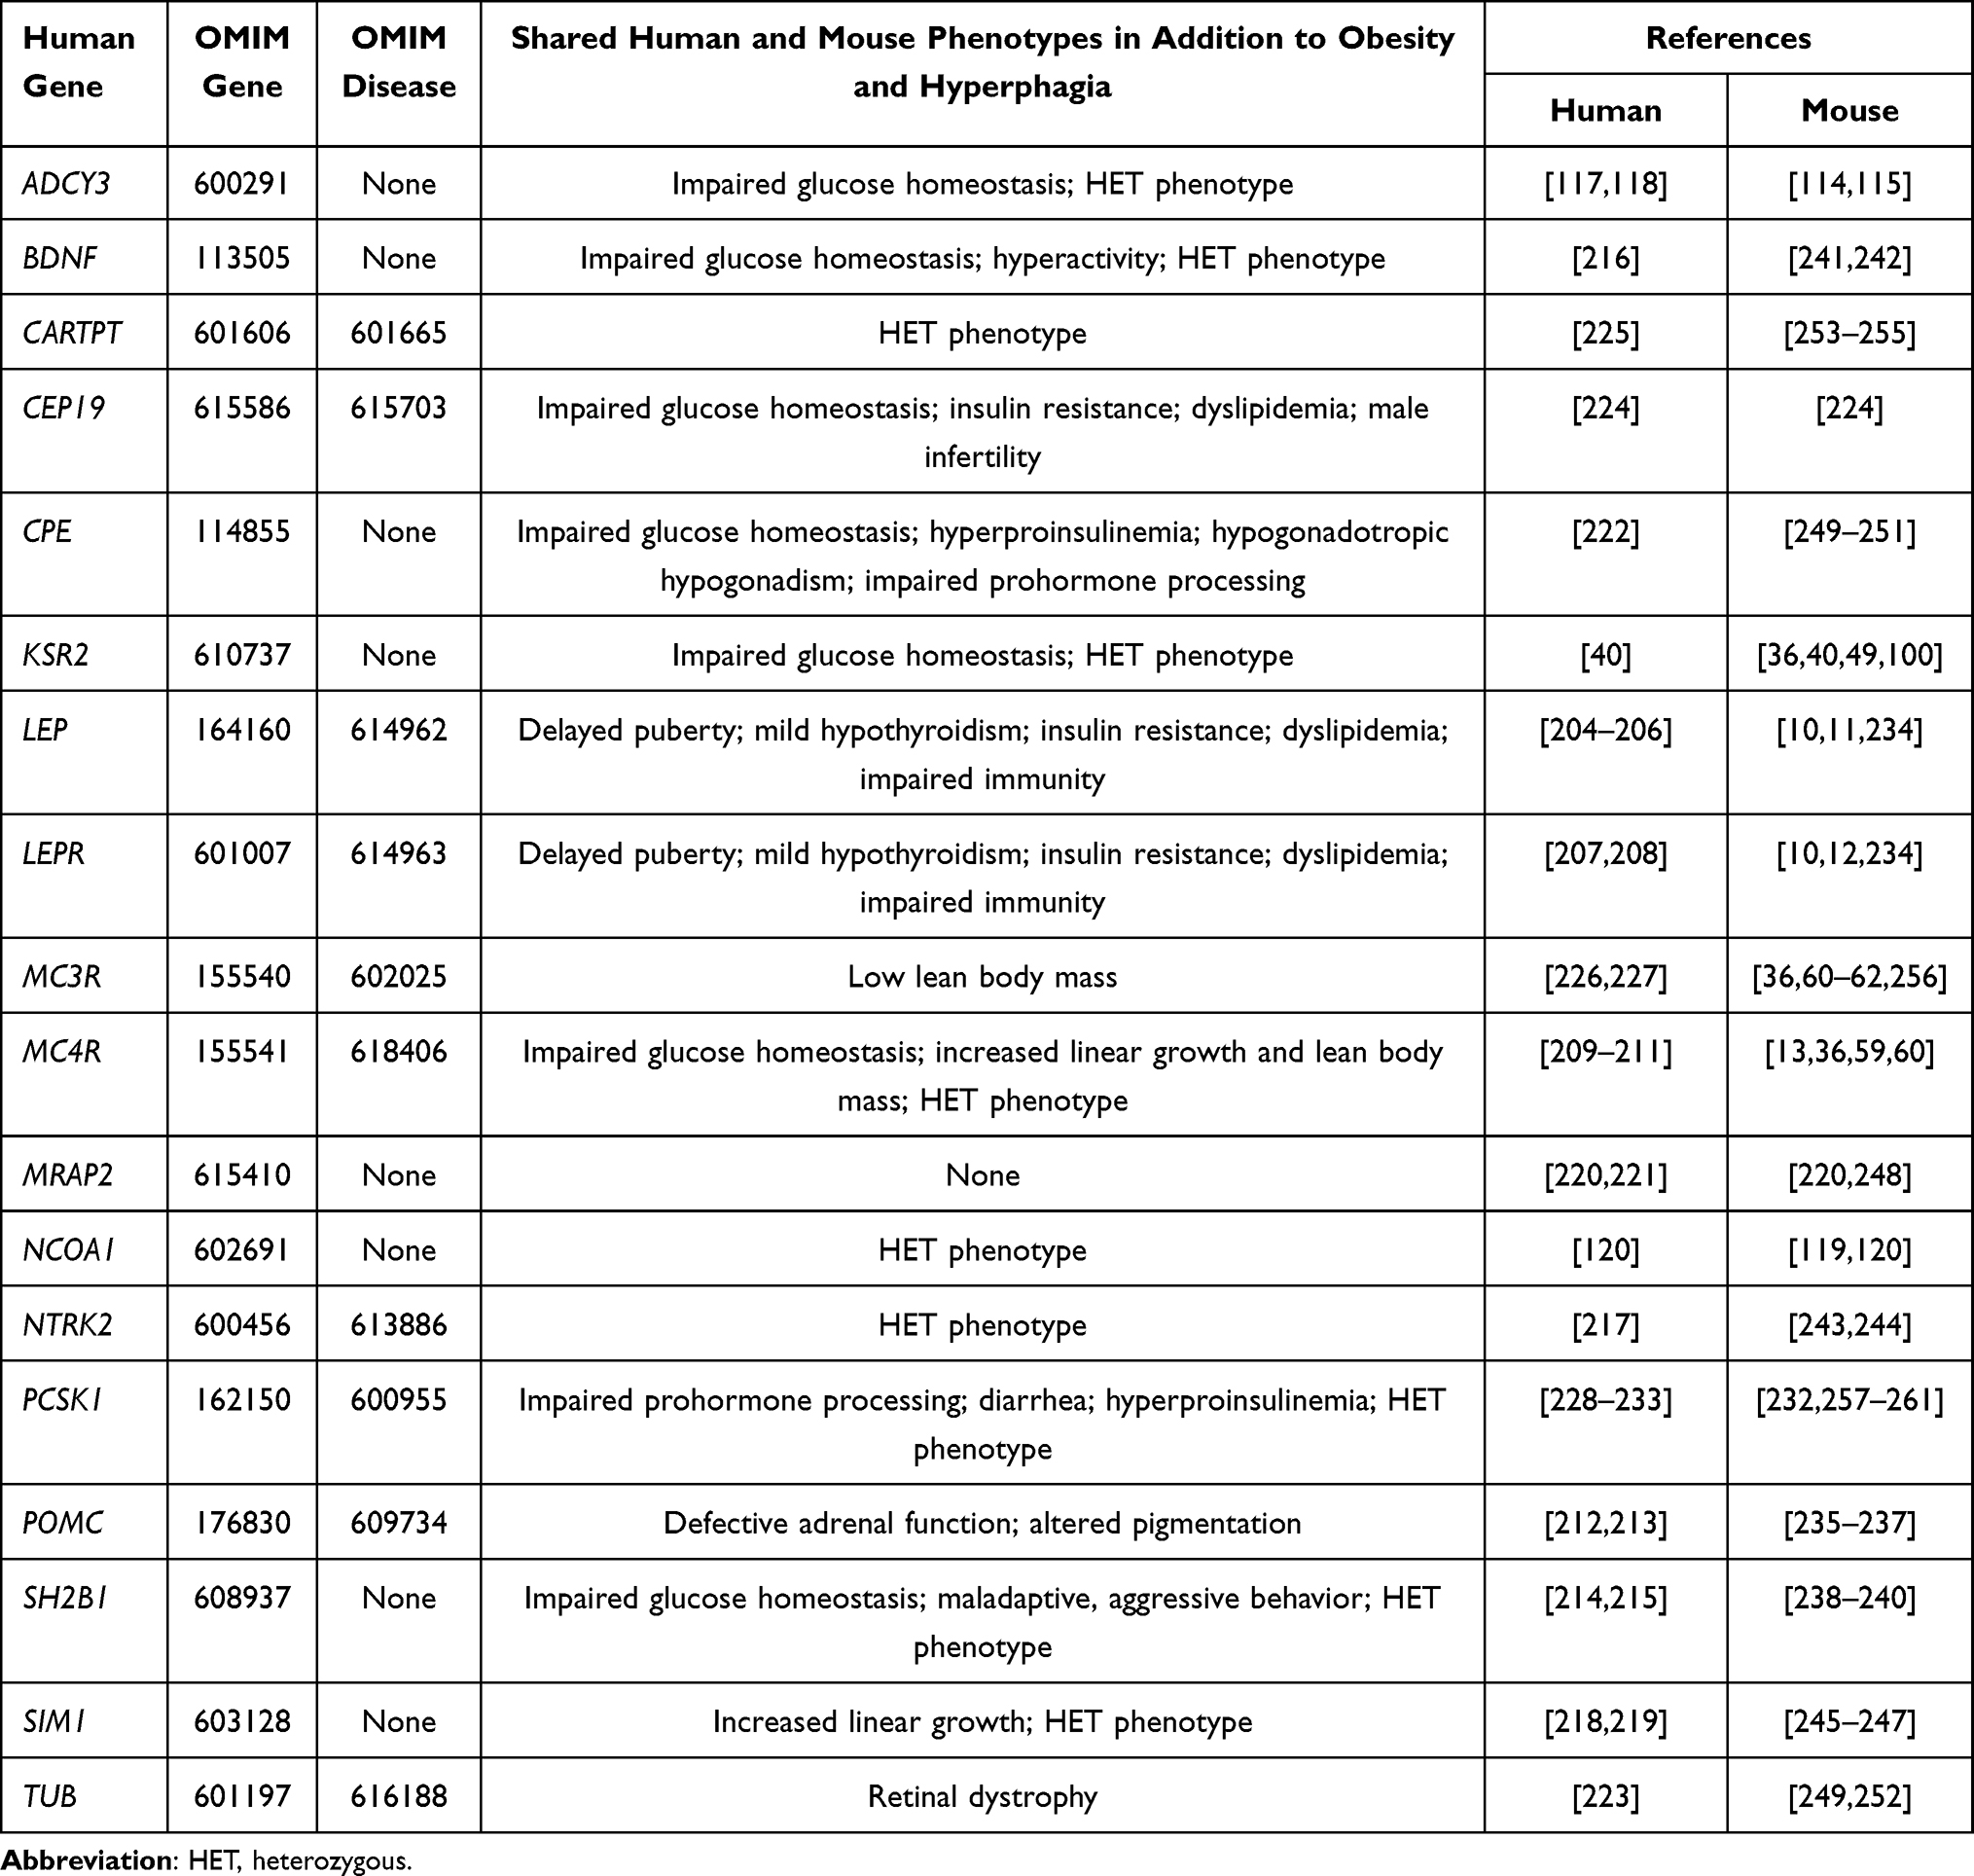 |
Table 9 Shared Mouse Phenotypes for 18 Established Human Monogenic Obesity Genes |
PCSK1 encodes proprotein convertase 1/3 (PC1/3), an enzyme that processes precursor neuropeptides and prohormones in endocrine tissues. Humans with complete deficiency develop severe obesity and a complex set of endocrinopathies,228,229 while Pcsk1 KO mice that survive to adulthood are not obese,257 which suggests that PC1/3 enzymatic pathways regulating body fat in humans are not operative in mice. However, humans heterozygous for the null mutation or with mutations causing partial loss of PC1/3 function develop obesity,230–233 a finding duplicated in HET mice and in mice with partial loss of PC1/3 activity,257–261 suggesting that the PC1/3 enzymatic pathways regulating body fat in humans are indeed shared by mice. Thus, the available evidence indicates a remarkable conservation between mice and man of the genes that regulate body fat.
Only 5 of the 72 obese mouse KO lines reported here appear on this list of shared mouse and human obesity genes. For 4 of the 5, Ksr2, Adcy3, Mc4r and Mc3r, the KO mice are among the most obese we studied, with a 64% or greater increase in %BF relative to WT littermates, suggesting that the fidelity between mouse and human obesity genes may extend to the relative strength of their obese phenotypes. If so, then GPR45, ASNSD1 and TLE4 are the most likely of the remaining 65 genes to be confirmed as human obesity genes. Nevertheless, identification of obesity in individuals heterozygous for inactivating NCOA1 mutations120 despite the modest obesity of published119,120 and our Ncoa1 KO mice suggests that homozygous inactivating mutations in human orthologs of any of the other 65 genes may be associated with severe human obesity. Despite the large effect of such homozygous inactivating mutations, their rarity precludes a major contribution to the polygenic obesity that results from small effects of many common genetic variants.16 However, homozygosity of complete loss-of-function mutations occurring simultaneously for 2 or more of these genes in the same person, undoubtedly a rare event, could result in morbid obesity due to the strength of the individual effects. This would most likely occur if the mutations in the 2 genes induce obesity through nonredundant pathways, resulting in an additive effect on fat mass; a good example is the increased body fat of Mc3r/Mc4r DKO mice, which equals the sum of the increased body fat found in the individual Mc3r and Mc4r KO lines (Supplementary Table 4).60,62
The Value in Identifying Genes That Regulate Body Fat
The major value in identifying novel mouse obesity genes is that the product of the orthologous human gene is likely to regulate body fat content in man. One advantage of this conservation across species is that identifying a novel mouse obesity gene may suggest that, among many genes associated with a human GWAS BMI cluster, the orthologous human gene is likely responsible for the signal. In support of this hypothesis, 10 of the 13 human obesity genes originally identified in mice are surrounded by or overlap with a GWAS BMI cluster (LEP, LEPR, MC4R, POMC, SH2B1, BDNF, NTRK2, KSR2, ADCY3 and NCOA1), while the other 3 (CPE, TUB and MC3R) are located within 1 MBP of a cluster (https://hugeamp.org/). Thus, going forward, novel mouse obesity genes can focus research efforts on their orthologs located in poorly characterized BMI clusters. For example, a BMI cluster located within the PRKD1 gene and 0.49 MBP 5ʹ to the G2E3 gene led to characterization of PRKD1 as an obesity gene262 and inclusion of PRKD1 in a functional protein interaction network for childhood BMI263 despite the lack of functional data linking PRKD1 to obesity. Our finding of obesity in G2e3 KO mice but not in Prkd1 KO mice47 suggests that future work should focus on the role of G2E3, rather than PRKD1, in human obesity.
Knowing the gene mutation responsible for obesity in an individual may predict obesity risk in current and future family members and guide management of the biological effects associated with inactivation of that specific gene.264,265 In addition, some single gene mutations that result in obesity are associated with specific effective therapies. For example, recombinant leptin effectively treats obesity in people lacking functional leptin.206 Also, setmelanotide is a subcutaneously administered peptide, which decreases appetite and increases energy expenditure by selectively activating the MC4R through a novel and incompletely understood mechanism that avoids the cardiovascular toxicity of earlier generation MC4R agonists.266,267 Setmelanotide can effectively treat obesity in individuals with inactivating mutations in LEPR, POMC and PCSK1 genes, which all encode proteins acting upstream of MC4R,268,269 and may also prove to be effective in individuals with specific MC4R mutations or with inactivating mutations in other genes, including CPE and ADCY3, that may result in impaired MC4R pathway function.266,268 This evidence supports the current recommendation for genetic testing of individuals with extreme early onset obesity, before the age of 5, that is associated with extreme hyperphagia, other features of genetic obesity syndromes, and/or a family history of extreme obesity.264
In humans with syndromic obesity, where obesity is one of multiple characteristic findings that constitute the syndrome, mouse KO models may also predict genes contributing to the obesity and suggest potential treatments. For example, MAGEL2 is one of 4 paternally expressed genes located in a chromosome 15 locus associated with Prader-Willi syndrome or PWS (OMIM 176270). Among the characteristic findings of PWS is early failure to thrive followed by overeating and marked childhood obesity. Magel2 KO mice reproduce many of the characteristic findings in PWS including obesity and hyperphagia,270 observations that preceded comparable findings in humans with truncating MAGEL2 mutations.271 Magel2 KO mice may potentially have a role to play in the development of therapeutics that reverse the hyperphagia and obesity of individuals with PWS or isolated MAGEL2 deficiency.272
Perhaps the greatest value in identifying obesity genes is the potential that the gene product is a target for a therapeutic, or a therapeutic itself, that can lower body fat in people with common polygenic obesity. Retrospective analyses found that mouse KO phenotypes for most genes targeted by drugs correlate well with the effects of those drugs.29–31 These data are supported by 1) Lexicon’s prospective development of neutralizing antibodies that reproduce in WT mice the phenotypes found in Angptl4,273 Fzd4,274 Dkk1,37 Notum37,275 and Angptl3276 KO mice; 2) the prospective development by Regeneron Pharmaceuticals of a human therapeutic antibody that reproduces in humans the Angptl3 KO phenotype;277,278 and 3) Lexicon’s prospective development of small molecules that reproduce in rodents the phenotypes observed in Sglt1,39,279,280 Notum,28,275,281,282 Aak1,283 Limk2,284 Rock1/2285 and Sgpl1286,287 KO mice, along with small molecules that reproduce in multiple species including humans the Sglt2 KO phenotype.39,288–291
The above work confirms the ability of mouse KO phenotypes to model drug effects. Importantly, mouse KO phenotypes model what happens when a drug target is inhibited; thus, when inactivating a gene leads to obesity, drugs must activate the protein product of that gene, or the protein product must itself be an agonist. Agonist drugs are often developed from secreted protein and GPCR families, and both families have been mined for possible obesity therapies.23–25,31 The secreted protein leptin is, of course, a LEPR agonist, and leptin treatment of adults with leptin deficiency dramatically lowered their BW, body fat and food intake.205,206,292 However, treating common polygenic obesity with leptin achieved only modest weight loss,293,294 consistent with studies in rodents295–297 and inconsistent with broad use of leptin as a weight loss therapy. Also, agonists against the MC4R and HTR2C GPCRs have been developed. As noted above, while early MC4R agonists showed significant toxicity, the more recently developed agonist setmelanotide is less toxic and treatment for 4 weeks in 5 subjects with common polygenic obesity led to weight loss of ~0.9 kg/week; a better understanding of how setmelanotide works may lead to MC4R agonists that are safe and effective weight loss drugs for individuals with common polygenic obesity.266,298 Of more relevance here, the obesity of Htr2c KO mice63 inspired development of the HTR2C agonist lorcaserin; HTR2C is neither associated with a GWAS BMI cluster (https://hugeamp.org/) nor a human monogenic obesity gene. Lorcaserin, which has the advantage over peptide drugs of being an orally available small molecule, was approved by the FDA after demonstrating 5% weight loss in 49% of people with common polygenic overweight or obesity after 1 year of treatment.66,299–301 Lorcaserin was removed from the market in 2020 due to increased cancer risk, but development and approval of lorcaserin serves as a precedent for screening KO mouse models to identify obesity drug targets. Finally, identifying drug targets is not the only way that KO mouse models can aid obesity drug discovery. First, our KOs are global, they inactivate the targeted gene throughout the body, just as would a drug targeting the product of that gene; thus, thoroughly characterizing global KO mice may identify undesirable phenotypes that portend undesirable side effects of an on-target drug. Second, global KO models can be used to confirm that the anti-obesity effects of a drug are on-target, as shown by the ability of both lorcaserin and setmelanotide to lower food intake in WT mice but not Htr2c KO or Mc4r KO mice, respectively.65,302
Confirmation of Novel Obesity Phenotypes in Mouse KO Models
The lack of reproducibility in published research has long been recognized but became a major issue a decade ago with reports that industry scientists could not reproduce most published preclinical studies.303–305 A recent update reviewed progress and emphasized that the research culture, particularly at academic institutions, remains a transcending challenge.306 These observations demand confirmation of all novel obesity phenotypes in mouse KO models; data from one KO model at one center is insufficient regardless of investigator, center, study design, data or P value. Confirmation of an obese mouse KO model can be based on studies of:
- A KO of the same gene generated using an independent strategy by a different research group. This is the most frequent approach, and 43 examples are provided above.
- A KO of the same gene generated using an independent strategy by the same research group. For example, Lexicon confirmed the obesity phenotype of Ksr2 KO mice by reproducing the phenotype in an independent Ksr2 KO model.49
- A KO of a different gene that expresses the sole ligand or receptor of the gene product of the obese KO model. Lep/Lepr (ob/ob and db/db) and α-MSH and Mc4r (Pomc/Mc4r) are examples that support this approach.10–13,235 As examples from this report, we used our obese Kiss1r KO mice to first confirm the published phenotype69,70 and then to confirm the obesity of our Kiss1 KO mice, which lack the ligand for KISS1R; in addition, the strikingly similar obesity phenotypes of Prok2 KO and Prok2r KO mice suggest roles for each gene in regulating body fat.
- A KO or inactivating mutation of the same gene in a different species. The best examples are mouse KOs for Mrap2,220 Cep19224 and Cartpt,225,253 which were simultaneously reported as human obesity genes, and KOs for Sim1218,245 and Pcsk1,228,257–261 which were first reported as human obesity genes. In addition, human GWAS data may provide support for a KO obesity phenotype; for example, our Tle4 KO mice are obese and a human GWAS BMI cluster sits within the TLE4 gene, which is at the center of, and the only gene in, a 2.5 MBP stretch of human chromosome 9.
- The effect of a drug that specifically targets the gene product of the obese KO model. The best example is the HTR2C agonist lorcaserin, which lowers body fat of WT mice but not Htr2c KO mice.65
Often, multiple approaches are combined to confirm that a gene is linked to obesity. For Ksr2, confirmation was achieved by observing 1) obesity in two independent in-house KO models; 2) obesity in an external KO model; 3) a strong link of the human KSR2 gene to GWAS BMI clusters; and 4) obesity in humans with KSR2 haploinsufficiency.36,40,49,100 Rather than depend on data from one KO cohort, confirmation requires supporting data from multiple cohorts, following the Bayesian statistical paradigm.307 In the absence of supporting data, there is a real risk that the obesity is a false-positive observation. This caution is particularly appropriate for KO lines that are linked to obesity based exclusively on HTS data. The obesity of these KO lines is best viewed as a hypothesis-generating observation requiring confirmation using an independent KO model.
If a mouse KO obesity phenotype is not confirmed with an independent mouse KO model, there are many issues to consider that may explain the discrepancy:
- Study power.303 Study power depends on strength of phenotype and the number of mice studied/group. As shown in Table 1, the strength of obesity phenotypes characterized under very similar conditions has a wide range, with the well-established Mc4r KO and Prlhr KO phenotypes differing greatly in strength. Power calculations can determine if the number of mice/group was adequate to observe the phenotype in the original and/or confirmatory studies and are particularly important to perform for subtle phenotypes.
- Bias.303 Study methods and interpretation should be reviewed for evidence of bias. Agnostic approaches, such as our HTS approach, are one way to minimize the contribution of bias to study results.
- Mouse KO strategy. Homozygous inactivating PCSK1 mutations led to obesity in humans but not mice; however, obesity was observed in more targeted mouse Pcsk1 mutations and in HET mice.228,257–261 Also, an initial G2e3 KO strategy resulted in embryonic lethality, but two recent and different KO strategies both found that G2e3 KO mice were obese.47 Of note, in our experience gene trap and homologous recombination technologies produced comparable KO phenotypes for Angptl4,273 Tph1,308 and Adamts4 (this manuscript), suggesting that differences between KOs generated by these two techniques are more likely due to differences in specific mutation strategies rather than differences in the two techniques.
- Mouse phenotyping strategy. In our experience, body fat data derived from DXA and QMR technologies are comparable and accurate surrogate measurements of body fat; excellent correlations were found between % body fat measured by both QMR and DXA and by both QMR and carcass analysis.36 However, BW is a less sensitive surrogate measurement for body fat, as exemplified by multiple cohorts of chow fed G2e3 KO and WT mice that showed significant differences in body fat measured by QMR but not in BW.47 For many KO lines, a subtle but significant increase in body fat detected by DXA and/or QMR was not accompanied by a significant increase in BW.
- Mouse age. Obesity would be missed in many mouse KO lines if body fat was measured only at weaning; for example, Ksr2 KO and Adcy3 KO mice show reduced viability with low BW and body fat at weaning but rapidly develop obesity over the next few weeks,49,114 similar to our findings here for Tle4 KO mice.
- Mouse genetic background. Classic studies show that the obesity of ob/ob (Lep) and db/db (Lepr) mice is influenced by background mouse strain.10,309 Similarly, cold tolerance is decreased when Ucp1 KO mice are on a C57BL/6J or 129/SvImJ background but not when on a hybrid C57BL/6J X 129/SvImJ background.310 Background may also explain why Htr2c KO mice were obese on a C57BL/6J background63,64 but not on our hybrid C57BL/6J X 129SvEvBrd background. We often saw phenotypes in adult KO mice maintained on our hybrid background when embryonic lethality was reported for an IMPC KO of the same gene maintained on their C57BL/6N background;28 this hybrid vigor is likely due to a different and broader complement of modifier genes in our KO lines that allows survival and phenotyping.
- Mouse diet. Mouse diet likely influences the strength of the obesity phenotype for certain mouse KO lines. For example, Pnpla2 KO mice were reported as obese when fed chow diet but not HFD135 and Ddah1 KO mice were reported as obese when fed HFD but not chow diet,138 observations supported by our data for each KO line. However, for almost all KO lines reported here, obesity was observed regardless of whether KO and WT littermate mice were fed chow or HFD.
- Mouse sex. Sexual dimorphism has been reported for many phenotypes but was rare in our skeletal37 and obesity phenotyping programs; in our experience, sex differences in either bone or fat HTS data were usually spurious findings associated with an overall weak phenotype that was not reproduced when additional cohorts were studied. Confirming the finding of obesity in mice of a single sex requires additional adequately powered studies that provide data on both male and female KO mice.
- Environment. Environment can influence the amount of body fat stored. For example, Ucp1 KO mice were more likely to be obese at thermoneutrality than at lower temperatures311 and Mc4r KO mice were obese in the absence, but not the presence, of running wheels.312 These observations suggest that researchers evaluate the effects of specific environmental conditions on the phenotype they are studying; ambient temperature, cage size and numbers of mice/cage can all influence body fat accumulation.
- Use of large-scale mouse KO HTS data for confirmation. The ongoing IMPC and the completed Lexicon Pharmaceuticals Genome5000TM programs are the two large-scale mouse phenotyping campaigns that used reverse genetics, which analyzes phenotypes resulting from KO of specific genes, to provide data on the physiologic function of those genes. Their major advantage is using a panel of assays with standardized protocols to discover, in an unbiased manner, a broad range of phenotypes in mice. Their major disadvantages are that mouse cohorts are small and are studied within a narrow age range, creating a risk for false positive and negative results. These and other issues are discussed in a recent review of these two campaigns28 but a few observations on the fidelity of phenotyping by the Lexicon HTS are warranted. Importantly, each KO line compares KO and WT littermates/cagemates for each assay, which controls for environmental differences and for genetic drift of the colony over time. The Lexicon HTS identified established, strong body fat and skeletal KO phenotypes with high fidelity, including correct identification of the body fat phenotype of all 5 KO lines with established published obesity.28,36,37 Novel subtle phenotypes were more challenging. One strength of the Lexicon HTS was that 2 independent cohorts were usually screened for body fat, one fed chow and the other HFD from weaning, which provided insight into the consistency of a body fat phenotype. Nevertheless, the modest obesity observed by HTS in some KO lines was not reproduced when additional in-house cohorts were studied even when both chow- and HFD-fed HTS cohorts appeared obese.36 False-positive phenotypes are also expected for IMPC HTS KO lines.313 Of the 29 KO lines reported here with the novel finding of increased body fat in HTS KO mice, body fat data for 2 of the KO lines (Ksr2 and G2e3) were supported by data from additional internal and external KO cohorts and for 6 of the KO lines were supported by data from additional internal cohorts, but body fat data for the remaining 21 KO lines were unsupported by data from additional cohorts and are at higher risk of being false-positive observations. Ultimately, the novel finding of high body fat in 27 of our KO lines is a hypothesis-generating observation for each line that requires demonstration of significant obesity in an independent external KO model for confirmation.
Summary
Lexicon Pharmaceuticals used high-throughput approaches to both create KO lines for mouse genes that had druggable human orthologs and to analyze body fat in adult littermate/cagemate WT and KO mice from each KO line. Body fat was usually analyzed in 2 independent cohorts of these mice, one maintained on chow diet and the other on HFD from weaning. This program identified dozens of obese KO lines; for many of these lines, the obesity observed in the KO mice confirmed data from previously established KO models, while for others the obesity was a novel finding that will require external confirmation. Undoubtedly, many mammalian obesity genes remain to be identified and characterized.
Acknowledgments
The authors wish to thank all Lexicon animal care, phenotyping and IT professionals who worked diligently to generate and catalog the data presented here, Kristi Boehm, MS, ELS, for her help in editing and in preparing the figures and tables, and Dr. Sadia Saeed for helpful discussions.
Disclosure
All authors were employed by Lexicon Pharmaceuticals, Inc., at the time these studies were performed and may own common stock or may have been granted stock options or other equity incentive awards. The authors report no other conflicts of interest in this work.
References
1. Roberto CA, Swinburn B, Hawkes C, et al. Patchy progress on obesity prevention: emerging examples, entrenched barriers, and new thinking. Lancet. 2015;385:2400–2409. doi:10.1016/S0140-6736(14)61744-X
2. Afshin A, Forouzanfar MH, Reitsma MB, et al. Health effects of overweight and obesity in 195 countries over 25 years. N Engl J Med. 2017;377:13–27.
3. Hales CM, Carroll MD, Fryar CD, Ogden CL Prevalence of obesity and severe obesity among adults: United States, 2017–2018. 2020;NCHS Data Brief No. 360. Available from: https://www.cdc.gov/nchs/products/databriefs/dbs360.htm.
4. Bhupathiraju SN, Hu FB. Epidemiology of obesity and diabetes and their cardiovascular complications. Circ Res. 2016;118:1723–1735. doi:10.1161/CIRCRESAHA.115.306825
5. Allison DB, Kaprio J, Korkeila M, Koskenvuo M, Neale MC, Hayakawa K. The heritability of body mass index among an international sample of monozygotic twins reared apart. Int J Obes Relat Metab Disord. 1996;20:501–506.
6. Zaitlen N, Kraft P, Patterson N, et al. Using extended genealogy to estimate components of heritability for 23 quantitative and dichotomous traits. PLoS Genet. 2013;9(5):e1003520. doi:10.1371/journal.pgen.1003520
7. Hemani G, Yang J, Vinkhuyzen A, et al. Inference of the genetic architecture underlying BMI and height with the use of 20,240 sibling pairs. Am J Hum Genet. 2013;93:865–875. doi:10.1016/j.ajhg.2013.10.005
8. Locke AE, Kahali B, Berndt SI, et al. Genetic studies of body mass index yield new insights for obesity biology. Nature. 2015;518:197–206.
9. Yang J, Bakshi A, Zhu Z, et al. Genetic variance estimation with imputed variants finds negligible missing heritability for human height and body mass index. Nat Genet. 2015;47:1114–1120. doi:10.1038/ng.3390
10. Coleman DL. Obese and diabetes: two mutant genes causing diabetes-obesity syndromes in mice. Diabetologia. 1978;14:141–148. doi:10.1007/BF00429772
11. Halaas JL, Gajiwala KS, Maffei M, et al. Weight-reducing effects of the plasma protein encoded by the obese gene. Science. 1995;269:543–546. doi:10.1126/science.7624777
12. Lee GH, Proenca R, Montez JM, et al. Abnormal splicing of the leptin receptor in diabetic mice. Nature. 1996;379:632–635. doi:10.1038/379632a0
13. Huszar D, Lynch CA, Fairchild-Huntress V, et al. Targeted disruption of the melanocortin-4 receptor results in obesity in mice. Cell. 1997;88:131–141. doi:10.1016/S0092-8674(00)81865-6
14. Chesi A, Grant SF. The genetics of pediatric obesity. Trends Endocrinol Metab. 2015;26:711–721. doi:10.1016/j.tem.2015.08.008
15. Akiyama M, Okada Y, Kanai M, et al. Genome-wide association study identifies 112 new loci for body mass index in the Japanese population. Nat Genet. 2017;49:1458–1467. doi:10.1038/ng.3951
16. Turcot V, Lu Y, Highland HM, et al. Protein-altering variants associated with body mass index implicate pathways that control energy intake and expenditure in obesity. Nat Genet. 2018;50:26–41.
17. Yengo L, Sidorenko J, Kemper KE, et al. Meta-analysis of genome-wide association studies for height and body mass index in ~700000 individuals of European ancestry. Hum Mol Genet. 2018;27(20):3641–3649. doi:10.1093/hmg/ddy271
18. Hoffmann TJ, Choquet H, Yin J, et al. A large multiethnic genome-wide association study of adult body mass index identifies novel loci. Genetics. 2018;210:499–515. doi:10.1534/genetics.118.301479
19. Khera AV, Chaffin M, Wade KH, et al. Polygenic prediction of weight and obesity trajectories from birth to adulthood. Cell. 2019;177:587–596. doi:10.1016/j.cell.2019.03.028
20. Pigeyre M, Yazdi FT, Kaur Y, Meyre D. Recent progress in genetics, epigenetics and metagenomics unveils the pathophysiology of human obesity. Clin Sci (Lond). 2016;130:943–986.
21. Fall T, Mendelson M, Speliotes EK. Recent advances in human genetics and epigenetics of adiposity: pathway to precision medicine? Gastroenterology. 2017;152:1695–1706. doi:10.1053/j.gastro.2017.01.054
22. Rask-Andersen M, Almén MS, Schiöth HB. Scrutinizing the FTO locus: compelling evidence for a complex, long-range regulatory context. Hum Genet. 2015;134:1183–1193. doi:10.1007/s00439-015-1599-5
23. Hopkins AL, Groom CR. The druggable genome. Nature Rev Drug Discov. 2002;1:727–730. doi:10.1038/nrd892
24. Zheng CJ, Han LY, Yap CW, Ji ZL, Cao ZW, Chen YZ. Therapeutic targets: progress of their exploration and investigation of their characteristics. Pharmacol Rev. 2006;58:259–279. doi:10.1124/pr.58.2.4
25. Landry Y, Gies JP. (2008) Drugs and their molecular targets: an updated overview. Fundam Clin Pharmacol. 2008;22:1–18. doi:10.1111/j.1472-8206.2007.00548.x
26. Nadeau JH, Auwerx J. The virtuous cycle of human genetics and mouse models in drug discovery. Nat Rev Drug Discov. 2019;18:255–272. doi:10.1038/s41573-018-0009-9
27. Kitsios GD, Tangri N, Castaldi PJ, Ioannidis JP. Laboratory mouse models for the human genome-wide associations. PLoS One. 2010;5(11):e13782. doi:10.1371/journal.pone.0013782
28. Brommage R, Powell DR, Vogel P. Predicting human disease mutations and identifying drug targets from mouse gene knockout phenotyping campaigns. Dis Model Mech. 2019;12:dmm038224. doi:10.1242/dmm.038224
29. Zambrowicz BP, Sands AT. Knockouts model the 100 best-selling drugs–will they model the next 100? Nat Rev Drug Discov. 2003;2:38–51. doi:10.1038/nrd987
30. Zambrowicz BP, Turner CA, Sands AT. Predicting drug efficacy: knockouts model pipeline drugs of the pharmaceutical industry. Curr Opin Pharmacol. 2003;33:563–570. doi:10.1016/j.coph.2003.04.002
31. Powell DR. Obesity drugs and their targets: correlation of mouse knockout phenotypes with drug effects in vivo. Obes Rev. 2006;7:89–108. doi:10.1111/j.1467-789X.2006.00220.x
32. Speakman J, Hambly C, Mitchell S, Król E. Animal models of obesity. Obes Rev. 2007;1:55–61. doi:10.1111/j.1467-789X.2007.00319.x
33. Zambrowicz BP, Friedrich GA, Buxton EC, Lilleberg SL, Person C, Sands AT. Disruption and sequence identification of 2000 genes in mouse embryonic stem cells. Nature. 1998;392:608–611. doi:10.1038/33423
34. Walke DW, Han C, Shaw J, Wann E, Zambrowicz B, Sands A. In vivo drug target discovery: identifying the best targets from the genome. Curr Opin Biotechnol. 2001;12:626–631. doi:10.1016/S0958-1669(01)00271-3
35. Beltrandelrio H, Kern F, Lanthorn T, et al. Saturation screening of the druggable mammalian genome. In: Carroll PM, Fitzgerald K, editors. Model Organisms in Drug Discovery. Chichester: Wiley & Sons; 2003:251–278.
36. Brommage R, Desai U, Revelli JP, et al. High-throughput screening of mouse knockout lines identifies true lean and obese phenotypes. Obesity. 2008;16:2362–2367. doi:10.1038/oby.2008.361
37. Brommage R, Liu J, Hansen GM, et al. High-throughput screening of mouse gene knockouts identifies established and novel skeletal phenotypes. Bone Res. 2014;2:14034. doi:10.1038/boneres.2014.34
38. Donoviel DB, Freed DD, Vogel OH, et al. Proteinuria and perinatal lethality in mice lacking NEPH1, a novel protein with homology to NEPHRIN. Mol Cell Biol. 2001;21:4829–4836. doi:10.1128/MCB.21.14.4829-4836.2001
39. Powell DR, DaCosta C, Gay J, et al. Improved glycemic control in mice lacking Sglt1 and Sglt2. Am J Physiol Endocrinol Metab. 2013;304:E117–E130. doi:10.1152/ajpendo.00439.2012
40. Pearce LR, Atanassova N, Banton MC, et al. KSR2 mutations are associated with obesity, insulin resistance, and impaired cellular fuel oxidation. Cell. 2013;155:765–777. doi:10.1016/j.cell.2013.09.058
41. Wattler S, Kelly M, Nehls M. Construction of gene targeting vectors from lambda KOS genomic libraries. Biotechniques. 1999;26:1150–1160. doi:10.2144/99266rr02
42. Zambrowicz BP, Abuin A, Ramirez-Solis R, et al. Wnk1 kinase deficiency lowers blood pressure in mice: a gene-trap screen to identify potential targets for therapeutic intervention. Proc Natl Acad Sci USA. 2003;100:14109–14114. doi:10.1073/pnas.2336103100
43. Zambrowicz BP, Holt KH, Walke DW, Kirkpatrick LL, Eberhart DE. Generation of Transgenic Animals. In: Metcalf BW, Dillon S, editors. Target Validation in Drug Discovery. 2006:3–26.
44. Zhang W, Rajan I, Savelieva KV, et al. Netrin-G2 and netrin-G2 ligand are both required for normal auditory responsiveness. Genes Brain Behav. 2008;7:385–392. doi:10.1111/j.1601-183X.2007.00361.x
45. Vogel P, Ding Z-M, Read R, et al. Progressive degenerative myopathy and myosteatosis in Asnsd1-deficient mice. Vet Pathol. 2020;57(5):723–735. doi:10.1177/0300985820939251
46. Pærregaard SI, Agerholm M, Serup AK, et al. FFAR4 (GPR120) Signaling Is Not Required for Anti-Inflammatory and Insulin-Sensitizing Effects of Omega-3 Fatty Acids. Mediators Inflamm. 2016:1536047. doi:10.1155/2016/1536047
47. Powell DR, Doree DD, DaCosta CM, et al. Obesity of G2e3 Knockout Mice Suggests That Obesity-Associated Variants Near Human G2E3 Decrease G2E3 Activity. Diabetes Metab Syndr Obes. 2020;13:2641–2652. doi:10.2147/DMSO.S259546
48. Rajan I, Savelieva KV, Ye GL, et al. Loss of the putative catalytic domain of HDAC4 leads to reduced thermal nociception and seizures while allowing normal bone development. PLoS One. 2009;4:e6612.
49. Revelli JP, Smith D, Allen J, et al. Profound obesity secondary to hyperphagia in mice lacking kinase suppressor of ras 2. Obesity. 2011;19:1010–1018. doi:10.1038/oby.2010.282
50. Gu W, Geddes BJ, Zhang C, Foley KP, Stricker-Krongrad A. The prolactin-releasing peptide receptor (GPR10) regulates body weight homeostasis in mice. J Mol Neurosci. 2004;22:93–103. doi:10.1385/JMN:22:1-2:93
51. Zhao S, Edwards J, Carroll J, et al. Insertion mutation at the C-terminus of the serotonin transporter disrupts brain serotonin function and emotion-related behaviors in mice. Neuroscience. 2006;140:321–334. doi:10.1016/j.neuroscience.2006.01.049
52. Van Sligtenhorst I, Ding ZM, Shi ZZ, Read RW, Hansen G, Vogel P. Cardiomyopathy in alpha-kinase 3 (ALPK3)-deficient mice. Vet Pathol. 2012;49:131–141. doi:10.1177/0300985811402841
53. Rozman J, Rathkolb B, Oestereicher MA, et al. Identification of genetic elements in metabolism by high-throughput mouse phenotyping. Nat Commun. 2018;9:288. doi:10.1038/s41467-017-01995-2
54. van der Klaauw AA, Farooqi IS. The hunger genes: pathways to obesity. Cell. 2015;161:119–132. doi:10.1016/j.cell.2015.03.008
55. Ohki-Hamazaki H, Watase K, Yamamoto K, et al. Mice lacking bombesin receptor subtype-3 develop metabolic defects and obesity. Nature. 1997;390:165–169. doi:10.1038/36568
56. Maekawa F, Quah HM, Tanaka K, Ohki-Hamazaki H. Leptin resistance and enhancement of feeding facilitation by melanin-concentrating hormone in mice lacking bombesin receptor subtype-3. Diabetes. 2004;53:570–576. doi:10.2337/diabetes.53.3.570
57. Chennathukuzhi V, Stein JM, Abel T, et al. Mice deficient for testis-brain RNA-binding protein exhibit a coordinate loss of TRAX, reduced fertility, altered gene expression in the brain, and behavioral changes. Mol Cell Biol. 2003;23:6419–6434. doi:10.1128/MCB.23.18.6419-6434.2003
58. Shah AP, Johnson MD, Fu X, et al. Deletion of translin (Tsn) induces robust adiposity and hepatic steatosis without impairing glucose tolerance. Int J Obes. 2020;44:254–266. doi:10.1038/s41366-018-0315-7
59. Ste Marie L, Miura GI, Marsh DJ, Yagaloff K, Palmiter RD. A metabolic defect promotes obesity in mice lacking melanocortin-4 receptors. Proc Natl Acad Sci USA. 2000;97:12339–12344. doi:10.1073/pnas.220409497
60. Sutton GM, Trevaskis JL, Hulver MW, et al. Diet-genotype interactions in the development of the obese, insulin-resistant phenotype of C57BL/6J mice lacking melanocortin-3 or −4 receptors. Endocrinology. 2006;147:2183–2196. doi:10.1210/en.2005-1209
61. Butler AA, Kesterson RA, Khong K, et al. A unique metabolic syndrome causes obesity in the melanocortin-3 receptor-deficient mouse. Endocrinology. 2000;141:3518–3521. doi:10.1210/endo.141.9.7791
62. Chen AS, Marsh DJ, Trumbauer ME, et al. Inactivation of the mouse melanocortin-3 receptor results in increased fat mass and reduced lean body mass. Nat Genet. 2000;26(1):97–102. doi:10.1038/79254
63. Tecott LH, Sun LM, Akana SF, et al. Eating disorder and epilepsy in mice lacking 5-HT2c serotonin receptors. Nature. 1995;374:542–546. doi:10.1038/374542a0
64. Xu Y, Jones JE, Kohno D, et al. 5-HT2CRs expressed by pro-opiomelanocortin neurons regulate energy homeostasis. Neuron. 2008;60:582–589. doi:10.1016/j.neuron.2008.09.033
65. Fletcher PJ, Tampakeras M, Sinyard J, Slassi A, Isaac M, Higgins GA. Characterizing the effects of 5-HT2C receptor ligands on motor activity and feeding behavior in 5-HT2C receptor knockout mice. Neuropharmacology. 2009;57:259–267. doi:10.1016/j.neuropharm.2009.05.011
66. Bohula EA, Scirica BM, Inzucchi SE, et al. Effect of lorcaserin on prevention and remission of type 2 diabetes in overweight and obese patients (CAMELLIA-TIMI 61): a randomised, placebo-controlled trial. Lancet. 2018;392:2269–2279. doi:10.1016/S0140-6736(18)32328-6
67. Cui J, Ding Y, Chen S, et al. Disruption of Gpr45 causes reduced hypothalamic POMC expression and obesity. J Clin Invest. 2016;126:3192–3206. doi:10.1172/JCI85676
68. Freedman DH. Reinventing the Mouse. Newsweek International; 2003. Perhaps we should add a link here? Available form: https://www.newsweek.com/reinventing-mouse-138309.
69. Wahab F, Atika B, Ullah F, Shahab M, Behr R. Metabolic Impact on the Hypothalamic Kisspeptin-Kiss1r Signaling Pathway. Front Endocrinol (Lausanne). 2018;9:123. doi:10.3389/fendo.2018.00123
70. Tolson KP, Garcia C, Yen S, et al. Impaired kisspeptin signaling decreases metabolism and promotes glucose intolerance and obesity. J Clin Invest. 2014;124:3075–3079. doi:10.1172/JCI71075
71. Nambu H, Fukushima M, Hikichi H, et al. Characterization of metabolic phenotypes of mice lacking GPR61, an orphan G-protein coupled receptor. Life Sci. 2011;89:765–772. doi:10.1016/j.lfs.2011.09.002
72. Kabra DG, Pfuhlmann K, García-Cáceres C, et al. Hypothalamic leptin action is mediated by histone deacetylase 5. Nat Commun. 2016;7:10782. doi:10.1038/ncomms10782
73. Bjursell M, Lennerås M, Göransson M, Elmgren A. GPR10 deficiency in mice results in altered energy expenditure and obesity. Biochem Biophys Res Commun. 2007;363:633–638. doi:10.1016/j.bbrc.2007.09.016
74. Bechtold DA, Luckman SM. Prolactin-releasing Peptide mediates cholecystokinin-induced satiety in mice. Endocrinology. 2006;147:4723–4729. doi:10.1210/en.2006-0753
75. Pražienková V, Popelová A, Kuneš J, Maletínská L. Prolactin-Releasing Peptide: physiological and Pharmacological Properties. Int J Mol Sci. 2019;20:
76. Chen X, Margolis KJ, Gershon MD, Schwartz GJ, Sze JY. Reduced serotonin reuptake transporter (SERT) function causes insulin resistance and hepatic steatosis independent of food intake. PLoS One. 2012;7:e32511. doi:10.1371/journal.pone.0032511
77. Zha W, Ho HTB, Hu T, Hebert MF, Wang J. Serotonin transporter deficiency drives estrogen-dependent obesity and glucose intolerance. Sci Rep. 2017;7:1137. doi:10.1038/s41598-017-01291-5
78. Qi Y, Nie Z, Lee YS, et al. Loss of resistin improves glucose homeostasis in leptin deficiency. Diabetes. 2006;55:3083–3090. doi:10.2337/db05-0615
79. Kim KH, Zhao L, Moon Y, Kang C, Sul HS. Dominant inhibitory adipocyte-specific secretory factor (ADSF)/resistin enhances adipogenesis and improves insulin sensitivity. Proc Natl Acad Sci USA. 2004;101:6780–6785. doi:10.1073/pnas.0305905101
80. Fulzele K, Lai F, Dedic C, et al. Osteocyte-Secreted Wnt Signaling Inhibitor Sclerostin Contributes to Beige Adipogenesis in Peripheral Fat Depots. J Bone Miner Res. 2017;32:373–384. doi:10.1002/jbmr.3001
81. van Lierop AH, Appelman-Dijkstra NM, Papapoulos SE. Sclerostin deficiency in humans. Bone. 2017;96:51–62. doi:10.1016/j.bone.2016.10.010
82. Kim SP, Frey JL, Li Z, et al. Sclerostin influences body composition by regulating catabolic and anabolic metabolism in adipocytes. Proc Natl Acad Sci USA. 2017;114:E11238–E11247. doi:10.1073/pnas.1707876115
83. Krause AR, Donahue H, Lang C, et al. Sclerostin Deficient Mice Display Sarcopenia But Also Resistance To Bone Loss During Hind Limb Suspension. J Bone Miner Res. 2015;29 Suppl 1:458.
84. Jansson JO, Palsdottir V, Hägg DA, et al. Body weight homeostat that regulates fat mass independently of leptin in rats and mice. Proc Natl Acad Sci USA. 2018;115:427–432. doi:10.1073/pnas.1715687114
85. Kelley AE. Ventral striatal control of appetitive motivation: role in ingestive behavior and reward-related learning. Neurosci Biobehav Rev. 2004;27:765–776.
86. Tabarin A, Diz-Chaves Y, Carmona Mdel C, et al. Resistance to diet-induced obesity in mu-opioid receptor-deficient mice: evidence for a “thrifty gene”. Diabetes. 2005;54:3510–3516. doi:10.2337/diabetes.54.12.3510
87. Zuberi AR, Townsend L, Patterson L, Zheng H, Berthoud HR. Increased adiposity on normal diet, but decreased susceptibility to diet-induced obesity in mu-opioid receptor-deficient mice. Eur J Pharmacol. 2008;585:14–23. doi:10.1016/j.ejphar.2008.01.047
88. Han W, Hata H, Imbe H, et al. Increased body weight in mice lacking mu-opioid receptors. Neuroreport. 2016;17:941–944. doi:10.1097/01.wnr.0000221829.87974.ad
89. Batterham RL, Heffron H, Kapoor S, et al. Critical role for peptide YY in protein-mediated satiation and body-weight regulation. Cell Metab. 2006;4:223–233. doi:10.1016/j.cmet.2006.08.001
90. Boey D, Lin S, Karl T, et al. Peptide YY ablation in mice leads to the development of hyperinsulinaemia and obesity. Diabetologia. 2006;49:1360–1370. doi:10.1007/s00125-006-0237-0
91. Wortley KE, Garcia K, Okamoto H, et al. Peptide YY regulates bone turnover in rodents. Gastroenterology. 2007;133:1534–1543. doi:10.1053/j.gastro.2007.08.024
92. Schonhoff S, Baggio L, Ratineau C, et al. Energy homeostasis and gastrointestinal endocrine differentiation do not require the anorectic hormone peptide YY. Mol Cell Biol. 2005;25:4189–4199. doi:10.1128/MCB.25.10.4189-4199.2005
93. Zhang L, Nguyen AD, Lee IC, et al. NPY modulates PYY function in the regulation of energy balance and glucose homeostasis. Diabetes Obes Metab. 2012;14:727–736. doi:10.1111/j.1463-1326.2012.01592.x
94. Ichimura A, Hirasawa A, Poulain-Godefroy O, et al. Dysfunction of lipid sensor GPR120 leads to obesity in both mouse and human. Nature. 2012;483:350–354. doi:10.1038/nature10798
95. Suckow AT, Polidori D, Yan W, et al. Alteration of the glucagon axis in GPR120 (FFAR4) knockout mice: a role for GPR120 in glucagon secretion. J Biol Chem. 2014;289:15751–15763. doi:10.1074/jbc.M114.568683
96. Oh DY, Talukdar S, Bae EJ, et al. GPR120 is an omega-3 fatty acid receptor mediating potent anti-inflammatory and insulin-sensitizing effects. Cell. 2010;142:687–698. doi:10.1016/j.cell.2010.07.041
97. Li X, Ballantyne LL, Che X, et al. Endogenously generated omega-3 fatty acids attenuate vascular inflammation and neointimal hyperplasia by interaction with free fatty acid receptor 4 in mice. J Am Heart Assoc. 2015;4:e001856. doi:10.1161/JAHA.115.001856
98. Oh DY, Walenta E, Akiyama TE, et al. A Gpr120-selective agonist improves insulin resistance and chronic inflammation in obese mice. Nat Med. 2014;20:942–947. doi:10.1038/nm.3614
99. Vestmar MA, Andersson EA, Christensen CR, et al. Functional and genetic epidemiological characterisation of the FFAR4 (GPR120) p.R270H variant in the Danish population. J Med Genet. 2016;53:616–623. doi:10.1136/jmedgenet-2015-103728
100. Costanzo-Garvey DL, Pfluger PT, Dougherty MK, et al. KSR2 is an essential regulator of AMP kinase, energy expenditure, and insulin sensitivity. Cell Metab. 2009;10:366–378. doi:10.1016/j.cmet.2009.09.010
101. Brooks WS, Helton ES, Banerjee S, et al. G2E3 is a dual function ubiquitin ligase required for early embryonic development. J Biol Chem. 2008;283:22304–22315. doi:10.1074/jbc.M803238200
102. Young KL, Graff M, North KE, et al. Influence of SNP*SNP interaction on BMI in European American adolescents: findings from the National Longitudinal Study of Adolescent Health. Pediatr Obes. 2016;11:95–101. doi:10.1111/ijpo.12026
103. Muller YL, Hanson RL, Piaggi P, et al. Assessing the Role of 98 Established Loci for BMI in American Indians. Obesity. 2019;27:845–854. doi:10.1002/oby.22433
104. Cheng M, Mei B, Zhou Q, et al. Computational analyses of obesity associated loci generated by genome-wide association studies. PLoS One. 2018;13:e0199987. doi:10.1371/journal.pone.0199987
105. Lee G, Zheng Y, Cho S, et al. Post-transcriptional Regulation of De Novo Lipogenesis by mTORC1-S6K1-SRPK2 Signaling. Cell. 2017;171:1545–1558.e18. doi:10.1016/j.cell.2017.10.037
106. Emdin CA, Khera AV, Natarajan P, et al. Genetic Association of Waist-to-Hip Ratio With Cardiometabolic Traits, Type 2 Diabetes, and Coronary Heart Disease. JAMA. 2017;317:626–634. doi:10.1001/jama.2016.21042
107. Wilson CH, Indarto D, Doucet A, et al. Identifying natural substrates for dipeptidyl peptidases 8 and 9 using terminal amine isotopic labeling of substrates (TAILS) reveals in vivo roles in cellular homeostasis and energy metabolism. J Biol Chem. 2013;288:13936–13949. doi:10.1074/jbc.M112.445841
108. Ross B, Krapp S, Augustin M, et al. Structures and mechanism of dipeptidyl peptidases 8 and 9, important players in cellular homeostasis and cancer. Proc Natl Acad Sci USA. 2018;115:E1437–E1445. doi:10.1073/pnas.1717565115
109. Fu Y, Wang Z, Luo C, et al. Downregulation of CXXC Finger Protein 4 Leads to a Tamoxifen-resistant Phenotype in Breast Cancer Cells Through Activation of the Wnt/β-catenin Pathway. Transl Oncol. 2020;13:423–440. doi:10.1016/j.tranon.2019.12.005
110. Berns DS, DeNardo LA, Pederick DT, Luo L. Teneurin-3 controls topographic circuit assembly in the hippocampus. Nature. 2018;554:328–333. doi:10.1038/nature25463
111. Leamey CA, Merlin S, Lattouf P, et al. Ten-m3 regulates eye-specific patterning in the mammalian visual pathway and is required for binocular vision. PLoS Biol. 2007;5:e241. doi:10.1371/journal.pbio.0050241
112. Siljee JE, Wang Y, Bernard AA, et al. Subcellular localization of MC4R with ADCY3 at neuronal primary cilia underlies a common pathway for genetic predisposition to obesity. Nat Genet. 2018;50:180–185. doi:10.1038/s41588-017-0020-9
113. Wong ST, Trinh K, Hacker B, et al. Disruption of the type III adenylyl cyclase gene leads to peripheral and behavioral anosmia in transgenic mice. Neuron. 2000;27:487–497. doi:10.1016/S0896-6273(00)00060-X
114. Wang Z, Li V, Chan GC, et al. Adult type 3 adenylyl cyclase-deficient mice are obese. PLoS One. 2009;4:e6979. doi:10.1371/journal.pone.0006979
115. Tong T, Shen Y, Lee HW, Yu R, Park T. Adenylyl cyclase 3 haploinsufficiency confers susceptibility to diet-induced obesity and insulin resistance in mice. Sci Rep. 2016;6:34179. doi:10.1038/srep34179
116. Pitman JL, Wheeler MC, Lloyd DJ, Walker JR, Glynne RJ, Gekakis N. A gain-of-function mutation in adenylate cyclase 3 protects mice from diet-induced obesity. PLoS One. 2014;9:e110226. doi:10.1371/journal.pone.0110226
117. Grarup N, Moltke I, Andersen MK, et al. Loss-of-function variants in ADCY3 increase risk of obesity and type 2 diabetes. Nat Genet. 2018;50:172–174. doi:10.1038/s41588-017-0022-7
118. Saeed S, Bonnefond A, Tamanini F, et al. Loss-of-function mutations in ADCY3 cause monogenic severe obesity. Nat Genet. 2018;50:175–179. doi:10.1038/s41588-017-0023-6
119. Picard F, Géhin M, Annicotte J, et al. SRC-1 and TIF2 control energy balance between white and brown adipose tissues. Cell. 2002;111:931–941. doi:10.1016/S0092-8674(02)01169-8
120. Yang Y, van der Klaauw AA, Zhu L, et al. Steroid receptor coactivator-1 modulates the function of Pomc neurons and energy homeostasis. Nat Commun. 2019;10:1718. doi:10.1038/s41467-019-08737-6
121. Kim DH, Do MS. BAFF knockout improves systemic inflammation via regulating adipose tissue distribution in high-fat diet-induced obesity. Exp Mol Med. 2015;47:e129. doi:10.1038/emm.2014.98
122. Nakamura Y, Abe M, Kawasaki K, et al. Depletion of B cell-activating factor attenuates hepatic fat accumulation in a murine model of nonalcoholic fatty liver disease. Sci Rep. 2019;9:977. doi:10.1038/s41598-018-37403-y
123. Kim J, Joo S, Eom GH, et al. CCN5 knockout mice exhibit lipotoxic cardiomyopathy with mild obesity and diabetes. PLoS One. 2018;13:e0207228. doi:10.1371/journal.pone.0207228
124. Sawane M, Kajiya K, Kidoya H, Takagi M, Muramatsu F, Takakura N. Apelin inhibits diet-induced obesity by enhancing lymphatic and blood vessel integrity. Diabetes. 2013;62:1970–1980. doi:10.2337/db12-0604
125. Tateishi K, Okada Y, Kallin EM, Zhang Y. Role of Jhdm2a in regulating metabolic gene expression and obesity resistance. Nature. 2009;458:7577. doi:10.1038/nature07777
126. Inagaki T, Tachibana M, Magoori K, et al. Obesity and metabolic syndrome in histone demethylase JHDM2a-deficient mice. Genes Cells. 2009;14:991–1001. doi:10.1111/j.1365-2443.2009.01326.x
127. Okada Y, Tateishi K, Zhang Y. Histone demethylase JHDM2A is involved in male infertility and obesity. J Androl. 2010;31:75–78. doi:10.2164/jandrol.109.008052
128. Lin M, Zhao Z, Yang Z, et al. USP38 Inhibits Type I Interferon Signaling by Editing TBK1 Ubiquitination through NLRP4 Signalosome. Mol Cell. 2016;64:267–281. doi:10.1016/j.molcel.2016.08.029
129. Chen S, Yun F, Yao Y, et al. USP38 critically promotes asthmatic pathogenesis by stabilizing JunB protein. J Exp Med. 2018;215:2850–2867. doi:10.1084/jem.20172026
130. Nguyen LS, Schneider T, Rio M, et al. A nonsense variant in HERC1 is associated with intellectual disability, megalencephaly, thick corpus callosum and cerebellar atrophy. Eur J Hum Genet. 2016;24:455–458. doi:10.1038/ejhg.2015.140
131. Schwarz JM, Pedrazza L, Stenzel W, Rosa JL, Schuelke M, Straussberg R. A new homozygous HERC1 gain-of-function variant in MDFPMR syndrome leads to mTORC1 hyperactivation and reduced autophagy during cell catabolism. Mol Genet Metab. 2020;4:S1096. doi:10.1016/j.ymgme.2020.08.008
132. Jeong HJ, Lee HJ, Vuong TA, et al. Prmt7 Deficiency Causes Reduced Skeletal Muscle Oxidative Metabolism and Age-Related Obesity. Diabetes. 2016;65:1868–1882. doi:10.2337/db15-1500
133. Moise AR, Lobo GP, Erokwu B, et al. Increased adiposity in the retinol saturase-knockout mouse. FASEB J. 2010;24:1261–1270. doi:10.1096/fj.09-147207
134. Missaglia S, Maggi L, Mora M, et al. Late onset of neutral lipid storage disease due to novel PNPLA2 mutations causing total loss of lipase activity in a patient with myopathy and slight cardiac involvement. Neuromuscul Disord. 2017;27:481–486. doi:10.1016/j.nmd.2017.01.011
135. Schreiber R, Hofer P, Taschler U, et al. Hypophagia and metabolic adaptations in mice with defective ATGL-mediated lipolysis cause resistance to HFD-induced obesity. Proc Natl Acad Sci USA. 2015;112:13850–13855. doi:10.1073/pnas.1516004112
136. Wu JW, Wang SP, Casavant S, Moreau A, Yang GS, Mitchell GA. Fasting energy homeostasis in mice with adipose deficiency of desnutrin/adipose triglyceride lipase. Endocrinology. 2012;153:2198–2207. doi:10.1210/en.2011-1518
137. Trites MJ, Clugston RD. The role of adipose triglyceride lipase in lipid and glucose homeostasis: lessons from transgenic mice. Lipids Health Dis. 2019;18:204. doi:10.1186/s12944-019-1151-z
138. Li T, Feng R, Zhao C, et al. Dimethylarginine Dimethylaminohydrolase 1 Protects Against High-Fat Diet-Induced Hepatic Steatosis and Insulin Resistance in Mice. Antioxid Redox Signal. 2017;26:598–609. doi:10.1089/ars.2016.6742
139. Bour S, Caspar-Bauguil S, Iffiú-Soltész Z, et al. Semicarbazide-sensitive amine oxidase/vascular adhesion protein-1 deficiency reduces leukocyte infiltration into adipose tissue and favors fat deposition. Am J Pathol. 2009;174:1075–1083. doi:10.2353/ajpath.2009.080612
140. Jargaud V, Bour S, Tercé F, et al. Obesity of mice lacking VAP-1/SSAO by Aoc3 gene deletion is reproduced in mice expressing a mutated vascular adhesion protein-1 (VAP-1) devoid of amine oxidase activity. J Physiol Biochem. 2020. doi:10.1007/s13105-020-00756-y
141. Huang YC, Liu SP, Chen SY, et al. Increased Expression of Ecto-NOX Disulfide-thiol Exchanger 1 (ENOX1) in Diabetic Mice Retina and its Involvement in Diabetic Retinopathy Development. In Vivo (Brooklyn). 2019;33:1801–1806. doi:10.21873/invivo.11671
142. Ratai O, Hermainski J, Ravichandran K, Pongs O. NCS-1 Deficiency Is Associated With Obesity and Diabetes Type 2 in Mice. Front Mol Neurosci. 2019;12:78. doi:10.3389/fnmol.2019.00078
143. Fang X, Chung J, Olsen E, et al. Depletion of regulator-of-G-protein signaling-10 in mice exaggerates high-fat diet-induced insulin resistance and inflammation, and this effect is mitigated by dietary green tea extract. Nutr Res. 2019;70:50–59. doi:10.1016/j.nutres.2018.06.004
144. Virgilio F. North RA P2X receptors. Philos Trans R Soc Lond B Biol Sci. 2016;371:20150427. doi:10.1098/rstb.2015.0427
145. DeMambro VE, Le PT, Guntur AR, et al. Gender-specific changes in bone turnover and skeletal architecture in igfbp-2-null mice. Endocrinology. 2008;149:2051–2061. doi:10.1210/en.2007-1068
146. Guidi LG, Holloway ZG, Arnoult C, et al. AU040320 deficiency leads to disruption of acrosome biogenesis and infertility in homozygous mutant mice. Sci Rep. 2018;8:10379. doi:10.1038/s41598-018-28666-6
147. Zhang H, Zhang SY, Jiang C, et al. Intermedin/adrenomedullin 2 polypeptide promotes adipose tissue browning and reduces high-fat diet-induced obesity and insulin resistance in mice. Int J Obes. 2016;40:852–860. doi:10.1038/ijo.2016.2
148. Lv Y, Zhang SY, Liang X, et al. Adrenomedullin 2 Enhances Beiging in White Adipose Tissue Directly in an Adipocyte-autonomous Manner and Indirectly through Activation of M2 Macrophages. J Biol Chem. 2016;291:23390–23402. doi:10.1074/jbc.M116.735563
149. Bech EM, Voldum-Clausen K, Pedersen SL, et al. Adrenomedullin and glucagon-like peptide-1 have additive effects on food intake in mice. Biomed Pharmacother. 2019;109:167–173. doi:10.1016/j.biopha.2018.10.040
150. Shimosawa T, Shibagaki Y, Ishibashi K, et al. Adrenomedullin, an endogenous peptide, counteracts cardiovascular damage. Circulation. 2002;105:106–111. doi:10.1161/hc0102.101399
151. Cline MA, Bowden CN, Calchary WA, Layne JE. Short-term anorexigenic effects of central neuropeptide VF are associated with hypothalamic changes in chicks. J Neuroendocrinol. 2008;20:971–977. doi:10.1111/j.1365-2826.2008.01749.x
152. Cline MA, Sliwa LN. Neuropeptide VF-associated satiety involves mu and kappa but not delta subtypes of opioid receptors in chicks. Neurosci Lett. 2009;455:195–198. doi:10.1016/j.neulet.2009.03.029
153. Lopez PH, Aja S, Aoki K, et al. Mice lacking sialyltransferase ST3Gal-II develop late-onset obesity and insulin resistance. Glycobiology. 2017;27:129–139. doi:10.1093/glycob/cww098
154. Wohua Z, Weiming X. Glutaredoxin 2 (GRX2) deficiency exacerbates high fat diet (HFD)-induced insulin resistance, inflammation and mitochondrial dysfunction in brain injury: a mechanism involving GSK-3β. Biomed Pharmacother. 2019;118:108940. doi:10.1016/j.biopha.2019.108940
155. Qian H, Chen Y, Nian Z, et al. HDAC6-mediated acetylation of lipid droplet-binding protein CIDEC regulates fat-induced lipid storage. J Clin Invest. 2017;127:1353–1369. doi:10.1172/JCI85963
156. Lieber AD, Beier UH, Xiao H, et al. Loss of HDAC6 alters gut microbiota and worsens obesity. FASEB J. 2019;33:1098–1109. doi:10.1096/fj.201701586R
157. Arriga R, Pacifici F, Capuani B, et al. Peroxiredoxin 6 Is a Key Antioxidant Enzyme in Modulating the Link between Glycemic and Lipogenic Metabolism. Oxid Med Cell Longev. 2019:9685607. doi:10.1155/2019/9685607
158. Chang YC, Yu YH, Shew JY, et al. Deficiency of NPGPx, an oxidative stress sensor, leads to obesity in mice and human. EMBO Mol Med. 2013;5:1165–1179. doi:10.1002/emmm.201302679
159. Zhu R, Cheng M, Lu T, et al. A Disintegrin and Metalloproteinase with Thrombospondin Motifs 18 Deficiency Leads to Visceral Adiposity and Associated Metabolic Syndrome in Mice. Am J Pathol. 2018;188(2):461–473. doi:10.1016/j.ajpath.2017.10.020
160. Chao LC, Wroblewski K, Zhang Z, et al. Insulin resistance and altered systemic glucose metabolism in mice lacking Nur77. Diabetes. 2009;58:2788–2796. doi:10.2337/db09-0763
161. Perez-Sieira S, Martinez G, Porteiro B, et al. Female Nur77-deficient mice show increased susceptibility to diet-induced obesity. PLoS One. 2013;8:e53836. doi:10.1371/journal.pone.0053836
162. Hibuse T, Maeda N, Funahashi T, et al. Aquaporin 7 deficiency is associated with development of obesity through activation of adipose glycerol kinase. Proc Natl Acad Sci USA. 2005;102:10993–10998. doi:10.1073/pnas.0503291102
163. Hara-Chikuma M, Sohara E, Rai T, et al. Progressive adipocyte hypertrophy in aquaporin-7-deficient mice: adipocyte glycerol permeability as a novel regulator of fat accumulation. J Biol Chem. 2005;280:15493–15496. doi:10.1074/jbc.C500028200
164. Hibuse T, Maeda N, Nakatsuji H, et al. The heart requires glycerol as an energy substrate through aquaporin 7, a glycerol facilitator. Cardiovasc Res. 2009;83:34–41. doi:10.1093/cvr/cvp095
165. Mallo M, Gendron-Maguire M, Harbison ML, Gridley T. Protein characterization and targeted disruption of Grg, a mouse gene related to the groucho transcript of the Drosophila Enhancer of split complex. Dev Dyn. 1995;204:338–347. doi:10.1002/aja.1002040311
166. Wheat JC, Krause DS, Shin TH, et al. The corepressor Tle4 is a novel regulator of murine hematopoiesis and bone development. PLoS One. 2014;9:e105557. doi:10.1371/journal.pone.0105557
167. Noma T. Dynamics of nucleotide metabolism as a supporter of life phenomena. J Med Invest. 2005;52:127–136. doi:10.2152/jmi.52.127
168. Mazitov T, Bregin A, Philips MA, Innos J, Vasar E. Deficit in emotional learning in neurotrimin knockout mice. Behav Brain Res. 2017;317:311–318. doi:10.1016/j.bbr.2016.09.064
169. Yu X, Zhai C, Fan Y, et al. TUSC3: a novel tumour suppressor gene and its functional implications. J Cell Mol Med. 2017;21:1711–1718. doi:10.1111/jcmm.13128
170. Neville MJ, Johnstone EC, Walton RT. Identification and characterization of ANKK1: a novel kinase gene closely linked to DRD2 on chromosome band 11q23.1. Hum Mutat. 2004;23:540–545. doi:10.1002/humu.20039
171. Noble EP, Noble RE, Ritchie T, et al. D2 dopamine receptor gene and obesity. Int J Eat Disord. 1994;15:205–217. doi:10.1002/1098-108X(199404)15:3<205::AID-EAT2260150303>3.0.CO;2-P
172. Jönsson EG, Nöthen MM, Grünhage F, et al. Polymorphisms in the dopamine D2 receptor gene and their relationships to striatal dopamine receptor density of healthy volunteers. Mol Psychiatry. 1999;4:290–296. doi:10.1038/sj.mp.4000532
173. Epstein LH, Temple JL, Neaderhiser BJ, Salis RJ, Erbe RW, Leddy JJ. Food reinforcement, the dopamine D2 receptor genotype, and energy intake in obese and nonobese humans. Behav Neurosci. 2007;121:877–886. doi:10.1037/0735-7044.121.5.877
174. Sun X, Luquet S, Small DM. DRD2: bridging the Genome and Ingestive Behavior. Trends Cogn Sci. 2017;21:372–384. doi:10.1016/j.tics.2017.03.004
175. Lin X, Lim IY, Wu Y, et al. Developmental pathways to adiposity begin before birth and are influenced by genotype, prenatal environment and epigenome. BMC Med. 2017;15:50. doi:10.1186/s12916-017-0800-1
176. Goulding DR, Nikolova VD, Mishra L, et al. Inter-α-inhibitor deficiency in the mouse is associated with alterations in anxiety-like behavior, exploration and social approach. Genes Brain Behav. 2019;18:e12505. doi:10.1111/gbb.12505
177. Kim TH, Koo JH, Heo MJ, et al. Overproduction of inter-α-trypsin inhibitor heavy chain 1 after loss of Gα13 in liver exacerbates systemic insulin resistance in mice. Sci Transl Med. 2019;11:eaan4735. doi:10.1126/scitranslmed.aan4735
178. Takashima N, Odaka YS, Sakoori K, et al. Impaired cognitive function and altered hippocampal synapse morphology in mice lacking Lrrtm1, a gene associated with schizophrenia. PLoS One. 2011;6:e22716. doi:10.1371/journal.pone.0022716
179. Voikar V, Kulesskaya N, Laakso T, et al. LRRTM1-deficient mice show a rare phenotype of avoiding small enclosures–a tentative mouse model for claustrophobia-like behaviour. Behav Brain Res. 2013;238:69–78. doi:10.1016/j.bbr.2012.10.013
180. Lou X, Kang B, Zhang J, et al. MFAP3L activation promotes colorectal cancer cell invasion and metastasis. Biochim Biophys Acta. 2014;1842:1423–1432. doi:10.1016/j.bbadis.2014.04.006
181. Roussel E, Drolet MC, Lavigne AM, Arsenault M, Couet J. Multiple short-chain dehydrogenases/reductases are regulated in pathological cardiac hypertrophy. FEBS Open Bio. 2018;8:1624–1635. doi:10.1002/2211-5463.12506
182. Sacchetti C, Bai Y, Stanford SM, et al. PTP4A1 promotes TGFbeta signaling and fibrosis in systemic sclerosis. Nat Commun. 2017;8:1060. doi:10.1038/s41467-017-01168-1
183. Baker JA, Li J, Zhou D, et al. Analyses of differentially expressed genes after exposure to acute stress, acute ethanol, or a combination of both in mice. Alcohol. 2017;58:139–151. doi:10.1016/j.alcohol.2016.08.008
184. Tanabe A, Yanagiya T, Iida A, et al. Functional single-nucleotide polymorphisms in the secretogranin III (SCG3) gene that form secretory granules with appetite-related neuropeptides are associated with obesity. J Clin Endocrinol Metab. 2007;92:1145–1154. doi:10.1210/jc.2006-1808
185. Atari E, Perry MC, Jose PA, Kumarasamy S. Regulated Endocrine-Specific Protein-18, an Emerging Endocrine Protein in Physiology: a Literature Review. Endocrinology. 2019;160:2093–2100. doi:10.1210/en.2019-00397
186. Saeki K, Zhu M, Kubosaki A, Xie J, Lan MS, Notkins AL. Targeted disruption of the protein tyrosine phosphatase-like molecule IA-2 results in alterations in glucose tolerance tests and insulin secretion. Diabetes. 2002;51:1842–1850. doi:10.2337/diabetes.51.6.1842
187. Kumarasamy S, Waghulde H, Cheng X, et al. Targeted disruption of regulated endocrine-specific protein (Resp18) in Dahl SS/Mcw rats aggravates salt-induced hypertension and renal injury. Physiol Genomics. 2018;50:369–375. doi:10.1152/physiolgenomics.00008.2018
188. Fukumoto K, Tamada K, Toya T, Nishino T, Yanagawa Y, Takumi T. Identification of genes regulating GABAergic interneuron maturation. Neurosci Res. 2018;134:18–29. doi:10.1016/j.neures.2017.11.010
189. Sheikh A, Takatori A, Hossain MS, et al. Unfavorable neuroblastoma prognostic factor NLRR2 inhibits cell differentiation by transcriptional induction through JNK pathway. Cancer Sci. 2016;107:1223–1232. doi:10.1111/cas.13003
190. Gutierrez-Aguilar R, Kim DH, Casimir M, et al. The role of the transcription factor ETV5 in insulin exocytosis. Diabetologia. 2014;57:383–391. doi:10.1007/s00125-013-3096-5
191. Kon N, Wang D, Li T, et al. Inhibition of Mdmx (Mdm4) in vivo induces anti-obesity effects. Oncotarget. 2018;9:7282–7297. doi:10.18632/oncotarget.23837
192. Fotaki V, Larralde O, Zeng S, et al. Loss of Wnt8b has no overt effect on hippocampus development but leads to altered Wnt gene expression levels in dorsomedial telencephalon. Dev Dyn. 2010;239:284–296. doi:10.1002/dvdy.22137
193. Zhang N, Fu Z, Linke S, et al. The asparaginyl hydroxylase factor inhibiting HIF-1alpha is an essential regulator of metabolism. Cell Metab. 2010;11:364–378. doi:10.1016/j.cmet.2010.03.001
194. Park J, Yoon YS, Han HS, et al. SIK2 is critical in the regulation of lipid homeostasis and adipogenesis in vivo. Diabetes. 2014;63:3659–3673. doi:10.2337/db13-1423
195. Bolton J, Montastier E, Carayol J, et al. Molecular Biomarkers for Weight Control in Obese Individuals Subjected to a Multiphase Dietary Intervention. J Clin Endocrinol Metab. 2017;102:2751–2761. doi:10.1210/jc.2016-3997
196. Dodé C, Rondard P. PROK2/PROKR2 Signaling and Kallmann Syndrome. Front Endocrinol (Lausanne). 2013;4:19. doi:10.3389/fendo.2013.00019
197. Matsumoto S, Yamazaki C, Masumoto KH, et al. Abnormal development of the olfactory bulb and reproductive system in mice lacking prokineticin receptor PKR2. Proc Natl Acad Sci USA. 2006;103:4140–4145. doi:10.1073/pnas.0508881103
198. Pitteloud N, Zhang C, Pignatelli D, et al. Loss-of-function mutation in the prokineticin 2 gene causes Kallmann syndrome and normosmic idiopathic hypogonadotropic hypogonadism. Proc Natl Acad Sci USA. 2007;104:17447–17452. doi:10.1073/pnas.0707173104
199. Gardiner JV, Bataveljic A, Patel NA, et al. Prokineticin 2 is a hypothalamic neuropeptide that potently inhibits food intake. Diabetes. 2010;59:397–406. doi:10.2337/db09-1198
200. Mortreux M, Foppen E, Denis RG, et al. New roles for prokineticin 2 in feeding behavior, insulin resistance and type 2 diabetes: studies in mice and humans. Mol Metab. 2019;29:182–196. doi:10.1016/j.molmet.2019.08.016
201. Kumar S, Chen M, Li Y, et al. Loss of ADAMTS4 reduces high fat diet-induced atherosclerosis and enhances plaque stability in ApoE(-/-) mice. Sci Rep. 2016;6:31130. doi:10.1038/srep31130
202. Justice MJ, Dhillon P. Using the mouse to model human disease: increasing validity and reproducibility. Dis Model Mech. 2016;9:101–103. doi:10.1242/dmm.024547
203. Seok J, Warren HS, Cuenca AG, et al. Genomic responses in mouse models poorly mimic human inflammatory diseases. Proc Natl Acad Sci USA. 2013;110:3507–3512. doi:10.1073/pnas.1222878110
204. Montague CT, Farooqi IS, Whitehead JP, et al. Congenital leptin deficiency is associated with severe early-onset obesity in humans. Nature. 1997;387:903–908. doi:10.1038/43185
205. Farooqi IS, Jebb SA, Langmack G, et al. Effects of recombinant leptin therapy in a child with congenital leptin deficiency. N Engl J Med. 1999;341:879–884. doi:10.1056/NEJM199909163411204
206. Farooqi IS, Matarese G, Lord GM, et al. Beneficial effects of leptin on obesity, T cell hyporesponsiveness, and neuroendocrine/metabolic dysfunction of human congenital leptin deficiency. J Clin Invest. 2002;110:1093–1103. doi:10.1172/JCI0215693
207. Clément K, Vaisse C, Lahlou N, et al. A mutation in the human leptin receptor gene causes obesity and pituitary dysfunction. Nature. 1998;392:398–401. doi:10.1038/32911
208. Farooqi IS, Wangensteen T, Collins S, et al. Clinical and molecular genetic spectrum of congenital deficiency of the leptin receptor. N Engl J Med. 2007;356:237–247. doi:10.1056/NEJMoa063988
209. Yeo GS, Farooqi IS, Aminian S, Halsall DJ, Stanhope RG, O’Rahilly S. A frameshift mutation in MC4R associated with dominantly inherited human obesity. Nat Genet. 1998;20:111–112. doi:10.1038/2404
210. Farooqi IS, Yeo GS, Keogh JM, et al. Dominant and recessive inheritance of morbid obesity associated with melanocortin 4 receptor deficiency. J Clin Invest. 2000;106:271–279. doi:10.1172/JCI9397
211. Farooqi IS, Keogh JM, Yeo GS, Lank EJ, Cheetham T, O’Rahilly S. Clinical spectrum of obesity and mutations in the melanocortin 4 receptor gene. N Engl J Med. 2003;348:1085–1095. doi:10.1056/NEJMoa022050
212. Challis BG, Pritchard LE, Creemers JW, et al. A missense mutation disrupting a dibasic prohormone processing site in pro-opiomelanocortin (POMC) increases susceptibility to early-onset obesity through a novel molecular mechanism. Hum Mol Genet. 2002;11:1997–2004. doi:10.1093/hmg/11.17.1997
213. Krude H, Biebermann H, Schnabel D, et al. Obesity due to proopiomelanocortin deficiency: three new cases and treatment trials with thyroid hormone and ACTH4-10. J Clin Endocrinol Metab. 2003;88:4633–4640. doi:10.1210/jc.2003-030502
214. Doche ME, Bochukova EG, Su HW, et al. Human SH2B1 mutations are associated with maladaptive behaviors and obesity. J Clin Invest. 2012;122:4732–4736. doi:10.1172/JCI62696
215. Pearce LR, Joe R, Doche ME, et al. Functional characterization of obesity-associated variants involving the α and β isoforms of human SH2B1. Endocrinology. 2014;155:3219–3226. doi:10.1210/en.2014-1264
216. Gray J, Yeo GS, Cox JJ, et al. Hyperphagia, severe obesity, impaired cognitive function, and hyperactivity associated with functional loss of one copy of the brain-derived neurotrophic factor (BDNF) gene. Diabetes. 2006;55:3366–3671. doi:10.2337/db06-0550
217. Yeo GS, Hung CC, Rochford J, et al. A de novo mutation affecting human TrkB associated with severe obesity and developmental delay. Nat Neurosci. 2004;7:1187–1189. doi:10.1038/nn1336
218. Holder JL, Butte NF, Zinn AR. Profound obesity associated with a balanced translocation that disrupts the SIM1 gene. Hum Mol Genet. 2000;9:101–108. doi:10.1093/hmg/9.1.101
219. Ramachandrappa S, Raimondo A, Cali AM, et al. Rare variants in single-minded 1 (SIM1) are associated with severe obesity. J Clin Invest. 2013;123:3042–3050. doi:10.1172/JCI68016
220. Asai M, Ramachandrappa S, Joachim M, et al. Loss of function of the melanocortin 2 receptor accessory protein 2 is associated with mammalian obesity. Science. 2013;341:275–278. doi:10.1126/science.1233000
221. Schonnop L, Kleinau G, Herrfurth N, et al. Decreased melanocortin-4 receptor function conferred by an infrequent variant at the human melanocortin receptor accessory protein 2 gene. Obesity. 2016;24:1976–1982. doi:10.1002/oby.21576
222. Alsters SI, Goldstone AP, Buxton JL, et al. Truncating Homozygous Mutation of Carboxypeptidase E (CPE) in a Morbidly Obese Female with Type 2 Diabetes Mellitus, Intellectual Disability and Hypogonadotrophic Hypogonadism. PLoS One. 2015;10:e0131417. doi:10.1371/journal.pone.0131417
223. Borman AD, Pearce LR, Mackay DS, et al. A homozygous mutation in the TUB gene associated with retinal dystrophy and obesity. Hum Mutat. 2014;35:289–293. doi:10.1002/humu.22482
224. Shalata A, Ramirez MC, Desnick RJ, et al. Morbid obesity resulting from inactivation of the ciliary protein CEP19 in humans and mice. Am J Hum Genet. 2013;93:1061–1071. doi:10.1016/j.ajhg.2013.10.025
225. Del Giudice EM, Santoro N, Cirillo G, D’Urso L, Di Toro R, Perrone L. Mutational screening of the CART gene in obese children: identifying a mutation (Leu34Phe) associated with reduced resting energy expenditure and cosegregating with obesity phenotype in a large family. Diabetes. 2001;50:2157–2160. doi:10.2337/diabetes.50.9.2157
226. Demidowich AP, Jun JY, Yanovski JA. Polymorphisms and mutations in the melanocortin-3 receptor and their relation to human obesity. Biochim Biophys Acta Mol Basis Dis. 2017;1863:2468–2476. doi:10.1016/j.bbadis.2017.03.018
227. Demidowich AP, Parikh VJ, Dedhia N, et al. Associations of the melanocortin 3 receptor C17A + G241A haplotype with body composition and inflammation in African-American adults. Ann Hum Genet. 2019;83:355–360. doi:10.1111/ahg.12315
228. Jackson RS, Creemers JW, Farooqi IS, et al. Small-intestinal dysfunction accompanies the complex endocrinopathy of human proprotein convertase 1 deficiency. J Clin Invest. 2003;112:1550–1560. doi:10.1172/JCI200318784
229. Farooqi IS, Volders K, Stanhope R, et al. Hyperphagia and early-onset obesity due to a novel homozygous missense mutation in prohormone convertase 1/3. J Clin Endocrinol Metab. 2007;92:3369–3373. doi:10.1210/jc.2007-0687
230. Creemers JW, Choquet H, Stijnen P, et al. Heterozygous mutations causing partial prohormone convertase 1 deficiency contribute to human obesity. Diabetes. 2012;61:383–390. doi:10.2337/db11-0305
231. Philippe J, Stijnen P, Meyre D, et al. A nonsense loss-of-function mutation in PCSK1 contributes to dominantly inherited human obesity. Int J Obes. 2015;39:295–302. doi:10.1038/ijo.2014.96
232. Yazdi FT, Clee SM, Meyre D. Obesity genetics in mouse and human: back and forth, and back again. PeerJ. 2015;(2015)(3):e856. doi:10.7717/peerj.856
233. Ramos-Molina B, Martin MG, Lindberg I. PCSK1 Variants and Human Obesity. Prog Mol Biol Transl Sci. 2016;140:47–74. doi:10.1016/bs.pmbts.2015.12.001
234. Coleman DL. Diabetes-obesity syndromes in mice. Diabetes. 1982;31(Suppl 1 Pt 2):1–6. doi:10.2337/diab.31.1.S1
235. Yaswen L, Diehl N, Brennan MB, Hochgeschwender U. Obesity in the mouse model of pro-opiomelanocortin deficiency responds to peripheral melanocortin. Nat Med. 1999;5:1066–1070. doi:10.1038/12506
236. Smart JL, Low MJ. Lack of proopiomelanocortin peptides results in obesity and defective adrenal function but normal melanocyte pigmentation in the murine C57BL/6 genetic background. Ann N Y Acad Sci. 2003;994:202–210. doi:10.1111/j.1749-6632.2003.tb03181.x
237. Challis BG, Coll AP, Yeo GS, et al. Mice lacking pro-opiomelanocortin are sensitive to high-fat feeding but respond normally to the acute anorectic effects of peptide-YY(3–36). Proc Natl Acad Sci USA. 2004;101:4695–4700. doi:10.1073/pnas.0306931101
238. Duan C, Yang H, White MF, Rui L. Disruption of the SH2-B gene causes age-dependent insulin resistance and glucose intolerance. Mol Cell Biol. 2004;24:7435–7443. doi:10.1128/MCB.24.17.7435-7443.2004
239. Ren D, Li M, Duan C, Rui L. Identification of SH2-B as a key regulator of leptin sensitivity, energy balance, and body weight in mice. Cell Metab. 2005;2:95–104. doi:10.1016/j.cmet.2005.07.004
240. Jiang L, Su H, Keogh JM, et al. Neural deletion of Sh2b1 results in brain growth retardation and reactive aggression. FASEB J. 2018;32:1830–1840. doi:10.1096/fj.201700831R
241. Kernie SG, Liebl DJ, Parada LF. BDNF regulates eating behavior and locomotor activity in mice. EMBO J. 2000;19:1290–1300. doi:10.1093/emboj/19.6.1290
242. Duan W, Guo Z, Jiang H, Ware M, Mattson MP. Reversal of behavioral and metabolic abnormalities, and insulin resistance syndrome, by dietary restriction in mice deficient in brain-derived neurotrophic factor. Endocrinology. 2003;144:2446–2453. doi:10.1210/en.2002-0113
243. Xu B, Goulding EH, Zang K, et al. Brain-derived neurotrophic factor regulates energy balance downstream of melanocortin-4 receptor. Nat Neurosci. 2003;6:736–742. doi:10.1038/nn1073
244. Ozek C, Zimmer DJ, De Jonghe BC, Kalb RG, Bence KK. Ablation of intact hypothalamic and/or hindbrain TrkB signaling leads to perturbations in energy balance. Mol Metab. 2015;2015:867–880. doi:10.1016/j.molmet.2015.08.002
245. Michaud JL, Boucher F, Melnyk A, et al. Sim1 haploinsufficiency causes hyperphagia, obesity and reduction of the paraventricular nucleus of the hypothalamus. Hum Mol Genet. 2001;10:1465–1473. doi:10.1093/hmg/10.14.1465
246. Holder JL, Zhang L, Kublaoui BM, et al. Sim1 gene dosage modulates the homeostatic feeding response to increased dietary fat in mice. Am J Physiol Endocrinol Metab. 2004;287:E105–113. doi:10.1152/ajpendo.00446.2003
247. Kublaoui BM, Holder JL, Gemelli T, Zinn AR. Sim1 haploinsufficiency impairs melanocortin-mediated anorexia and activation of paraventricular nucleus neurons. Mol Endocrinol. 2006;20:2483–2492. doi:10.1210/me.2005-0483
248. Novoselova TV, Larder R, Rimmington D, et al. Loss of Mrap2 is associated with Sim1 deficiency and increased circulating cholesterol. J Endocrinol. 2016;230:13–26. doi:10.1530/JOE-16-0057
249. Coleman DL, Eicher EM. Fat (fat) and tubby (tub): two autosomal recessive mutations causing obesity syndromes in the mouse. J Hered. 1990;81:424–427. doi:10.1093/oxfordjournals.jhered.a111019
250. Naggert JK, Fricker LD, Varlamov O, et al. Hyperproinsulinaemia in obese fat/fat mice associated with a carboxypeptidase E mutation which reduces enzyme activity. Nat Genet. 1995;10:135–142. doi:10.1038/ng0695-135
251. Cawley NX, Zhou J, Hill JM, et al. The carboxypeptidase E knockout mouse exhibits endocrinological and behavioral deficits. Endocrinology. 2004;145:5807–5819. doi:10.1210/en.2004-0847
252. Stubdal H, Lynch CA, Moriarty A, et al. Targeted deletion of the tub mouse obesity gene reveals that tubby is a loss-of-function mutation. Mol Cell Biol. 2000;20:878–882. doi:10.1128/MCB.20.3.878-882.2000
253. Asnicar MA, Smith DP, Yang DD, et al. Absence of cocaine- and amphetamine-regulated transcript results in obesity in mice fed a high caloric diet. Endocrinology. 2001;142:4394–4400. doi:10.1210/endo.142.10.8416
254. Wierup N, Richards WG, Bannon AW, Kuhar MJ, Ahrén B, Sundler F. CART knock out mice have impaired insulin secretion and glucose intolerance, altered beta cell morphology and increased body weight. Regul Pept. 2005;129:203–211. doi:10.1016/j.regpep.2005.02.016
255. Bartell SM, Isales CM, Baile CA, Kuhar MJ, Hamrick MW. CART deficiency increases body weight but does not alter bone strength. J Musculoskelet Neuronal Interact. 2008;8:146–153.
256. Lee B, Koo J, Yun jun J, et al. A mouse model for a partially inactive obesity-associated human MC3R variant. Nat Commun. 2016;7:10522. doi:10.1038/ncomms10522
257. Zhu X, Zhou A, Dey A, et al. Disruption of PC1/3 expression in mice causes dwarfism and multiple neuroendocrine peptide processing defects. Proc Natl Acad Sci USA. 2002;99:10293–10298. doi:10.1073/pnas.162352599
258. Lloyd DJ, Bohan S, Gekakis N. Obesity, hyperphagia and increased metabolic efficiency in Pc1 mutant mice. Hum Mol Genet. 2006;15:1884–1893. doi:10.1093/hmg/ddl111
259. Mbikay M, Croissandeau G, Sirois F, et al. A targeted deletion/insertion in the mouse Pcsk1 locus is associated with homozygous embryo preimplantation lethality, mutant allele preferential transmission and heterozygous female susceptibility to dietary fat. Dev Biol. 2007;306:584–598. doi:10.1016/j.ydbio.2007.03.523
260. Stijnen P, Brouwers B, Dirkx E, et al. Endoplasmic reticulum-associated degradation of the mouse PC1/3-N222D hypomorph and human PCSK1 mutations contributes to obesity. Int J Obes. 2016;40:973–981. doi:10.1038/ijo.2016.3
261. Muhsin NIA, Bentley L, Bai Y, Goldsworthy M, Cox RD. A novel mutation in the mouse Pcsk1 gene showing obesity and diabetes. Mamm Genome. 2020;31:17–29. doi:10.1007/s00335-020-09826-4
262. Williams MJ, Almén MS, Fredriksson R, Schiöth HB. What model organisms and interactomics can reveal about the genetics of human obesity. Cell Mol Life Sci. 2012;69:3819–3834. doi:10.1007/s00018-012-1022-5
263. Zeng CP, Lin X, Peng C, et al. Identification of novel genetic variants for type 2 diabetes, childhood obesity, and their pleiotropic loci. J Hum Genet. 2019;64:369–377. doi:10.1038/s10038-019-0577-5
264. Styne DM, Arslanian SA, Connor EL, et al. Pediatric Obesity-Assessment, Treatment, and Prevention: an Endocrine Society Clinical Practice Guideline. J Clin Endocrinol Metab. 2017;102:709–757. doi:10.1210/jc.2016-2573
265. da Fonseca ACP, Mastronardi C, Johar A, Arcos-Burgos M, Paz-Filho G. Genetics of non-syndromic childhood obesity and the use of high-throughput DNA sequencing technologies. J Diabetes Complications. 2017;31:1549–1561. doi:10.1016/j.jdiacomp.2017.04.026
266. Ayers KL, Glicksberg BS, Garfield AS, et al. Melanocortin 4 Receptor Pathway Dysfunction in Obesity: Patient Stratification Aimed at MC4R Agonist Treatment. J Clin Endocrinol Metab. 2018;103:2601–2612. doi:10.1210/jc.2018-00258
267. Sharma S, Garfield AS, Shah B, et al. Current Mechanistic and Pharmacodynamic Understanding of Melanocortin-4 Receptor Activation. Molecules. 2019;24:1892. doi:10.3390/molecules24101892
268. Clément K, Biebermann H, Farooqi IS, et al. MC4R agonism promotes durable weight loss in patients with leptin receptor deficiency. Nat Med. 2018;24:551–555. doi:10.1038/s41591-018-0015-9
269. Clément K, van den Akker E, Argente J, et al. Efficacy and safety of setmelanotide, an MC4R agonist, in individuals with severe obesity due to LEPR or POMC deficiency: single-arm, open-label, multicentre, Phase 3 trials. Lancet Diabetes Endocrinol. 2020;8:960–970. doi:10.1016/S2213-8587(20)30364-8
270. Bischof JM, Stewart CL, Wevrick R. Inactivation of the mouse Magel2 gene results in growth abnormalities similar to Prader-Willi syndrome. Hum Mol Genet. 2007;16:2713–2719. doi:10.1093/hmg/ddm225
271. Schaaf CP, Gonzalez-Garay ML, Xia F, et al. Truncating mutations of MAGEL2 cause Prader-Willi phenotypes and autism. Nat Genet. 2013;45:1405–1408. doi:10.1038/ng.2776
272. Bischof JM, Van Der Ploeg LH, Colmers WF, Wevrick R. Magel2-null mice are hyper-responsive to setmelanotide, a melanocortin 4 receptor agonist. Br J Pharmacol. 2016;173:2614–2621. doi:10.1111/bph.13540
273. Desai U, Lee EC, Chung K, et al. Lipid-lowering effects of anti-angiopoietin-like 4 antibody recapitulate the lipid phenotype found in angiopoietin-like 4 knockout mice. Proc Natl Acad Sci USA. 2007;104:11766–11771. doi:10.1073/pnas.0705041104
274. Paes KT, Wang E, Henze K, et al. Frizzled 4 is required for retinal angiogenesis and maintenance of the blood-retina barrier. Invest Ophthalmol Vis Sci. 2011;52:6452–6461. doi:10.1167/iovs.10-7146
275. Brommage R, Liu J, Vogel P, et al. NOTUM inhibition increases endocortical bone formation and bone strength. Bone Res. 2019;7:2. doi:10.1038/s41413-018-0038-3
276. Lee E-C, Desai U, Gololobov G, et al. Identification of a new functional domain in Angiopoietin-like 3 and Angiopoietin-like 4 involved in binding and inhibition of Lipoprotein Lipase. J Biol Chem. 2009;284:13735–13745. doi:10.1074/jbc.M807899200
277. Dewey FE, Gusarova V, Dunbar RL, et al. Genetic and Pharmacologic Inactivation of ANGPTL3 and Cardiovascular Disease. N Engl J Med. 2017;377:211–221. doi:10.1056/NEJMoa1612790
278. Raal FJ, Rosenson RS, Reeskamp LF, et al. Evinacumab for Homozygous Familial Hypercholesterolemia. N Engl J Med. 2020;383:711–720. doi:10.1056/NEJMoa2004215
279. Goodwin NC, Ding ZM, Harrison BA, et al. Discovery of LX2761, a Sodium-Dependent Glucose Cotransporter 1 (SGLT1) Inhibitor Restricted to the Intestinal Lumen, for the Treatment of Diabetes. J Med Chem. 2017;60:710–721. doi:10.1021/acs.jmedchem.6b01541
280. Powell DR, Smith MG, Doree DD, et al. LX2761, a Sodium/Glucose Cotransporter 1 Inhibitor Restricted to the Intestine, Improves Glycemic Control in Mice. J Pharmacol Exp Ther. 2017;362(1):85–97. doi:10.1371/journal.pone.0199987
281. Han Q, Pabba PK, Barbosa J, et al. 4H-Thieno[3,2-c]chromene based inhibitors of Notum Pectinacetylesterase. Bioorg Med Chem Lett. 2016;26:1184–1187. doi:10.1016/j.bmcl.2016.01.038
282. Tarver JE, Pabba PK, Barbosa J, et al. Stimulation of cortical bone formation with thienopyrimidine based inhibitors of Notum Pectinacetylesterase. Bioorg Med Chem Lett. 2016;26:1525–1528. doi:10.1016/j.bmcl.2016.02.021
283. Kostich W, Hamman BD, Li YW, et al. Inhibition of AAK1 Kinase as a Novel Therapeutic Approach to Treat Neuropathic Pain. J Pharmacol Exp Ther. 2016;358:371–386. doi:10.1124/jpet.116.235333
284. Harrison BA, Whitlock NA, Voronkov MV, et al. Novel class of LIM-kinase 2 inhibitors for the treatment of ocular hypertension and associated glaucoma. J Med Chem. 2009;52:6515–6518. doi:10.1021/jm901226j
285. Harrison BA, Almstead ZY, Burgoon H, et al. Discovery and development of LX7101, a dual LIM kinase and ROCK inhibitor for the treatment of glaucoma. ACS Med Chem Lett. 2014;6:84–88. doi:10.1021/ml500367g
286. Bagdanoff JT, Donoviel MS, Nouraldeen A, et al. Inhibition of sphingosine-1-phosphate lyase for the treatment of autoimmune disorders. J Med Chem. 2009;52:3941–3953. doi:10.1021/jm900278w
287. Bagdanoff JT, Donoviel MS, Nouraldeen A, et al. Inhibition of sphingosine 1-phosphate lyase for the treatment of rheumatoid arthritis: discovery of (E)-1-(4-((1R,2S,3R)-1,2,3,4-tetrahydroxybutyl)-1H-imidazol-2-yl)ethanone oxime (LX2931) and (1R,2S,3R)-1-(2-(isoxazol-3-yl)-1H-imidazol-4-yl)butane-1,2,3,4-tetraol (LX2932). J Med Chem. 2010;53:8650–8662. doi:10.1021/jm101183p
288. Zambrowicz B, Freiman J, Brown PM, et al. LX4211, a dual SGLT1/SGLT2 inhibitor, improved glycemic control in patients with type 2 diabetes in a randomized, placebo-controlled trial. Clin Pharmacol Ther. 2012;92:158–169. doi:10.1038/clpt.2012.58
289. Powell DR, DaCosta CM, Smith M, et al. Effect of LX4211 on glucose homeostasis and body composition in preclinical models. J Pharmacol Exp Ther. 2014;350:232–242. doi:10.1124/jpet.114.214304
290. Powell DR, Smith MG, Doree DD, et al. LP-925219 maximizes urinary glucose excretion in mice by inhibiting both renal SGLT1 and SGLT2. Pharmacol Res Perspect. 2015;3:e00129. doi:10.1002/prp2.129
291. Garg SK, Henry RR, Banks P, et al. Effects of Sotagliflozin Added to Insulin in Patients with Type 1 Diabetes. N Engl J Med. 2017;377:2337–2348. doi:10.1056/NEJMoa1708337
292. Licinio J, Caglayan S, Ozata M, et al. Phenotypic effects of leptin replacement on morbid obesity, diabetes mellitus, hypogonadism, and behavior in leptin-deficient adults. Proc Natl Acad Sci USA. 2004;101:4531–4536. doi:10.1073/pnas.0308767101
293. Heymsfield SB, Greenberg AS, Fujioka K, et al. Recombinant leptin for weight loss in obese and lean adults: a randomized, controlled, dose-escalation trial. JAMA. 1999;282:1568–1575. doi:10.1001/jama.282.16.1568
294. Hukshorn CJ, Westerterp-Plantenga MS, Saris WH. Pegylated human recombinant leptin (PEG-OB) causes additional weight loss in severely energy-restricted, overweight men. Am J Clin Nutr. 2003;77:771–776. doi:10.1093/ajcn/77.4.771
295. Halaas JL, Boozer C, Blair-West J, Fidahusein N, Denton DA, Friedman JM. Physiological response to long-term peripheral and central leptin infusion in lean and obese mice. Proc Natl Acad Sci USA. 1997;94:8878–8883. doi:10.1073/pnas.94.16.8878
296. Wang ZW, Pan WT, Lee Y, Kakuma T, Zhou YT, Unger RH. The role of leptin resistance in the lipid abnormalities of aging. FASEB J. 2001;15:108–114. doi:10.1096/fj.00-0310com
297. Harris RB, Bowen HM, Mitchell TD. Leptin resistance in mice is determined by gender and duration of exposure to high-fat diet. Physiol Behav. 2003;78:543–555. doi:10.1016/S0031-9384(03)00035-0
298. Collet TH, Dubern B, Mokrosinski J, et al. Evaluation of a melanocortin-4 receptor (MC4R) agonist (Setmelanotide) in MC4R deficiency. Mol Metab. 2017;6:1321–1329. doi:10.1016/j.molmet.2017.06.015
299. Smith SR, Weissman NJ, Anderson CM, et al. Multicenter, placebo-controlled trial of lorcaserin for weight management. N Engl J Med. 2010;363:245–256. doi:10.1056/NEJMoa0909809
300. O’Neil PM, Smith SR, Weissman NJ, et al. Randomized placebo-controlled clinical trial of lorcaserin for weight loss in type 2 diabetes mellitus: the BLOOM-DM study. Obesity. 2012;20:1426–1436. doi:10.1038/oby.2012.66
301. Khera R, Murad MH, Chandar AK, et al. Association of Pharmacological Treatments for Obesity With Weight Loss and Adverse Events: a Systematic Review and Meta-analysis. JAMA. 2016;315:2424–2434. doi:10.1001/jama.2016.7602
302. Kumar KG, Sutton GM, Dong JZ, et al. Analysis of the therapeutic functions of novel melanocortin receptor agonists in MC3R- and MC4R-deficient C57BL/6J mice. Peptides. 2009;30:1892–1900. doi:10.1016/j.peptides.2009.07.012
303. Ioannidis JP. Why most published research findings are false. PLoS Med. 2005;2:e124. doi:10.1371/journal.pmed.0020124
304. Prinz F, Schlange T, Asadullah K. Believe it or not: how much can we rely on published data on potential drug targets? Nat Rev Drug Discov. 2011;10:712. doi:10.1038/nrd3439-c1
305. Begley CG, Ellis LM. Drug development: raise standards for preclinical cancer research. Nature. 2012;483:531–533. doi:10.1038/483531a
306. Freedman LP, Venugopalan G, Wisman R. Reproducibility2020: progress and priorities. F1000Res. 2017;6:604. doi:10.12688/f1000research.11334.1
307. Konopka T, Smedley D, Konopka T, Smedley D. Incremental data integration for tracking genotype-disease associations. PLoS Comput Biol. 2020;16:e1007586. doi:10.1371/journal.pcbi.1007586
308. Savelieva KV, Zhao S, Pogorelov VM, et al. Genetic disruption of both tryptophan hydroxylase genes dramatically reduces serotonin and affects behavior in models sensitive to antidepressants. PLoS One. 2008;3:e3301. doi:10.1371/journal.pone.0003301
309. Qiu J, Ogus S, Mounzih K, Ewart-Toland A, Chehab FF. Leptin-deficient mice backcrossed to the BALB/cJ genetic background have reduced adiposity, enhanced fertility, normal body temperature, and severe diabetes. Endocrinology. 2001;142:3421–3425. doi:10.1210/endo.142.8.8323
310. Hofmann WE, Liu X, Bearden CM, Harper ME, Kozak LP. Effects of genetic background on thermoregulation and fatty acid-induced uncoupling of mitochondria in UCP1-deficient mice. J Biol Chem. 2001;276:12460–12465. doi:10.1074/jbc.M100466200
311. Feldmann HM, Golozoubova V, Cannon B, Nedergaard J. UCP1 ablation induces obesity and abolishes diet-induced thermogenesis in mice exempt from thermal stress by living at thermoneutrality. Cell Metab. 2009;9:203–209. doi:10.1016/j.cmet.2008.12.014
312. Haskell-Luevano C, Schaub JW, Andreasen A, et al. Voluntary exercise prevents the obese and diabetic metabolic syndrome of the melanocortin-4 receptor knockout mouse. FASEB J. 2009;23:642–655. doi:10.1096/fj.08-109686
313. Karp NA, Baker LA, Gerdin AK, Adams NC, Ramírez-Solis R, White JK. Optimising experimental design for high-throughput phenotyping in mice: a case study. Mamm Genome. 2010;21:467–476. doi:10.1007/s00335-010-9279-1
 © 2021 The Author(s). This work is published and licensed by Dove Medical Press Limited. The full terms of this license are available at https://www.dovepress.com/terms.php and incorporate the Creative Commons Attribution - Non Commercial (unported, v3.0) License.
By accessing the work you hereby accept the Terms. Non-commercial uses of the work are permitted without any further permission from Dove Medical Press Limited, provided the work is properly attributed. For permission for commercial use of this work, please see paragraphs 4.2 and 5 of our Terms.
© 2021 The Author(s). This work is published and licensed by Dove Medical Press Limited. The full terms of this license are available at https://www.dovepress.com/terms.php and incorporate the Creative Commons Attribution - Non Commercial (unported, v3.0) License.
By accessing the work you hereby accept the Terms. Non-commercial uses of the work are permitted without any further permission from Dove Medical Press Limited, provided the work is properly attributed. For permission for commercial use of this work, please see paragraphs 4.2 and 5 of our Terms.