")
Back to Journals » Infection and Drug Resistance » Volume 17
Hepatic Involvement in Acquired Immunodeficiency Syndrome-Associated Kaposi’s Sarcoma: A Descriptive Analysis on CT, MRI, and Ultrasound
Authors Guan CS, Yu J, Du YN, Zhou XG, Zhang ZX, Chen H, Xing YX, Xie RM, Lv ZB
Received 11 October 2023
Accepted for publication 13 March 2024
Published 18 March 2024 Volume 2024:17 Pages 1073—1084
DOI https://doi.org/10.2147/IDR.S440305
Checked for plagiarism Yes
Review by Single anonymous peer review
Peer reviewer comments 2
Editor who approved publication: Prof. Dr. Héctor Mora-Montes
Chun-Shuang Guan,1,* Jing Yu,2,* Yan-Ni Du,1,* Xin-Gang Zhou,3 Zi-Xin Zhang,1 Hui Chen,1 Yu-Xue Xing,1 Ru-Ming Xie,1 Zhi-Bin Lv1
1Department of Radiology, Beijing Ditan Hospital, Capital Medical University, Beijing, People’s Republic of China; 2Department of Ultrasonography, Beijing Ditan Hospital, Capital Medical University, Beijing, People’s Republic of China; 3Department of Pathology, Beijing Ditan Hospital, Capital Medical University, Beijing, People’s Republic of China
*These authors contributed equally to this work
Correspondence: Ru-Ming Xie; Zhi-Bin Lv, Tel +8613911320739 ; +8613683151127, Email [email protected]; [email protected]
Purpose: To retrospectively analyse the different imaging manifestations of acquired immunodeficiency syndrome-associated hepatic Kaposi’s sarcoma (AIDS-HKS) on CT, MRI, and Ultrasound.
Patients and Methods: Eight patients were enrolled in the study. Laboratory tests of liver function were performed. The CT, MRI, and Ultrasound manifestations were reviewed by two radiologists and two sonographers, respectively. The distribution and imaging signs of AIDS-HKS were evaluated.
Results: AIDS-HKS patients commonly presented multiple lesions, mainly distributed around the portal vein on CT, MRI, and Ultrasound. AIDS-HKS presented as ring enhancement in the arterial phase on contrast-enhanced CT and MRI scanning, and nodules gradually strengthen in the portal venous phase and the delayed phase. AIDS-HKS presented as intrahepatic bile duct dilatation and bile duct wall thickening around the lesion. Five patients (62.5%, 5/8) were followed up. After chemotherapy, the lesions were completely relieved (60.0%), or decreased (40.0%).
Conclusion: AIDS-HKS presented as multiple nodular lesions with different imaging features. The combination of different imaging methods was helpful for the imaging diagnosis of AIDS-HKS.
Keywords: Kaposi’s sarcoma, liver, diagnostic imaging, magnetic resonance imaging, tomography, spiral computed, ultrasonography
Introduction
Acquired immune deficiency syndrome-associated Kaposi’s sarcoma (AIDS-KS) is one of the four types of Kaposi’s sarcoma. The other three types are classic, endemic, and iatrogenic. The classic type is more likely to occur in individuals of Mediterranean, European Jewish, and Middle Eastern ancestry without immunosuppression. The endemic type is more likely to occur in young individuals in sub-Saharan Africa. The iatrogenic type (immunosuppressive type) occurs in solid organ transplant recipients or chronic immunosuppression patients with other immune disorders.1 Kaposi’s sarcoma (KS) was the first malignant tumour defined in patients with AIDS and the second most common tumour found in patients with AIDS.2–5 The incidence of KS in the general population is approximately 1/100,000, while that in human immunodeficiency virus (HIV)-infected people is 1/20.6–8 KS can involve multiple sites, including the skin, lung, gastrointestinal tract, liver, and musculoskeletal system.2,9 Hepatic KS (HKS) is the most common form of liver tumor in AIDS patients, and 34% of KS patients have liver involvement in autopsy.2,10,11 However, HKS is rarely diagnosed in a patient’s lifetime because patients with hepatic KS are usually asymptomatic.
In routine clinical work, it is occasionally found that AIDS-KS involves the liver. The literatures on imaging manifestations of hepatic KS were mostly case reports,12–15 and one or two imaging examinations were performed in most of these reports, with few performing CT, magnetic resonance imaging (MRI), and ultrasound imaging examinations at the same time. To date, there has been no follow-up study on the imaging of AIDS-associated hepatic Kaposi’s sarcoma (AIDS-HKS) reported in the literature. Therefore, the aim of this study was to analyse the CT, MRI, and ultrasound imaging manifestations of patients with AIDS-HKS before treatment and in follow-up.
Materials and Methods
Patients
This study was approved by the Review Committee and the Ethics Committee of Beijing Ditan Hospital, Capital Medical University. The requirement for written informed consent was waived by the Institutional Review Board owing to the retrospective nature of the analysis. The patients’ data were kept confidential, without divulging personal privacy, and complied with the Helsinki Declaration. All AIDS patients from January 1, 2015, to December 31, 2022, were enrolled. Inclusion criteria were as follows: 1) AIDS; 2) a pathological diagnosis of KS; 3) hepatic KS lesions revealed on imaging examination; and 4) intrahepatic lesions increased or decreased after treatment in follow-up. The exclusion criteria were as follows: 1) normal liver on imaging examinations; 2) other hepatic disease foci; and 3) poor quality imaging that could not be evaluated.
Liver Function
Laboratory tests of liver function included alanine aminotransferase (ALT), aspartate aminotransferase (AST), total bilirubin (TBIL), albumin, lactate dehydrogenase (LDH), γ-glutamyltransferase (GGT), alkaline phosphatase (AKP), and cholinesterase.
Scanning Equipment and Scanning Method
A 256-slice CT and 64-slice CT (Philips, iCT, Netherlands; GE, Light speed vCT, Wisconsin, USA) were used for CT examination. The contrast agent iohexol (BeiLu Pharmaceutical AG, China) was injected through the elbow vein (approximately 80 mL per patient on average) at an injection flow rate of 3.0 mL/s. A 1.5 T magnetic resonance (MR) system (Siemens, Magnetom Avanto MR, Germany) was used for MR examination. The contrast agent meglumine gadolinium (Magnevist, Bayer AG, Germany) was injected through the elbow vein (approximately 20 mL per patient on average) at an injection flow rate of 1.5–2.0 mL/s. The CT and MR scans were obtained at the end of inhalation during scanning. The scanning was performed from the diaphragm to the anterior superior iliac spine. The slice thickness was 5 mm.
A colour Doppler ultrasound diagnostic apparatus (GE, LOGIQ E9, Wauwatosa, USA; SuperSonic, Aixplorer V, Les Jardins de la Duranne, France) was used for ultrasound examination. A convex array probe with a frequency of 3.0–5.0 MHz was adopted. Conventional two-dimensional and colour Doppler ultrasonography were performed. The patient was placed in the supine and left lateral position with the upper abdomen fully exposed.
Imaging Interpretation
Two abdominal radiologists, with 15 and 19 years of experience, retrospectively reviewed the images and resolved discrepancies by consensus. The images were analysed on a picture archiving and communication system (PACS, Carestream Health, USA). The images were reviewed in the abdominal window (window width 350 HU, level 50 HU) on CT. The window width and level could be adjusted to be appropriate for the analysis.
The imaging was evaluated for distribution and imaging signs. The distributions were divided into the periportal area, subcapsular area, and a mix of the periportal and subcapsular areas. The contrast-enhanced scanning included the arterial phase, portal vein phase, and delayed phase. The enhancements were divided into ring enhancement, nodular enhancement, uneven enhancement, and a mix of ring, nodular, and uneven enhancements in the arterial phase of contrast-enhanced scanning. The dilation of the intrahepatic bile duct, bile duct wall thickening, and seroperitoneum were observed. The diameter of the largest lesion in the liver was measured. Lymphadenovarix was defined as a short diameter of the lymph node exceeding 10mm.
Two ultrasound physicians with 17 and 18 years of work experience evaluated images on the Hospital Information System (HIS, iMedical, Donghua, Beijing, China) and resolved discrepancies by consensus. The evaluation parameters included the distribution (the periportal area, subcapsular area, and a mix of the periportal and subcapsular areas), single or multiple, echo (echoless, hypoecho, isoechoic, hyperecho, and strong echo), and blood flow of the lesion. The dilation of the intrahepatic bile duct and the Glisson sheath thickening were observed. Retroperitoneal lymph node enlargement was defined as the maximum diameter of lymph nodes greater than 10mm. The maximum oblique diameter of the right lobe of the liver exceeding 140mm was considered as an increase in liver volume.
Statistical Analysis
All data were analysed by SPSS 17.0 (IBM, Armonk, NY, US). Continuous data are expressed as the mean and standard deviation or median (25th percentile, 75th percentile). Categorical data were expressed as the frequency.
Results
Clinical Features
Fifty-seven AIDS-KS patients were enrolled, and 49 patients were excluded. Eight patients (14.0%, 8/57) were enrolled in the study. All eight patients were males (age range, 30–46 years; mean [±SD] age, 35.25±5.625 years). In addition to KS in the liver, eight patients also had skin (87.5%, 7/8), oral cavity (37.5%, 3/8), lymph node (87.5%, 7/8), lung (87.5%, 7/8), adrenal (12.5%, 1/8), spleen (25.0%, 2/8), thyroid (12.5%, 1/8), and bone (25.0%, 2/8) involvement. For the pathological diagnosis of the 8 patients, 7 (87.5%, 7/8) were based on skin or lymph node biopsy sample analysis, and the other one (12.5%, 1/8) was based on liver biopsy sample analysis (Figure 1), which showed diffuse spindle cells and slit-like vessels, which were filled with red blood cells and a small amount of haemosiderin deposition. Immunohistochemical staining of human herpesvirus 8 showed partial spindle cell nucleus positivity.
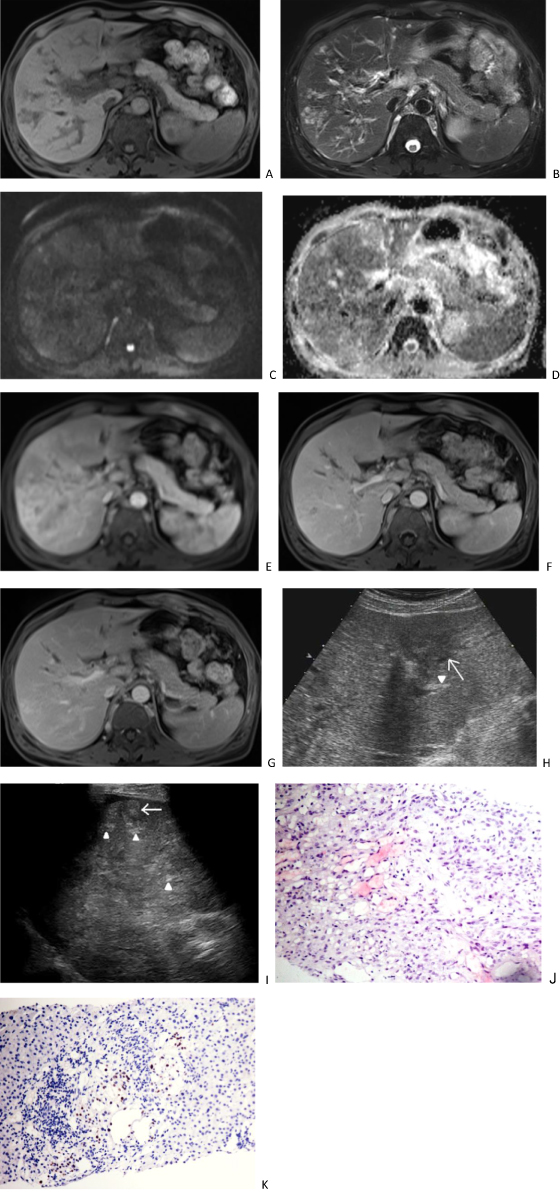 |
Figure 1 A 46-year-old man with AIDS-related hepatic Kaposi’s sarcoma. Plain scan MRI shows multiple nodular lesions in the liver, with low signal on T1 weighted imaging (1A), high signal on T2 weighted imaging (B), slightly high signal on diffusion weighted imaging (C), and high signal on apparent diffusion coefficient imaging (D). Enhanced scanning of the arterial phase (E) showed circular enhancement, located adjacent to the portal vein and under the hepatic capsule. The portal vein phase (F) shows gradual enhancement of nodules, showing equal to slightly lower enhancement, and dilation of intrahepatic bile ducts. The delayed phase (G) shows high and equal enhancement of the nodules, with intrahepatic bile duct dilation observed. Ultrasound (H) showed multiple hypoechogenicity (arrow) in the liver, as well as thickening and enhancement of the Glisson sheath (arrowhead). After 40 days, ultrasound (I) revealed multiple hyperechoic nodules in the liver (arrows), as well as thickening and enhancement of the Glisson sheath (arrowhead). The pathological HE staining (J) of the puncture biopsy showed residual liver tissue on the left side and a tumor area on the right. The spindle shaped tumor cells were arranged in a striped pattern, with some appearing as fissures. The nucleus was ovoid, and the cells were mildly atypical. No clear mitotic image was observed (HE X200). Human herpesvirus 8 immunohistochemistry staining (K) showed partial spindle cell nucleus positivity (EnVision X200). |
Only two patients (25.0%, 2/8) had abdominal-related clinical symptoms, which manifested as right upper abdominal pain. The other six patients (75.0%, 6/8) showed no abdominal symptoms.
Liver Function
Blood biochemistry analysis showed that two patients (25.0%, 2/8) had abnormal liver function results. The first patient’s liver function parameters were LDH, 336.7 g/L (normal value, 120–250 g/L); GGT, 138.3 U/L (normal value, 10–60 U/L); and AKP, 252.2 U/L (normal value, 45–125 U/L), which were slightly above the normal values. The second patient’s liver function parameters were AST, 68.9 U/L (normal value, 15–40 U/L); ALT, 224.9 U/L; LDH, 458.0 g/L; GGT, 733.0 U/L; and AKP, 358.5 U/L, which were obviously higher than the normal values. The total bilirubin, albumin, and cholinesterase levels of all eight patients were in the normal ranges.
Imaging Manifestations on CT and MRI
CT and ultrasound were performed for all eight patients, and MRI was performed for two of these patients (25.0%, 2/8).
On CT, all eight patients had multiple intrahepatic lesions (≥2 lesions), and the mean diameter of the largest lesion was 19.50±8.944 mm (range, 8–31 mm). The lesions were distributed around the periportal area and subcapsular areas in 7 patients (87.5%, 7/8), but there were significantly more lesions distributed in the periportal area than in the subcapsular area (Figures 1–3). The other patient (12.5%, 1/8) had two small nodules located around the subcapsular area. The lesions appeared as low-density shadows on plain CTs (Figure 2). In the arterial phase of contrast-enhanced CT (CECT), ring enhancement was the main pattern in all eight patients (Figure 2), including one patient (12.5%, 1/8) with nodular enhancement and uneven enhancement and two patients with a small amount of uneven enhancement. In the portal venous and delayed phases, the lesions were gradually enhanced and gradually became consistent with the surrounding liver parenchyma, which showed that the nodules decreased in seven patients (87.5%, 7/8). The lesion margin in the portal venous and delayed phases was clearer than that in the arterial phase in another patient. There were four patients (50.0%, 4/8) with intrahepatic bile duct dilatation around the lesion, three of which were accompanied by bile duct wall thickening. Only one patient (12.5%, 1/8) presented with no lymphadenovarix. The other seven patients (87.5%, 7/8) had abdominal lymphadenovarix, including in the retroperitoneum (87.5%, 7/8), hilar region (25.0%, 2/8) and mesenteric region (37.5%, 3/8). Four patients (50.0%, 4/8) showed a small amount of seroperitoneum (Table 1).
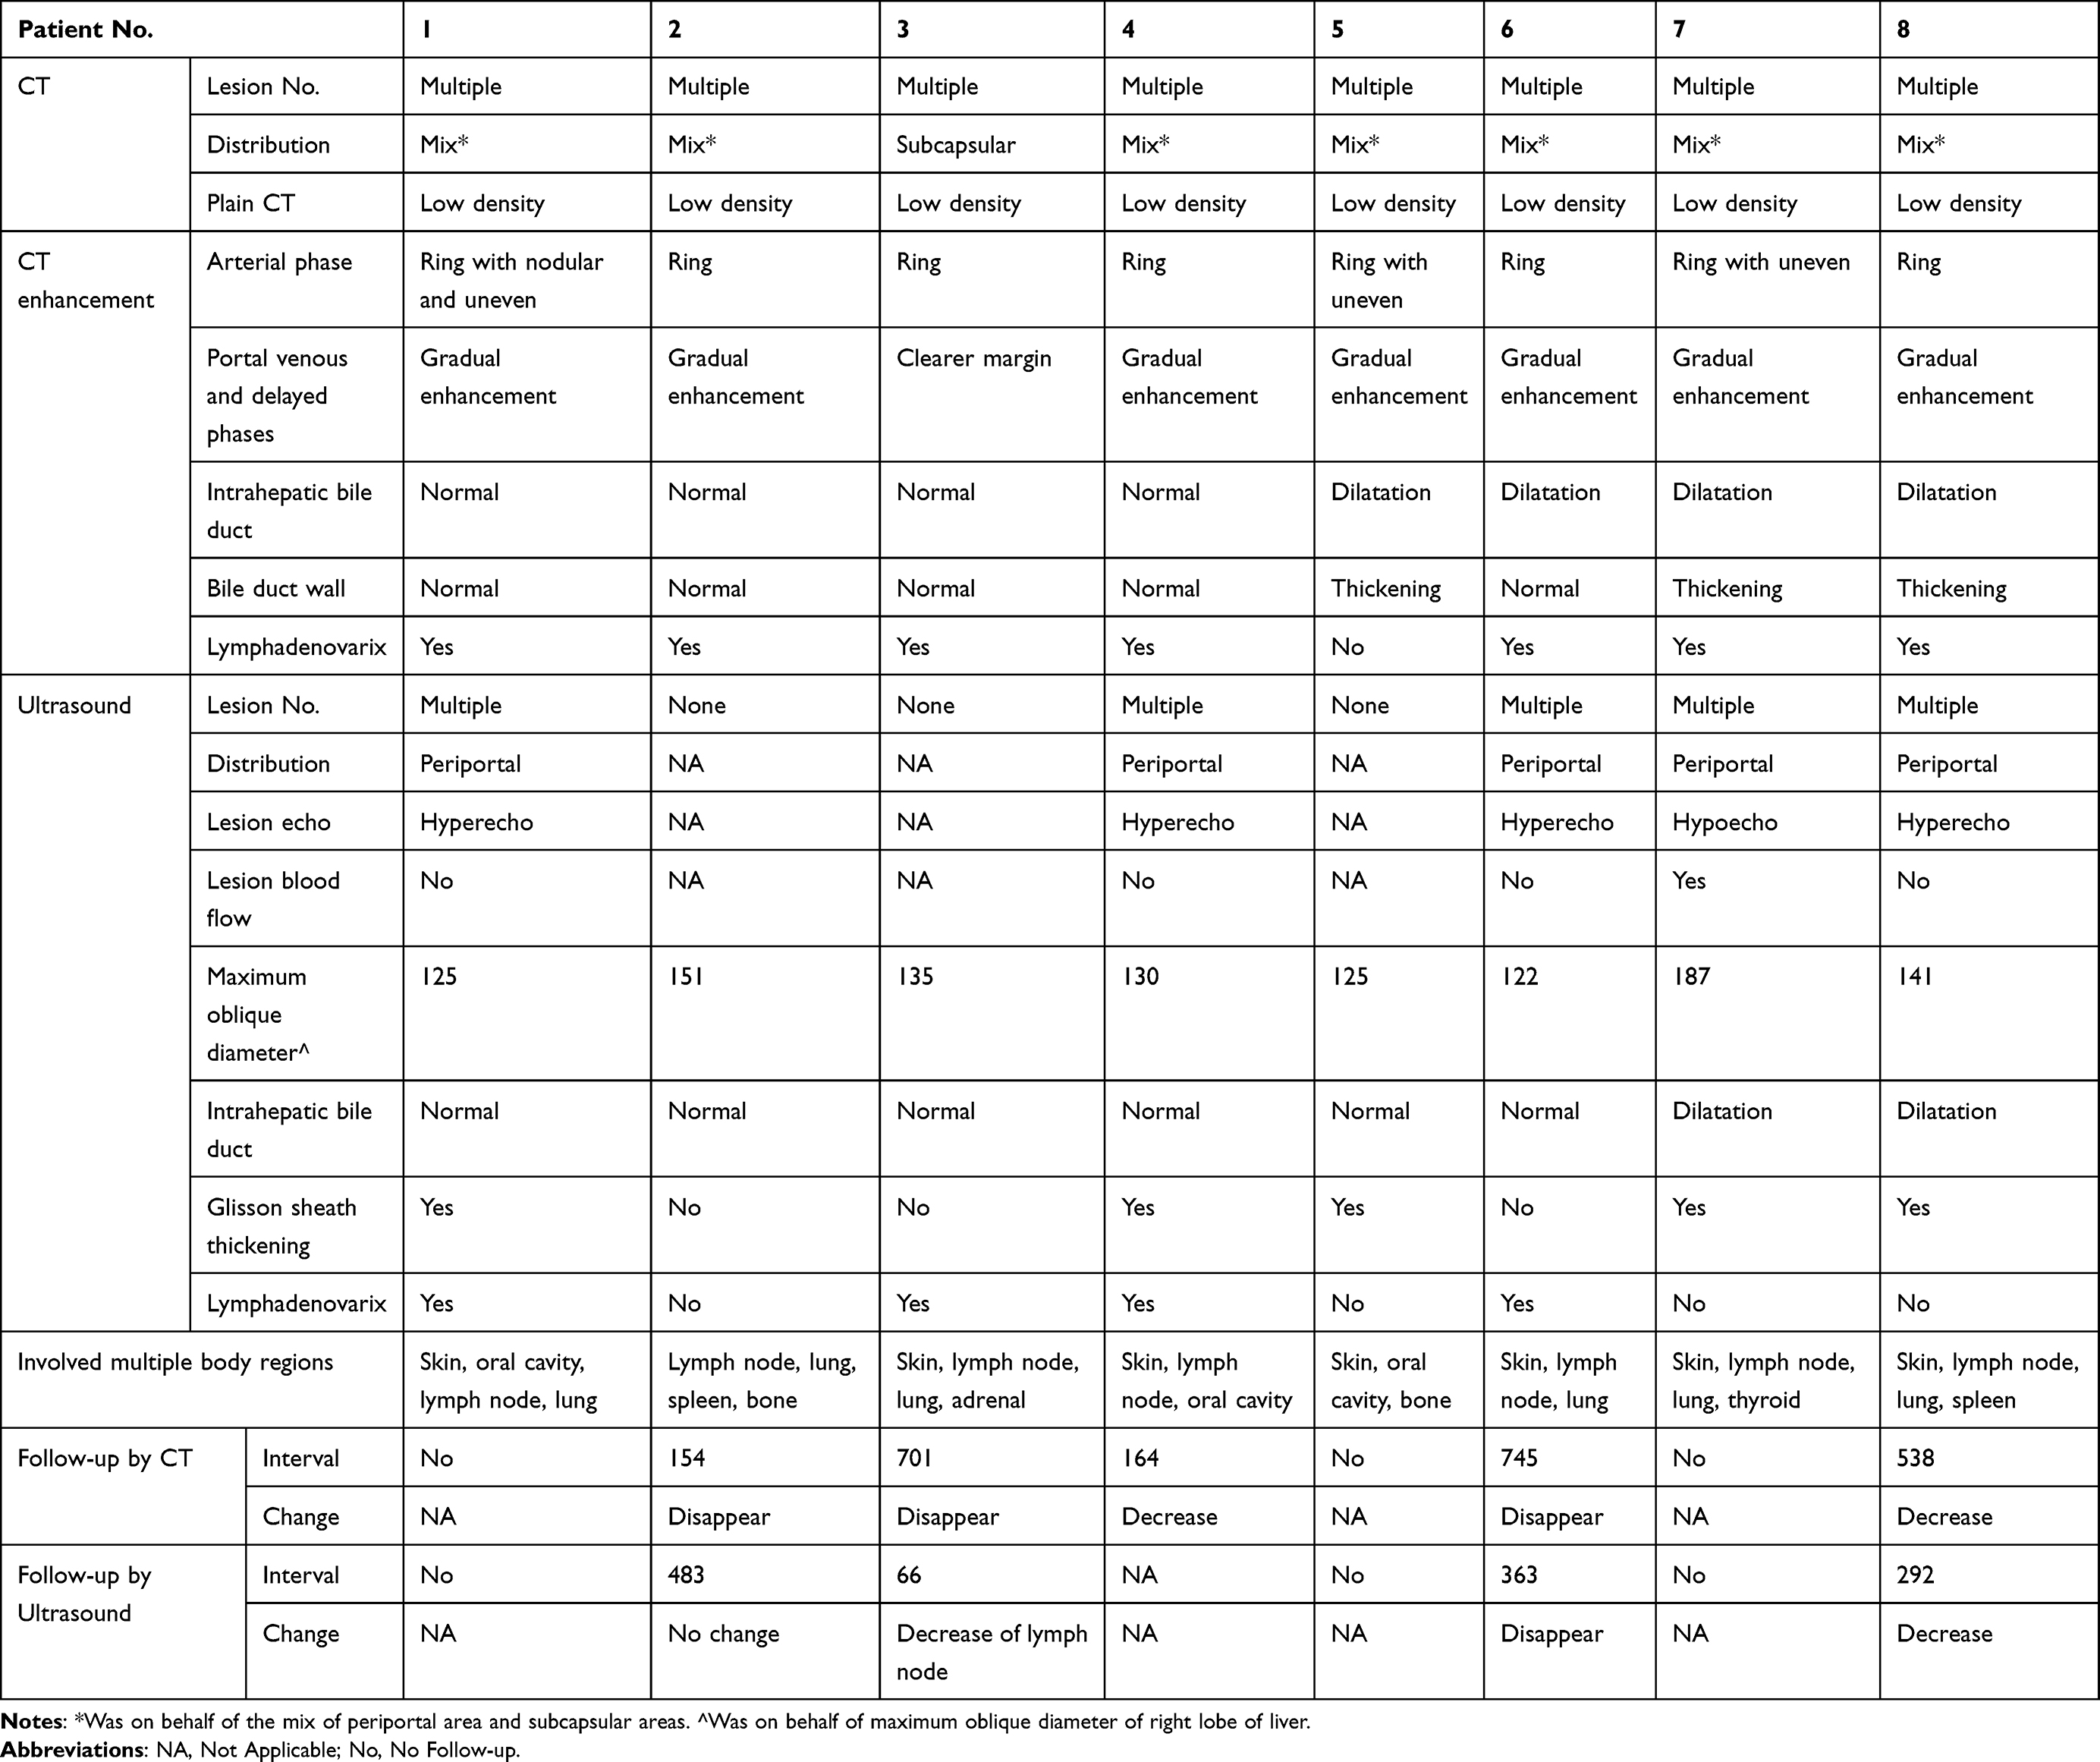 |
Table 1 The Imaging Features of AIDS-Related Hepatic Kaposi’s Sarcoma on CT, MRI, and Ultrasound |
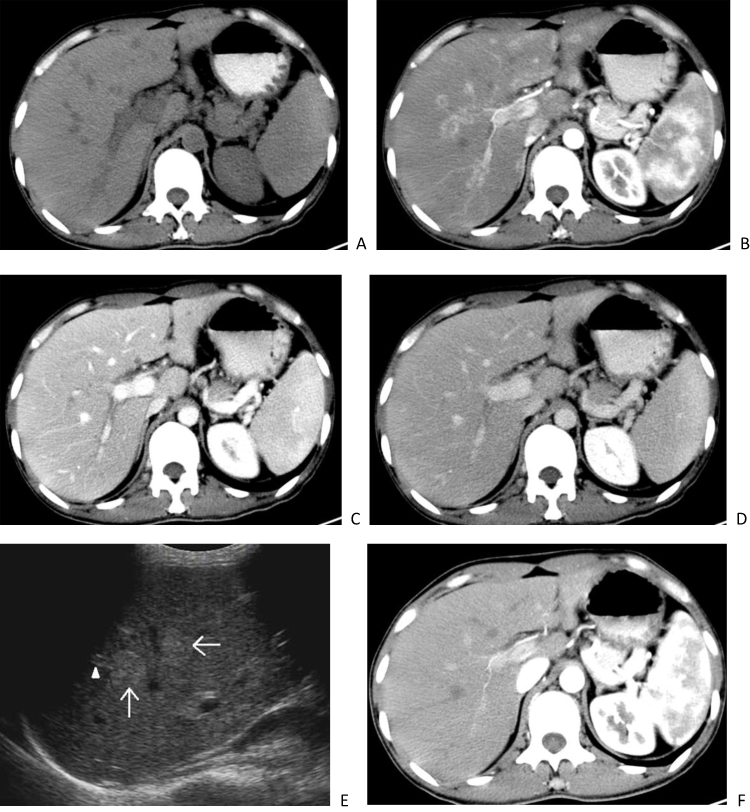 |
Figure 2 A 30-year-old man with AIDS-related hepatic Kaposi’s sarcoma. CT plain scan shows multiple low-density nodules in the liver (A). CT enhanced scan during the arterial phase showed circular enhancement of nodular lesions, mostly located around the portal vein and a few located under the hepatic capsule (B). The portal vein phase (C) and delayed phase (D) show gradual enhancement of the nodules, with equal or slightly lower enhancement. Ultrasound (E) showed multiple hyperechoic nodules (arrows) distributed along the portal vein in the liver, with thickening of the Glisson sheath and enhanced echogenicity (arrowhead). Two years later, the CT scan (F) Showed that the original intrahepatic nodules were not shown. |
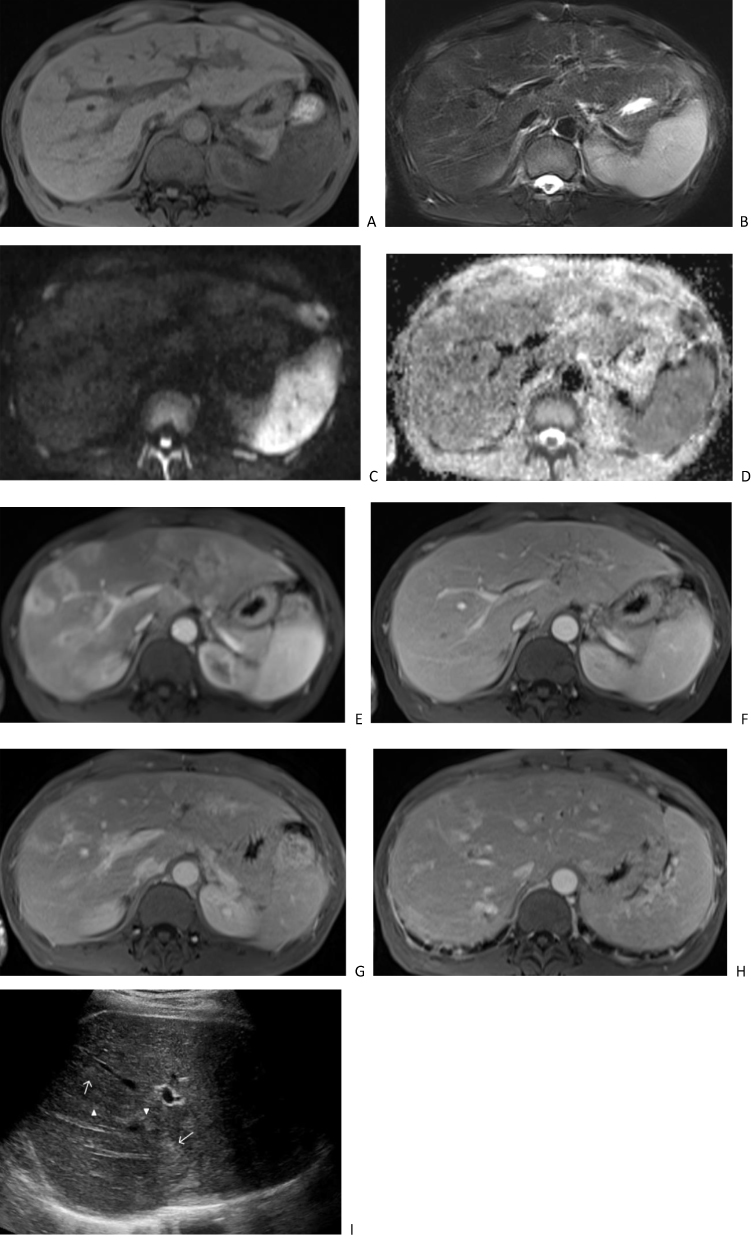 |
Figure 3 A 41-year-old man with AIDS-related hepatic Kaposi’s sarcoma. Plain scan MRI shows multiple nodular lesions in the liver, with low signal on T1 weighted imaging (A), high signal on T2 weighted imaging (B), slightly high signal on diffusion weighted imaging (C), and high signal on apparent diffusion coefficient map (D). Enhanced scanning of the arterial phase (E) showed circular enhancement, located adjacent to the portal vein and under the hepatic capsule. The portal vein phase (F) shows gradual enhancement of nodules with equal to slightly lower enhancement. Delayed phase imaging (G) showed high and equal enhancement of the nodules, as well as intrahepatic bile duct dilation and thickening of the bile duct wall (H). Ultrasound (I) showed multiple hyperechoic nodules (arrows) distributed along the portal vein in the liver, with thickening of the Glisson sheath and enhanced echogenicity (arrowhead). |
Two patients (25.0%, 2/8) underwent MRI scanning. MRI of both patients showed low signal intensity on T1 weighted imaging (T1WI), high signal intensity on T2 weighted imaging (T2WI), and high signal intensity on diffusion weighted imaging (DWI). (Figures 1 and 3) The apparent diffusion coefficient (ADC) map showed high signal intensity. The MRI contrast-enhanced imaging findings were consistent with the CECT imaging findings in the arterial phase and portal venous phase. The arterial phase showed obvious ring enhancement, while the portal venous phase showed decreased nodules (Figures 1 and 3). However, the delayed phase showed equal or high enhancement. Additionally, intrahepatic bile duct dilatation and bile duct wall thickening could be seen in the two patients (Table 1).
Imaging Manifestations on Ultrasound
On ultrasound imaging, five of the eight patients (62.5%, 5/8) showed multiple lesions, which were all distributed around the portal vein. Four patients (80%, 4/5) showed hyperechoic nodules, in which there was no blood flow signal on colour Doppler flow imaging (CDFI). There were three patients (75%, 3/4) with other signs. One patient (25.0%, 1/4) showed intrahepatic bile duct dilatation and a thickening and enhanced echo of the Glisson sheath. The other two patients (50.0%, 2/4) showed only Glisson sheath thickening and echo enhancement. One of the five patients (20.0%, 1/5) uniquely showed hypoechoic nodules and masses with blood flow signals with a peripheral high echo, accompanied by the dilatation of intrahepatic bile duct and the thickening and enhanced echo of the Glisson sheath on the first US. However, 40 days later, the ultrasound examination of this patient showed that the hypoechoic lesions in the liver had turned into heterogeneous echoes of different heights and were fused with each other, with unclear boundaries and irregular shapes (Figure 1). Blood flow signals were still visible in the lesions, and there was no change in the intrahepatic bile duct or the Glisson sheath. There were 3 patients (37.5%, 3/8) without a nodular echo in the liver. Nevertheless, one patient showed a thickened Glisson sheath with an enhanced echo on ultrasound, while this patient showed multiple nodules and a mass shadow on CT. The second patient presented with liver enlargement, and this patient showed multiple nodules along the portal vein on CT. The third patient with a normal liver was the patient with only two subcapsular lesions on CT. Four patients (50.0%, 4/8) showed lymphadenovarix (Table 1).
Follow-Up
Five of the eight patients (62.5%, 5/8) were followed up by CT. The five patients underwent CT. The range of the follow-up interval was 154–701 days. After chemotherapy, the lesions of these five patients were completely relieved in three patients (60.0%, 3/5) and decreased in two patients (40.0%, 2/5) (Figure 2) (Table 1).
Four of the eight patients (50.0%, 4/8) were followed up by ultrasound. The range of the follow-up interval was 66–483 days. After chemotherapy, the intrahepatic lesions disappeared in two patients (50.0%, 2/4), among whom the Glisson sheath returned to normal in one patient, and the abdominal lymph node decreased in the other patient. In the third patient, there was no intrahepatic abnormality detected by ultrasound before chemotherapy, but abdominal enlargement and a decrease in lymph node size were observed. The fourth patient had liver enlargement, and there was no change in follow-up after chemotherapy (Table 1).
Discussion
The liver is commonly involved in AIDS-KS. Through our research, we found that, first, the AIDS-HKS patients showed simultaneous involvement of the skin, lymph nodes, lungs, oral cavity, etc. Second, 25.0% of AIDS-HKS patients had slightly abnormal liver function. Third, AIDS-HKS patients commonly presented multiple lesions, mainly distributed around the portal vein. Fourth, most of the AIDS-HKS patients showed ring enhancement in the arterial phase of CECT. The lesions decreased in the portal venous phase and the delayed phase. In the delayed phase of MRI enhancement, the lesions showed equal or high enhancement. Fifth, most nodules of the AIDS-HKS presented as hyperechogenicity on ultrasound imaging, while a few presented as hypoechogenicity. Finally, AIDS-HKS presented as intrahepatic bile duct dilatation and bile duct wall thickening around the lesion.
Due to the relatively few clinical symptoms related to the liver when KS invades the liver, the diagnosis of liver KS during the patient’s lifetime is relatively rare in AIDS-KS patients,16 which is consistent with the findings of this study. In this study, only two patients showed mild right epigastrium pain, and the other patients had no abdominal-related symptoms. It was previously reported in the literature that there was no significant difference in transaminase, lactate dehydrogenase, alkaline phosphatase or bilirubin when AIDS-KS involved the liver.17 A small number of case reports have reported progressive liver function decline in patients with rapid progression of liver and multiorgan failure, usually resulting in death.12 In this study, only two patients had liver function abnormalities, with mild and severe abnormalities, respectively.
The imaging manifestations of a disease depend on its pathological basis. The gross pathological manifestations of AIDS-HKS were variously sized purplish red nodules located around the portal vein and under the liver capsule. The adjacent portal vein and bile duct wall were thickened. Histologically, it was found that HKS mainly involved spindle cells, forming slit-like blood vessels, in which exudative red blood cells, inflammatory cells, and haemosiderin were seen. Usually, the portal vein space and surrounding liver parenchyma were involved. Hyperplasia of fibrous hoof tissue in the walls of the portal vein and bile duct, as well as dilation of the bile duct, could also be observed.12–14 However, the literature suggests that there is no obvious fibrosis change in the portal vein space.14 Macrovaculoar steatosis has been reported in some literature.12 Because the pathological results of HKS in this study were obtained from puncture biopsy tissue samples, with relatively few types of tissues, it was not possible to observe the overall pathology of HKS. However, our histological observations were basically consistent with literature reports, with diffuse spindle-shaped cells and slit-like blood vessels visible and a small amount of fibrous hyperplasia visible around the bile duct, but macroscopic steatosis was not seen.
Both the literature and this study found that AIDS-HKS involved multiple lesions, mainly distributed around the portal vein, and a few were located in the subcapsule.14,16,18 Low-density nodules were shown on plain CT scan. Ring enhancement was common in the arterial phase of CECT, and nodular or heterogeneous enhancement was also seen. From the portal venous phase to the delayed phase, the lesions were gradually uniformly enhanced, showing fewer nodules than in the arterial phase.16,18,19 Although we had only two patients that underwent MRI examination, the imaging findings of the two patients were basically consistent. The plain MRI scans showed low signal intensity on T1WI, high signal intensity on T2WI, DWI, and ADC map. After MRI contrast-enhanced scanning, the arterial phase showed circular enhancement, while the lesion enhancement gradually strengthened from the portal phase to the delayed phase. Some of the lesions were consistent with the surrounding liver parenchyma enhancement signals and showed equal enhancement, indicating a decrease in lesions. Some of the enhancement levels were higher than the surrounding liver parenchyma signals and showed high enhancement. The MRI imaging manifestations of AIDS-HKS in the literature are only from case reports, and most of them indicate MRI plain scan imaging manifestations, low signal intensity on T1WI, high signal intensity on T2WI, and no contrast-enhanced scanning manifestations.15 On CT and MRI, lumen dilation and wall thickening of the hepatic duct were observed in this study, which may be related to pathological hyperplasia of fibrous connective tissue.12–14
In this study, most AIDS-HKS patients showed hyperechoic nodules on ultrasonography, which was consistent with the findings in the literatures.15,16,19 However, a few studies have reported hypoechoic nodules on ultrasound examination.14 In this study, only one patient initially showed hypoechoic nodules, and after 40 days of follow-up, this patient showed mixed hypoechoic nodules. We will continue to observe the dynamic changes of the nodules in future studies and observe whether hypoechogenicity is a developmental stage of HKS. Hepatomegaly was a nonspecific sign of HKS, found in 19% of reported cases in the literatures.20,21 In this study, there were two patients with hepatomegaly with multiple nodules in the liver. Another common ultrasound sign was a thickening of the Glisson sheath and enhanced echo (62.5%), which was consistent with literature reports.12,16 Glisson sheath echo enhancement corresponded to the thickening of portal vein bundle fibres in autopsy pathology reported in the literature.16
AIDS-HKS presents as nodules in the liver and needs to be distinguished from various hepatic diseases, such as hepatic haemangioma, hepatic lymphoma, hepatic metastasis, and hepatic abscess. Hepatic haemangioma presents as low density on CT, a low signal on T1WI and a high signal on T2WI on MRI, without diffusion limitation. The enhanced scan shows a fast in and slow out type enhancement, with nodular enhancement visible at the edges in the arterial phase. From the portal phase to the delayed phase, it gradually enhances, showing higher enhancement than the surrounding liver parenchyma.22 Hepatic haemangiomas were mostly hyperechoic on ultrasound, with clear boundaries and homogeneous internal echoes. CDFI often does not display blood flow signals. A few hepatic haemangiomas exhibited isoechoic, hypoechoic, or mixed echogenicity, and CDFI might have star-shaped blood flow signals.23 Hepatic lymphoma was the most common tumour in HIV-infected individuals. Hepatic lymphoma appeared as low density on CT, a low signal on T1WI on MRI, and an inconsistent signal on T2WI. Hepatic lymphoma presented as mild to moderate enhancement with vascular floating sign observed on CT and MRI contrast-enhanced scanning.24 Hepatic lymphoma appeared as uniform or uneven low to very low echogenicity on ultrasound. Blood vessels passed through the tumour without invasion. CDFI showed only a small amount of striped blood flow signals inside the tumour.25 Patients with hepatic metastases had a history of malignant tumours, with diverse intrahepatic manifestations that were associated with their primary tumours. Generally, hepatic metastases appeared as low-density shadows on CT, with MRI showing a moderately low signal on T1WI and a moderately high signal on T2WI, with limited diffusion. Enhanced scanning shows circular enhancement in the arterial phase, with central enhancement and reduced peripheral enhancement from the portal phase to the delayed phase, typically showing a bull’s eye sign.26,27 On ultrasound, hepatic metastases manifested as anechoic, hypoechoic, isoechoic, hyperechoic, or even mixed echoic areas, with the “target ring sign” as their characteristic manifestation.28 Patients with hepatic abscesses generally had fever, abdominal pain, and elevated laboratory inflammatory indicators. CT showed a low-density lesion, and MRI showed a low signal on T1WI and a high signal on T2WI, with limited diffusion due to pus. The typical enhancement scan showed circular enhancement with blurred edges, inflammatory oedema of the surrounding liver parenchyma, continuous enhancement of the abscess wall, and visible septations in some cavities.29 The course of hepatic abscess varied, and the ultrasound manifestations varied. During the inflammatory phase, ultrasound manifestations included single or multiple circular or irregularly shaped hypoechoic areas within the liver, with uneven edges. Dotted or patchy strong echoes could be seen within the hypoechoic areas. CDFI displayed scattered point and strip blood flow signals. During liquefaction, anechoic areas appeared, with thick capsule walls and unsmooth inner walls. During the absorption period, the anechoic area in the liver significantly shrank or disappeared and was replaced by patchy or striped hyperechogenicity.30
CT, MRI, and ultrasound imaging had complemented each other in AIDS-HKS examination. In this study, three out of eight AIDS-HKS patients were not found to have intrahepatic AIDS-HKS on ultrasound examination, while nodular lesions were visible on CT scans. Ultrasound examination only found two patients with intrahepatic bile duct dilation, while CT examination found two additional patients. CT has advantages over ultrasound in detecting nodules of AIDS-HKS and intrahepatic bile duct dilation. CT and MRI were helpful to diagnose and exclude deep tissue and lymph node involvement due to their wide scanning range.2,31 However, CT involves radiation exposure, while MRI and ultrasound do not. CT and MRI required intravenous injection of contrast agents for enhanced scanning. Ultrasound could be used to measure liver size, although liver enlargement was a nonspecific sign. Ultrasound can also be used to conveniently observe the blood flow inside lesions and the dynamic changes.
This study had two limitations. First, the sample size was small, probably because the incidence rate of KS is low, and the incidence rate of AIDS-HKS is even lower. Second, only two patients underwent MRI examination. Though the plain and enhanced MRI images of the two patients were basically consistent, we will continue to collect patients who undergo MRI examination and summarize the MRI imaging manifestations in the future.
Conclusion
In summary, AIDS-HKS presented as multiple nodular lesions, which showed different imaging features on CT, MRI, and ultrasound. The lesions could be completely relieved or decreased after follow-up. The combination of different imaging examination methods was helpful for the imaging diagnosis and differential diagnosis of AIDS-HKS.
Acknowledgments
We are grateful to AJE for providing language editing services.
Disclosure
The authors report no conflicts of interest in this work.
References
1. Bhatt MD, Nambudiri VE. Cutaneous sarcomas. Hematol Oncol Clin North Am. 2019;33(1):87–101. doi:10.1016/j.hoc.2018.08.007
2. Javadi S, Menias CO, Karbasian N, et al. HIV-related malignancies and mimics: imaging findings and management. Radiographics. 2018;38(7):2051–2068. doi:10.1148/rg.2018180149
3. Hernández-Ramírez RU, Shiels MS, Dubrow R, et al. Cancer risk in HIV-infected people in the USA from 1996 to 2012: a population-based, registry-linkage study. Lancet HIV. 2017;4(11):e495–e504. doi:10.1016/S2352-3018(17)30125-X
4. Uldrick T, Whitby D. Update on KSHV epidemiology, Kaposi sarcoma pathogenesis, and treatment of Kaposi sarcoma. Cancer Lett. 2011;305(2):150–162. doi:10.1016/j.canlet.2011.02.006
5. Lucia MB, Anu R, Handley M, et al. Exposure to HIV-protease inhibitors selects for increased expression of P-glycoprotein (ABCB1) in Kaposi’s sarcoma cells. Br J Cancer. 2011;105(4):513–522. doi:10.1038/bjc.2011.275
6. Tsai KY. Kaposi sarcoma. Chapter 139. In: Griffiths C, Barker J, Bleiker T, editors. Rook’s Textbook of Dermatology, Ninth Edition. London: Wiley; 2016.
7. Hiatt KM, Nelson AM, Lichy JH, et al. Classic Kaposi sarcoma in the United States over the last two decades: a clinicopathologic and molecular study of 438 non-HIV-related Kaposi sarcoma patients with comparison to HIV-related Kaposi sarcoma. Mod Pathol. 2008;21(5):572–582. doi:10.1038/modpathol.2008.15
8. Marcoval J, Bonfill-Ortí M, Martínez-Molina L, et al. Evolution of Kaposi sarcoma in the past 30 years in a tertiary hospital of the European Mediterranean basin. Clin Exp Dermatol. 2019;44(1):32–39. doi:10.1111/ced.13605
9. Sullivan RJ, Pantanowitz L, Casper C, et al. HIV/AIDS: epidemiology, pathophysiology, and treatment of Kaposi sarcoma–associated herpesvirus disease: kaposi sarcoma, primary effusion lymphoma, and multicentric Castleman disease. Clin Infect Dis. 2008;47(9):1209–1215. doi:10.1086/592298
10. Niedt GW, Schinella RA. Acquired immunodeficiency syndrome: clinicopathologic study of 56 autopsies. Arch Pathol Lab Med. 1985;109(8):727–734.
11. Tacconi D, Vergori A, Lapini L, et al. Hepatic Kaposi’s sarcoma in a patient affected by AIDS: correlation between histology and imaging. J Ultrasound. 2012;15(4):215–219. doi:10.1016/j.jus.2012.10.004
12. Van Leer-Greenberg B, Kole A, Chawla S. Hepatic Kaposi sarcoma: a case report and review of the literature. World J Hepatol. 2017;9(4):171–179. doi:10.4254/wjh.v9.i4.171
13. Bonacini M. Hepatobiliary complications in patients with human immunodeficiency virus infection. Am J Med. 1992;92(4):404–411. doi:10.1016/0002-9343(92)90271-C
14. Towers MJ, Withers CE, Rachlis AR, et al. Ultrasound diagnosis of hepatic Kaposi sarcoma. J Ultrasound Med. 1991;10(12):701–703. doi:10.7863/jum.1991.10.12.701
15. Tanaka T, Masuda G, Takechi A, et al. A case of AIDS-related hepatic Kaposi’s sarcoma. J Gastroenterol. 1995;30(2):268–272. doi:10.1007/BF02348677
16. Luburich P, Bru C, Ayuso MC, et al. Hepatic Kaposi sarcoma in AIDS: US and CT findings. Radiology. 1990;175(1):172–174. doi:10.1148/radiology.175.1.2179988
17. Schneiderman DJ, Arenson DM, Cello JP, et al. Hepatic disease in patients with the acquired immune deficiency syndrome (AIDS). Hepatology. 1987;7(5):925–930. doi:10.1002/hep.1840070522
18. Hammerman AM, Kotner LM Jr, Doyle TB. Periportal contrast enhancement on CT scans of the liver. AJR Am J Roentgenol. 1991;156:313–315. doi:10.2214/ajr.156.2.1898805
19. Buetow PC, Buck JL, Ros PR, et al. Malignant vascular tumors of the liver: radiologic-pathologic correlation. Radiographics. 1994;14(1):153–166. doi:10.1148/radiographics.14.1.8128048
20. Moon KL Jr, Federle MP, Abrams DI, et al. Kaposi sarcoma and lymphadenopathy syndrome: limitations of abdominal CT in acquired immunodeficiency syndrome. Radiology. 1984;150(2):479–483. doi:10.1148/radiology.150.2.6691105
21. Van J, Reau N. Disseminated AIDS-related Kaposi Sarcoma immune reconstitution inflammatory syndrome with infiltrative liver disease. ACG Case Rep J. 2021;8(9):e00660. doi:10.14309/crj.0000000000000660
22. Sousa MS, Ramalho M, Herédia V, et al. Perilesional enhancement of liver cavernous hemangiomas in magnetic resonance imaging. Abdom Imaging. 2014;39:722–730. doi:10.1007/s00261-014-0100-6
23. Grazioli L, Ambrosini R, Frittoli B, et al. Primary benign liver lesions. Eur J Radiol. 2017;95:378–398. doi:10.1016/j.ejrad.2017.08.028
24. Kelekis NL, Semelka RC, Siegelman ES, et al. Focal hepatic lymphoma: magnetic resonance demonstration using current techniques including gadolinium enhancement. Magn Reson Imaging. 1997;15(6):625–636. doi:10.1016/S0730-725X(97)00111-2
25. Lu Q, Zhang H, Wang WP, et al. Primary non-Hodgkin’s lymphoma of the liver: sonographic and CT findings. Hepatobiliary Pancreat Dis Int. 2015;14:75–81. doi:10.1016/S1499-3872(14)60285-X
26. Grazioli L, Bondioni MP, Faccioli N, et al. Solid focal liver lesions: dynamic and late enhancement patterns with the dual phase contrast agent gadobenate dimeglumine. J Gastrointest Cancer. 2010;41(4):221–232. doi:10.1007/s12029-010-9145-0
27. Danet IM, Semelka RC, Leonardou P, et al. Spectrum of MRI appearances of untreated metastases of the liver. AJR Am J Roentgenol. 2003;181:809–817. doi:10.2214/ajr.181.3.1810809
28. Virmani J, Kumar V, Kalra N, et al. Characterization of primary and secondary malignant liver lesions from B-mode ultrasound. J Digit Imaging. 2013;26(6):1058–1070. doi:10.1007/s10278-013-9578-7
29. Balci NC, Semelka RC, Noone TC, et al. Pyogenic hepatic abscesses: MRI findings on T1- and T2-weighted and serial gadolinium-enhanced gradient-echo images. J Magn Reson Imaging. 1999;9(2):285–290. doi:10.1002/(SICI)1522-2586(199902)9:2<285::AID-JMRI20>3.0.CO;2-S
30. Barosa R, Pinto J, Caldeira A, et al. Modern role of clinical ultrasound in liver abscess and echinococcosis. J Med Ultrason. 2017;44(3):239–245. doi:10.1007/s10396-016-0765-2
 © 2024 The Author(s). This work is published and licensed by Dove Medical Press Limited. The full terms of this license are available at https://www.dovepress.com/terms.php and incorporate the Creative Commons Attribution - Non Commercial (unported, v3.0) License.
By accessing the work you hereby accept the Terms. Non-commercial uses of the work are permitted without any further permission from Dove Medical Press Limited, provided the work is properly attributed. For permission for commercial use of this work, please see paragraphs 4.2 and 5 of our Terms.
© 2024 The Author(s). This work is published and licensed by Dove Medical Press Limited. The full terms of this license are available at https://www.dovepress.com/terms.php and incorporate the Creative Commons Attribution - Non Commercial (unported, v3.0) License.
By accessing the work you hereby accept the Terms. Non-commercial uses of the work are permitted without any further permission from Dove Medical Press Limited, provided the work is properly attributed. For permission for commercial use of this work, please see paragraphs 4.2 and 5 of our Terms.