")
Back to Journals » Breast Cancer: Targets and Therapy » Volume 16
GNPNAT1 is a Biomarker That Predicts a Poor Prognosis of Breast Cancer
Authors Zhou Y, Xue W, Meng X, Bhandari A , Zeng H, KC R, Hirachan S, Xia E
Received 21 November 2023
Accepted for publication 14 February 2024
Published 5 March 2024 Volume 2024:16 Pages 71—89
DOI https://doi.org/10.2147/BCTT.S451054
Checked for plagiarism Yes
Review by Single anonymous peer review
Peer reviewer comments 3
Editor who approved publication: Professor Harikrishna Nakshatri
Yuying Zhou,1,* Wu Xue,2,* Xinyu Meng,2,* Adheesh Bhandari,2,3,* Hanqian Zeng,4 Rajan KC,5 Suzita Hirachan,6 Erjie Xia2
1Department of Oncology and Hematology, Wenzhou Hospital of Integrated Traditional Chinese and Western Medicine, Wenzhou, Zhejiang, People’s Republic of China; 2Department of Breast Surgery, The First Affiliated Hospital of Wenzhou Medical University, Wenzhou, Zhejiang, People’s Republic of China; 3Department of Surgery, Breast and Thyroid Unit, Primera Hospital, Kathmandu, Nepal; 4Department of Surgical Oncology, Taizhou Hospital of Zhejiang Province Affiliated to Wenzhou Medical University, Linhai, Zhejiang Province, People’s Republic of China; 5Central Department of Zoology, Tribhuvan University, Kirtipur, Kathmandu, Nepal; 6Department of General Surgery, Breast and Thyroid Unit, Tribhuvan University, Teaching Hospital, Kathmandu, Nepal
*These authors contributed equally to this work
Correspondence: Erjie Xia, Department of Breast Surgery, The First Affiliated Hospital of Wenzhou Medical University, Wenzhou, Zhejiang, People’s Republic of China, Tel +86 577 5557 8527, Email [email protected] Yuying Zhou, Department of Oncology and Hematology, Wenzhou Hospital of Integrated Traditional Chinese and Western Medicine, Wenzhou, Zhejiang, People’s Republic of China, Tel +8615757194239, Email [email protected]
Background: Breast cancer (BC) is increasingly becoming the primary reason for death in women, which sounded the alarm. Thus, finding a novel management target for BC is imminent.
Materials and Methods: The data on gene expression and clinicopathological characteristics were downloaded from The Cancer Genome Atlas (TCGA). The expression of GNPNAT1 in 40 paired breast cancer and adjacent tissues was measured by quantitative real-time polymerase chain reaction (qRT-PCR). Univariate and Multivariate logistic regression methodology was applied to analyze the prognostic factors for lymph node metastasis (LNM). Based on the status of breast cancer-relative receptors, patients were distributed into six groups, and then the Kaplan-Meier survival analysis with a Log rank test was applied to investigate the involvement among the expression of GNPNAT1 and overall survival (OS).
Results: We found higher expression of GNPNAT1 was connected with poor survival in breast cancer by COX regulation analysis. GO, KEGG, and GSEA analysis prompted that GNPNAT1 was connected with the defense mechanism of cells, cell proliferation, and division. Immunization infiltration analysis showed that high GNPNAT1 was negatively connected with 16 immunization infiltration cell types and positively connected with four immunization infiltration cell types.
Conclusion: As a whole, our results indicated that GNPNAT1 might be a probable biomarker for diagnosis and prognosis in breast cancer.
Keywords: GNPNAT1, biomarker, breast cancer, diagnosis, prognosis
Introduction
Breast cancer is one of the most common malignant cancers in the world. There has been an increase in the incidence of breast cancer. The 2020 global cancer statistics report showed that the number of breast cancer patients had surpassed lung cancer in women. New breast cancer cases accounted for 30% of women newly diagnosed with cancer in 2020.1,2 It was estimated that there would be 2.3 million new breast cancer cases around the world in 2021. At the same time, for the individual, the probability of individual breast cancer increases with age. If a woman could live to natural death, she would have a 12.9% chance of developing breast cancer.1 In China, the number of new breast cancer cases also increased from 300,000 to 420,000 from 2015 to 2020.2 With the continuous development of genome technology and the advancement of the human genome sequence project, our understanding of the development mechanism of breast cancer has also deepened.3 Based on previous studies, we could find that breast cancer was a heterogeneous disease, characterized by a variety of genomes, gene expression profiles, and molecular markers.4,5 According to the expression level of human epidermal growth factor receptor (HER2) and hormone receptor (HR), breast cancer was divided into three main subtypes of breast cancer: luminal A, luminal B, and HER2+ and basal-like.6
In recent years, with the progress of diagnosis and treatment levels, more and more patients have been treated according to the subtypes and individual situations, which greatly prolongs the lifespan of breast cancer patients.7 The 5-year overall survival rate was more than 95% for patients in the early stages.8 But, the 5-year overall survival rate of advanced breast cancer patients was less than 40%. Therefore, early diagnosis and treatment of breast cancer are very important to improve the patient’s survival rate and quality of life.
The glucosamine-phosphate N-acetyltransferase 1 (GNPNAT1), also known as GNA1, GNPNAT, and GPNAT1, is a key enzyme gene that promotes the biosynthesis of uridine diphosphate-N-acetylglucosamine and the metabolism of glucose. Feng et al found that GNPNAT1 was upregulated in NSCLC, and patients with high GNPNAT1 levels had a poor prognosis. (10.2147/CMAR.S367857) Liu et al found that GNPNAT1 was upregulated in LUAD and GNPNAT1 overexpression was correlated with DNA copy amplification, low DNA methylation, and downregulation of hsa-miR-30d-3p (= −0.17, < 0.001). GNPNAT1 expression was linked to B cells, CD4T cells, and dendritic cells. (10.3389/fmolb.2021.605754) In one previous research, GNPNAT1 was connected with resistance to prostate cancer castration therapy through the PI3K-AKT pathway.9 There was also a lot of research showing that GNPNAT1 was related to the prognostic of lung adenocarcinoma, and the expression level of GNPNAT1 was connected with the immune regulation of lung adenocarcinoma.10–16
Here, based on The Cancer Genome Atlas (TCGA) dataset and our own dataset, we found that the expression level of GNPNAT1 in tumors was significantly higher than in corresponding control tissues in breast cancer and higher expression of GNPNAT1 was connected with poor survival in breast cancer by COX regulation analysis. In the meanwhile, GNPNAT1 was connected with the defense mechanism of cells, cell proliferation, and division through GO, KEGG, and GSEA analysis. Immunization infiltration analysis showed that high GNPNAT1 was negatively connected with 16 immunization infiltration cell types and positively connected with four immunization infiltration cell types. This study showed that GNPNAT1 might be a probable biomarker for diagnosis and prognosis in breast cancer.
Materials and Methods
Ethics: Our experimental protocols have been granted by the Ethical Review Committee of the First Affiliated Hospital of Wenzhou Medical University (Approval No. 2012–57), and informed consent was obtained from each patient before their tissues were used.
Patients and Breast Tissue Samples Collection of Validated Set
Forty patients, who were diagnosed as primary breast cancer patients by two pathologists at least, were selected. All patients had complete baseline clinical data. With written informed consent, we collected the tumor tissues and non-neoplastic breast tissues of the 40 breast cancer patients in operation. After resection, samples were put in liquid nitrogen as quickly as possible. If the samples were not used for RNA extraction immediately, they would be stored in a −80°C refrigerator.
Cell Lines and Cell Culture
In this investigation, our proposed hypothesis was validated using a range of breast cancer cell lines, namely MDA-MB-231, MCF-7, MDA-MB-463, MDA-MB-468, BT-474, MDA-MB-453, T47D, along with a human mammary epithelial cell line, MCF-10A. All cell lines were procured from the Cell Bank of the Shanghai Chinese Academy of Sciences in Shanghai, China.
T47D, MCF-7, and MDA-MB-231 cell lines were cultured in DMEM medium (Gibco, Invitrogen, Carlsbad, CA, USA), supplemented with 10% Fetal Bovine Serum (Gibco) and 1% penicillin/streptomycin (Solarbio, Beijing, China). The incubation conditions included an atmosphere of 5% CO2 at a temperature of 37°C. For BT-474 and MDA-MB-468 cell lines, RPMI 1640 medium (Gibco) was employed, enriched with 10% Fetal Bovine Serum and 1% penicillin/streptomycin. The cells were incubated under conditions of 5% CO2 and 37°C.MCF-10A cells were cultured in DMEM-F12 medium (Gibco) supplemented with 10% Fetal Bovine Serum and 1% penicillin/streptomycin. The incubation conditions included an atmosphere of 5% CO2 at 37°C.
MDA-MB-453 and MDA-MB-463 cell lines were cultured in L-15 medium (Gibco) containing 10% Fetal Bovine Serum and 1% penicillin/streptomycin. The incubation was carried out at 37°C without the presence of CO2.
MCF10A was cultured in DMEM-F12 medium (Gibco) at 37 °C under the atmosphere with 5% CO2, which contains 10% fetal bovine serum (Gibco).
RNA Extraction, Reverse Transcription, and RT‑qPCR
TRIzol (Thermo Fisher Scientific, Waltham, MA, USA) was used to isolate RNA from cells and 40 pairs of tissue. Then purity and concentration of RNA would be measured by spectrophotometric value and A260/A280 ratio. ReverTra Ace qPCR RT Kit (Toyobo, Osaka, Japan) was used to reverse transcription in an efficient ratio (1000ng RNA per 20µL system reacting). And an SYBR Premix Ex Taq II kit (RR820A, TaKaRa, Dalian, China) was used for Real-time reverse transcription‑quantitative polymerase chain reaction (qRt-PCR) on an Applied Biosystems 7500 Real-Time PCR System. The mRNA expression compared with the GAPDH expression was calculated by the 2−ΔΔCt equation. All procedures were performed according to standard instructions. All experiments were repeated at least three times. We bought all the primers from Sangon Biotech (Shanghai, China). The sequences of the primer are listed below: GNPNAT1: 5’-ATCCATTCCTGTGCTAAGAGAG-3’ (forward) and 5’-ATCCATTCCTGTGCTAAGAGAG-3’ (reverse). Each assay was performed in triplicate, and the steps were performed by standard description.
Characteristics Analysis
The normalized RNA-seq data and corresponding clinical information were obtained from The Cancer Genome Atlas (TCGA) genomic dataset (https://cancergenome.nih.gov/). The format of RNAseq was transformed from Fragments Per Kilobase per Million (FPKM) to transcripts per million reads (TPM) and the log2 conversion. The clinicopathologic factors of the validated cohort were collected from The First Affiliated Hospital of Wenzhou Medical University (Wenzhou, Zhejiang, People’s Republic of China). The GNPNAT1 high expression set and the low expression set were distinguished by the median of whole TCGA breast cancer samples’ GNPNAT1 expression level. We analyzed the correlation between GNPNAT1 expression and clinicopathologic factors by the based package of R software (3.6.3 Version).
Gene Expression Analysis
The different expression of GNPNAT1 between normal and tumor tissues for diverse malignant tumors and different cancer subtypes in the TCGA dataset was output by the “Gene DE” module of Tumor Immune Estimation Resource, Version 2 (TIMER2, http://timer.cistrome.org/). The subtypes of breast cancer in the TCGA database which had not have enough normal tissues to make statistics analysis were supplemented with corresponding normal tissues of the Genotype-Tissue Expression (GTEx) database by the “Expression analysis -Box Plots” module of the Gene Expression Profiling Interactive Analysis, Version 2 (GEPIA2, http://gepia.cancer-pku.cn/). The visualization of GNPNAT1 expression in different clinical subgroups was implemented by the ggplot2 package (3.3.3 Version) of R software (3.6.3 Version). GraphPad Prism software (7.0 Version) was used for analyzing the different expressions of the validated cohort.
ROC Curve and Survival Analysis
PROC package (1.17.0.1 Version) and ggplot2 package (3.3.3 Version) of R software (3.6.3 Version) were used to draw the ROC curve. We obtained survival maps and survival plots from GEPIA2. Statistical analysis of the association between GNPNAT1 and survival was examined by the COX regression model using the survival package (3.2-10 Version) of R software (3.6.3 Version).
Nomogram and Prognostic Model
We constructed a nomogram to predict the probability that one breast cancer patient can live one year, three years, and five years based on multivariate Cox regression analysis. RMS package (6.2-0 Version) and survival package (3.2-10 Version) of R software (3.6.3 Version) were performed as tools that draw this nomogram. The c-index was the evaluation index that judged the nomogram’s concordance.
Immune Infiltration Analysis
GSVA package (1.34.0 Version) of R software (3.6.3 Version) was used for immune infiltration analysis. The algorithm used was the ssGSEA (single-sample Gene Set Enrichment Analysis) method. Spearman correlation coefficients were used to evaluate the connection between GNPNAT1 expression and immune infiltration.
The Genetic Alteration Analysis
The alteration characteristics of GNPNAT1, which contained mutation type, alteration frequency, and copy number alteration, were analyzed by cBioPortal (https://www.cbioportal.org/) web. In this part, the mutated sites of GNPNAT1 can be shown in the 3D protein structure model. The data of cBioPortal was from the TCGA database.
GNPNAT1-Binding Proteins and GNPNAT1-Correlated Genes Analysis
The STRING tool (https://string-db.org/) was used to download the list of the most significant 50 proteins that bind to GNPNAT1, with support from experimental evidence. Additionally, the top 100 genes correlated with GNPNAT1 were obtained from GEPIA2. The visualization of these top 100 GNPNAT1-correlated genes was generated using the Tumor Immune Estimation Resource 2 version (TIMER2, http://timer.cistrome.org/) in combination with the ggplot2 package (version 3.3.3) in R software (version 3.6.3). Furthermore, the ggplot2 package (version 3.3.3) in R software (version 3.6.3) was employed to create scatter plots for the top 5 GNPNAT1-correlated genes, as well as a Venn diagram.
Functional Enrichment Analysis
Cluster Profiler package (version 3.14.3) along with org.Hs.eg.db package (version 3.10.0) within R software (version 3.6.3) were utilized for conducting Gene Ontology (GO) enrichment analysis as well as Kyoto Encyclopedia of Genes and Genomes (KEGG) pathway analysis. The information for Gene Set Enrichment Analysis (GSEA) was sourced from MSigDB Collections (https://www.gsea-msigdb.org/gsea/msigdb/index.jsp), and the implementation of GSEA was carried out using the ggplot2 package (version 3.3.3) in R software (version 3.6.3). Protein-protein interaction (PPI) network analysis was performed using the STRING tool (https://string-db.org/).
Statistical Analysis
All experiments were conducted in triplicate. The distribution of data was assessed using the Shapiro–Wilk test. If the data followed a normal distribution, they were subjected to analysis using Student’s t-test. Conversely, if the data did not adhere to a normal distribution, analysis was performed using either the Wilcoxon test or the Mann–Whitney test. Comparisons between two groups were assessed using the Student’s t-test, while multiple group comparisons were analyzed using one-way ANOVA.
For examining the relationship between GNPNAT1 expression and clinicopathological features, a Chi-square test and logistic regression were employed. To evaluate the predictive value of GNPNAT1 expression for the prognosis of breast cancer patients, Cox regression analysis was employed.
All statistical analyses were conducted using SPSS 25.0 software, GraphPad Prism software (version 7.0), and R software (version 3.6.3). Statistical significance was considered at a threshold of P < 0.05. Data visualization was achieved using R software (version 3.6.3) and GraphPad Prism software (version 7.0).
Results
Baseline Characteristics of Patients
There were two cohorts (TCGA cohort and local verified cohort) in this study.
In the TCGA cohort, there were a total of 1083 breast cancer patients with the required clinical features downloaded from the TCGA database. The baseline characteristics of the GNPNAT1 high expression set and the low expression set in the TCGA cohort were shown in Table 1; a comparison of proportion between these sets was examined by the chi-square test. The baseline characteristics of our local verified cohort are listed in Table 2.
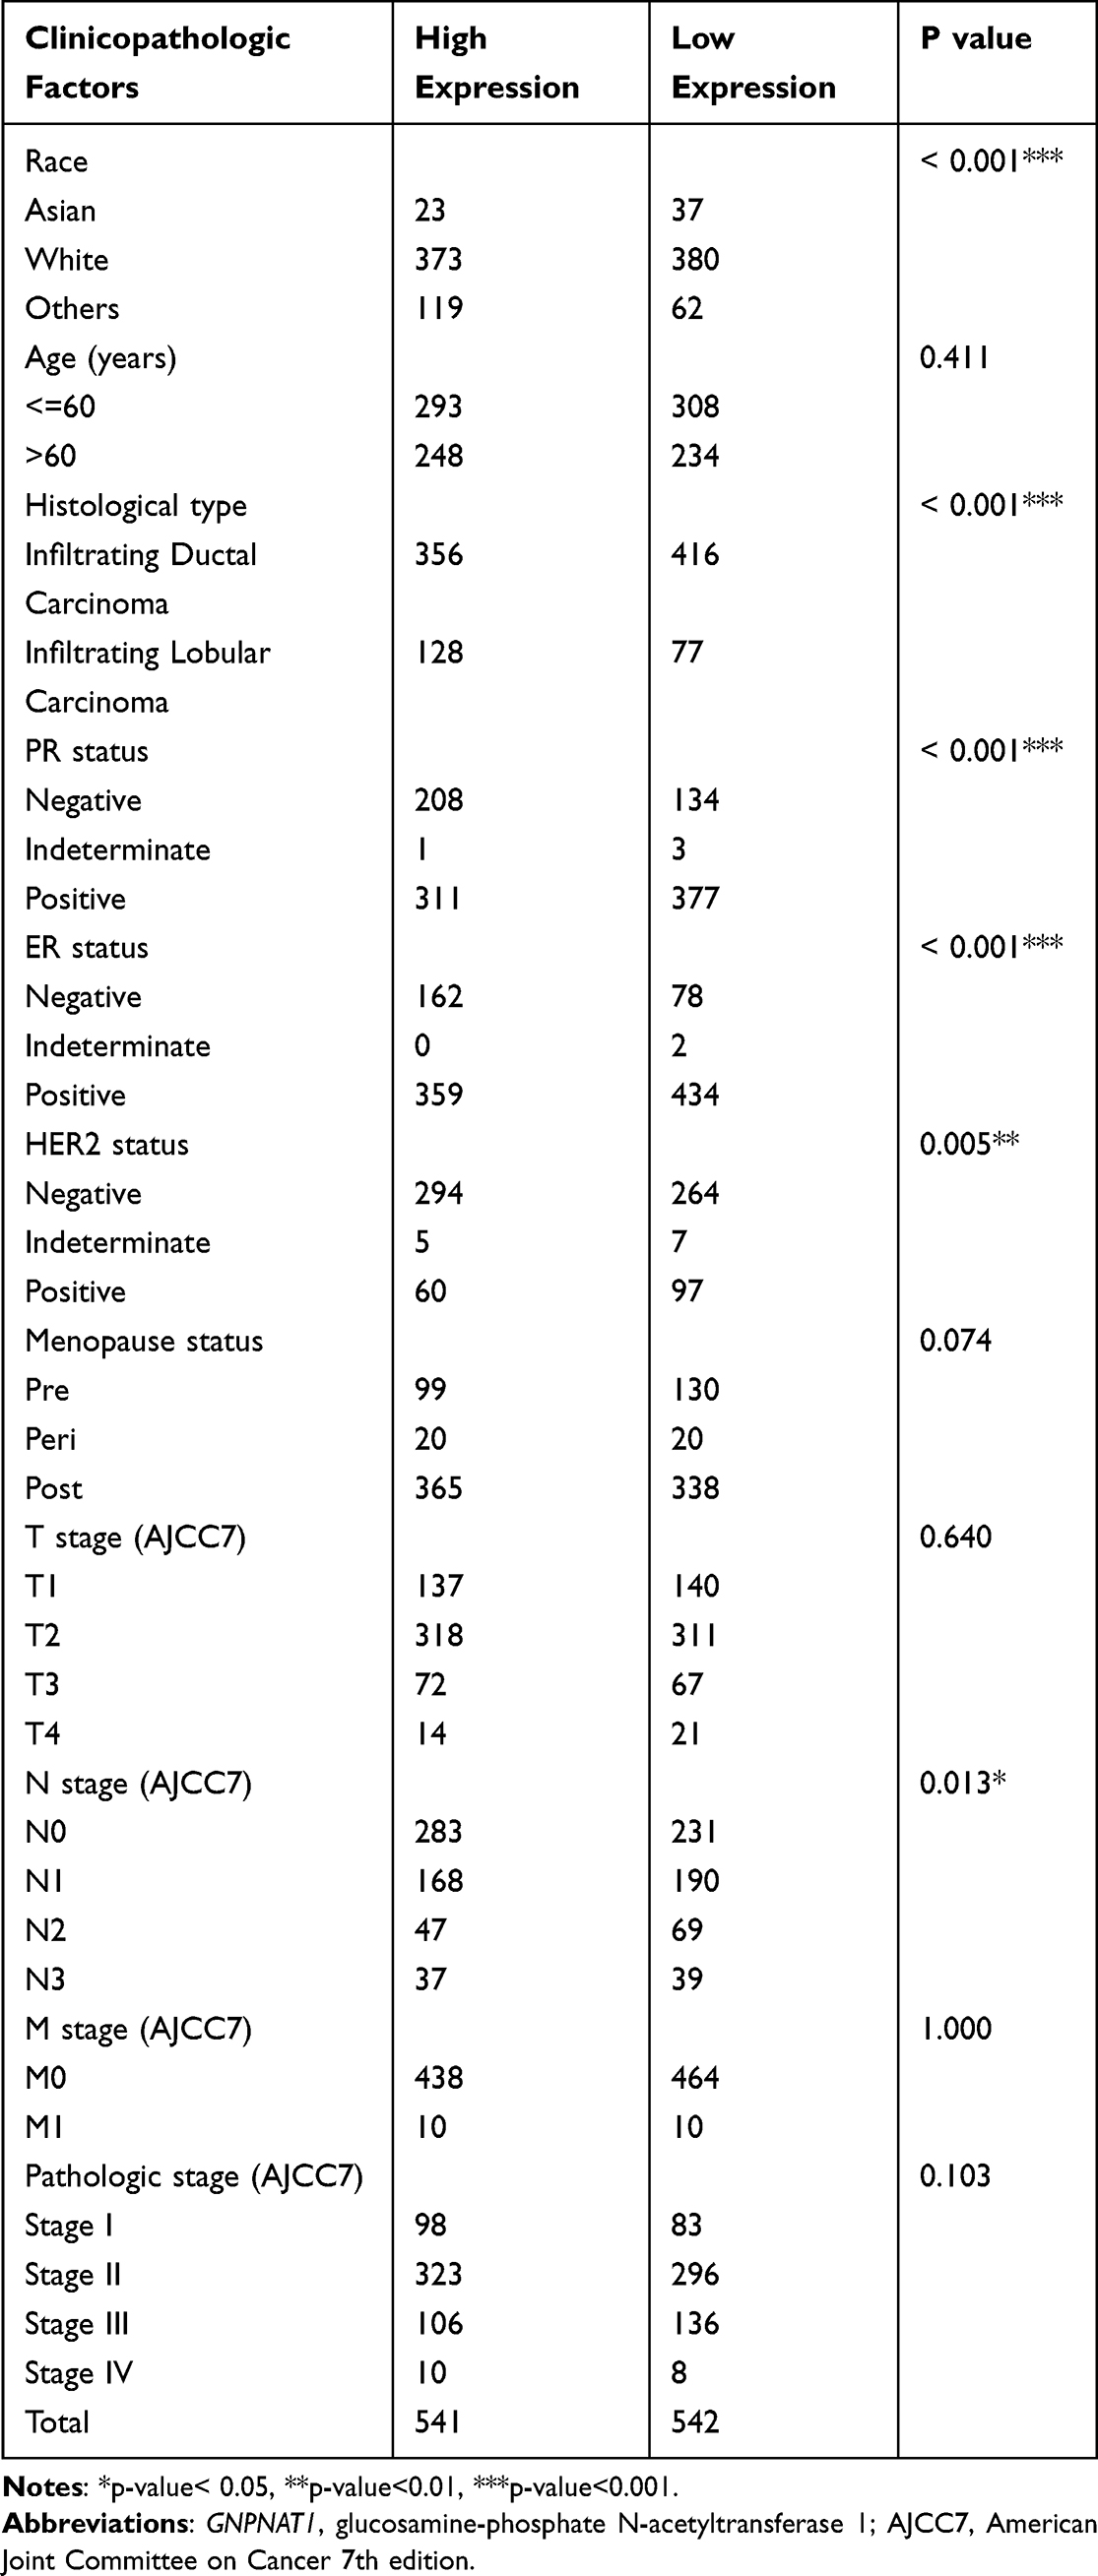 |
Table 1 Baseline Characteristics of the GNPNAT1 High Expression Set and the Low Expression Set in the TCGA Cohort |
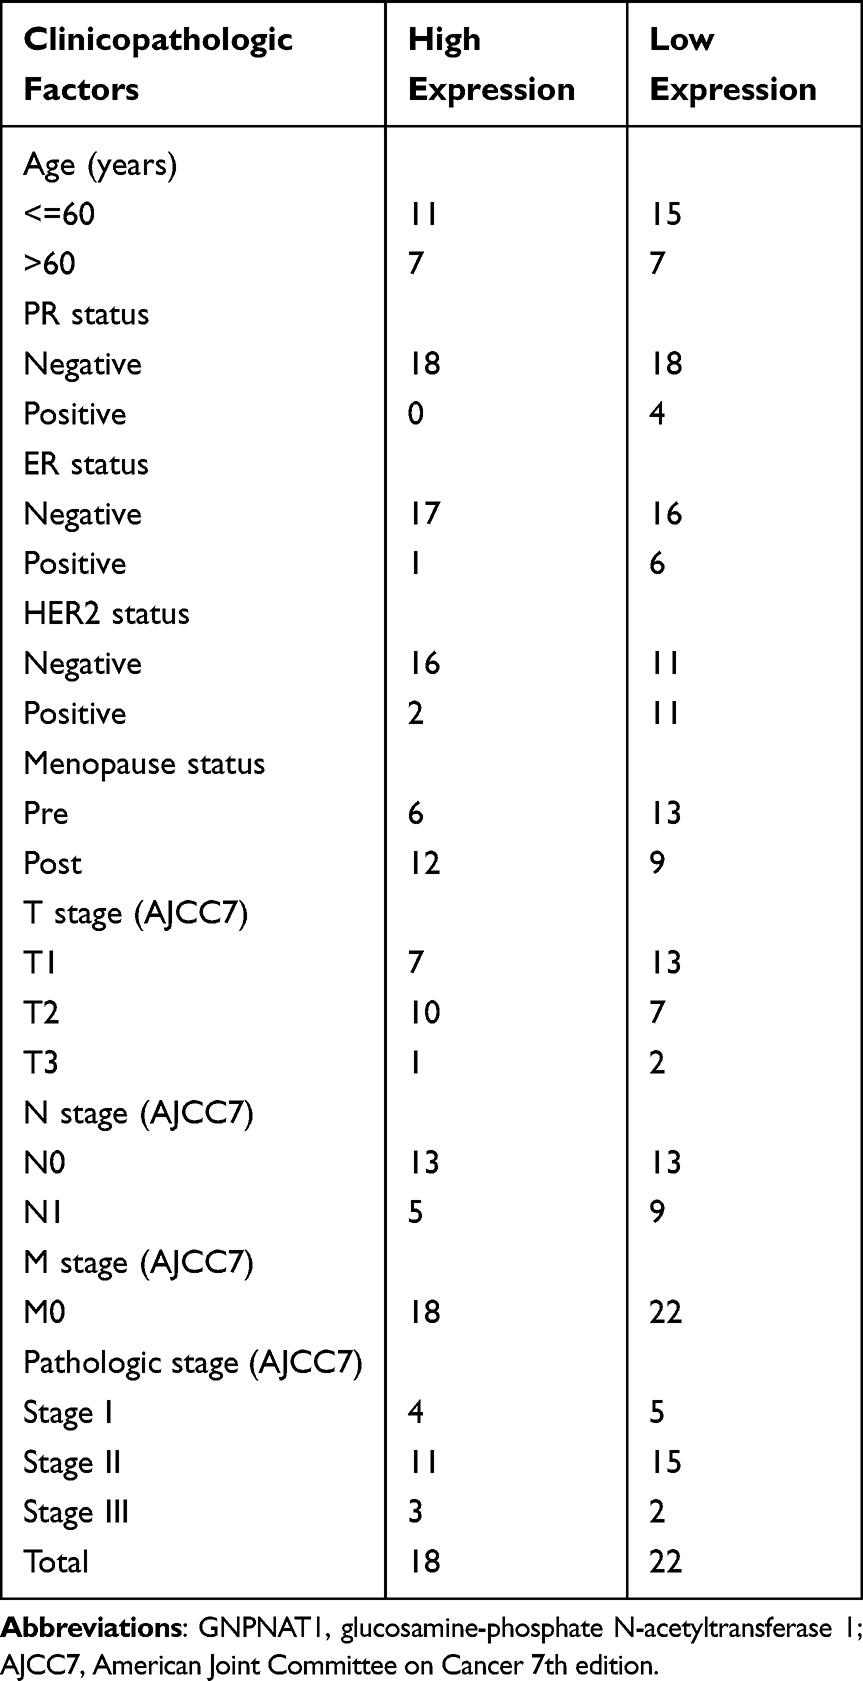 |
Table 2 Baseline Characteristics of the GNPNAT1 High Expression Set and the Low Expression Set in the Validated Cohort |
GNPNAT1 is Overexpressed in Breast Cancer
In this study, we aimed to explore the carcinogenesis of human GNPNAT1 in breast cancer. TIMER2 was applied to analyze the expression of GNPNAT1 in breast cancer of TCGA. We found that the expression level of GNPNAT1 in tumors was significantly higher than in corresponding control tissues in breast cancer (P<0.001) (Figure 1A). However, the subtypes of breast cancer in TCGA did not have enough normal tissues to make a statistical analysis. To assess the expression distinction of GNPNAT1 in different breast cancer subtypes, the normal tissues of the GTEx dataset were used as controls. We further confirmed that the expression of GNPNAT1 in tumors was significantly upregulated in basal-like (P<0.05), Her2+ (P<0.05), Luminal A (P<0.05), and Luminal B (P<0.05) subtype (Figure 1B). To further evaluate the expression difference of GNPNAT1 between the normal and tumor tissues of breast cancer, we detected the expression level of GNPNAT1 in 40 pairs of tumor samples and nearby normal breast tissues via RT-qPCR. This result was consistent with the TCGA data, and a heat map was made to describe the difference in our verified cohort (P<0.0001) (Figure 1C).
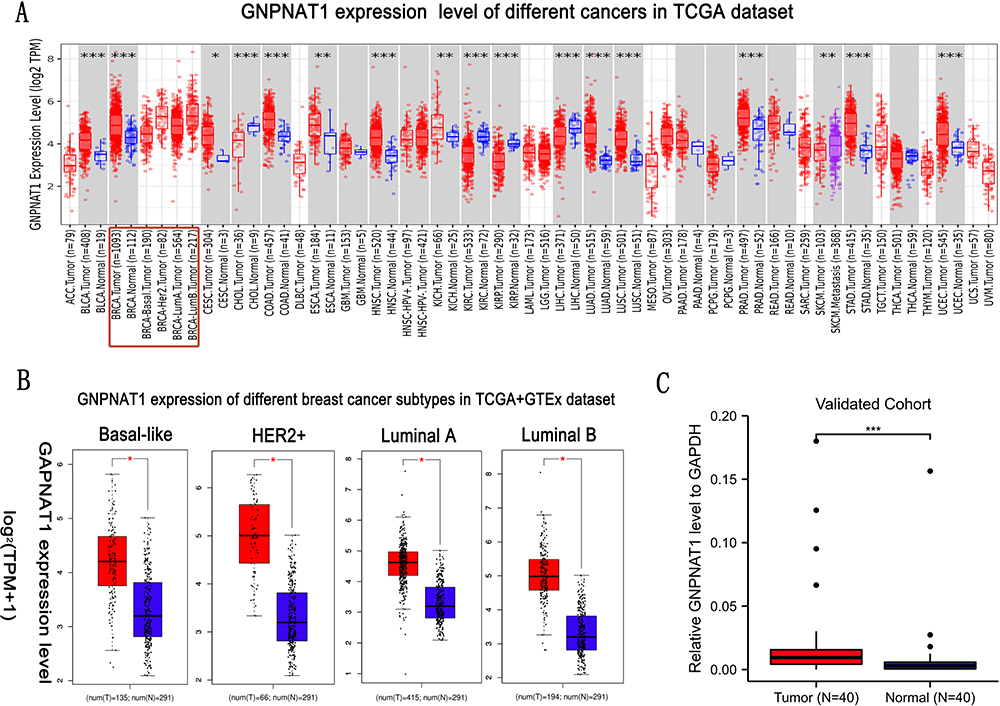 |
Figure 1 The expression level of GNPNAT1 in breast cancer. (A) The GNPNAT1 expression level of different cancers in the TCGA dataset. (B) GNPNAT1 expression of different breast cancer subtypes in TCGA+GTEx dataset. (C) GNPNAT1 expression in breast cancer invalidated cohort. *P<0.05, **p<0.01, ***p<0.001. |
The Connection Between the Expression of GNPNAT1 and Clinical Factors
To examine the part of GNPNAT1 taking in breast cancer, we analyzed the association between the expression level of GNPNAT1 and clinical factors. The whole patients were segmented into two sets (high expression group and low expression group), according to the median value. Then, we analyzed the connection between the expression of GNPNAT1 and clinical factors in the TCGA cohort by univariate logistic regression analysis and found that race (P=0.033), Menopause status (P=0.032), Histological type (P<0.001), PR status (P<0.001), ER status (P<0.001), HER2 status (P=0.001), N stage (P=0. 003), pathologic stage (P=0.025) was different in the two sets in TCGA cohort (Table 3, Figure 2). There were also several other conclusions from the univariate logistic regression analysis in the TCGA cohort as follows: Asian breast cancer patients tended to express higher expression levels of GNPNAT1 than other races; Peri-menopausal and per-menopausal patients were likely to express higher expression levels of GNPNAT1 than pre-menopausal breast cancer patients; Infiltrating ductal histological type breast cancer patients were inclined to express higher expression level of GNPNAT1 than infiltrating ductal type; Breast cancer patients whose PR, ER and HER2 status were positively expressed a higher level of GNPNAT1 than negative; Similarly, Breast cancer patients with higher N or pathological stage also express higher expression level of GNPNAT1.
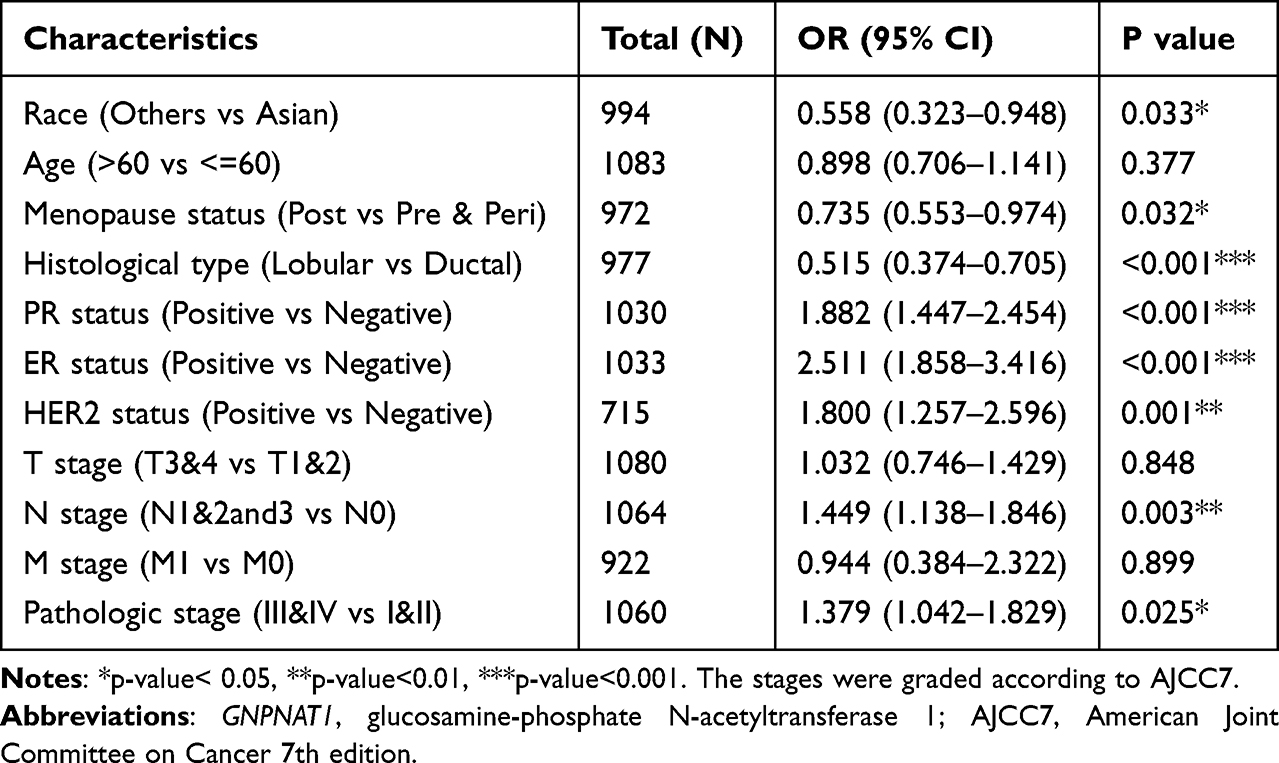 |
Table 3 The Correlation Between GNPNAT1 Expression and Clinicopathologic Factors in the TCGA Cohort |
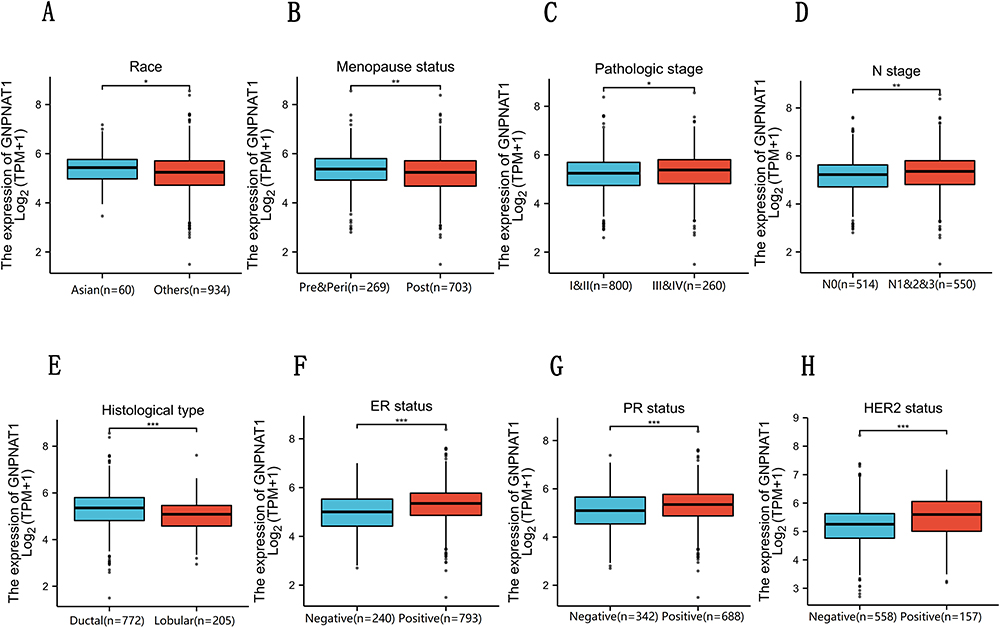 |
Figure 2 (A–H) GNPNAT1 expression level in Race, Menopause status, Pathological stage, N stage, Histological type, ER status, PR status, and HER2 status based on different clinical features. *P<0.05, **p<0.01, ***p<0.001. |
The analysis of the expression difference of GNPNAT1 expression levels in different breast cell lines also verified that the expression of GNPNAT1 in breast cancer cell lines (MDA-MB-231, MCF-7, MDA-MB-463, MDA-MB-468, BT-474, MDA-MB-453, and T47D) was higher than normal breast cell line (MCF-10A) (Figure 3A).
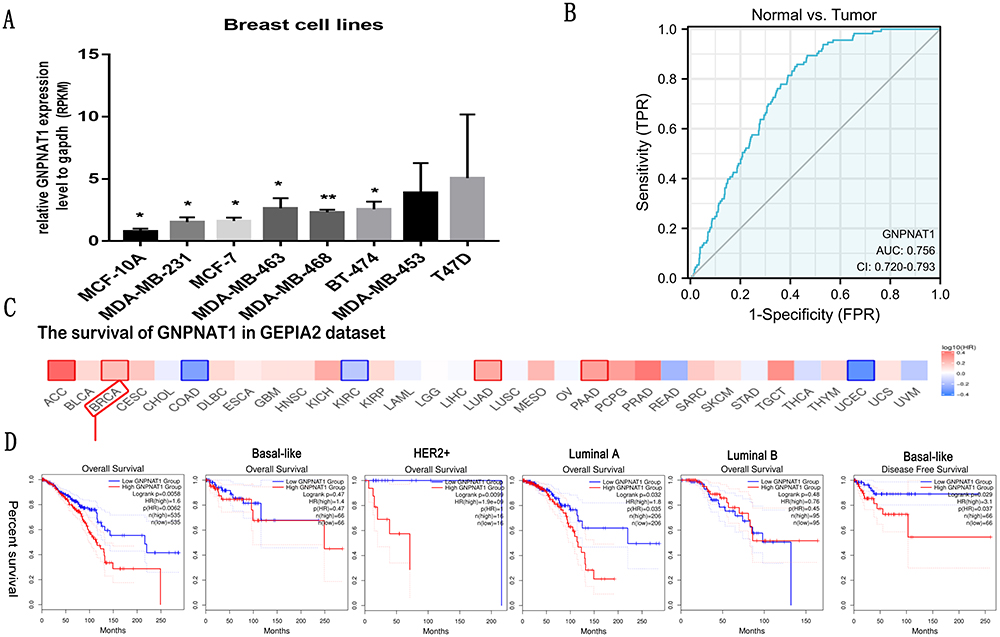 |
Figure 3 Diagnostic value of the expression of GNPNAT1 and the correlation between SND1 gene expression and the survival prognosis of cancers in TCGA. (A) The expression level of GNPNAT1 in different breast cell lines. (B) ROC curve for differentiating normal people and breast cancer patients. (C and D) The survival map (C) and survival curves (D) of GNPNAT1 in breast cancer from the GEPIA2 dataset. *P<0.05, **p<0.01. |
Diagnostic Value of the Expression of GNPNAT1 in Breast Cancer
In this study, to evaluate the diagnostic value of GNPNAT1 expression in breast cancer, a ROC curve analysis was conducted. As shown in Figure 3B, the Area Under the Curve (AUC) of GNPNAT1 was 0.756, which indicated a high diagnostic value in distinguishing tumor and normal.
The Connection Between the Expression of GNPNAT1 and Survival
To analyze the connection between GNPNAT1 and survival, a Kaplan-Meier analysis was made. Univariate Cox regression analysis for overall survival indicated that higher expression of GNPNAT1 was connected with poor overall survival (P=0.006, hazard ratio [HR]=1.57, 95% CI=1.137–2.168) (Table 4). We found that higher GNPNAT1 expression, T stage, N stage, M stage, pathologic stage, age, and menopause status were correlated with overall survival (Table 4). The univariate COX regression analysis for disease-free survival also demonstrated a similar result that higher expression of GNPNAT1 was connected with poor overall survival (P=0.042, hazard ratio [HR]=1.564, 95% CI=1.016–2.408) (Table 5). Then, to verify overexpression of GNPNAT1 was an independent risk factor for the overall survival of breast cancer patients, a multivariate analysis was made. Because the number of people whose M stage was M1 was too small to perform as an impact factor for multivariate COX regression analysis, we removed the M stage from multivariate COX regression analysis. The results of multivariate analysis for overall survival showed that high GNPNAT1 expression was an independent risk factor for overall survival of breast cancer patients (P=0.046, hazard ratio [HR]=1.422, 95% CI=1.006–2.010) (Table 6). The survival curves of GNPNAT1 in the GEPIA2 dataset also demonstrated the same result (Figure 3C and D). Subgroup analysis according to different subtypes also showed similar consequences, that HER2+ (P=0.0099) and Luminal A (P=0.032) subtypes of breast cancer patients’ overall survival time was connected with GNPNAT1 expression level. Although the basal-like subtype was not significantly associated with overall survival, it was an independent risk factor for disease-free survival of breast cancer patients (P=0.029). Therefore, we constructed a nomogram to predict the 1-year, three-year, and five-year survival probability of breast cancer patients (C-index=0.663, 95% CI=0.633–0.693) (Figure 4).
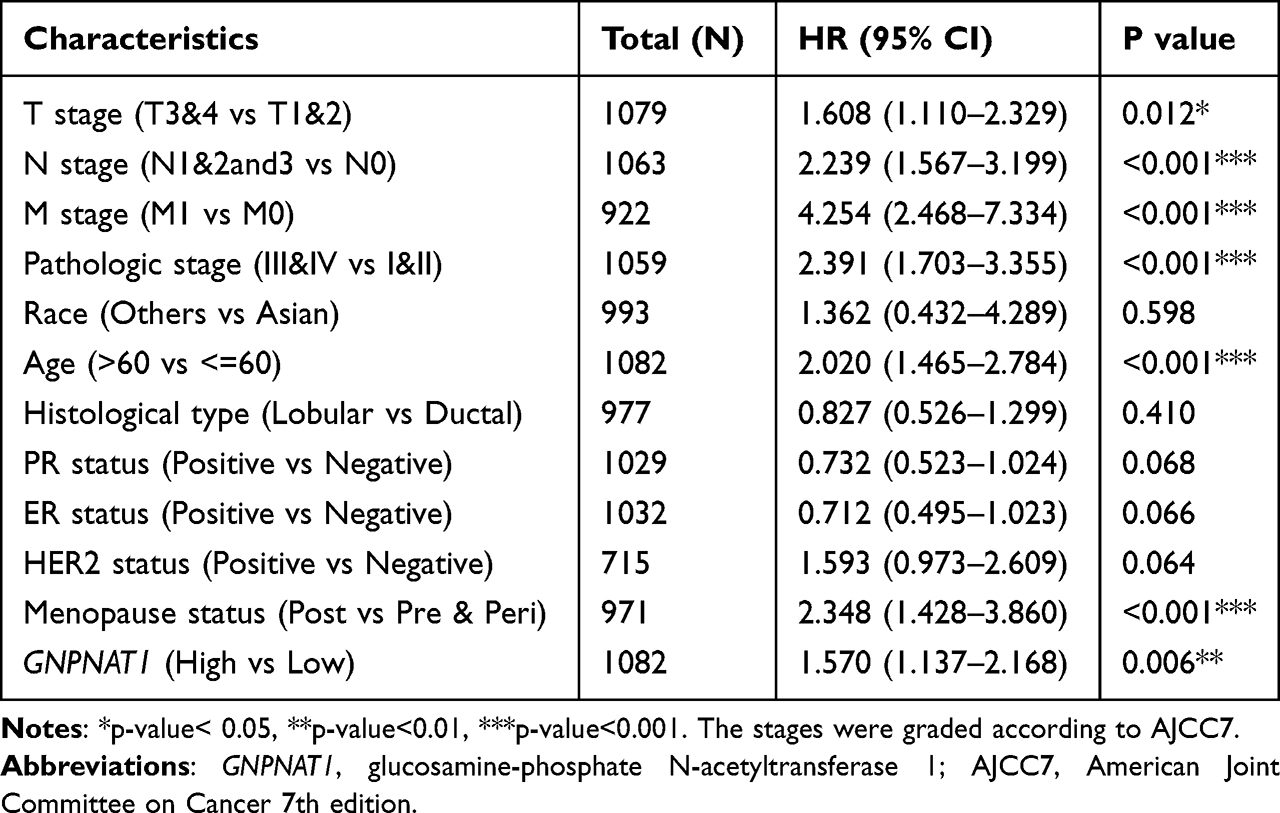 |
Table 4 Univariate COX Regression Analysis for Overall Survival in the TCGA Cohort |
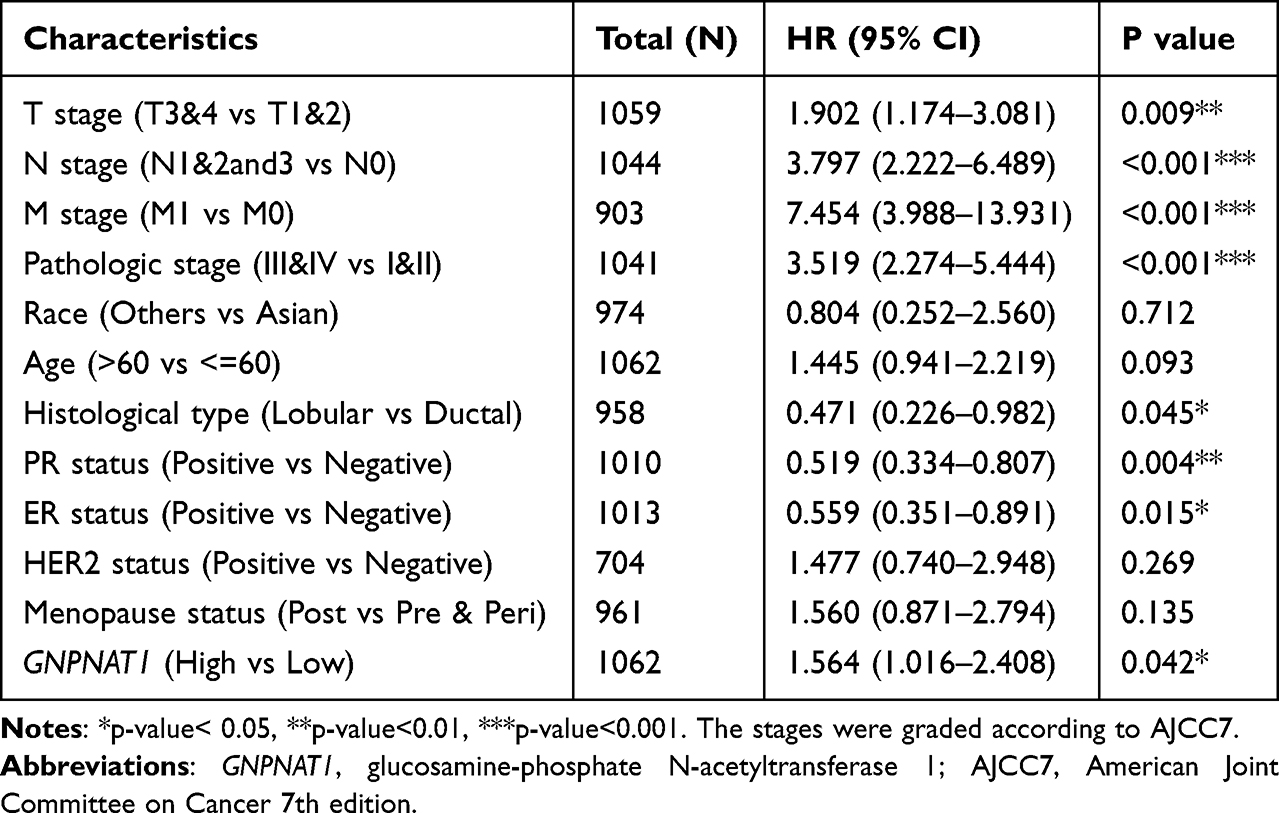 |
Table 5 Univariate COX Regression Analysis for Disease Free Survival in the TCGA Cohort |
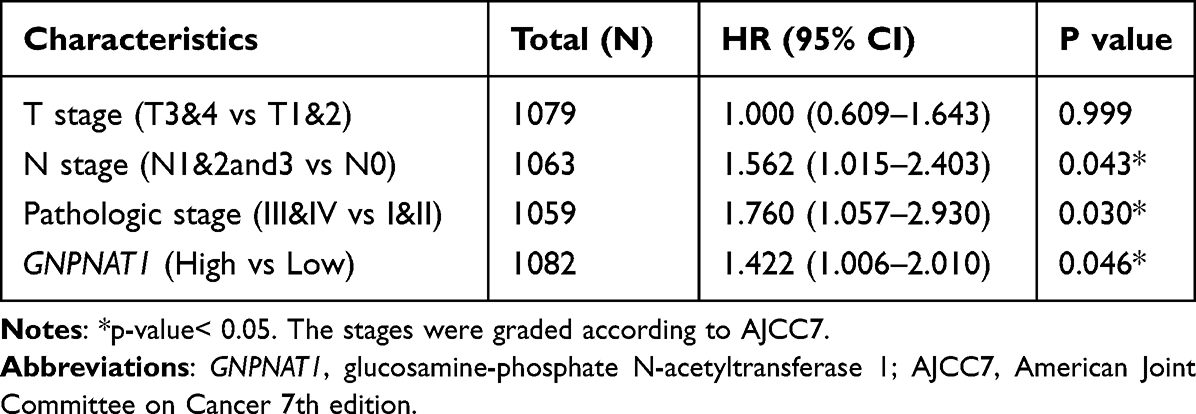 |
Table 6 Multivariate COX Regression Analysis for Overall Survival in the TCGA Cohort |
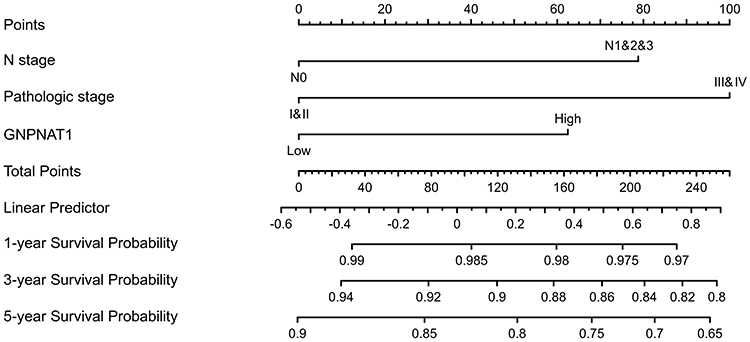 |
Figure 4 A nomogram for predicting the 1-year, 3-year, and five-year survival probability of breast cancer patients. |
Correlations Between the Expression of GNPNAT1 Expression and Immune Infiltration
As shown in Table 7 and Figure 5, in different immune cell types, TFH, Tem, aDC, NK D56bright cells, Treg, T cells, Neutrophils, Th1 cells, iDC, NK CD56dim cells, B cells, DC, NK cells, Cytotoxic cells, CD8 T cells, and pDC were negatively connected with the expression level of GNPNAT1. Eosinophils, TCM, T helper cells, and Th2 cells were prominently positively connected with the expression level of GNPNAT1.
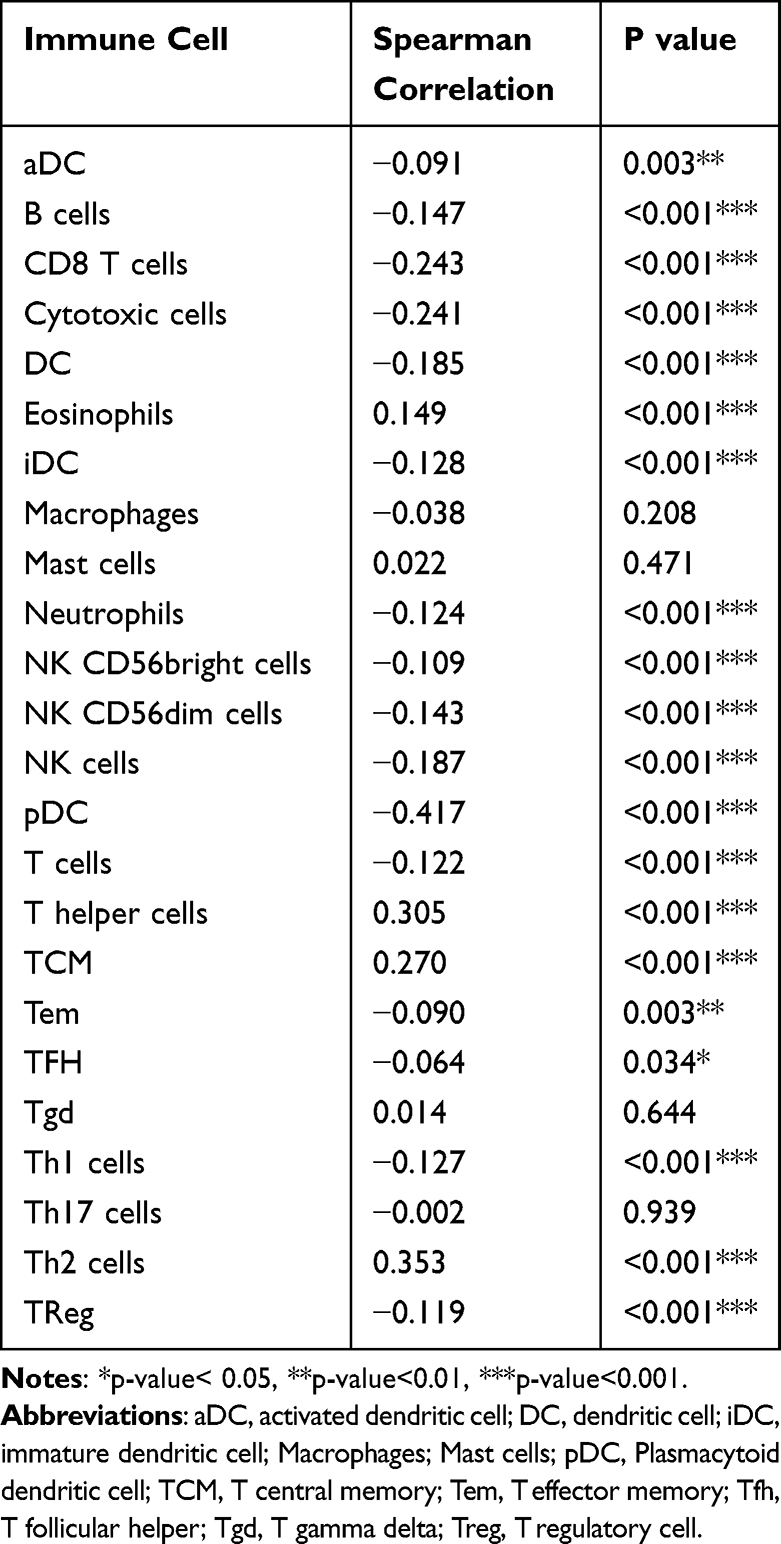 |
Table 7 Connection Between the Expression Level of GNPNAT1 and the Immune Infiltration in the Tumor Microenvironment |
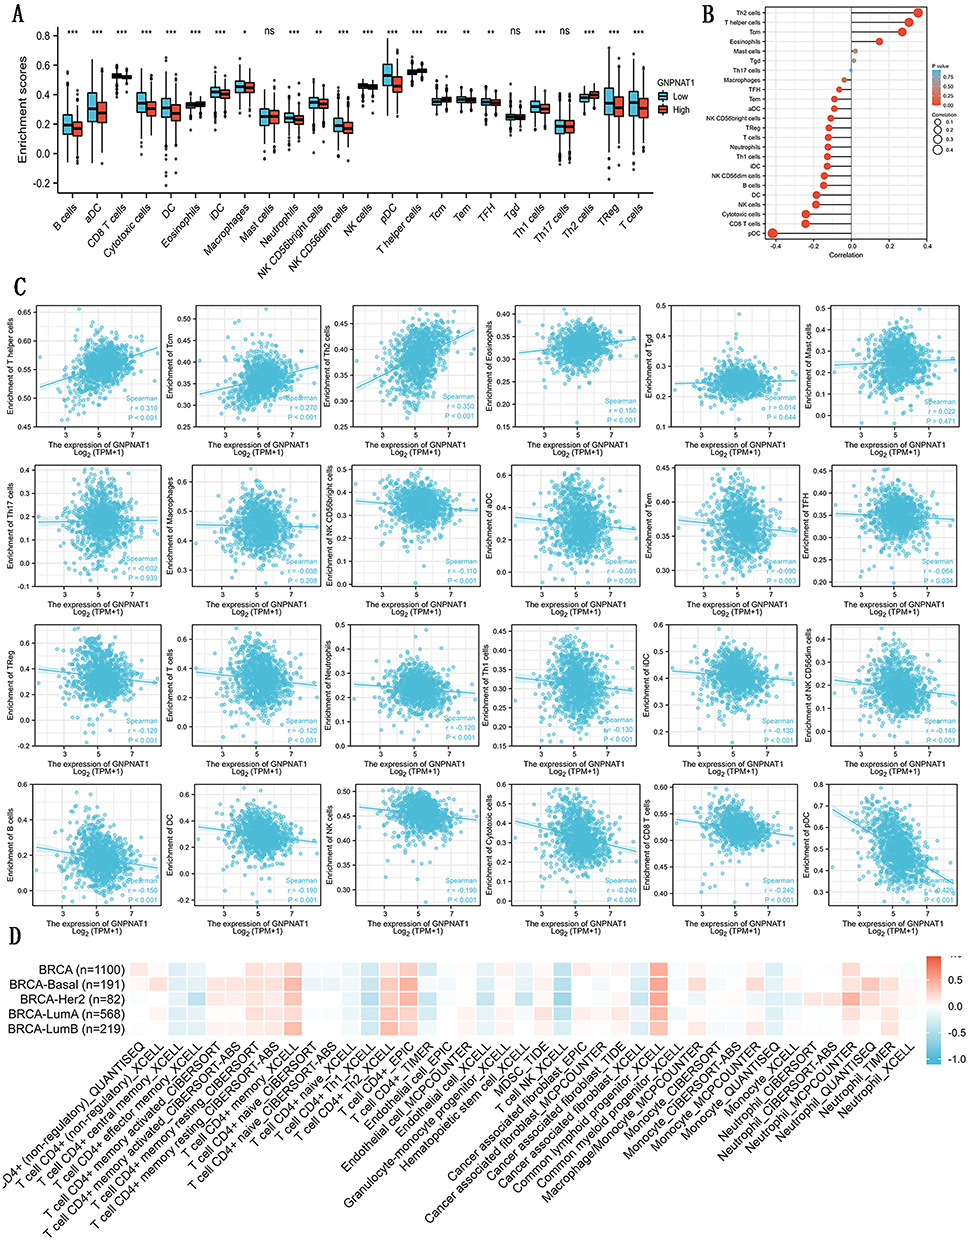 |
Figure 5 Correlations between the expression of GNPNAT1 expression and immune infiltration. (A) The bar graph is about the immune infiltration level of different immune infiltration cells. (B) The lollipop figure is about the immune infiltration level of different immune infiltration cells. (C) The scatter diagrams about the immune infiltration level of different immune infiltration cells. (D) The heatmap about the correlation between different immune infiltration cells and breast cancer. *P<0.05, **p<0.01, ***p<0.001. |
The analysis of the correlation between GNPNAT1 and some famous immune checkpoints is shown in Figure S1.
Genetic Alteration of GNPNAT1
As shown in Figures 6A and D, the most common mutation of breast cancer was amplification, while the most frequent mutations in whole tumors were amplification and mRNA high. This conclusion was confirmed by the previous results that the gene of GNPNAT1 was over-expressive in breast cancer. Figures 6B and C show the 3D structure and common mutation sites of GNPNAT1 in breast cancer.
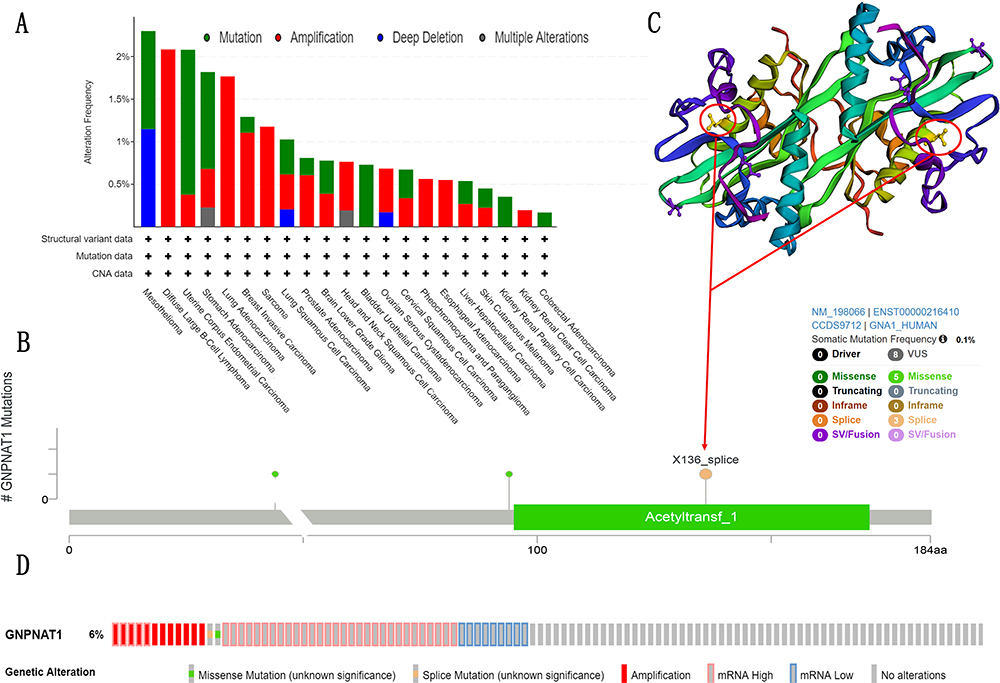 |
Figure 6 Mutation feature of GNPNAT1 in TCGA. (A) The alteration frequency GNPNAT1 with mutation type in different cancers. (B) The alteration frequency with mutation site in breast cancer. (C) The 3D structure of GNPNAT1 in breast cancers. (D) The alteration frequency GNPNAT1 with mutation type in whole cancers. |
Functional Enrichment Analysis of GNPNAT1
To further explore the carcinogenic mechanism of GNPNAT1, we downloaded the top 50 GNPNAT1-binding proteins supported by experimental evidence by using the STRING tool and the top 100 GNPNAT1-correlated genes from GEPIA2. Then, pathway enrichment analyses were done. As shown in Figure 7, PSMC6 (P<0.01, R=0.76), STYX (P<0.01, R=0.75), L2HGDH (P<0.01, R=0.74), DDHD1 (P<0.01, R=0.5) and ARF6 (P<0.01, R=0.68) had the strongest GNPNAT1-related correlation and were significantly positively connected with the expression level of GNPNAT1. The different level of GNPNAT1 total protein between normal tissue and primary tissue of breast cancer was analyzed based on the CPTAC database. We found that the level of GNPNAT1 total protein in breast tumors was higher than in normal breast tissues (Figure 8A). The basic information about these two IHC slices is listed in Table 8. The interaction network of these to the top 50 GNPNAT1-binding proteins is shown in Figure 8B. After an intersection analysis of the top 50 proteins and the top 100 genes, a common member called DLG3 was found (Figure 8C). Then, we combined these genes and proteins for the following GO and KEGG analyses. The GO enrichment analysis contained biological processes, cellular components, and molecular functions in these three major functional groups (Figure 9A). Figure 9B and C shows the GO enrichment interactive network colored by P-value and cluster-ID. Figure 9D showed the KEGG analyses, and the results revealed that GNPNAT1 and other genes being analyzed were mainly connected with viral carcinogenesis, Hippo signaling pathway, cell cycle, and oocyte meiosis in the KEGG Pathway. Besides, we used the STRING tool for the protein-protein interaction (PPI) network, the main functions contained UDP-N-acetylglucosamine metabolic process, amino sugar biosynthetic, nucleotide-sugar biosynthetic, nucleotide-sugar metabolic, amino sugar metabolic, hexose catabolic, monosaccharide catabolic process (Figure 10A). The immunohistochemistry (IHC) from the Human Protein Atlas database also verified that GNPNAT1 protein was over-expressive in breast tumors (Figure 10B).
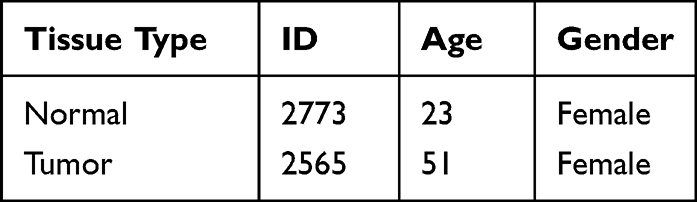 |
Table 8 The Basic Information of IHC Slice |
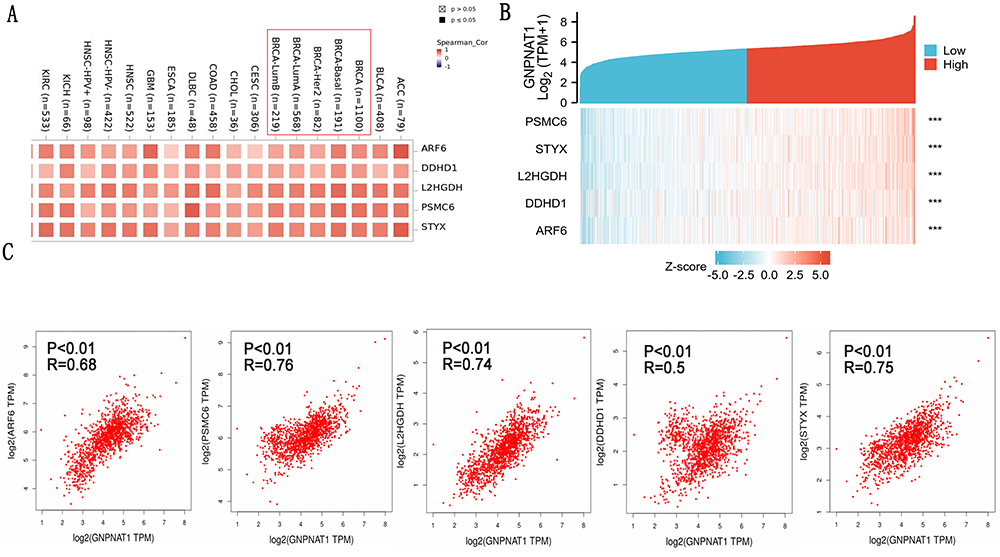 |
Figure 7 GNPNAT1-related gene enrichment analysis. (A) (B) Heat map about the top 5 GNPNAT1-related gene enrichment. (C) The scatter diagrams about the top 5 GNPNAT1-related gene enrichment. ***p<0.001. |
 |
Figure 8 GNPNAT1-binding proteins enrichment analysis. (A) The difference in GNPNAT1 total protein between breast tumor and normal breast tissues. (B) The connection net of the top 50 GNPNAT1-binding proteins. (C) A Venn diagram about intersection analysis of the top 50 proteins and the top 100 genes. |
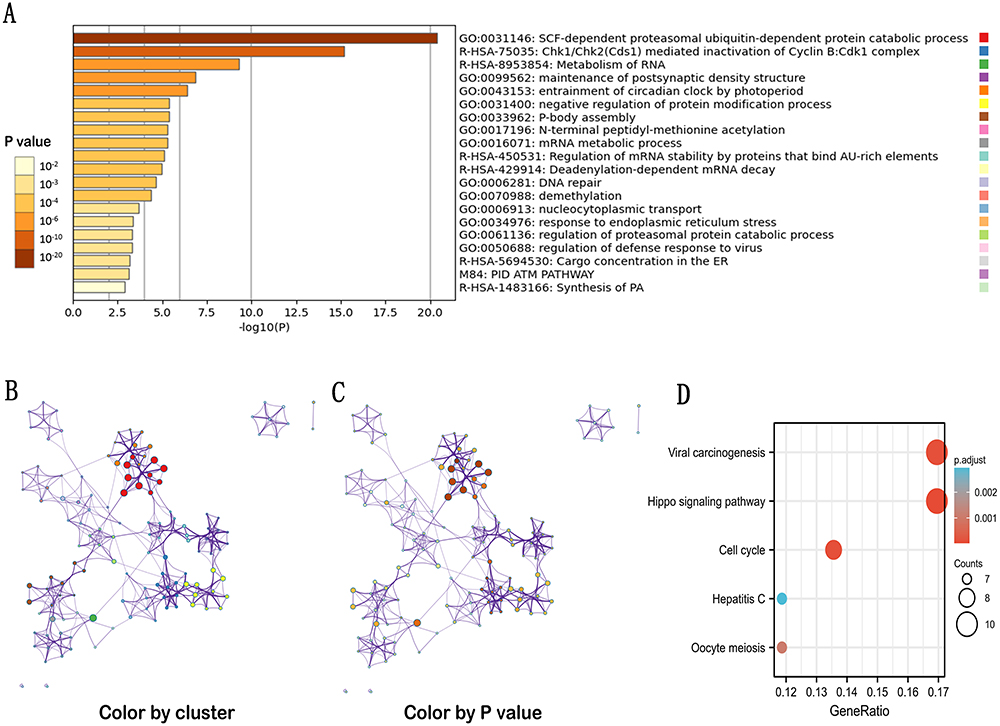 |
Figure 9 GO and KEGG enrichment analyses of GNPNAT1. (A) GO enrichment analyses of GNPNAT1. (B) GO enrichment interactive network colored by cluster-ID (C) and P-value. (D) KEGG enrichment analyses of GNPNAT1. |
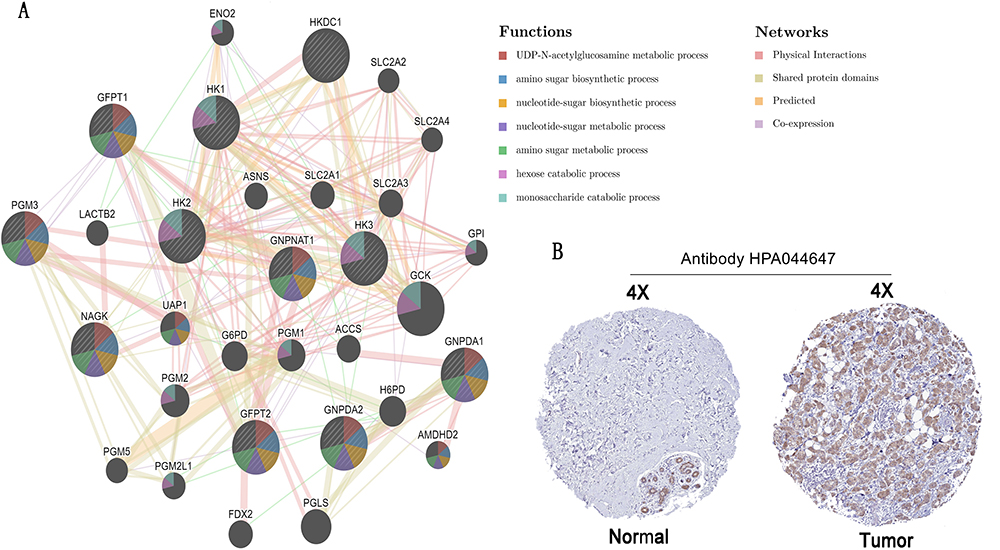 |
Figure 10 Protein–protein interaction network and IHC slices of GNPNAT1. (A) Protein-protein interaction network of GNPNAT1. (B) IHC slices of GNPNAT1. |
GNPNAT1-Related Signaling Pathways Obtained by GSEA
To identify the mainly GNPNAT1-related signaling pathways that are activated in breast cancer, a GSEA analysis was done (Figure 11). And we found several significant GNPNAT1-related signaling pathways. In this study, we drew the top four pathways, including REACTOME MITOTIC TELOPHASE CYTOKINESIS, WP OMEGA9 FA SYNTHESIS, REACTOME COHESIN LOADING CHROMATIN, and REACTOME ESTABLISHMENT OF SISTER CHROMATID COHESION.
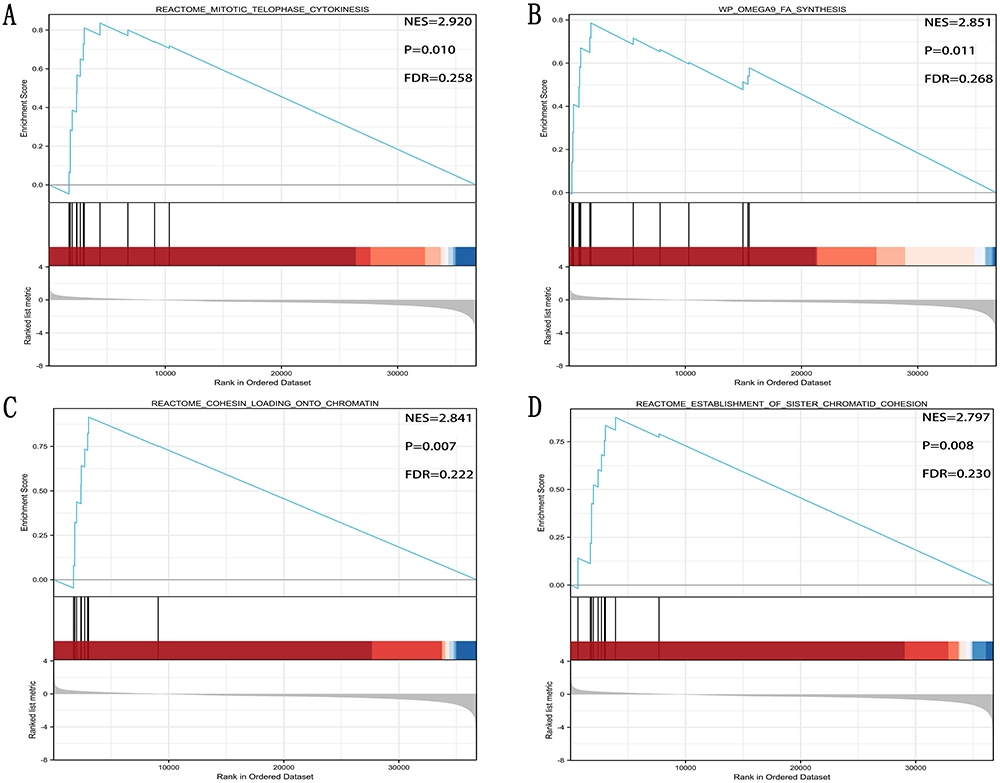 |
Figure 11 (A) Reactome mitotic telophase cytokinesis, (B) WP OMEGA9 FA synthesis, (C) Reactome cohesion loading chromatin, and (D) Reactome establishment of sister chromatid cohesion were the top four signaling pathways of GNPNAT1-related. |
Discussion
As one of the most common malignant tumors in the world, the incidence of breast cancer is gradually increasing and has become the highest incidence of female cancers.1,2 Breast cancer is a highly heterogeneous disease, exhibiting a variety of different changes in the genome, gene expression profiles, and molecular markers.4,5 The 5-year overall survival rate of early-stage breast cancer patients was more than 95%, while it was less than 40% in advanced breast cancer patients. Therefore, looking for new effective targets is very necessary for the early diagnosis and treatment of breast cancer.
GNPNAT1 plays a key role in the process of uridine diphosphate-N-acetylglucosamine biosynthesis and glucose metabolism. There were several types of research showing that GNPNAT1 was connected with the prognostic of prostate cancer and lung adenocarcinoma.9–16 In prostate cancer, GNPNAT1 was expressed higher in castration-resistant prostate cancer.9 In lung adenocarcinoma, previous studies indicated the expression level of GNPNAT1 was not only associated with the survival rate of lung adenocarcinoma but also connected to immune infiltration, including immune cells, chemokines, and immune modulators.10–16 However, GNPNAT1 had never been explored in breast cancer. These reports reminded us that GNPNAT1 might be a potential oncogene, so we assumed that GNPNAT1 might be a potential prognosis biomarker of breast cancer and might be associated with the survival rate. In this study, our guess was verified, and our results provide important first-hand information on the prognostic and therapeutic value of GNPNAT1 in breast cancer.
In this study, we found that GNPNAT1 was overexpressed in breast cancer, and it was confirmed by our own locally verified cohort. In the next clinical correlation analysis, we found higher expressions of GNPNAT1 were connected with poor survival. A nomogram was constructed to predict the 1-year, three-year, and five-year survival probability of breast cancer patients.
After GO and KEGG enrichment analysis, we identified several main terms, including viral carcinogenesis, Hippo signaling pathway, cell cycle, and oocyte meiosis. In GSEA analysis, the top four pathways of GNPNAT1 were Reactome mitotic telophase cytokinesis, wp omega-9 fa synthesis, Reactome cohesin loading chromatin, and Reactome establishment of sister chromatid cohesion. These prompted us that GNPNAT1 was connected with the defense mechanism of cells, cell proliferation, and division.17 These four pathways were all enriched in the group of high expression. REACTOME_MITOTIC_TELOPHASE_CYTOKINESIS is a pathway of cytokinesis whose activation would promote cell proliferation. It meant that the overexpression of GNPNAT1 might promote cell division. The channel of WP OMEGA9 FA SYNTHESIS could control the synthesis of omega-9. Although the function of omega-9 is still unknown in breast cancer. But there were, several reports showed that the tumor cells might acquire energy through fatty acid metabolic pathways rather than glucose metabolic pathways.18,19 So, the channel of WP OMEGA9 FA SYNTHESIS might connect with the occurrence of breast tumors. As to REACTOME COHESIN LOADING CHROMATIN and REACTOME ESTABLISHMENT OF SISTER CHROMATID COHESION, the acceleration of chromatin also would promote the proliferation of breast cancer. These four pathways of GSEA analysis further verified our hypothesis that GNPNAT1 was a cancer-promoting gene. Cancer-promoting genes usually promote cell proliferation and division. Therefore, it was further confirmed that GNPNAT1 might be a potential oncogene.
Immunization therapy is an important, newly developing emerging therapeutic method for breast cancer. The understanding of immunization infiltration is vital for the development of immunization therapy in breast cancer.20,21 The higher infiltration levels of B cells and T cells often predict a better prognosis of survival in breast cancer.22 NK cells can kill the target cells to play their immune role by activating caspase-independent pyroptosis.23 GNPNAT1 might serve as a diagnostic and prognostic biomarker and a novel target for intervention in BRCA patients in the future.24 In this study, we found that the expression level of GNPNAT1 was connected with the level of immunization infiltration. TFH, Tem, aDC, NK D56bright cells, Treg, T cells, Neutrophils, Th1 cells, iDC, NK CD56dim cells, B cells, DC, NK cells, Cytotoxic cells, CD8 T cells, and pDC, were negatively connected with the expression level of GNPNAT1. Eosinophils, TCM, T helper cells, and Th2 cells were prominently positively connected with the expression level of GNPNAT1. In the total 24 subtypes of immunization infiltration cells, high GNPNAT1 was negatively connected with 16 immunization infiltration cell types and positively connected with 4 immunization infiltration cell types. We could conclude that the expression level was connected with immunization infiltration, and high expression of GNPNAT1 predicted poor survival in breast cancer.
This study explored the connection between GNPNAT1 and breast cancer and could guide future fundamental experiments. However, there were several disadvantages to this study. Firstly, the main data were downloaded from a public database, so we could not confirm the authenticity and accuracy of the information. Secondly, the number of patients in the local verified cohort was too small; more cases are required to provide more strict results. Lastly, the mechanism of how GNPNAT1 promotes the occurrence and development of breast cancer needed further experiences in vivo and in vitro to verify. To further investigate the potential mechanism of GNPNAT1’s action in breast cancer, we plan to do future fundamental experiments before long.
Conclusion
As a whole, our results indicated that GNPNAT1 was up-regulation in primary breast cancer tumors and higher expression of GNPNAT1 was connected with poor survival in breast cancer Immunization infiltration analysis showed that high GNPNAT1 was negatively connected with 16 immunization infiltration cell types and positively connected with four immunization infiltration cell types. This study showed that GNPNAT1 might be a probable biomarker for diagnosis and prognosis in breast cancer and provide guidance for future fundamental experiments.
Data Sharing Statement
The datasets used and/or analyzed during the current study are available from the corresponding author Yuying Zhou upon reasonable request.
Ethics Approval and Consent to Participate
This study was approved by the Human Research Ethics Committee of the First Affiliated Hospital of Wenzhou Medical University, Wenzhou, China, and complied with the tenets of the Declaration of Helsinki. The ethical approval code is No. 2012-57. Each patient provided written informed consent before being enrolled in the study.
Consent for Publication
The patients issued Written informed consent for the publication of this research and accompanying images. A copy of the written consent is ready for review by the Editor in Chief of this journal.
Acknowledgments
The authors would like to thank all the Department of Breast Surgery doctors at the First Affiliated Hospital of Wenzhou Medical University (Wenzhou, China).
Author Contributions
All authors made a significant contribution to the work reported, whether that is in the conception, study design, execution, acquisition of data, analysis, and interpretation, or all these areas; took part in drafting, revising, or critically reviewing the article; giving final approval of the version to be published; agreeing on the journal to which the article has been submitted; and agree to be accountable for all aspects of the work.
Funding
The authors received no financial support for the research, authorship, and/or publication of this article.
Disclosure
The authors declared no potential conflicts of interest concerning the research, authorship, and/or publication of this article.
References
1. Siegel RL, Miller KD, Fuchs HE, Jemal A. Cancer statistics, 2021. Ca a Cancer J Clin. 2021;71(1):7–33.
2. Sung H, Ferlay J, Siegel RL, et al. Global Cancer Statistics 2020: GLOBOCAN estimates of incidence and mortality worldwide for 36 cancers in 185 countries. Ca a Cancer J Clin. 2021;71(3):209–249. doi:10.3322/caac.21660
3. Polyak K. Breast cancer: origins and evolution. J Clin Invest. 2007;117(11):3155–3163. doi:10.1172/JCI33295
4. Bhandari A, Zheng C, Sindan N, et al. COPB2 is up-regulated in breast cancer and plays a vital role in the metastasis via N-cadherin and Vimentin. J Cell Mol Med. 2019;23(8):5235–5245. doi:10.1111/jcmm.14398
5. Guan Y, Bhandari A, Xia E, et al. lncRNA FOXD3-AS1 is associated with clinical progression and regulates cell migration and invasion in breast cancer. Cell Biochem Funct. 2019;37(4):239–244. doi:10.1002/cbf.3393
6. Howlader N, Altekruse SF, Li CI, et al. US incidence of breast cancer subtypes defined by joint hormone receptor and HER2 status. J National Cancer Inst. 2014;106(5). doi:10.1093/jnci/dju055
7. Waks AG, Winer EP. Breast cancer treatment: a review. JAMA. 2019;321(3):288–300. doi:10.1001/jama.2018.19323
8. Noone AM, Howlader N, Krapcho M, et al. SEER cancer statistics review, 1975–2015, National Cancer Institute, Bethesda, MD. Based on November 2017 SEER data submission, posted to the SEER web site; 2018. Available from: https://seer.cancer.gov/csr/1975_2015/.
9. Kaushik AK, Shojaie A, Panzitt K, et al. Inhibition of the hexosamine biosynthetic pathway promotes castration-resistant prostate cancer. Nat Commun. 2016;7(1):11612. doi:10.1038/ncomms11612
10. Zhang S, Zhang H, Li H, et al. Potential role of glucosamine-phosphate N-acetyltransferase 1 in the development of lung adenocarcinoma. Aging. 2021;13(5):7430–7453. doi:10.18632/aging.202604
11. Zheng X, Li Y, Ma C, et al. Independent prognostic potential of GNPNAT1 in lung adenocarcinoma. Biomed Res Int. 2020;2020:8851437. doi:10.1155/2020/8851437
12. Wang Z, Embaye KS, Yang Q, et al. Establishment and validation of a prognostic signature for lung adenocarcinoma based on metabolism-related genes. Can Cell Inter. 2021;21(1):219. doi:10.1186/s12935-021-01915-x
13. Liu W, Jiang K, Wang J, et al. Upregulation of GNPNAT1 predicts poor prognosis and correlates with immune infiltration in lung adenocarcinoma. Front Mol Biosci. 2021;8:605754. doi:10.3389/fmolb.2021.605754
14. Yu X, Zhang X, Zhang Y. Identification of a 5-gene metabolic signature for predicting prognosis based on an integrated analysis of tumor microenvironment in lung adenocarcinoma. J Oncol. 2020;2020:5310793. doi:10.1155/2020/5310793
15. Zhang J, Zhang J, Yuan C, et al. Establishment of the prognostic index reflecting tumor immune microenvironment of lung adenocarcinoma based on metabolism-related genes. J Cancer. 2020;11(24):7101–7115. doi:10.7150/jca.49266
16. Zhu P, Gu S, Huang H, et al. Upregulation of glucosamine-phosphate N-acetyltransferase 1 is a promising diagnostic and predictive indicator for poor survival in patients with lung adenocarcinoma. Oncol Lett. 2021;21(6):488. doi:10.3892/ol.2021.12750
17. Shi Q, Li Y, Li S, et al. LncRNA DILA1 inhibits Cyclin D1 degradation and contributes to tamoxifen resistance in breast cancer. Nat Commun. 2020;11(1):5513. doi:10.1038/s41467-020-19349-w
18. Oren Y, Tsabar M, Cuoco MS, et al. Cycling cancer persister cells arise from lineages with distinct programs. Nature. 2021;596(7873):576–582. doi:10.1038/s41586-021-03796-6
19. Hoy AJ, Nagarajan SR, Butler LM. Tumour fatty acid metabolism in the context of therapy resistance and obesity. Nat Rev Cancer. 2021;21(12):753–766.
20. Savas P, Virassamy B, Ye C, et al. Single-cell profiling of breast cancer T cells reveals a tissue-resident memory subset associated with improved prognosis. Nature Med. 2018;24(7):986–993. doi:10.1038/s41591-018-0078-7
21. Byrne A, Savas P, Sant S, et al. Tissue-resident memory T cells in breast cancer control and immunotherapy responses. Nat Rev Clin Oncol. 2020;17(6):341–348. doi:10.1038/s41571-020-0333-y
22. Stanton SE, Disis ML. Clinical significance of tumor-infiltrating lymphocytes in breast cancer. J Immuno Ther Cancer. 2016;4(1):59. doi:10.1186/s40425-016-0165-6
23. Zhang Z, Zhang Y, Xia S, et al. Gasdermin E suppresses tumour growth by activating anti-tumour immunity. Nature. 2020;579(7799):415–420. doi:10.1038/s41586-020-2071-9
24. Yuan R, Zhang Y, Wang Y, et al. GNPNAT1 is a potential biomarker correlated with immune infiltration and immunotherapy outcome in breast cancer. Front Immunol. 2023;14:1152678. doi:10.3389/fimmu.2023.1152678
 © 2024 The Author(s). This work is published and licensed by Dove Medical Press Limited. The full terms of this license are available at https://www.dovepress.com/terms.php and incorporate the Creative Commons Attribution - Non Commercial (unported, v3.0) License.
By accessing the work you hereby accept the Terms. Non-commercial uses of the work are permitted without any further permission from Dove Medical Press Limited, provided the work is properly attributed. For permission for commercial use of this work, please see paragraphs 4.2 and 5 of our Terms.
© 2024 The Author(s). This work is published and licensed by Dove Medical Press Limited. The full terms of this license are available at https://www.dovepress.com/terms.php and incorporate the Creative Commons Attribution - Non Commercial (unported, v3.0) License.
By accessing the work you hereby accept the Terms. Non-commercial uses of the work are permitted without any further permission from Dove Medical Press Limited, provided the work is properly attributed. For permission for commercial use of this work, please see paragraphs 4.2 and 5 of our Terms.