")
Back to Journals » Eye and Brain » Volume 14
Eye Movement Abnormalities in Glaucoma Patients: A Review
Authors McDonald MA , Stevenson CH, Kersten HM, Danesh-Meyer HV
Received 11 February 2022
Accepted for publication 9 July 2022
Published 8 September 2022 Volume 2022:14 Pages 83—114
DOI https://doi.org/10.2147/EB.S361946
Checked for plagiarism Yes
Review by Single anonymous peer review
Peer reviewer comments 5
Editor who approved publication: Professor Margaret Wong-Riley
Matthew A McDonald,1 Clark H Stevenson,1 Hannah M Kersten,2,3 Helen V Danesh-Meyer1,3
1Department of Ophthalmology, University of Auckland, Auckland, New Zealand; 2School of Optometry and Vision Science, University of Auckland, Auckland, New Zealand; 3Eye Institute, Auckland, New Zealand
Correspondence: Matthew A McDonald, 123 Remuera Road, Auckland, New Zealand, Tel +64-(0)27-492-1808, Email [email protected]
Abstract: Glaucoma is a common condition that relies on careful clinical assessment to diagnose and determine disease progression. There is growing evidence that glaucoma is associated not only with loss of retinal ganglion cells but also with degeneration of cortical and subcortical brain structures associated with vision and eye movements. The effect of glaucoma pathophysiology on eye movements is not well understood. In this review, we examine the evidence surrounding altered eye movements in glaucoma patients compared to healthy controls, with a focus on quantitative eye tracking studies measuring saccades, fixation, and optokinetic nystagmus in a range of visual tasks. The evidence suggests that glaucoma patients have alterations in several eye movement domains. Patients exhibit longer saccade latencies, which worsen with increasing glaucoma severity. Other saccadic abnormalities include lower saccade amplitude and velocity, and difficulty inhibiting reflexive saccades. Fixation is pathologically altered in glaucoma with reduced stability. Optokinetic nystagmus measures have also been shown to be abnormal. Complex visual tasks (eg reading, driving, and navigating obstacles), integrate these eye movements and result in behavioral adaptations. The review concludes with a summary of the evidence and recommendations for future research in this emerging field.
Keywords: eye movements, eye tracking, glaucoma, optokinetic nystagmus, saccades, driving
Introduction
Glaucoma is a multifactorial, progressive optic neuropathy in which the primary site of damage is the retinal ganglion cell (RGC).1 Loss of RGC axons has recognized implications for visual function, including impairment in peripheral vision and contrast sensitivity, which leads to difficulty with daily activities, such as reading, walking, and driving.2–4 There are three recognized RGC pathways within the central nervous system – the magnocellular (M) pathway, carrying information on visual motion; the parvocellular (P) pathway, carrying red/green color opponent signals; and the koniocellular (K) pathway, carrying blue/yellow color opponent signals.5 Around 90% of RGC axons project to the lateral geniculate nucleus (LGN) in the thalamus, which is a relay station for visual information projecting to the visual cortex.6 The remaining 10% of RGC axons project to brainstem structures, such as the Edinger-Westphal nucleus (via interneurons) and the superior colliculus (SC).7 The anatomy of the visual system contains only one synapse between the optic nerve and visual cortex: the LGN, where axons from the optic tract terminate. In glaucoma, anterograde (Wallerian) degeneration results in atrophy of the optic nerve chiasm and the optic tract which is also generalizable to other optic neuropathies.8–10 Trans-synaptic anterograde degeneration leads to further changes in the LGN, affecting the respective layers of RGC components (eg M-, P-, and K-layers) (Figures 1 and 2).1,11,12 This may also extend to the visual cortex across two synapses, known as dysynaptic degeneration, which correlate to the retinotopic locus and degree of optic nerve damage.13 However, it is less understood as to whether or not these changes are confined to the visual system or spread to other areas.
 |
Figure 1 Schematic representation of trans-synaptic degeneration. Retinal ganglion cell atrophy leads to anterograde trans-synaptic degeneration along the optic nerve, optic tract, LGN, and optic radiation. Emerging theories suggest degeneration beyond these pathways, but this remains controversial. |
 |
Figure 2 Schematic representation of trans-synaptic degeneration on a cellular scale. |
Traditional theories of glaucoma pathogenesis involve retinal ganglion cell death from axonal injury at the lamina cribrosa as a result of high intraocular pressures. However, this does not explain disease progression in normal-tension glaucoma (NTG). Glaucoma patients have lower intracranial pressure,14–16 which suggests an altered trans-lamina cribrosa pressure gradient between the intraocular compartment and retrobulbar CSF compartment in the optic nerve sheath.17 Emerging theories suggest that glaucoma is a neurodegenerative disease caused by glymphatic system dysfunction, which is responsible for the production and clearance of neurotoxic waste products (eg amyloid-β).18–20 A review by Lawlor et al highlight the controversies in the glaucoma literature surrounding neurological changes outside of the primary visual pathways.8 Early studies have evaluated cerebrovascular changes (eg heightened cerebral ischaemia) in glaucoma with varied results that have not been replicated.21,22 Likewise, structural MRI techniques have suggested regional gray and white matter changes (outside the visual cortex) in glaucoma patients, but these are generally poorly designed (in both methodology and analysis) and not hypothesis-driven, which lose significance after correcting for multiple comparisons.23–25 However, more recent studies have re-examined this hypothesis with larger cohorts and multimodal MRI analysis (eg diffusion and functional MRI methods). Giorgio et al compared 34 glaucoma patients (17 POAG, 17 NTG) to 29 normal controls (age-similar with no differences in white matter hyperintensities).26 Their results indicated that in addition to traditional visual pathways, glaucoma patients demonstrated white matter alterations to the superior longitudinal facisculus, fronto-opercular cortex, parietal aspect of the precuneus, and the superior parietal lobe which are higher cortical areas associated with vision and cognition. There were also differences in the splenium of the corpus callosum, parahippocampus, uncinate fasciculus, thalamus, corticospinal tract, and anterior thalamic radiation. In addition, lower volumes of global gray matter volume were found. Functional MRI demonstrated increased functional connectivity in the visual-attention network around the frontal pole and inferior frontal gyrus which was considered to be due to a compensatory mechanism for a reduction in primary visual pathways. Hanekamp et al explored whether decreased visual pathway input explains neurodegeneration, or whether glaucoma has a unique pattern of neurodegeneration.27 Two separate glaucoma datasets (47 total patients) were compared to 14 patients with monocular vision loss (no perception of light for 5 years or more) and 41 healthy participants (all groups were age-similar). Glaucoma patients showed marked changes in the early visual pathways (more pronounced than monocular vision loss), in addition to alterations in motor- and cognition-related tracts, favoring the network degeneration hypothesis. However, this area remains in its infancy and requires further studies to replicate these results.
The foveated visual system requires input from multiple brain areas to locate salient visual information and inhibit gaze to distractors. While the superficial layers of the SC process visual inputs from the retina and visual cortex, the intermediate layers receive input from both cortical and subcortical regions, such as the frontal cortex, lateral intraparietal area, and basal ganglia which integrate visual, cognitive, and motor signals to form a hierarchy of target salience in everyday visual function.28 The frontal eye field (FEF) and basal ganglia (specifically, the substantia nigra pars reticulate and caudate nucleus circuit) are involved in suppressing distractors, directly controlling which ‘targets’ are chosen and which ones are suppressed.29–31 After target selection, Purkinje cells in the oculomotor vermis of the cerebellum modulate the duration and velocity of saccades which are required for saccade accuracy.32–34 Saccade velocity also relies on communication through white matter tracts connecting the FEF, supplementary eye field (SEF), and dorsal striatum, with inhibitory control mediated through connections between the dorsal striatum, SEF, and inferior frontal cortex (IFC), as well as between SEF and IFC.35 Anticipatory control of eye movement (pre-planned motor commands expecting a target to appear) involves the prefrontal, pre-supplementary motor, anterior cingulate, hippocampus, thalamus, striatum, and cerebellar regions, whereas reflexive control, such as during visually guided saccade tasks, involves the cortical eye fields and occipital cortex to a greater extent.36 More complex tasks (eg memory-guided saccades, anti-saccades, or reading) recruit areas involved in cognition such as the frontostriatal loop (dorsolateral prefrontal cortex, caudate nucleus, and thalamus).37 Likewise, reward-based tasks result in longer-latency saccades, guided by “top-down” cortical input from the FEF and parietal eye fields as opposed to “bottom-up” ocular motor commands seen in simple reflexive saccades.29,34,38,39 These pathways exemplify the complexity and importance of communication between these areas. However, the hierarchy of network organization between these gray matter areas and white matter tracts during eye movement tasks, in addition to the extent of recruitment, remains largely unknown. For an in-depth review of the dynamic control of eye movements and the influence of cognition, the authors refer to Wolf et al review of this area.40
The final common output of motor commands involves cranial nerves (CN) III, IV, and VI (Figure 3). In glaucoma, reduced visual perception through RGC loss and visual processing leads to difficulties in executing the efferent control of eye movement. Behavioral adaptations, such as increasing the number of fixations and saccades during a reading task due to an inferior visual field defect, may also affect the interpretation of altered eye movements in glaucoma. Confounding aspects of neurodegeneration may also play a role, but this remains controversial.
 |
Figure 3 Efferent control of eye movement. (A) anterior (B) axial and (C) sagittal views of the anatomical origins of cranial nerves III, IV, and VI. |
The effect of glaucoma on eye movements is currently not well characterized. However, the advent of portable, affordable, and reliable eye tracking systems has enabled researchers to study eye movement quickly and non-invasively.41–43 This review will summarize the current literature on eye movements in glaucoma. Understanding ocular motor changes in glaucoma may increase our understanding of its pathophysiology and rationalize functional impairment that is not detected by current clinical tests (eg standard automated perimetry).
Which Eye Movements Have Been Studied in Glaucoma?
Eye movements can be broadly split into saccades and fixations. Saccades are used to quickly direct gaze to the target of interest and fixations enable high-acuity viewing of the target to extract visual information. Fixations can either be static (for a stationary target) or smooth pursuits (for a moving target). Optokinetic nystagmus (OKN) is a combination eye movement that incorporates both smooth pursuit and saccade movements.
Saccades
A saccade is a fast, conjugate eye movement that redirects eye position so that light from visual targets falls on the fovea.44 Saccades can be generated voluntarily (to existing or memorized targets), reflexively (eg to a target suddenly appearing in the visual or auditory field), or spontaneously.44 They are the fastest eye movements, occurring over time frames of tens of milliseconds and can reach velocities of up to 500 degrees per second.44 Anti-saccades require a participant to look in the opposite direction to a presented stimulus (Figure 4). These tasks are more cognitively demanding than standard saccades because they require inhibition of a reflexive saccade to the target.29 Anti-saccades are commonly used to explore reflexive decision-making in disorders, such as neurodegenerative disease and multiple sclerosis.45,46
 |
Figure 4 Depiction of a prosacadde, anti-saccade, and fixation task. |
Saccade generation involves cortical structures (primary visual, extrastriate, and parietal cortices, as well as the FEF and SEF for target selection) and subcortical structures (striatum, thalamus, SC, and cerebellar vermis for coordination).47 The retino-tectal pathway is particularly important in terms of eye movement in glaucoma because it receives information directly from the retina (via approximately 10% of RGC axons), remains under cortical and subcortical control, and projects to brainstem structures involved in ocular motor control (eg SC).48 The SC is the gatekeeper for saccadic generation and receives inputs from the extrastriate cortex.49,50 Its role in target selection has been exemplified in models of “blind sight” where primary visual cortex (V1) lesions do not disable patients’ saccades to their blind hemifield.51–54 SC input to the LGN plays a key role in the possible involvement of an SC-pulvinar pathway to residual vision in models of V1-obliteration.55 Therefore, the SC-pulvinar and SC-LGN pathways lend additional input to saccade preparation in response to visual stimuli (ie target selection). Additionally, the SC-LGN pathway has been shown to survive transneuronal retrograde degeneration following V1 lesions (although not a glaucoma model).56 The existence of an SC-pulvinar-V5/MT pathway has also been suggested,57,58 as well as direct projections of the LGN to V5/MT.59,60 Therefore, the SC is proposed to take over V1ʹs role via the pulvinar or LGN in these cases. However, there is no direct evidence of how this system functions in human models and, in particular, glaucoma patients. The authors direct readers to Findlay et al for a description of the levels of input required for saccade target selection.61
In glaucoma, several studies measured saccades through isolated reflexive and anti-saccade tasks which are summarized in Table 1.62–67 Reflexive saccades are tested by asking participants to initially look at a central fixation target. The fixation target is extinguished after a short period of time and a target is presented within a certain number of visual angles peripheral to fixation (eg 7, 10, 20 degrees). Participants are asked to look at the peripheral target immediately, and then back to the central fixation target when it reappears. All studies used this technique or a variation thereof. Variations included a moving peripheral target (appearing at speeds of 2–10°/s) as well as a static target,64 and an anti-saccade task.66
Following these tasks, several different parameters are analyzed: saccade latency (reaction time), duration, velocity (average and maximum), and accuracy (gain/amplitude). Saccade latency is the time from presentation of the stimulus to initiation of the saccade. Typically, this is affected by age, target intensity (decreased contrast leads to increased latency), and eccentricity (degrees from fixation).68,69 For example, Mazumdar et al showed that, in a healthy cohort, saccade latencies were 40% delayed in patients >60 years compared to younger counterparts, and that latencies across all groups increased with degrees from fixation (up to 27 degrees).70 Nasal and temporal fields were not significantly different, but superior fields showed decreased latency compared to inferior which was attributed to the related cone and ganglion cell density.71 This effect is well known in ocular motor physiology. The rod-free fovea is also prone to increasing saccade latencies in mesopic (dim-light) conditions. In glaucoma, this effect is amplified: latency was 2.9–38.5% longer in glaucoma patients than controls in all studies.62–67 This significant range is related to age-related differences,70,72,73 glaucoma severity,67 direction of saccade,7,70 and target size.70,74
Latency was prolonged in both perimetric glaucoma (patients with a visual field defect) and pre-perimetric glaucoma (patients with clinical evidence of glaucomatous optic neuropathy but without a detectable visual field defect) when performing a saccade to a moving target.64 Figure 5 provides a forest plot of cohort-wide effect sizes in saccade latency. There was a trend towards longer latency in more severe glaucoma.65,67 Thepass et al supported this finding and proposed that saccade latency may serve as a useful marker of glaucoma progression prior to field loss.75 There was also a longer latency from stimulus presentation to peak saccade velocity in glaucoma patients.64 A more pronounced increase in latency (compared to controls) occurred with a decrease in luminance which was also illustrated by Tatham’s group.67 Najjar et al66 anti-saccade task (16 glaucoma patients and 16 controls) found an increase in errors during this task, which is known to recruit frontal brain regions and test attention/cognition.76,77
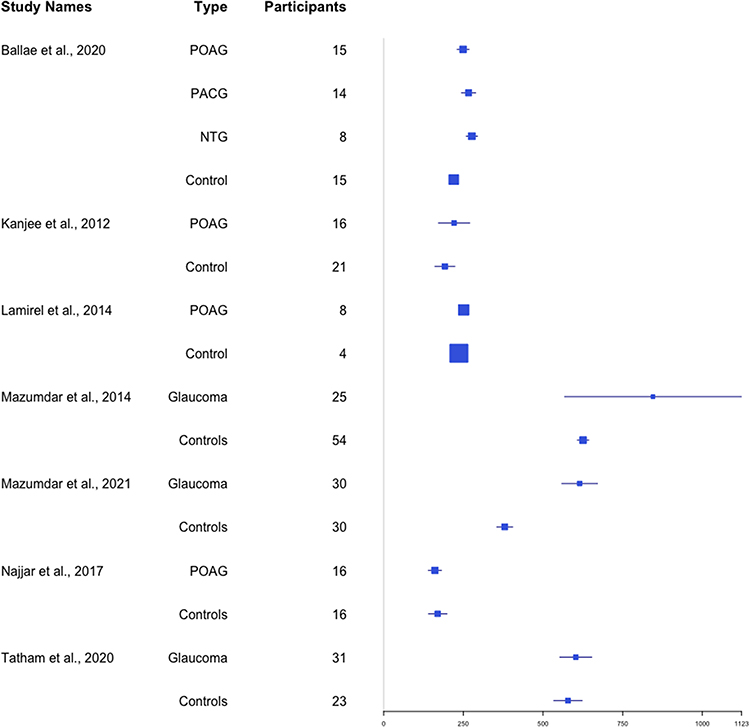 |
Figure 5 Forest plot of saccade latency as measured in milliseconds.62–67,171 |
Saccade amplitude is the angular distance the eye traverses during a saccadic eye movement. Saccade gain is the ratio between saccade amplitude and the angular distance of the target from fixation. Gain of less than 1 indicates a hypometric saccade, and a gain of more than 1 indicates a hypermetric saccade. Saccade amplitude and gain were lower in glaucoma patients than controls in the three studies,63,64,66 and there was no difference between the two studies.62,67
While there was no difference in amplitude in Tatham et al, they revealed a higher directional bias (defined as the difference between fixation change direction and stimulus change direction).67 This may be a more useful measure compared to amplitude as it lends additional information related to the direction travelled, rather than a ratio of distance. Kanjee’s group, which did not reveal a difference in magnitude, consisted of a smaller cohort of patients with significant variation in glaucoma severity which may have prevented sufficient statistical power. This cohort was also positioned 1.5 m away from their targets, which were subtended at 10 degrees from fixation, whereas targets were presented on a monitor up to 80 cm from the participants in comparative studies.63,64,66 A greater distance from the monitor may have introduced larger variability in gaze estimates from parallax effects.78 Where there was a difference, Najjar et al showed approximately 20% less gain on average for static targets of all positions (5, 10, 15, and 20 degrees from fixation). Lamirel et al revealed lower gain in pre-perimetric and perimetric glaucoma than controls when performing saccades on both static (3–8% lower) and moving (6–9% lower) targets.64 In general, saccade amplitudes and gain were more deranged in advanced glaucoma. Najjar et al also revealed an increase in the amplitude deficit from 10 to 20 degrees in the primary open-angle glaucoma (POAG) group (saccades to 5 degrees from fixation did not show significantly different amplitudes, which Lamirel’s group did not report). Ballae et al revealed mean amplitudes of 1 degree less, but this was not described further nor detailed for each distance (targets were 5, 7, and 10 degrees from fixation).
Reflexive errors in performing saccades include anti-saccade errors (a saccade towards the presented target rather than away from it), failure to inhibit a saccade towards a target, and directional errors have been studied in patients with glaucoma. Pre-perimetric glaucoma patients made 18% more erroneous saccades than controls in an anti-saccade task, along with reduced saccadic amplitudes and velocities. This may suggest wider neurological impairment preceding RGC atrophy.66 There was a significant difference between control and both the pre-perimetric and perimetric groups: pre- and perimetric patients had more difficulty suppressing reflexive saccades to a moving target than controls which worsened with disease progression.64 The effect of glaucoma on directional error was less clear. Tatham et al found a higher error in glaucoma,67 whereas Kanjee et al found no difference.62 The quantity of data deleted from head movements, along with calibration accuracy for each group, was not reported so it is unclear as to whether or not glaucoma patients experienced a larger amount of data deletion, or whether no difference was found because the targets did not subtend enough angles away from central fixation.
Saccade average and peak velocity were slower in glaucoma patients than controls in two studies, but there remained considerable overlap between the groups.63,66 Figure 6 combines velocity data where reported. Najjar et al revealed an average velocity of 150–250 degrees per second (°/s), whereas controls were 175–300°/s. Peak velocities were not significant between the two groups. Ballae et al revealed average velocities of 145°/ms (control: 152°/ms) and peak velocities of 266°/ms (control: 315°/ms) which were statistically significant.63 Their reporting of degrees per millisecond is interpreted by this review as a misprint and, based on their data, is likely degrees per second. Kanjee et al found no difference in peak saccade velocity and saccade duration when assessing targets within 10 degrees of fixation using binocular eye tracking in a smaller sample size of 16 patients with mild to advanced disease (compared to Ballae et al with a larger sample of uniformly advanced disease).62 This difference between studies may be attributed to methodological discrepancies. For example, the patient’s better-eye may have compensated for the more disease-burdened eye in binocular experiments by locating the target before the glaucomatous eye. Additionally, Ballae’s group randomized the target eccentricity and performed monocular eye tracking on the glaucomatous eye which may have enhanced their observed outcomes. Less predictability of the target location would lead to less anticipation and motor planning by the participants. Although Najjar et al performed binocular tracking, this was done in a cohort of bilateral glaucomatous eyes with randomly displayed targets of 5–20° eccentricity. By increasing the distance required for the eye to travel, this may have achieved a more significant result in detecting altered velocities in these patients by recruiting more peripheral retinal areas (compared Kanjee’s target display in 10° from fixation).
 |
Figure 6 Forest plot of peak saccade velocity data as measured by degrees/ second. Ballae et al63 report their velocities as degrees/ millisecond which is interpreted by the authors as a misprint.62,63,66 |
During saccade analysis, there is typically a bimodal distribution of latencies: pre-planned target-reaching prosaccades are characterized by longer latencies, while express saccades are of very short latencies of 50–100 ms.62,79,80 Express saccades occur when the target direction may be known, but not its location. They are executed before a precise movement to a target location (eg in free viewing before a target is presented). The effect of glaucoma on express saccades is unclear – Kanjee at al. found that glaucoma patients had 75% fewer express saccades than controls, whereas Najjar et al found that patients had 19% more express saccades than controls. This may be attributed to analysis and experimental design: Kanjee et al defined express saccades as any reaction time between 50–100 ms, which is unlikely to have been achieved by the glaucoma patients. Although this gives a quantitative characterization, it does not necessarily include all express saccades in analysis (eg qualitative analysis may have shown some of these shorter durations were corrective saccades and not express saccades). Their analysis methods were not reported in detail. Najjar et al used a slightly higher frequency eye tracker (300 Hz compared to 200 Hz in the previous study) which incorporated a 200 ms gap before the target was presented. This method may have revealed a higher number of express saccades, thus adding more statistical power to their study. Najjar’s group used a more dynamic analysis algorithm with an adaptive velocity threshold, which is more precise in denoising and characterizing saccades.81
Ballae et al studied saccades in several glaucoma subtypes (high-tension glaucoma (POAG with high IOP) - “HTG”; n = 15, primary angle closure glaucoma - “PACG”; n = 14, and normal tension glaucoma - “NTG”; n = 8).63 This study presented peripheral targets for visual field locations that were not affected by glaucomatous field loss. When data were analyzed between glaucoma subgroups, the majority of differences were found with targets 7 degrees from fixation. The group with normal tension glaucoma had longer saccade latency (for 5-, 7-, and 10-degree target eccentricity), lower peak saccade velocity (7-degree target eccentricity), and more hypometric saccades compared to the other groups (5- and 7-degree target eccentricity). HTG revealed significantly disrupted latencies, velocities, and amplitudes relative to NTG and PACG. However, there were no velocity differences between HTG and PACG. This study did not control for the difference in severity of glaucomatous damage between glaucoma subgroups.
In summary, glaucoma patients experience longer saccade latencies, which are delayed with increasing glaucoma severity. Other saccadic abnormalities include lower saccade amplitude (decreased gain), lower saccade velocity, and difficulty inhibiting reflexive saccades.
Fixation
A fixation describes the stable eye position between successive saccades and is required to hold a stationary image of an object on the fovea. This differs from smooth pursuit movement which holds a stationary image of a moving object. During a fixation, the eyes are never truly still; a fixation contains ocular tremor (high frequency/low amplitude), ocular drift (lower frequency, higher amplitude) and microsaccades (low frequency, small amplitude).82 Studies on fixation often define a single fixation as an eye position that maintains the position of gaze within a set angular diameter (eg within 1.6 degrees) for a set period of time (eg for more than 100 ms),83–86 which encompasses all of the tremor, drift, and microsaccades within the fixation.86
Neurophysiological control of fixation involves cerebral and brainstem structures including the parietal eye field, SEF, middle temporal and medial superior temporal areas, dorsolateral prefrontal cortex, substantia nigra pars reticulata of the basal ganglia, and the rostral pole of the SC.87 Fixation is impaired in a wide range of conditions including amblyopia,88 neurological disease,89 traumatic head injury,41,90 and macular disease such as age-related macular degeneration.91
Studies on fixation in glaucoma have evaluated this in a range of viewing conditions, including pure fixation tasks, viewing static images, reading, detecting hazards in video clips, and driving simulator tests (Table 2).83–85,92–101
Pure fixation tasks measure fixation stability (the ability to hold fixation on a target). Two methods of assessing fixation stability include bivariate contour ellipse area (BCEA) and the Fujii classification. BCEA is the area of an ellipse that surrounds a given proportion of fixation points (usually 68%, 95%, or 99.7% of fixation points with a normal distribution).102 A lower BCEA value signifies that the distribution of fixation covers a smaller area. BCEA is a measure of spread of fixation, not accuracy, so a lower value is not inherently better or worse than a higher value.92 The Fujii classification defines fixation as “stable” when ≥75% of fixations fall within a circle of 2° diameter around the fixation target, “relatively unstable” when ≥75% of fixations fall within a circle of 4° diameter, and “unstable” when <75% of fixations are within a circle of 4° diameter.62,103 Of these two methods, BCEA is regarded as being a more accurate representation of fixation stability.104 Figure 7 compares three studies’ measures of fixation as the log-BCEA 95%. Heterogeneity in outcome measures across other fixation studies prevented further meta-analysis.
 |
Figure 7 Forest plot of fixation task data as measured by log-BCEA 95%. *Longhin et al98 did not report their range of BCEA values which provides a misleading effect size in this figure.86,98,99 |
Fixation stability has been measured in glaucoma patients during microperimetry (also known as “fundus automated perimetry”) testing with either the Nidek MP-1 Microperimeter (Nidek, Gamagori, Japan) or the Compass Perimeter (CenterVue, Padova, Italy).98–100,105 Microperimetry incorporates an eye tracker within the system that adjusts the position of visual field stimuli to compensate for fixation instability. Microperimetry software enables measurement of fixation stability, preferred retinal locus of fixation, and visual field sensitivity, albeit at lower frequencies of 25 Hz (also referred to as frames per second).106 Testing of fixation stability in these studies used a “static” fixation task (fixating on a central target) and a “dynamic” task (fixating on a central target while performing perimetry testing).
Fixation stability, as measured by the spatial distribution of fixation points (BCEA of 95%), showed no difference between POAG and control groups in Longhin’s study.51 However, this measure is generally less accepted than a BCEA of 68%.107 Montesano et al novel metric of Sequential Euclidean Distance highlighted the importance of fixation behavior, emphasizing the importance of the temporal-spatial relationship by quantifying the frequency of fixation point change independent of spatial variation and spread.99 Fixation stability as measured by the Fujii classification was lower in glaucoma patients than controls during fixation tasks, particularly in dynamic fixation.51,53,98,100
Hypotheses surrounding loss of fixation quality (stability and duration) in glaucoma focus on RGC loss at the macula early in the disease process despite adequate visual acuities.108 In this group, the mean deviation (MD) of the four central foci of the HFA 10–2 was −22.59. It has been shown in a healthy cohort that decreasing luminance in peripheral parts of experimental displays leads to increased inspection times (and subsequently fixation duration) which suggest that fixation duration increases with increased processing difficulty.109,110 The inferotemporal portion of the central 6 degrees of the macula was detected to be least light sensitive by Shi’s group, and this area was also correlated to the quality of fixational stability.100 Furthermore, in a group of patients with a fixation-threatening scotoma due to advanced glaucoma, 18% fewer patients had stable fixation during dynamic fixation than during static fixation.105
In summary, fixation is abnormal in glaucoma. This includes not only the spatial distribution of fixation points but also the temporal relationship between fixation points due to decreased signal from RGCs.99
Optokinetic Nystagmus
Optokinetic nystagmus (OKN) is an involuntary eye movement that is elicited by motion of visual stimuli across the field of vision. The purpose of OKN is to prevent retinal slip (movement of an image across the retina) to stabilize the image on the retina. OKN consists of a slow phase of smooth pursuit that tracks the motion of the visual stimulus, and a fast phase where a saccade in the opposite direction resets the eye position for further smooth pursuit tracking.111 This forms a typical saw-tooth pattern on eye tracking.
The neurophysiological basis of OKN involves cortical (including the FEF, prefrontal eye field, visual cortex (V5), medial superior temporal area, and ventral intraparietal area) and subcortical structures (including the pons and cerebellum).111,112 OKN has been found to be impaired by conditions including progressive supranuclear palsy,113 recreational solvent abuse,114 and tardive dyskinesia resulting from antipsychotic medication treatment.115
A key measure of OKN is the gain which is characterized by the smooth pursuit velocity divided by the stimulus velocity. This is typically a value of 1 in healthy controls, but this value has been found to decrease with age.116 The gain may also be affected by operator instructions which can elicit either “look” or “stare” OKN. “Look” OKN, thought to be cortically driven, consists of high gain and large amplitude slow phases with quick recovery phases. This results from following a specific detail on the moving stimulus. “Stare” OKN results from passive fixation of the target and reveals the opposite pattern with low gain, low amplitude, and frequent quick recovery phases (sub-cortical control).117 OKN is also measured in forward and reverse directions, along with horizontal, vertical, or torsional vectors. This reflex may also be manipulated through variation in target size, shape, contrast, velocity, and specific suppression or induction tasks.118 This involves initially inducing the OKN with alternating white and black vertical stripes. Induction of OKN response is regarded as a sign that stimuli are perceived. The superimposition of a stationary white dot detection stimulus was used to suppress the OKN response. Suppression of the OKN response was regarded as a sign that stimuli were recognized by patients.119
Several investigators have studied OKN in patients with glaucoma or visual field defects (Table 3). Severt et al evaluated quantitative OKN characteristics in a small cohort of POAG suspects (n = 8) via stepwise discriminatory analysis.119 Their diagnostic accuracy of 90% was achieved through a focus on OKN beat rate (specifically large, contiguous OKN beats) and slope of OKN beat rates in near-frequency doubling stimuli. The authors concluded that the impaired accuracy of eye movements suggests that glaucoma changes the signal-to-noise ratio available to the brain.
However, it is not clear whether these OKN changes are specific to glaucoma or related to other diseases impacting the RGC. Doustkouhi et al simulated visual field loss in a group of healthy volunteers (n = 16, ages 21–50).120 They detected a decrease in OKN gain compared to baseline full-field OKN testing. A decreased OKN gain was also correlated to increasing age. It is worth noting, however, that their simulated field loss was patchy and not necessarily representative of glaucomatous visual field loss. Additionally, because the simulated visual field loss was presented to healthy controls, they did not have the chance to adapt to the visual changes over time (as glaucoma patients typically experience gradual disease progression). Shin et al did not find a difference between glaucoma and other eye disease (general retina and macula disease). Rather, OKN correlated well with visual acuity worse than 20/60.121
Tong et al evaluated OKN in glaucoma using dual-directional OKN.122 Dual-directional OKN uses an intermittent display of OKN gratings (rather than the typical continuously moving grating) offset by a π/2 phase shift. At a low inter-stimulus interval, the brain perceives the intermittent display of gratings as going in a “forward” direction. As the inter-stimulus interval increases, the brain will intermittently perceive the OKN as going in the “reverse” direction and the direction of the fast and slow OKN phases will alternate back and forth.122 The authors found that reverse OKN was nearly absent in all glaucoma eyes. In addition, the proportion of time spent in forward OKN deteriorated much more rapidly with increasing inter-stimulus interval in glaucoma patients relative to controls. In a protocol with constant inter-stimulus interval and variable luminance contrast, forward OKN was elicited at a lower contrast in controls than in glaucoma patients which was attributed to ganglion cell loss.122 Their wave-form analysis showed similarity to previous experiments on M-type ganglion cell temporal impulse responses, suggesting that their findings in glaucoma patients were attributed primarily to the loss of these cells.
Abe et al studied OKN in 104 eyes of glaucoma patients which highlighted the importance of contrast sensitivity.123 Through manipulation of pattern movement (drifting vs stationary) and contrast levels, they showed contrast sensitivity in optic nerve damage was best evaluated by a drifting horizontal stripe pattern. Its sensitivity to detect minor optic nerve damage was considered to be due to the M-type (magnocellular, retinotectal tract) retinal ganglion cells’ role in movement detection and low contrast conditions (low spatial frequency and high temporal frequency). This contrasts the P-type (parvocellular, retinocalcarine tract) retinal ganglion cells (high spatial frequency and low temporal frequency) which are most useful for fine detail, static objects.124 This is in keeping with studies to suggest early glaucomatous damage begins with the magnocellular pathway,12,125–127 although this is debated due to a recognized overlap in structure and function.128 Moving image studies support this notion, where glaucoma participants showed less motion sensitivity, a key function of M-type cells as they synapse with the middle temporal cortex and middle superior temporal cortex (motion centers).129 Evidence further suggests the magnocellular pathway is selectively suppressed during saccades whilst the parvocellular pathway is enhanced, possibly explaining the propensity to form smaller amplitude saccades, suggesting a neural adaptive process.130 However, this explanation is likely more complex with confounding visual field loss where saccades fall short of a target because they are not processed in time with sufficient visual information before the saccadic neural impulse is executed.
In summary, OKN has revealed abnormal responses in glaucoma patients in the aforementioned studies, suggesting an OKN marker unique to glaucoma under the right experimental conditions.119,122,123 More research is required to explore the mean rate of beats in contiguous clusters, absence of reverse OKN, forward OKN deterioration rate, and response to suppression stimuli which have proven most sensitive thus far.
Eye Movement in Glaucoma During Complex Tasks
Performing complex visual tasks is part of everyday life – for example, finding a face in a crowd, locating an item in a shop, and responding to moving vehicles or pedestrians on roads. Complex visual tasks require the coordination of many different eye movements (saccades, smooth pursuits, fixations) and processing of both central and peripheral visual information. Complex tasks can be assessed in laboratory or real-world situations. Laboratory-based tasks have the advantage of a high degree of control over the study environment – including standardised luminance, stabilization of participant’s head position (to remove head movement-related effects such as vestibular-ocular reflex), minimization of unwanted reflections and glare, and weather/traffic conditions in driving simulation.84 Real-world tasks are more relevant to activities of daily life with increased external validity but are more difficult to control. Eye movements have been studied in a wide range of complex tasks, ranging from less to more visually and cognitively complex (reading, viewing static images, viewing moving images, finding targets within images, walking through an environment, crossing the street, and driving).2,3,83,84,93,96,97,101,109,110,131–139
Reading
Patients with glaucoma report difficulty with reading and other near-vision tasks.140–142 This is a particularly useful measure for the integration of oculomotor control, retinal ganglion cells, and higher cortical function. Studies have shown that glaucoma can impair reading speed and performance, especially in settings of low text contrast,131 small text size,143 and more severe visual field loss.2,134,144 The majority of studies listed below have also controlled for visual acuity and cognition, important confounders in reading ability. Several studies measured eye movements during reading in patients with glaucoma to investigate whether impaired eye movements could explain the reduction in reading performance (Table 4).2,101,131–135 An important aspect of reading performance in glaucoma is contrast sensitivity, where subclinical loss of visual acuity and contrast sensitivity may occur early in the disease.131 After controlling for cognition, Burton et al revealed a reduction in reading speed with a reduction in contrast (from 100% to 20%), despite visual acuities of 6/9 or greater.131 This effect was more pronounced with a higher glaucoma disease burden. Burton’s group also suggests that inferior-left visual field defects are the most important predictors of poor reading speed, delaying patient fixation at the start of a new sentence in paragraphs.145 This was supported by Murata’s group who correlated the locus of visual field defects to an array of vision-related quality of life outcomes.146 Chen et al report on 8 patients was not sufficiently powered to correlate the location of their visual field defect to reading speed or eye movement measures, but their cohort did show that glaucoma patients were slower readers with a higher fixation count than healthy controls.144
 |
Table 1 Studies on Isolated Saccade and Anti-Saccade Tasks in Patients with Glaucoma |
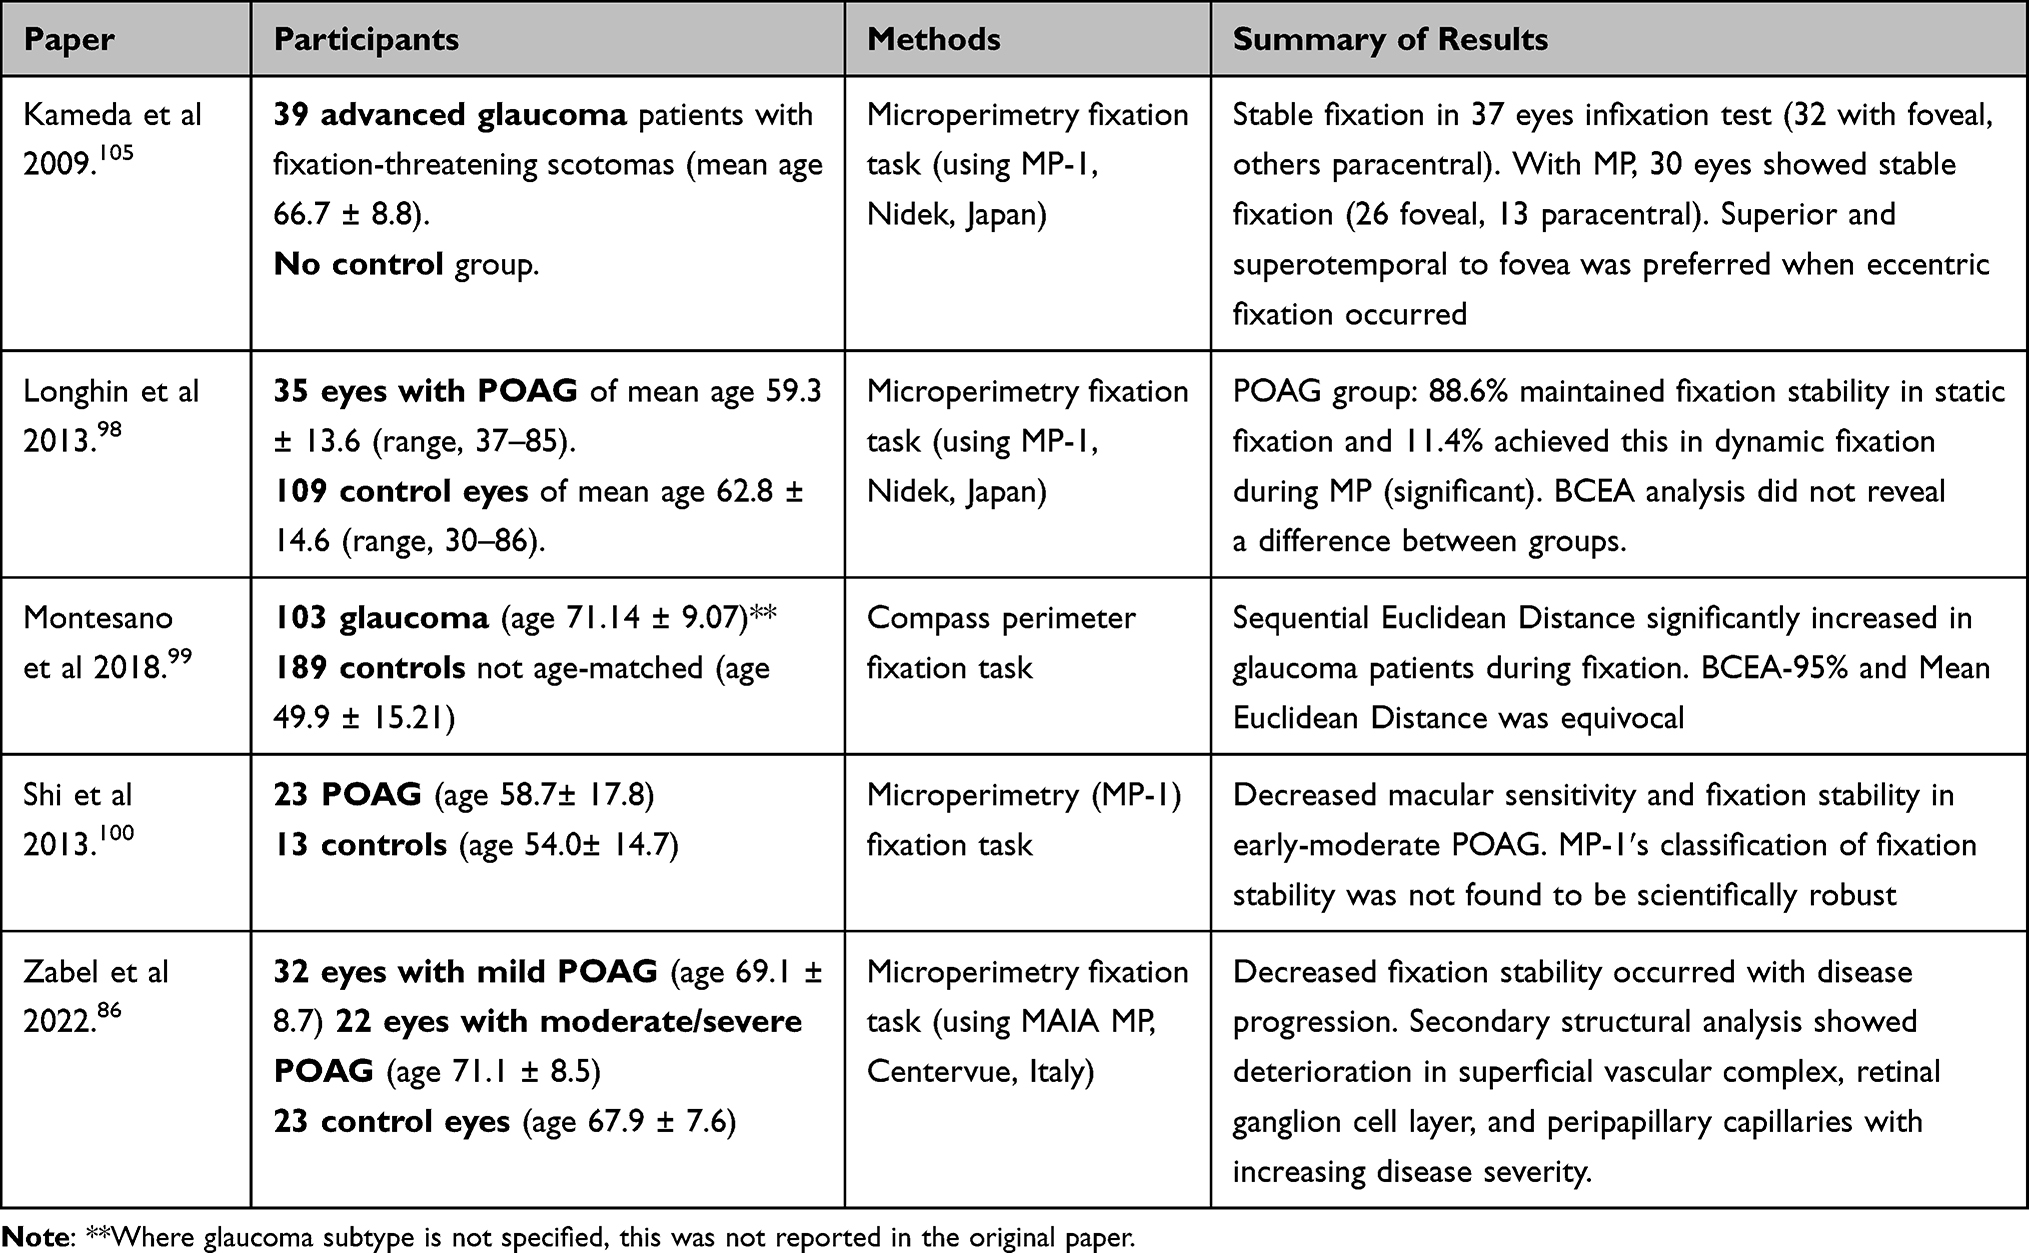 |
Table 2 Studies on Isolated Fixation Tasks in Patients with Glaucoma |
 |
Table 3 Studies on Optokinetic Nystagmus in Patients with Glaucoma |
 |
Table 4 Studies on Eye Movements During Reading in Patients with Glaucoma |
Reading has been evaluated by either asking participants to freely read a small section of text either aloud,2 silently,101,135 or to perform a “lexical decision task” where they are presented with a real or “false” word (eg “spoon” vs “sploon”) to decide whether the word is appropriate.132 The basis of the lexical decision task is that words in context are easier to comprehend, whereas words in isolation are more difficult to comprehend and may require more eye movements to process.
The effect of glaucoma on saccade behavior during reading tasks was varied. Burton et al showed that saccade frequency (defined as the total number of saccades required to read one word) was 10% higher in glaucoma patients with advanced visual field defects using a reading task (eight paragraphs of text).132 This was considered as an adaptive strategy in the presence of visual field defects and altered RGC function, with patients making more frequent, smaller saccades with significantly different scanpaths. Smith et al showed that saccade frequency (saccades per second) was 7% lower in worse eyes than in better eyes in patients with asymmetric glaucoma in reading tasks (MD differing by >6 dB between eyes; mean −3.4 dB in best and −14.8 dB in worse eye) in patients with asymmetric glaucoma in a reading task.135 However, there was no difference between better and worse eyes in frequency of “regressive” saccades (backtracking over text already read).
Fixation distribution (measured by maximum gaze extension along the x- and y-axis) was higher in glaucoma patients than controls in a reading task, which implies a greater visual search burden around glaucomatous field loss.133 Mean time per fixation was also found to be higher in glaucoma patients than controls in a reading task.101 This was independent of which eye was worse, implying that a patient’s “good eye” does not necessarily mitigate the effects of the worse eye during silent reading. There was also a positive correlation between a patient’s right VF and reading performance. It is not known whether this was due to common glaucomatous VF damage in Bjerrum’s area, the nasal step, or eye dominance.
Notwithstanding, Cerulli et al showed no difference between glaucoma patients and controls in reading speed, nor any differences in reading speed between early, moderate, and advanced glaucoma.133 However, they did show greater variability in eye movement amongst glaucoma patients (specifically maximum horizontal and vertical distance travelled). This “extra effort” hypothesis is supported by Smith et al who suggest patients with asymmetric glaucoma take 9% longer to read text with their worse eye than their better eye.135 Increased reading duration in the worse eye correlated to reduced contrast.135
Although these studies aim to increase real-world generalisability through the evaluation of reading, an everyday task, they are all performed with the participant sat in front of an illuminated screen. This does not take into account a task such as reading a book, where inferior hemifield defects may limit their abilities further.2,146 Nevertheless, reading impairment across all studies suggest a significant pathological process in glaucoma where visual processing and central vision are affected beyond the optic nerve head, echoed by another group.11 Similar to other areas of eye movement function, Cerulli et al suggest the magnocellular system to play a key role in binocular vergence during fixation, as well as inhibiting the processing of visual information during a saccade.147,148 Failure to perceive a word due to ganglion cell failure (or loss) could result in increased corrective saccades, leading to increased reading time and fixation count.
Static Images
Viewing of static (stationary) images has been evaluated using several different tasks, including freely viewing or searching for a target within, a series of images (such as film or documentary stills, or photographs of everyday scenes);92,94,138,149 performing a driving hazard detection test;84 and performing a facial recognition task (Table 5).150
Eye movement parameters measured during static image tasks included fixation distribution (BCEA), fixation duration, time fixating on relevant stimuli, saccade amplitude, saccade/fixation frequency saccade velocity, search time, and task performance.
Distribution of eye coordinates within a fixation (fixation distribution) can be measured using several methods including BCEA as described previously. BCEA also represents fixation stability and can be used as a surrogate for visual search behavior (ie higher number of points within a defined BCEA may represent longer dwell time). In visual search tasks, fixation distribution is used to describe the distribution of all fixation points across an image. When asked to freely view a series of static images, patients with glaucoma had a 23% smaller BCEA than controls,94 and patients with asymmetric glaucoma had a smaller BCEA in their worse eye.92 Between-eye differences in BCEA are correlated with mean deviation (MD) in automated perimetry.92 Fixation duration was 12% longer in glaucoma patients than controls in one study by Smith et al,94 whereas Nistal et al showed no difference in fixation duration.138 Smith et al propose that increased fixation duration in glaucoma patients compensates for the loss of information from central vision. Although Nistal et al did not show a difference in fixation duration, they revealed a higher overall number of fixations which loosely supports the same notion held by Smith’s group.138 If these separate and more numerous fixation events were to be summated, perhaps the overall fixation time would be prolonged as well.
Significant differences in saccade behavior between individuals in these studies suggest higher order compensatory mechanisms and general behavioral differences. Glen et al highlighted this by comparing glaucoma patients with central VF loss to peripheral VF loss.150 Patients with bilateral central VF defects performed larger saccades, which were associated with better facial recognition performance. Saccade velocities were decreased in Nistal’s patient group,138 and hypometric saccades were more prevalent in Lee’s group.84
When asked to search for a target or driving hazard within static images or recognize faces, there was no difference in fixation distribution between glaucoma patients and controls,84 nor was there a difference in mean fixation duration.84,95,138 However, glaucoma patients spent 9% less time fixating on road users in driving scenes than controls (more time was spent fixating on irrelevant areas of the image such as lamp posts and trees).84 In a facial recognition task, there was no difference between glaucoma patients and controls in proportion of fixations on “regions of interest” (eyes, nose, mouth).150 Saccade/fixation frequency was 6% lower in glaucoma patients in one study,149 with two studies finding no difference.95,138 There was no difference between groups in saccade amplitude.95,138,149 This may be attributed to the experimental design: a saccade during a visual search task is not being planned to land on a specific target (as in the case of focused saccade studies) which means there is no “target locus”. Larger amplitude saccades found by Glen’s group reflect this phenomenon as the patient’s goal is to search for a target.150 Wiecek’s lack of significant findings in search duration, fixation duration, saccade size, and number of saccades may be reflected by their small sample size and large inter-individual variation. However, they did reveal a reduced horizontal scanning rate compared to control, in keeping with Smith et al.
Overall, glaucoma patients took 21–47% longer to complete search tasks than controls which serves as a global marker of visual processing ability.138,149 Higher scores in the driving hazard test in the control group was correlated with longer fixation duration on road users (and overall), lower fixation frequency (ie each fixation held more value in interpreting the task), larger saccade amplitudes (ie scanning for hazards), and larger horizontal fixation distribution.84 This provided quantitative information on the glaucoma cohort’s poorer driving scores. Glen et al facial recognition outcomes were not correlated with saccade frequency or amplitude, highlighting the importance of experimental design in exploring a research question in these patients.150
Moving Images
Passive and active viewings of moving images have been evaluated on several different tasks, such as freely viewing video clips from film and television151 and searching for targets within video clips of driving scenes (Table 6).83,93
Eye movement parameters measured while viewing video clips include scanpaths (the complete path followed by the participant’s eyes during a task), saccade/fixation frequency, saccade amplitude, fixation duration, fixation distribution (BCEA), and latency to first fixation.
When subjects were asked to freely view video clips from film and television, Crabb et al used an eloquent statistical method (kernel principal component analysis, KPCA) to differentiate between glaucoma patients and healthy controls based on recorded scanpaths alone.151 KPCA is capable of dimensional reduction of data (eg from 3D waveforms to 2D images) through the application of supervised machine learning which untangles each piece of data (via algorithmic analysis) into a “kernel” space which applies a unique combination of values (similar to a heat map).152 Glaucoma disease severity in this study varied greatly from early disease burden (MD better than −6 dB in both eyes) to advanced (MD worse than −12 dB in both eyes). The receiver operating characteristic (ROC) curve was 0.85 (95% confidence interval 0.82–0.87) with a maximum sensitivity of 76% and maximum specificity of 90%. Although the subsequent validation of this model was tested on the dataset used to create it (no samples were left out for validation), these promising results suggest subtle disease signatures which may prove useful for future approaches in machine learning. Soans et al used a machine learning approach on 15 glaucoma patients (mixed cause and severity) and 21 controls while watching a dot move around on a screen (one mode was smooth pursuit and the other mode consisted of the dot moving randomly to different locations every two seconds).153 By analyzing spatiotemporal properties of the eye movement behavior, their machine learning algorithm achieved a sensitivity of 60% (specificity 98%) for glaucoma and a sensitivity of 86% (specificity 96%) for control based on this small cohort. Individual eye metrics showed glaucoma to have increased saccade latencies, increased positional errors, and lower velocities relative to controls, similar to previous saccade-based studies.62–64,66 During smooth pursuit, there was a higher time lag compared to controls.
Two studies evaluated hazard perception.83,93 Lee et al pre-hazard testing revealed worse binocular contrast sensitivity, visual field loss, decreased Useful Field of View® (visual processing speeds and attention), and decreased motion sensitivity in 31 glaucoma patients compared to 25 age-matched controls.93 This led to an overall delay of 0.42 seconds in hazard response time with hypometric saccades. They did not show an increase in saccade frequency, nor fixation duration, unlike Crabb’s study of 9 POAG participants.83 As the authors mention, this may be due to their small visual angle of the test movie (limited by their eye tracking monitor size) compared to Crabb et al. This prevented the evaluation of hazards in more peripheral vision. Crabb’s group used dynamic “point of regard” testing (co-registering eye movements to video frames) for greater accuracy of eye movement interpretation. This led to a unique analysis pipeline with in-house software to subsequently denoise the data and classify eye movement events based on select algorithms (available from authors on request). However, they did report the need to delete large amounts of data where their analysis failed. Using this method, they still revealed a 16% higher saccade frequency, 17% shorter fixation duration, 18% higher frequency of smooth pursuit movements (with 7% shorter duration) compared to controls. Higher saccade amplitudes led to faster response times to hazards. The increased saccade rate was considered to occur from compensatory behavior of constricted visual fields, as considered previously.93 Both of these studies found no statistical difference in fixation distribution, but when reviewing footage qualitatively, Crabb et al noted that glaucoma patients were clearly not viewing hazardous areas easily viewed by controls.83 In these cases, missed targets correlated to the individual’s corresponding visual field loss and the patients were not aware of this.
The study by Asfaw et al is unique due to its monocular assessment of each of the participants’ eyes.92 This uses each patient’s “good eye” as their own control to remove the effect of inter-individual differences in higher cortical input (and therefore eye movement behavior). They positively correlated hypometric saccades with reduced BCEA to severity of VF loss. Interestingly, disparity in BCEA values (between each eye) was positively correlated to MD (field loss) in the other eye and was more useful than saccade amplitude. This was considered to be due to BCEA’s incorporation of both direction and amplitude of the saccade, which gives a more representative picture of the gaze pattern. Their novel measure of saccadic reversal rate (looking “back-and-forth” to revisit an area just seen) was increased as visual acuity decreased.
Walking Through an Environment
Walking is an important everyday activity that can be significantly impaired in glaucoma. Patients with glaucoma commonly have problems with mobility, such as a slower walking speed, bumping into objects in their environment, and are at a higher risk of falls154–158 than visually healthy peers due to postural instability and inferior visual field loss, which is common.146,159,160
Walking performance in glaucoma has been evaluated in a laboratory-based obstacle course,161 a real-world shopping task,162 and in real-world street-crossing tasks (Table 7).85,163 Eye movement parameters recorded during walking tasks included spatial gaze distance (the distance of fixation ahead of current position), saccade amplitude, saccade/fixation frequency, fixation location, fixation duration, fixation distribution (such as BCEA, horizontal gaze activity, proportion of glances beyond 30° from center, or frequency of glances beyond 30 degrees and 60 degrees from center), and task performance.
In the obstacle course, participants completed several different tasks: walking through the course only, walking through the course while counting backward by threes, and walking through the course to later identify the location of peripherally placed visual targets within the course.161 In this study, glaucoma patients were not analyzed according to severity of visual field loss. Overall, glaucoma patients fixated less on route planning features (such as peripheral targets) and made a higher number of errors (contact with obstacles) in all trials, particularly as the cognitive load increased (ie multi-tasking).
In the shopping task, participants walked along the aisle of a shop and were asked to search for and collect a list of 20 pre-labelled items (orange label) within a set timeframe, 4 times. Locations ranged in height and products varied in color, shape, and size. Performance was assessed by the average number of items collected over all runs, average performance time over all runs, and average time spent on each correctly collected item. There were specific pass/fail criteria based on the distributions of control patients. Overall, there were no glaucoma subjects able to collect all 20 items. These patients all required 55.9 seconds longer to complete the task and 80% of glaucoma patients were able to collect the object off the shelf within the cut-off time of 5.92 seconds. Sippel et al therefore concluded that glaucoma patients required longer search times, but there was a subgroup who compensated well and performed the same as controls (further details of this group were not provided).162 For the glaucoma participants who passed the task, they increased their gaze more frequently to the area of field loss.
In street-crossing tasks, Cheong et al asked participants to judge gaps in traffic during which it would be safe to cross the street. This study compared 5 age-matched controls to 3 patients with glaucoma and 5 patients with retinitis pigmentosa (RP). They did not subgroup analyze based on pathology (ie glaucoma and RP were grouped together) and the group sizes were small which limits this study’s generalisability.85 Participants were found to spend at least 15% less time fixating on relevant stimuli (eg cars, traffic signals) than controls. Overall, fixation area was markedly reduced in the patient group (smaller BCEA vs controls), but there was no difference in fixation duration and saccade amplitudes between the groups, except for 4 patients who experienced significantly longer fixation durations. Any other significant differences may have been lost in this smaller sample size, heterogeneity of experimental condition (“real-world”), and inter-individual variation from either primary pathology, behavior (decision-making), or coping mechanism.
Geruschat et al asked participants to perform a full street crossing.163 They compared controls to patients with glaucoma and age-related macular degeneration, splitting results between patient groups. Overall, fixation varied depending on what stage of crossing: standing at the curb, participants focused on vehicles. When they crossed, the emphasis was on crossing elements (crosswalk). Glaucoma patients fixated on similar elements to control, whereas age-related macular degeneration showed a trend toward different behaviors.
Dive et al evaluated eye movement during two tasks: making a sandwich or constructing a model with a children’s building set.164 Task-relevant and task-irrelevant objects were at the scene to assess interaction. The glaucoma group were found to spend longer on the building task only, which was thought to be due to the familiar nature of making a sandwich. This patient cohort also spent longer exploring and fixating on all objects prior to commencing the task (increased saccade frequency and head movement), including irrelevant objects. The integration of visual search, recognition, and processing in this study highlighted the patient cohort’s difficulty with visual fields, contrast sensitivity, and central vision (from prolonged fixation).
Driving
Driving is a cognitively complex task requiring processing of large amounts of visual information, detection of possible hazards, and continuous responses via steering wheel and foot pedals to control speed, direction, and lane position. Patients with glaucoma make significantly more errors when driving compared to age-matched visually healthy controls, even with mild or moderate field loss,3,139 and they are at significant risk of losing their driving license due to visual acuity loss or binocular field deficits (Table 8).165
Eye movement has been evaluated in patients with glaucoma during driving tasks using both simple97,138 and sophisticated96 driving simulators, and during both closed- and open-road driving tests in real vehicles.136,137 Eye movement parameters measured during driving tasks include saccade amplitude, saccade velocity, saccade/fixation frequency, fixation duration, and fixation distribution (using a wide variety of measures). Three studies also included quantification of head and shoulder movement to assess compensatory behaviors for field loss.96,136,137
Due to heterogenous experimental design (patient cohort, eye tracking technology, analysis, and driving set-up/evaluation), saccade amplitude ranged from 16% smaller,138 to no difference,97 to 35% larger,137 in glaucoma patients than controls. There was no difference in saccade/fixation frequency or fixation duration in three of these studies.97,137,138 However, Lee et al reported a fixation distribution 81% higher along the x-axis and 309% higher along the y-axis in glaucoma patients than controls.137 Other studies, to the contrary, found no difference in fixation distribution (measured by the proportion of glances towards either the top and bottom of the screen, into several separate portions of the binocular field, or as standard deviation of gaze along the x-axis).97,136
Glaucoma patients showed poorer driving scores in all but one study.97 This study by Prado et al, however, used a fixed-base driving simulator which focused on lane keeping, avoiding obstacles, and naming letters above the horizon.97 The glaucoma patients passed but showed increased steering activity considered to be due to hypervigilant behavioral adaptation. These patients were also less likely to report the use of cruise control with higher reported visual concerns. Unsurprisingly, there was a bias toward patients without superior field defects scoring higher on the letter detection task. There was a positive correlation between letter detection performance and defects in the patients’ integrated visual field (IVF) (and not eye movement metrics) which was a result of merging both monocular fields.97 This is supported by another study, which positively correlated driving performance to best-eye MD.166
More generalizable studies were road-based,96,136 followed by a moving-base simulator. Kübler et al suggested that glaucoma patients who failed a driving test had smaller saccades, a lower saccade and fixation frequency, a gaze position bias towards the right side of the road (in a country that drives on the right), smaller fixation distribution (as measured by mean distance between straight ahead and the current gaze distribution), and a lower ratio of horizontal to vertical fixation, than patients who passed the test and controls.96 In this study, the sample size was small (POAG n = 6, control n = 8) due to high experimental cost and therefore not sufficiently powered. In another study, glaucoma patients who failed made fewer glances towards their area of visual field defect than patients who passed, highlighting the importance of individual compensatory mechanisms and behaviors.136 Nistal et al, to the contrary, disabled compensatory head/shoulder movement by fixing the patients’ heads in an eye tracker.138 This revealed hypometric saccades with lowered velocities and shorter fixations. Their fixation was predominantly centered (more so than controls), resulting in missed targets in the periphery.
Limitations of Studies
The studies described herein share several common limitations. All of these studies were cross-sectional, and there was no individual long-term data on eye movement progression as glaucoma progressed. Sample size was often relatively small (an average of 31 patients per study when calculated across all 46 studies) and degraded further with subgroup analysis, making it difficult to draw meaningful statistical or clinically relevant conclusions. Many trends may have been lost due to lack of statistical power. For example, Thepass et al’s larger cohort of 76 glaucomatous eyes was divided into four main subgroups, testing 8 different target eccentricities, which limits their overall effect size.75
A wide range of eye tracking devices were used and results from each study may not be directly comparable. A potential drawback to the low-cost portable eye tracking technology used in many of these studies is the reduced video frame rate (eg 25–200 Hz) compared to costly and less-portable laboratory devices with higher performance of over 1000 Hz. This was particularly an issue in fixation-based glaucoma studies which frequently used only 25 Hz.86,98–100,105 Frame rate is important to not only increase the sensitivity and precision of event detection (eg onset time of a saccade) but also to provide detail within events (eg rate of acceleration within a saccade, or microsaccades within a fixation which requires at least 200 fps to detect).167,168 Another consideration is monocular vs binocular eye tracking methodology. Binocular recordings enable the machine to take averages between both eyes’ position for a more accurate representation of where the participant is looking in space (using a coordinate system) and time. This improves signal-to-noise. However, if one eye is lost during the binocular averaging method, the subsequent representation of gaze coordinates may become skewed.169 In addition, many low-cost binocular eye trackers do not have time-synchronized eye cameras (ie both cameras record at different rates) which may not reveal subtle latencies and other clinically relevant metrics.168 When assessing the effect of glaucomatous disease burden on saccades, binocular eye tracking may mask any disease burden in the glaucomatous eye (ie the better-eye may be detecting the target and relaying this signal to gaze control centers faster than the glaucomatous eye).
Eye tracking devices contain their own inherent error in accuracy (typically within a visual angle) and latency (the end-to-end delay of the pupil coordinate being registered by the eye tracker and then sent to the computer). This may not be significant in laboratory-based studies with controlled experimental designs (ie error will be the same for every participant), but for Moving Images Driving (gaze-contingent studies with moving images and real-world trials) this has the potential to introduce random error whilst performing a task. The majority of these studies use in-house software and analysis algorithms which may not readily expose these errors. The head-mounted, mobile eye trackers must also adjust for a parallax error if the world-facing camera is mounted along a different optical line than the pupil-facing cameras.170
Not all studies controlled for potential confounders, such as cognitive ability, reduced color vision, and extent/location of visual field loss. Therefore, differences in findings between studies may have been due to underlying differences in study populations. It is not clear how the variation in visual field loss among glaucoma patients affect eye movement other than behavioral adaptations (eg increase in saccade frequency to increase visual search). However, an increase in disease severity has shown more pronounced differences compared to control groups. Where glaucoma subtype was not specified, nor time from diagnosis, it makes it difficult to draw conclusions on acute visual field loss from pathology such as angle closure or slow visual field loss in POAG.
Summary and Implications
Glaucoma patients show alterations in eye movement behavior when compared to healthy age-matched controls in both experimental and real-world environments (Figure 8 presents a summary of the findings). They manifest increased saccade latencies which prolong with disease burden.62–67,75,171 Other saccade abnormalities include lower amplitudes,66 velocities,63,67 with one study revealing difficulty with reflexive inhibition compared to healthy counterparts.66 Differences in saccade latencies in between-eye experiments (eg comparing one patient’s less-diseased eye to their more-diseased eye) reveal that the magnitude of glaucoma burden is positively correlated to increased latency.75 Longer saccade latency in glaucoma patients may be caused by eye movement control centres (eg the SC, where 10% of RGCs target6) requiring a longer time to collect visual information from the reduced RGC input (ie reduced signal). It would be of interest to explore reflexive saccades which isolate the retinotectal tract in a group of glaucoma patients, similar to Abe et al’s aim with OKN.123 This experimental design was achieved by one group of healthy volunteers which showed a bias toward the temporal hemifield (shorter latencies) in express saccades only (not saccades controlled by voluntary control).7 This implies direct transmission to the SC from the retinotectal tract, bypassing the LGN (temporal nasal LGN activation asymmetry).172 If M-type cells are a sensitive biomarker for early RGC loss, this may serve as a useful paradigm to investigate this further. The SC, responsible for mediating saccades173,174 and fixation,175 also shows signs of degeneration in glaucoma in keeping with retinotopic patterns of RGC axonal loss.176–179 Emerging theories of neurodegeneration in glaucoma, which may affect higher cortical and attention-based ocular motor pathways, cannot be excluded, either. Further studies directly comparing the effect of monocular vs binocular ocular motor outcomes in patients with unilateral glaucoma may clarify whether eye movement abnormalities are due to reduced retinal input (ie in the diseased eye) or degeneration of cortical pathways (ie altered ocular motor outcomes irrespective of which eye is measured).
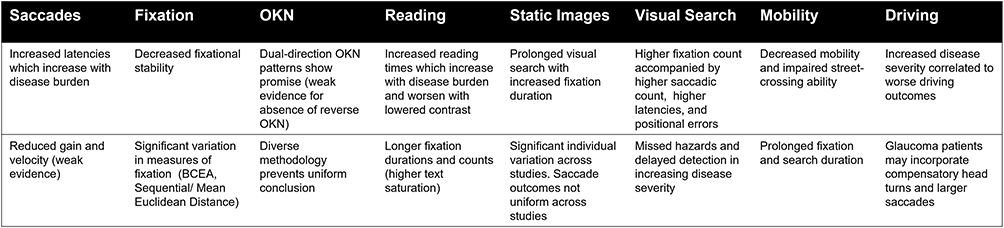 |
Figure 8 Summary of key points. |
Within a fixation, glaucoma patients were shown to cover greater distances (which is supported by evidence suggesting ganglion cell firing is increased by wobbling stimuli compared to motionless stimuli), suggesting neuroadaptive behaviors.180 In reading tasks, increased fixation counts increased reading times as glaucoma patients spent longer on each word.144 Moreover, the decreased fixational stability in glaucoma patients was made worse during dynamic tasks.83,92,98 In patients with fixation-threatening scotomas, superior and superotemporal foveal regions were favored when eccentric fixation occurred.105 The largest cohort of 103 glaucoma patients used Sequential Euclidean Distance, which proved more sensitive to describing fixation behavior than BCEA-95 and Mean Euclidean Distance, warranting further investigation in future cohorts.99 However, all of these studies used perimeter fixation tasks with low sampling rates. The inclusion of higher sampling rates (eg over 200 frames per second) would lend more information in fixation behavior, such as microsaccades and saccadic intrusion. None of the studies quantified these intrafixational ocular motor behaviors.
OKN studies combine saccades, smooth pursuits, and primary reflexes in a combination ideal for a biomarker of glaucomatous disease burden. In particular, dual-directional OKN patterns show most promise. Within these patterns, beats within contiguous clusters with near-frequency-doubling stimuli were sensitive markers even after age-adjustment. However, more studies are needed to ascertain whether or not the absence of reverse OKN (in dual-directional patterns) occurs in glaucoma alone. With only five studies in this area of low sample size and marked heterogeneity, more research is required in this emerging field.
The evaluation of reading behavior lends further insight toward the integration of saccades, fixation, and smooth pursuit movement in glaucoma. This area contained the largest average sample size of approximately 45 patients per study. The Salisbury Eye Evaluation Project, with 132 glaucoma patients and 1017 controls, confirmed other study conclusions in this field: reading speed increases in more advanced glaucoma, even when controlling for cognitive ability, age, education, and visual acuity.2 Increased saccadic frequency and fixation duration during reading tasks imply a greater visual search burden for these patients. This was also reported in static image experiments ranging from hazard perception to facial recognition. Moving images exaggerated this response with decreased motion sensitivity, fixational area, and saccadic gain. This was also associated with a higher saccadic reversal rate.
Quantitative eye tracking results from complex tasks were less clear. There was a trend towards lower saccade amplitudes and velocities except for driving tasks, in part due to the complexity of the analysis of learned driving behavior. Fixation duration differed depending on task performed (longer when freely viewing images, shorter when viewing video clips). The size of fixation distribution depended on the task (larger when reading and driving; smaller when viewing images, walking) although multiple different measures were used to quantify this with heterogeneous experimental design. Glaucoma patients spent less time fixating on relevant stimuli in several tasks with longer times on irrelevant stimuli pre-task. There was also higher error in navigating obstacle courses. Patients with less disease burden (pre-perimetric glaucoma) also showed impaired eye movements (higher saccade latency, lower saccade amplitude, and more difficulty inhibiting reflexive saccades), often worse in the eye with increased field loss.
The above findings suggest that eye movements may serve as a useful aid to other testings such as visual fields, especially when these are not possible (such as in children and cognitive impairment). In the current practice, clinicians rely on pathological clues (from ocular assessment of slit-lamp biomicroscopy, intra-ocular pressure readings, optical coherence tomography of the optic nerve head and retinal ganglion cell layer, and visual fields) to reliably diagnose and assess progression in glaucoma. Visual field defects are a result of irreversible RGC loss and constitute a late marker of progression. Therefore, earlier biomarkers are required. Integrating eye tracking in visual field assessments for evaluation of saccade metrics combines these investigations in one sitting. In rural and community settings, where optical coherence tomography and visual field assessments may not be available, eye tracking may serve as a low-cost alternative. In addition, integrated eye tracking assessments in activities of daily living (eg driving, reading) may prove useful in more complex assessments of visual function to inform support workers (eg occupational health and low-vision aids) and transport agencies (eg hazard perception in driving assessments). However, this methodology requires substantial development to provide discriminative diagnostic capacity. None of the studies described herein were able to reliably categorize glaucoma patients with sufficient sensitivity and specificity to warrant current implementation in clinical practice. Longitudinal studies would benefit our understanding of how eye tracking metrics change with glaucoma progression on an individual level, rather than cross-sectional comparison of patient cohorts. There is currently insufficient evidence to conclude whether or not eye movement abnormalities precede visual field defects and clinically measurable RGC loss. Harmonization of eye tracking protocols, outcome measures, and analysis techniques would provide greater transparency in this field and allow for comparisons of outcomes. The authors were unable to perform a thorough quantitative meta-analysis of these studies due to such heterogeneity and recognize the limitations of Figures 5–7. Overall, early evidence suggests alterations in eye movement behavior, which should motivate clinicians and researchers to explore this area further.
Conclusion
Eye movements are pathologically altered in glaucoma, but the extent and clinical relevance of these abnormalities require further research. Eye tracking studies have focused on saccades, fixation, OKN, visual search, and real-world tasks such as driving. It is clear from the literature that glaucoma patients experience more difficulty in activities of daily living compared to healthy counterparts. For example, during driving activities, glaucoma patients rely on compensatory head movements and gaze-adapted behaviors. Without these, performance suffered.136,138 In gross-motor tasks, glaucoma patients require longer periods to explore and process their visual environment. In an obstacle course, route planning suffered with increased obstacle contact and decreased multi-tasking ability.161 Reading plain text is one of the most commonly cited difficulties, where patients suffer with not only fine print but also lower contrast fonts.131,132,143 Studies assessing ocular motor behavior in glaucoma are limited by cross-sectional designs, heterogenous methodology, and small sample sizes, which prohibit detailed sub-group analyses and uniform conclusions. Future studies are required to explore oculomotor findings in individual glaucoma progression, along with larger trials evaluating the diagnostic efficacy of combined eye movement outcome measures.
Methods of Literature Search
The MEDLINE and PubMed databases were used for literature search for studies published up to April 24, 2022. Searched keywords and MeSH (medical subject headings) terms were chosen to appropriately reflect the content of this article (Table 9) with article selection according to the PRISMA criteria detailed in Figure 9. We included studies related to eye tracking in glaucoma and excluded any qualitative, questionnaire-based studies without eye tracking metrics. We screened the reference list from each included study to find additional articles in this area. Case reports and conference abstracts were not included.
 |
Table 5 Studies on Eye Movements During Viewing of, and Searching for Targets Within, Static Images in Patients with Glaucoma |
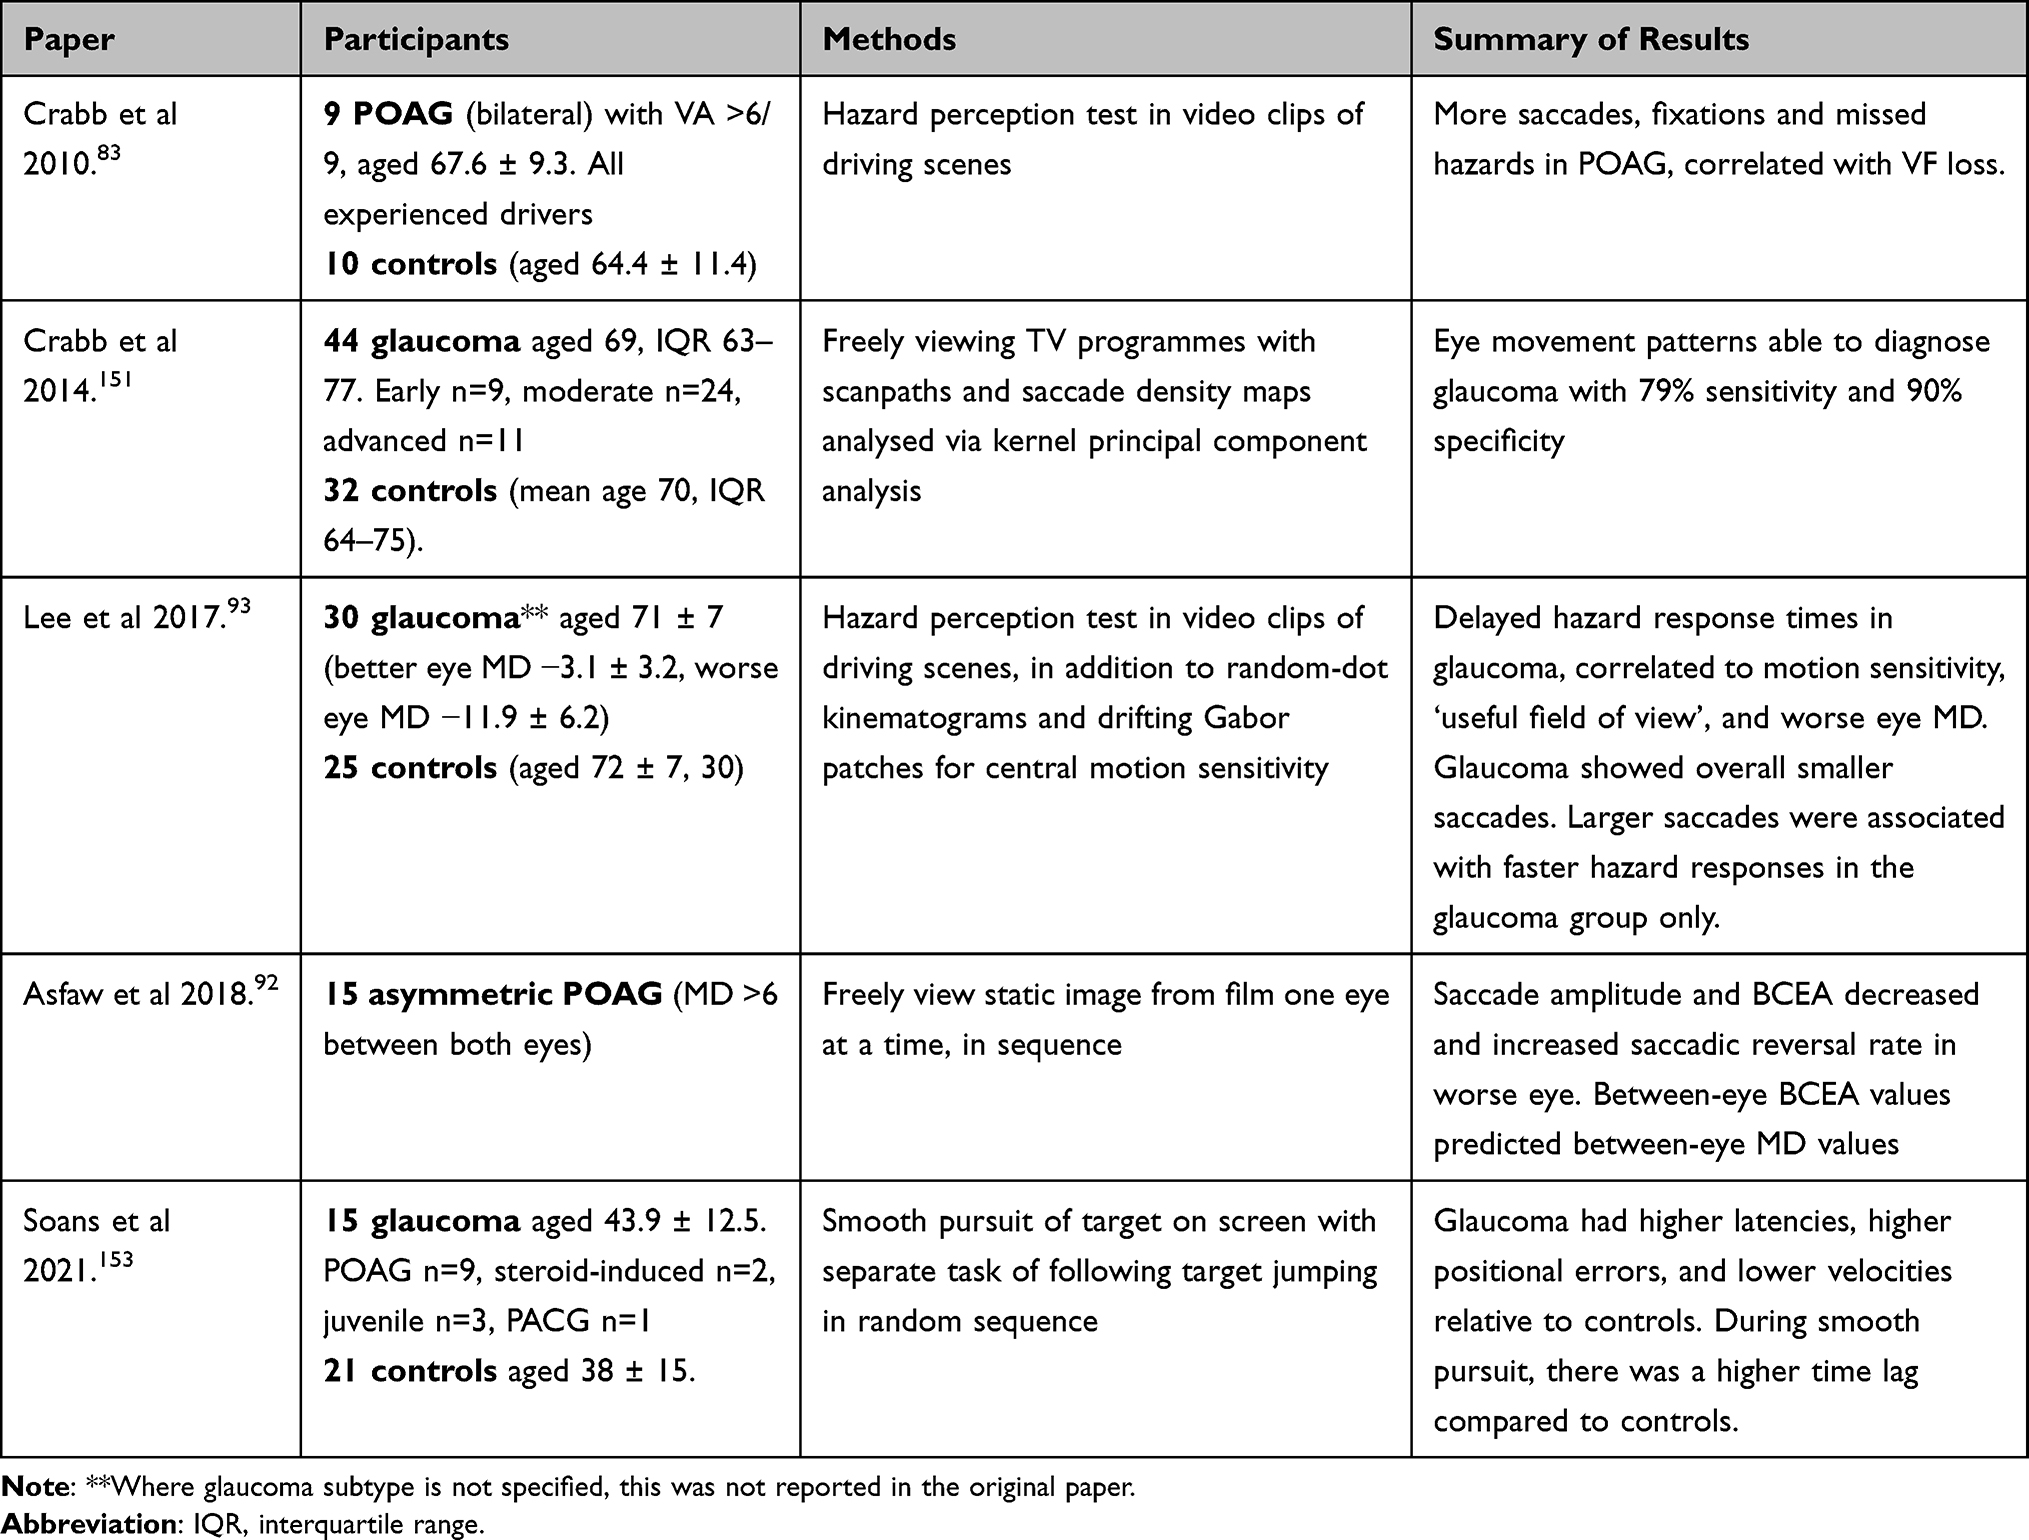 |
Table 6 Studies on Eye Movement During Viewing and Searching for Targets Within Moving Images in Patients with Glaucoma |
 |
Table 7 Studies on Eye Movements While Walking Through an Environment in Patients with Glaucoma |
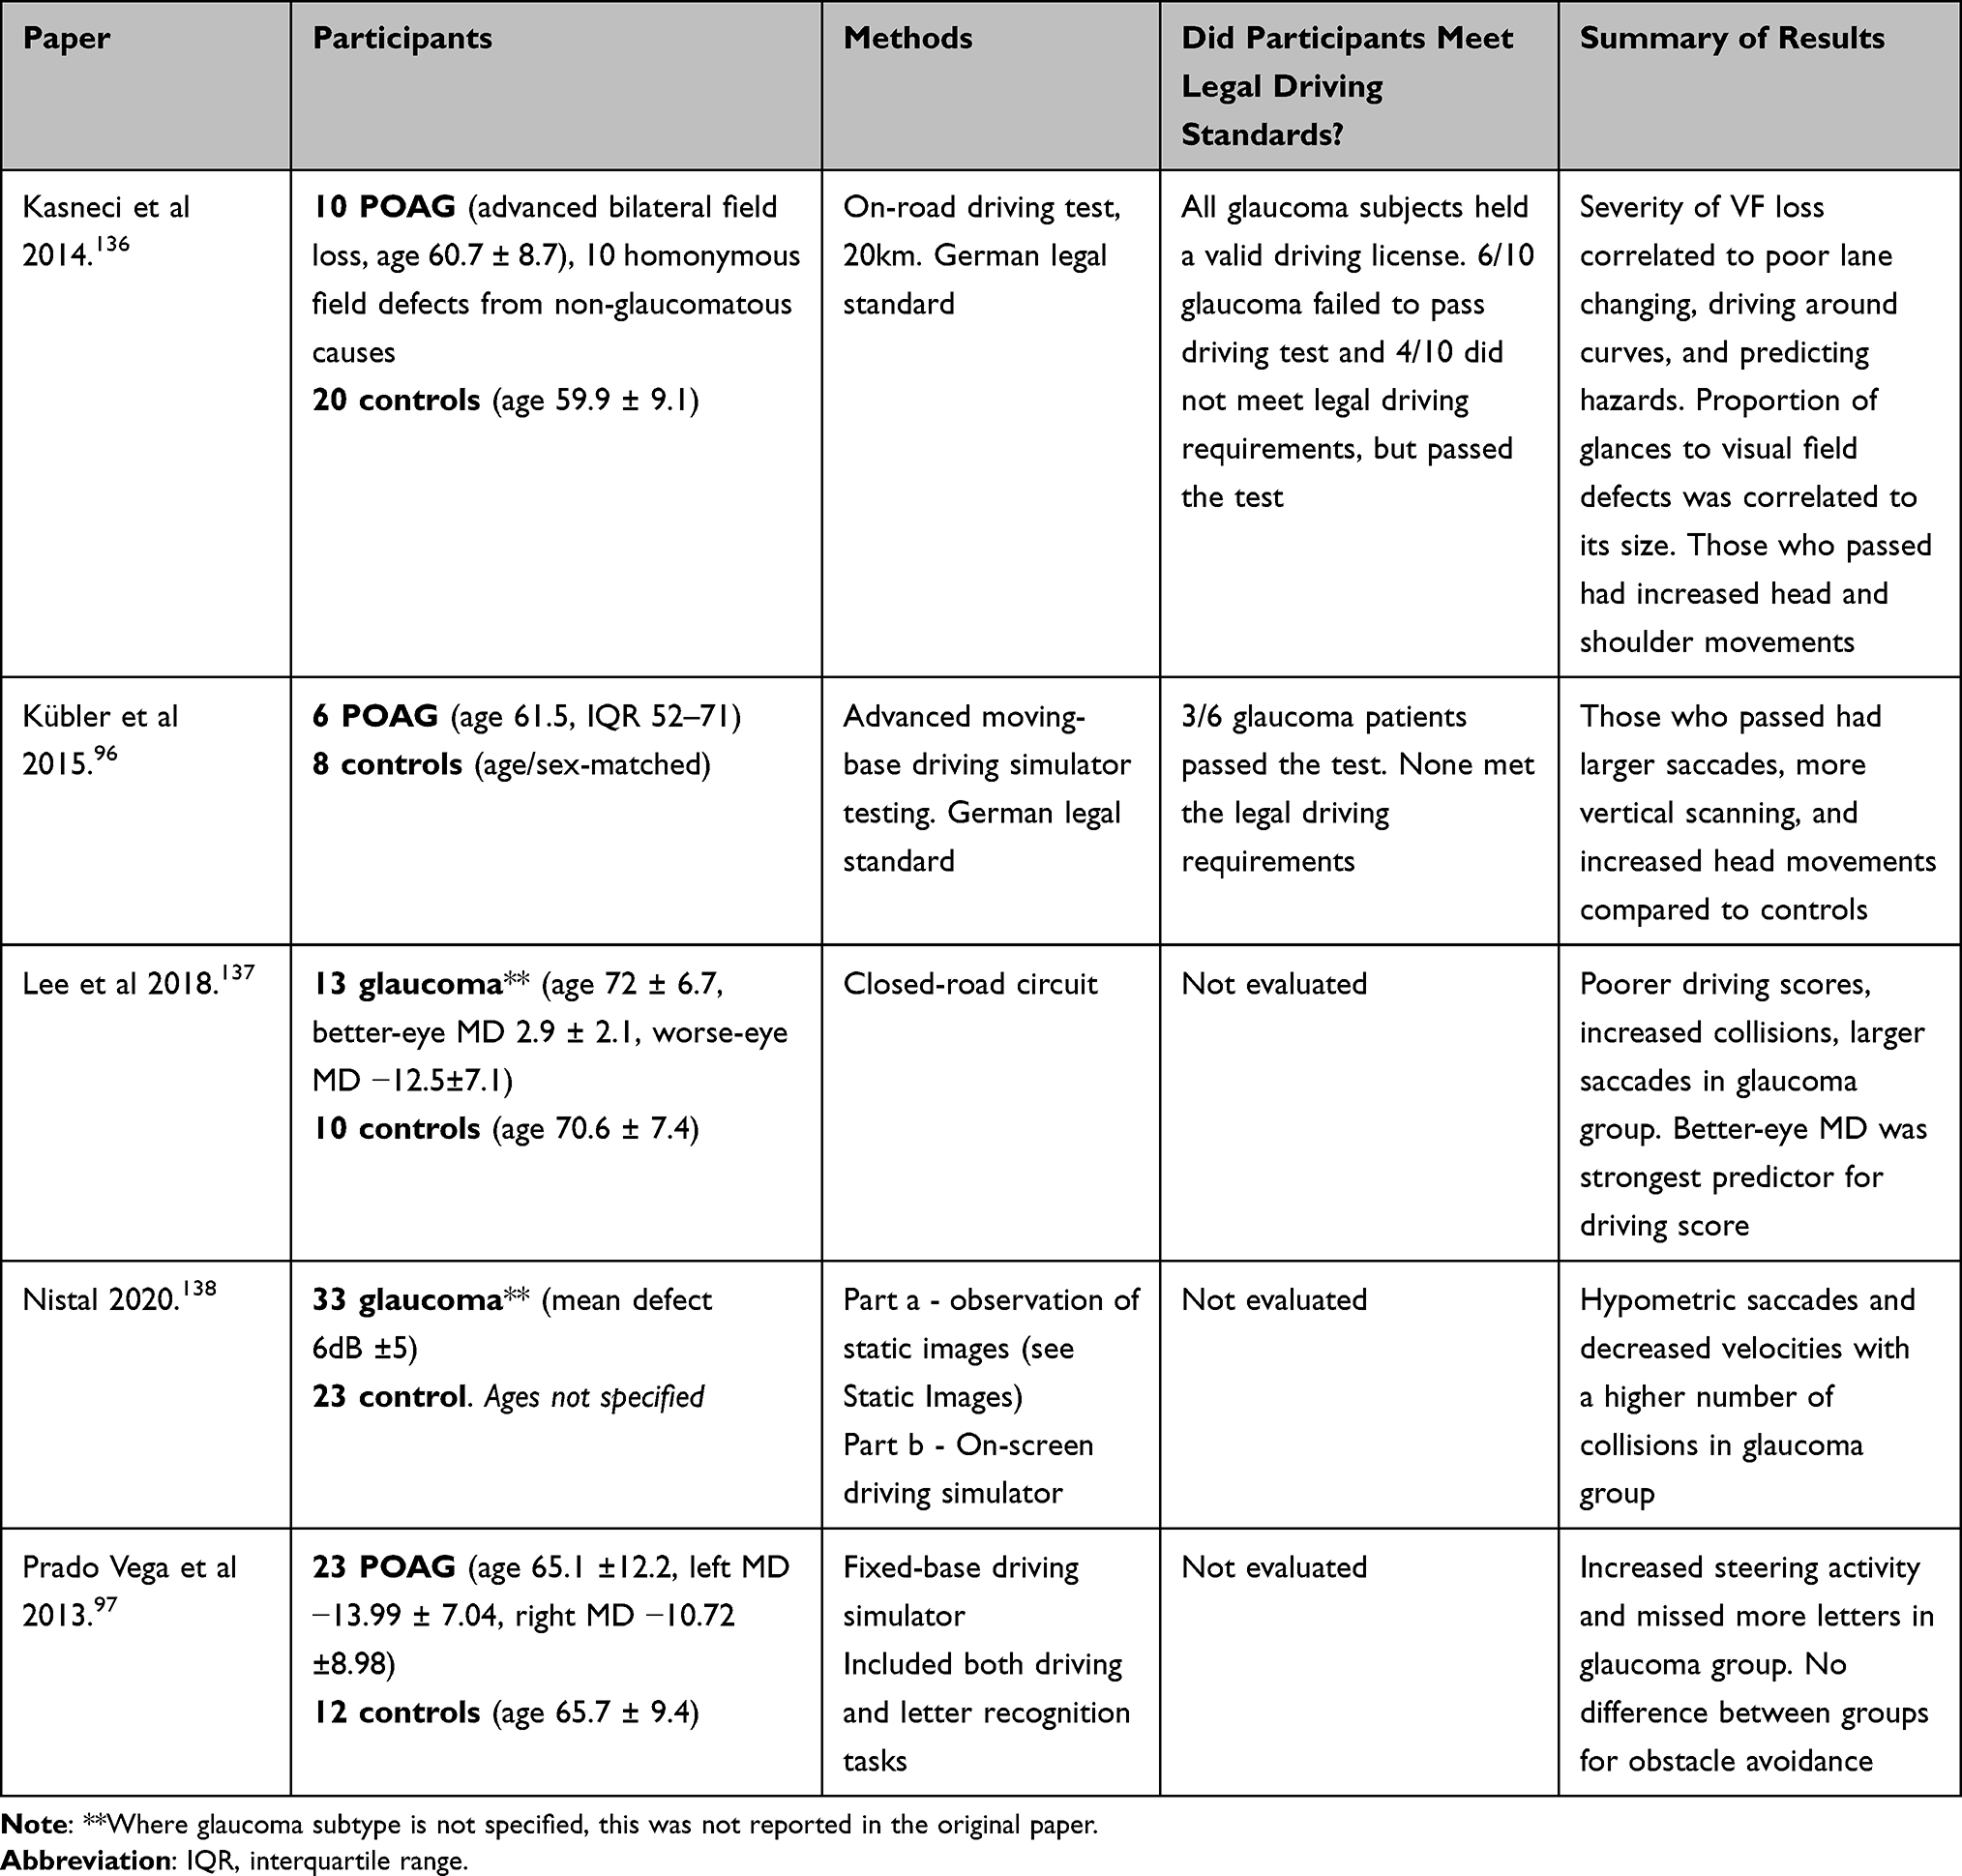 |
Table 8 Studies on Eye Movements During Driving in Patients with Glaucoma |
 |
Table 9 Keywords Included in Search Strategy |
 |
Figure 9 Study selection for review according to PRISMA criteria described in Moher et al 2009.181 |
Abbreviations
BCEA, Bivariate contour ellipse analysis; CN, Cranial Nerves; FEF, Frontal eye field; K, Koniocellular; LGN, Lateral geniculate nucleus; M, Magnocellular; MD, Mean deviation (of visual field test sensitivity, in decibels); NTG, Normal tension glaucoma; OKN, Optokinetic nystagmus; PACG, Primary angle closure glaucoma; P, Parvocellular; POAG, Primary open-angle glaucoma; RGC, Retinal ganglion cell; SC, superior colliculus; SEF, Supplementary eye field.
Author Statement
All authors made a significant contribution to the work reported, whether that is in the conception, study design, execution, analysis and interpretation, or in all these areas; took part in drafting, revising or critically reviewing the article; gave final approval of the version to be published; have agreed on the journal to which the article has been submitted; and agree to be accountable for all aspects of the work.
Disclosure
The authors report no conflicts of interest in this work.
References
1. Quigley HA. Neuronal death in glaucoma. Prog Retin Eye Res. 1999;18(1):39–57. doi:10.1016/S1350-9462(98)00014-7
2. Ramulu PY. Glaucoma and reading speed: the Salisbury eye evaluation project. Arch Ophthalmol. 2009;127(1):82. doi:10.1001/archophthalmol.2008.523
3. Haymes SA, LeBlanc RP, Nicolela MT, Chiasson LA, Chauhan BC. Glaucoma and on-road driving performance. Invest Ophthalmol Vis Sci. 2008;49(7):3035–3041. doi:10.1167/iovs.07-1609
4. Shabana N, Pérès VC, Carkeet A, Chew PTK. Motion perception in glaucoma patients: a review. Surv Ophthalmol. 2003;48(1):92–106. doi:10.1016/S0039-6257(02)00401-0
5. Yücel YH, Zhang Q, Gupta N, Kaufman PL, Weinreb RN. Loss of neurons in magnocellular and parvocellular layers of the lateral geniculate nucleus in glaucoma. Arch Ophthalmol. 2000;118(3):378–384. doi:10.1001/archopht.118.3.378
6. Perry VH, Cowey A. Retinal ganglion cells that project to the superior colliculus and pretectum in the macaque monkey. Neuroscience. 1984;12(4):1125–1137. doi:10.1016/0306-4522(84)90007-1
7. Koller K, Rafal RD. Saccade latency bias toward temporal hemifield: evidence for role of retinotectal tract in mediating reflexive saccades. Neuropsychologia. 2019;128:276–281. doi:10.1016/j.neuropsychologia.2018.01.028
8. Lawlor M, Danesh-Meyer H, Levin LA, Davagnanam I, De Vita E, Plant GT. Glaucoma and the brain: trans-synaptic degeneration, structural change, and implications for neuroprotection. Surv Ophthalmol. 2018;63(3):296–306. doi:10.1016/j.survophthal.2017.09.010
9. Gupta N, Ang L-C, LNd T, Bidaisee L, Yücel YH. Human glaucoma and neural degeneration in intracranial optic nerve, lateral geniculate nucleus, and visual cortex. Br J Ophthalmol. 2006;90(6):674–678. doi:10.1136/bjo.2005.086769
10. Garaci FG, Bolacchi F, Cerulli A, et al. Optic nerve and optic radiation neurodegeneration in patients with glaucoma: in vivo analysis with 3-T Diffusion-Tensor MR Imaging. Radiology. 2009;252(2):496–501. doi:10.1148/radiol.2522081240
11. Yücel YH, Zhang Q, Weinreb RN, Kaufman PL, Gupta N. Effects of retinal ganglion cell loss on magno-, parvo-, koniocellular pathways in the lateral geniculate nucleus and visual cortex in glaucoma. Prog Retin Eye Res. 2003;22(4):465–481. doi:10.1016/S1350-9462(03)00026-0
12. Glovinsky Y, Quigley HA, Dunkelberger GR. Retinal ganglion cell loss is size dependent in experimental glaucoma. Invest Ophthalmol Vis Sci. 1991;32(3):484–491.
13. Boucard CC, Hernowo AT, Maguire RP, et al. Changes in cortical grey matter density associated with long-standing retinal visual field defects. Brain. 2009;132(Pt 7):1898–1906. doi:10.1093/brain/awp119
14. Berdahl JP, Allingham RR, Johnson DH. Cerebrospinal fluid pressure is decreased in primary open-angle glaucoma. Ophthalmology. 2008;115(5):763–768. doi:10.1016/j.ophtha.2008.01.013
15. Berdahl JP, Fautsch MP, Stinnett SS, Allingham RR. Intracranial pressure in primary open angle glaucoma, normal tension glaucoma, and ocular hypertension: a case-control study. Invest Ophthalmol Vis Sci. 2008;49(12):5412–5418. doi:10.1167/iovs.08-2228
16. Ren R, Jonas JB, Tian G, et al. Cerebrospinal fluid pressure in glaucoma: a prospective study. Ophthalmology. 2010;117(2):259–266. doi:10.1016/j.ophtha.2009.06.058
17. Berdahl JP, Allingham RR. Intracranial pressure and glaucoma. Curr Opin Ophthalmol. 2010;21(2):106–111. doi:10.1097/ICU.0b013e32833651d8
18. Iliff JJ, Wang M, Liao Y, et al. A paravascular pathway facilitates CSF flow through the brain parenchyma and the clearance of interstitial solutes, including amyloid β. Sci Transl Med. 2012;4(147):147ra111–147ra111. doi:10.1126/scitranslmed.3003748
19. Wostyn P, De Groot V, Van Dam D, Audenaert K, Killer HE, De Deyn PP. The glymphatic hypothesis of glaucoma: a unifying concept incorporating vascular, biomechanical, and biochemical aspects of the disease. Biomed Res Int. 2017;2017:5123148–5123148. doi:10.1155/2017/5123148
20. Wostyn P, Van Dam D, Audenaert K, Killer HE, De Deyn PP, De Groot V. A new glaucoma hypothesis: a role of glymphatic system dysfunction. Fluids Barriers CNS. 2015;12:16. doi:10.1186/s12987-015-0012-z
21. Ong K, Farinelli A, Billson F, Houang M, Stern M. Comparative study of brain magnetic resonance imaging findings in patients with low-tension glaucoma and control subjects. Ophthalmology. 1995;102(11):1632–1638. doi:10.1016/S0161-6420(95)30816-0
22. Stroman GA, Stewart WC, Golnik KC, Curé JK, Olinger RE. Magnetic resonance imaging in patients with low-tension glaucoma. Arch Ophthalmol. 1995;113(2):168–172. doi:10.1001/archopht.1995.01100020050027
23. Bogorodzki P, Piątkowska-Janko E, Szaflik J, Szaflik JP, Gacek M, Grieb P. Mapping cortical thickness of the patients with unilateral end-stage open angle glaucoma on planar cerebral cortex maps. PLoS One. 2014;9(4):e93682. doi:10.1371/journal.pone.0093682
24. Yu L, Xie L, Dai C, et al. Progressive thinning of visual cortex in primary open-angle glaucoma of varying severity. PLoS One. 2015;10(3):e0121960. doi:10.1371/journal.pone.0121960
25. Zikou AK, Kitsos G, Tzarouchi LC, Astrakas L, Alexiou GA, Argyropoulou MI. Voxel-based morphometry and diffusion tensor imaging of the optic pathway in primary open-angle glaucoma: a preliminary study. AJNR Am J Neuroradiol. 2012;33(1):128–134. doi:10.3174/ajnr.A2714
26. Giorgio A, Zhang J, Costantino F, De Stefano N, Frezzotti P. Diffuse brain damage in normal tension glaucoma. Hum Brain Mapp. 2018;39(1):532–541. doi:10.1002/hbm.23862
27. Hanekamp S, Ćurčić-blake B, Caron B, et al. White matter alterations in glaucoma and monocular blindness differ outside the visual system. Sci Rep. 2021;11(1):6866. doi:10.1038/s41598-021-85602-x
28. Bisley JW, Goldberg ME. Attention, intention, and priority in the parietal lobe. Annu Rev Neurosci. 2010;33:1–21. doi:10.1146/annurev-neuro-060909-152823
29. Connolly JD, Goodale MA, Goltz HC, Munoz DP. fMRI activation in the human frontal eye field is correlated with saccadic reaction time. J Neurophysiol. 2005;94(1):605–611. doi:10.1152/jn.00830.2004
30. Cosman JD, Lowe KA, Zinke W, Woodman GF, Schall JD. Prefrontal Control of Visual Distraction. Curr Biol. 2018;28(3):414–420.e413. doi:10.1016/j.cub.2017.12.023
31. Hikosaka O, Takikawa Y, Kawagoe R. Role of the basal ganglia in the control of purposive saccadic eye movements. Physiol Rev. 2000;80(3):953–978. doi:10.1152/physrev.2000.80.3.953
32. Herzfeld DJ, Kojima Y, Soetedjo R, Shadmehr R. Encoding of action by the Purkinje cells of the cerebellum. Nature. 2015;526(7573):439–442. doi:10.1038/nature15693
33. Catz N, Dicke Peter W, Thier P. Cerebellar-dependent motor learning is based on pruning a Purkinje cell population response. Proce National Acad Sci. 2008;105(20):7309–7314. doi:10.1073/pnas.0706032105
34. Wolf C, Lappe M. Top-down control of saccades requires inhibition of suddenly appearing stimuli. Atten Percept Psychophys. 2020;82(8):3863–3877. doi:10.3758/s13414-020-02101-3
35. Thakkar KN, Heiligenberg FMZ, Neggers R. Speed of saccade execution and inhibition associated with fractional anisotropy in distinct fronto‐frontal and fronto‐striatal white matter pathways. Hum Brain Mapp. 2016;37(8):2811–2822. doi:10.1002/hbm.23209
36. Simó L, Krisky C, Sweeney J. Functional neuroanatomy of anticipatory behavior: dissociation between sensory-driven and memory-driven systems. Cerebral Cortex. 2005;15:1982–1991. doi:10.1093/cercor/bhi073
37. Sweeney JA, Luna B, Keedy SK, McDowell JE, Clementz BA. fMRI studies of eye movement control: investigating the interaction of cognitive and sensorimotor brain systems. NeuroImage. 2007;36:T54–T60. doi:10.1016/j.neuroimage.2007.03.018
38. Ludwig CJ, Gilchrist ID. Stimulus-driven and goal-driven control over visual selection. J Exp Psychol Hum Percept Perform. 2002;28(4):902–912. doi:10.1037/0096-1523.28.4.902
39. Nyffeler T, Hubl D, Wurtz P, Wiest R, Hess CW, Müri RM. Spontaneous recovery of visually-triggered saccades after focal lesions of the frontal and parietal eye fields: a combined longitudinal oculomotor and fMRI study. Clin Neurophysiol. 2011;122(6):1203–1210. doi:10.1016/j.clinph.2010.08.026
40. Wolf C, Lappe M. Vision as oculomotor reward: cognitive contributions to the dynamic control of saccadic eye movements. Cogn Neurodyn. 2021;15(4):547–568. doi:10.1007/s11571-020-09661-y
41. Snegireva N, Derman W, Patricios J, Welman KE. Eye tracking technology in sports-related concussion: a systematic review and meta-analysis. Physiol Meas. 2018;39(12):12TR01. doi:10.1088/1361-6579/aaef44
42. Van Der Stigchel S, Bethlehem RAI, Klein BP, Berendschot TTJM, Nijboer T, Dumoulin SO. Macular degeneration affects eye movement behavior during visual search. Front Psychol. 2013;4. doi:10.3389/fpsyg.2013.00579
43. Prasad S, Galetta SL. Eye movement abnormalities in multiple sclerosis. Neurol Clin. 2010;28(3):641–655. doi:10.1016/j.ncl.2010.03.006
44. Wong A. Neuro-ophthalmology. neuronal control of eye movements. J Neuro Ophthalmol. 2008;28(4):76–89. doi:10.1097/01.wno.0000342371.46043.b8
45. Crawford TJ, Higham S, Renvoize T, et al. Inhibitory control of saccadic eye movements and cognitive impairment in Alzheimer’s disease. Biol Psychiatry. 2005;57(9):1052–1060. doi:10.1016/j.biopsych.2005.01.017
46. Nij Bijvank JA, Petzold A, Coric D, et al. Saccadic delay in multiple sclerosis: a quantitative description. Vision Res. 2020;168:33–41. doi:10.1016/j.visres.2020.01.003
47. McDowell JE, Dyckman KA, Austin BP, Clementz BA. Neurophysiology and neuroanatomy of reflexive and volitional saccades: evidence from studies of humans. Brain Cogn. 2008;68(3):255–270. doi:10.1016/j.bandc.2008.08.016
48. Sparks DL. The brainstem control of saccadic eye movements. Nat Rev Neurosci. 2002;3(12):952–964. doi:10.1038/nrn986
49. Raybourn MS, Keller EL. Colliculoreticular organization in primate oculomotor system. J Neurophysiol. 1977;40(4):861–878. doi:10.1152/jn.1977.40.4.861
50. Miyashita N, Hikosaka O. Minimal synaptic delay in the saccadic output pathway of the superior colliculus studied in awake monkey. Exp Brain Res. 1996;112(2):187–196. doi:10.1007/BF00227637
51. Sanders M, Warrington E, Marshall J, Wieskrantz L. Blindsight”: vision in a field defect. Lancet. 1974;303(7860):707–708. doi:10.1016/S0140-6736(74)92907-9
52. Weiskrantz L, Warrington E, Sanders M, Marshall J. Visual capacity in the hemianopic field following a restricted occipital ablation. Brain. 1974;97(1):709–728. doi:10.1093/brain/97.1.709
53. McPeek RM, Keller EL. Deficits in saccade target selection after inactivation of superior colliculus. Nat Neurosci. 2004;7(7):757–763. doi:10.1038/nn1269
54. Poppel E, Held R, Frost D. Residual visual function after brain wounds involving the central visual pathways in man. Nature. 1973;243(5405):2295–2296. doi:10.1038/243295a0
55. Kato R, Takaura K, Ikeda T, Yoshida M, Isa T. Contribution of the retino‐tectal pathway to visually guided saccades after lesion of the primary visual cortex in monkeys. Eur J Neurosci. 2011;33(11):1952–1960. doi:10.1111/j.1460-9568.2011.07729.x
56. Cowey A, Stoerig P. Projection patterns of surviving neurons in the dorsal lateral geniculate nucleus following discrete lesions of striate cortex: implications for residual vision. Exp Brain Res. 1989;75(3):631–638. doi:10.1007/BF00249914
57. Lyon DC, Nassi JJ, Callaway EM. A disynaptic relay from superior colliculus to dorsal stream visual cortex in macaque monkey. Neuron. 2010;65(2):270–279. doi:10.1016/j.neuron.2010.01.003
58. Berman RA, Wurtz RH. Functional identification of a pulvinar path from superior colliculus to cortical area MT. J Neurosci. 2010;30(18):6342–6354. doi:10.1523/JNEUROSCI.6176-09.2010
59. Sincich LC, Park KF, Wohlgemuth MJ, Horton JC. Bypassing V1: a direct geniculate input to area MT. Nat Neurosci. 2004;7(10):1123–1128. doi:10.1038/nn1318
60. Stepniewska I, Qi HX, Kaas JH. Do superior colliculus projection zones in the inferior pulvinar project to MT in primates? Eur J Neurosci. 1999;11(2):469–480. doi:10.1046/j.1460-9568.1999.00461.x
61. Findlay JM, Walker R. A model of saccade generation based on parallel processing and competitive inhibition. Behav Brain Sci. 1999;22(4):661–674. doi:10.1017/S0140525X99002150
62. Kanjee R, Yücel YH, Steinbach MJ, González EG, Gupta N. Delayed saccadic eye movements in glaucoma. Eye Brain. 2012;4:63–68. doi:10.2147/EB.S38467
63. Ballae Ganeshrao S, Jaleel A, Madicharla S, et al. Comparison of saccadic eye movements among the high tension glaucoma, primary angle closure glaucoma, and normal tension glaucoma. J Glaucoma. 2020;2:548.
64. Lamirel C, Milea D, Cochereau I, Duong M-H, Lorenceau J. Impaired Saccadic eye movement in primary open-angle glaucoma. J Glaucoma. 2014;23(1):23–32. doi:10.1097/IJG.0b013e31825c10dc
65. Mazumdar D, Pel JM, Panday M, et al. Comparison of saccadic reaction time between normal and glaucoma using an eye movement perimeter. Indian J Ophthalmol. 2014;62(1):55. doi:10.4103/0301-4738.126182
66. Najjar RP, Sharma S, Drouet M, et al. Disrupted Eye movements in preperimetric primary open-angle glaucoma. Invest Opthalmol Visual Sci. 2017;58(4):2430. doi:10.1167/iovs.16-21002
67. Tatham AJ, Murray IC, McTrusty AD, et al. Speed and accuracy of saccades in patients with glaucoma evaluated using an eye tracking perimeter. BMC Ophthalmol. 2020;20(1):259. doi:10.1186/s12886-020-01528-4
68. Kalesnykas RP, Hallett PE. Retinal eccentricity and the latency of eye saccades. Vision Res. 1994;34(4):517–531. doi:10.1016/0042-6989(94)90165-1
69. Wheeless LL, Cohen GH, Boynton RM. Luminance as a parameter of the eye-movement control system. JOSA. 1967;57(3):394–400. doi:10.1364/JOSA.57.000394
70. Mazumdar D, Meethal NSK, Panday M, et al. Effect of age, sex, stimulus intensity, and eccentricity on saccadic reaction time in eye movement perimetry. Transl Vis Sci Technol. 2019;8(4):13–13. doi:10.1167/tvst.8.4.13
71. Williams C, Azzopardi P, Cowey A. Nasal and temporal retinal ganglion cells projecting to the midbrain: implications for “blindsight”. Neuroscience. 1995;65(2):577–586. doi:10.1016/0306-4522(94)00489-R
72. Irving EL, Steinbach MJ, Lillakas L, Babu RJ, Hutchings N. Horizontal saccade dynamics across the human life span. Invest Ophthalmol Vis Sci. 2006;47(6):2478–2484. doi:10.1167/iovs.05-1311
73. Schik G, Mohr S, Hofferberth B. Effect of aging on saccadic eye movements to visual and auditory targets. Int Tinnitus J. 2000;6(2):154–159.
74. Warren DE, Thurtell MJ, Carroll JN, Wall M. Perimetric evaluation of saccadic latency, saccadic accuracy, and visual threshold for peripheral visual stimuli in young compared with older adults. Invest Ophthalmol Vis Sci. 2013;54(8):5778–5787. doi:10.1167/iovs.13-12032
75. Thepass G, Lemig H, Vermeer K, Van der Steen J, Pel J. Slowed saccadic reaction times in seemingly normal parts of glaucomatous visual fields. Front Med. 2021;8:679297. doi:10.3389/fmed.2021.679297
76. Condy C, Rivaud-Péchoux S, Ostendorf F, Ploner CJ, Gaymard B. Neural substrate of antisaccades: role of subcortical structures. Neurology. 2004;63(9):1571–1578. doi:10.1212/01.WNL.0000142990.44979.5A
77. Coe BC, Munoz DP. Mechanisms of saccade suppression revealed in the anti-saccade task. Philos Trans R Soc Lond B Biol Sci. 2017;372(1718):20160192. doi:10.1098/rstb.2016.0192
78. Mardanbegi D, Kurauchi ATN, Morimoto CH. An investigation of the distribution of gaze estimation errors in head mounted gaze trackers using polynomial functions. J Eye Mov Res. 2018;11(3). doi:10.16910/jemr.11.3.5
79. Fischer B, Weber H. Express saccades and visual attention. Behav Brain Sci. 1993;16(3):553–567. doi:10.1017/S0140525X00031575
80. Haushofer J, Schiller PH, Kendall G, Slocum WM, Tolias AS. Express saccades: the conditions under which they are realized and the brain structures involved. J Vis. 2002;2(7):174–174. doi:10.1167/2.7.174
81. Nyström M, Holmqvist K. An adaptive algorithm for fixation, saccade, and glissade detection in eyetracking data. Behav Res Methods. 2010;42(1):188–204. doi:10.3758/BRM.42.1.188
82. Krauzlis RJ, Goffart L, Hafed ZM. Neuronal control of fixation and fixational eye movements. Philosophical Transactions Royal Soc B. 2017;372(1718):20160205. doi:10.1098/rstb.2016.0205
83. Crabb DP, Smith ND, Rauscher FG, et al. Exploring eye movements in patients with glaucoma when viewing a driving scene. PLoS One. 2010;5(3):e9710. doi:10.1371/journal.pone.0009710
84. Lee SS-Y, Black AA, Wood JM. Eye movements of drivers with glaucoma on a visual recognition slide test. Optometry Vision Sci. 2019;96(7):484–491. doi:10.1097/OPX.0000000000001395
85. Cheong AMY, Geruschat DR, Congdon N. Traffic gap judgment in people with significant peripheral field loss. Optometry Vision Sci. 2008;85(1):26–36. doi:10.1097/OPX.0b013e31815ed6fd
86. Zabel K, Zabel P, Suwala K, et al. Alterations in fixation indices in primary open-angle glaucoma by microperimetry. J Clin Med. 2022;11(9):2368. doi:10.3390/jcm11092368
87. Møllenbach E, Hansen JP, Lillholm M. Eye movements in gaze interaction. Invest Opthalmol Visual Sci. 2013;16.
88. Subramanian V, Jost RM, Birch EE, Quantitative A. Study of fixation stability in amblyopia. Invest Opthalmol Visual Sci. 2013;54(3):1998. doi:10.1167/iovs.12-11054
89. Nij Bijvank JA, Petzold A, Coric D, et al. Quantification of visual fixation in multiple sclerosis. Invest Opthalmol Visual Sci. 2019;60(5):1372. doi:10.1167/iovs.18-26096
90. Stuart S, Parrington L, Martini D, Peterka R, Chesnutt J, King L. The measurement of eye movements in mild traumatic brain injury: a structured review of an emerging area. Front Sports Active Living. 2020;2:5. doi:10.3389/fspor.2020.00005
91. Tarita-Nistor L, Brent MH, Steinbach MJ, González EG. Fixation stability during binocular viewing in patients with age-related macular degeneration. Invest Opthalmol Visual Sci. 2011;52(3):1887. doi:10.1167/iovs.10-6059
92. Asfaw DS, Jones PR, Mönter VM, Smith ND, Crabb DP. Does Glaucoma alter eye movements when viewing images of natural scenes? A between-eye study. Invest Opthalmol Visual Sci. 2018;59(8):3189. doi:10.1167/iovs.18-23779
93. Lee SS-Y, Black AA, Wood JM. Effect of glaucoma on eye movement patterns and laboratory-based hazard detection ability. PLoS One. 2017;12(6):e0178876. doi:10.1371/journal.pone.0178876
94. Smith ND, Crabb DP, Glen FC, Burton R, Garway-heath david F. Eye movements in patients with glaucoma when viewing images of everyday scenes. Seeing Perceiving. 2012;25(5):471–492. doi:10.1163/187847612X634454
95. Wiecek E, Pasquale LR, Fiser J, Dakin S, Bex PJ. Effects of peripheral visual field loss on eye movements during visual search. Front Psychol. 2012;3. doi:10.3389/fpsyg.2012.00472
96. Kübler TC, Kasneci E, Rosenstiel W, et al. Driving with glaucoma: task performance and gaze movements. Optometry Vision Sci. 2015;92(11):1037–1046. doi:10.1097/OPX.0000000000000702
97. Prado Vega R, Leeuwen PM, Rendón Vélez E, Lemij HG, Winter JCF. Obstacle avoidance, visual detection performance, and eye-scanning behavior of glaucoma patients in a driving simulator: a preliminary study. PLoS One. 2013;8(10):e77294. doi:10.1371/journal.pone.0077294
98. Longhin E, Convento E, Pilotto E, et al. Static and dynamic retinal fixation stability in microperimetry. Can J Ophthalmol. 2013;48(5):375–380. doi:10.1016/j.jcjo.2013.05.021
99. Montesano G, Crabb DP, Jones PR, Fogagnolo P, Digiuni M, Rossetti LM. Evidence for alterations in fixational eye movements in glaucoma. BMC Ophthalmol. 2018;18(1):191. doi:10.1186/s12886-018-0870-7
100. Shi Y, Liu M, Wang X, Zhang C, Huang P. Fixation behavior in primary open angle glaucoma at early and moderate stage assessed by the microPerimeter MP-1:. J Glaucoma. 2013;22(2):169–173. doi:10.1097/IJG.0b013e3182311dce
101. Murata N, Miyamoto D, Togano T, Fukuchi T. Evaluating silent reading performance with an eye tracking system in patients with glaucoma. PLoS One. 2017;12(1):e0170230. doi:10.1371/journal.pone.0170230
102. Crossland MD, Sims M, Galbraith RF, Rubin GS. Evaluation of a new quantitative technique to assess the number and extent of preferred retinal loci in macular disease. Vision Res. 2004;44(13):1537–1546. doi:10.1016/j.visres.2004.01.006
103. Fujii GY, De Juan E, Humayun MS, Sunness JS, Chang TS, Rossi JV. Characteristics of visual loss by scanning laser ophthalmoscope microperimetry in eyes with subfoveal choroidal neovascularization secondary to age-related macular degeneration. Am J Ophthalmol. 2003;136(6):1067–1078. doi:10.1016/S0002-9394(03)00663-9
104. Amore FM, Fasciani R, Silvestri V, et al. Relationship between fixation stability measured with MP-1 and reading performance. Ophthalmic Phys Optics. 2013;33(5):611–617. doi:10.1111/opo.12048
105. Kameda T, Tanabe T, Hangai M, Ojima T, Aikawa H, Yoshimura N. Fixation behavior in advanced stage glaucoma assessed by the MicroPerimeter MP-1. Jpn J Ophthalmol. 2009;53(6):580–587. doi:10.1007/s10384-009-0735-y
106. Molina-Martín A, Pérez-Cambrodí RJ, Piñero DP. Current clinical application of microperimetry: a review. Semin Ophthalmol. 2018;33(5):620–628. doi:10.1080/08820538.2017.1375125
107. Nij Bijvank JA, Petzold A, Balk LJ, et al. A standardized protocol for quantification of saccadic eye movements: dEMoNS. PLoS One. 2018;13(7):e0200695. doi:10.1371/journal.pone.0200695
108. Traynis I, De moraes CG, Raza AS, Liebmann JM, Ritch R, Hood DC. Prevalence and Nature of Early Glaucomatous Defects in the Central 10° of the Visual Field. JAMA Ophthalmol. 2014;132(3):291–297. doi:10.1001/jamaophthalmol.2013.7656
109. Calen Walshe R, Nuthmann A. Asymmetrical control of fixation durations in scene viewing. Vision Res. 2014;100:38–46. doi:10.1016/j.visres.2014.03.012
110. Rayner K, Castelhano MS. Eye Movements During Reading, Scene Perception, Visual Search, and While Looking at Print Advertisements. Taylor & Francis Group/Lawrence Erlbaum Associates; 2008.
111. Buttner U, Kremmyda O. Smooth Pursuit Eye Movements and Optokinetic Nystagmus. Munich: Karger; 2007.
112. Ruehl RM, Hinkel C, Bauermann T, Eulenburg P. Delineating function and connectivity of optokinetic hubs in the cerebellum and the brainstem. Brain Struct Funct. 2017;222(9):4163–4185. doi:10.1007/s00429-017-1461-8
113. Garbutt S. Abnormalities of optokinetic nystagmus in progressive supranuclear palsy. J Neurol Neurosurg Psychiatry. 2004;75(10):1386–1394. doi:10.1136/jnnp.2003.027367
114. Poblano A, Ishiwara K, Ortega P, Mora L, Pineda G, Arriaga E. Thinner abuse alters optokinetic nystagmus parameters. Arch Med Res. 2000;31(2):182–185. doi:10.1016/S0188-4409(00)00047-3
115. Lipper S. Impairment of Optokinetic nystagmus in patients with tardive dyskinesia. Arch Gen Psychiatry. 1973;28(3):331. doi:10.1001/archpsyc.1973.01750330031005
116. Valmaggia C, Rütsche A, Baumann A, et al. Age related change of optokinetic nystagmus in healthy subjects: a study from infancy to senescence. Br J Ophthalmol. 2004;88(12):1577. doi:10.1136/bjo.2004.044222
117. Clément G, Lathan CE. Effects of static tilt about the roll axis on horizontal and vertical optokinetic nystagmus and optokinetic after-nystagmus in humans. Exp Brain Res. 1991;84(2):335–341. doi:10.1007/BF00231454
118. Knapp C, Proudlock F, Gottlob I. OKN asymmetry in human subjects: a literature review. Strabismus. 2013;21:37–49. doi:10.3109/09273972.2012.762532
119. Severt W, Maddess T, Ibbotson M. Employing following eye movements to discriminate normal from glaucoma subjects. Clin Experiment Ophthalmol. 2000;28(3):172–174. doi:10.1046/j.1442-9071.2000.00295.x
120. Doustkouhi SM, Turnbull PRK, Dakin SC. The effect of simulated visual field loss on optokinetic nystagmus. Transl Vis Sci Technol. 2020;9(3):25. doi:10.1167/tvst.9.3.25
121. Shin YJ, Park KH, Hwang J-M, Wee WR, Lee JH, Lee IB. Objective measurement of visual acuity by optokinetic response determination in patients with ocular diseases. Am J Ophthalmol. 2006;141(2):327–332. doi:10.1016/j.ajo.2005.09.025
122. Tong J, Wang J, Sun F. Dual-directional optokinetic nystagmus elicited by the intermittent display of gratings in primary open-angle glaucoma and normal eyes. Curr Eye Res. 2002;25(6):355–362. doi:10.1076/ceyr.25.6.355.14236
123. Abe H, Hasegawa S, Takagi M, Yoshizawa T, Usui T. Contrast sensitivity for the stationary and drifting vertical stripe patterns in patients with optic nerve disorders. Ophthalmologica. 1993;207(2):100–105. doi:10.1159/000310413
124. Gracitelli C, Abe R, Diniz-Filho A, Vaz-de-lima F, Paranhos A, Medeiros F. Ophthalmology Issues in Schizophrenia. Curr Psychiatry Rep. 2015;17:569. doi:10.1007/s11920-015-0569-x
125. Klistorner AI, Graham SL. Early magnocellular loss in glaucoma demonstrated using the pseudorandomly stimulated flash visual evoked potential. J Glaucoma. 1999;8(2):140–148. doi:10.1097/00061198-199904000-00010
126. Quigley HA, Dunkelberger GR, Green WR. Chronic human glaucoma causing selectively greater loss of large optic nerve fibers. Ophthalmology. 1988;95(3):357–363. doi:10.1016/S0161-6420(88)33176-3
127. Weber AJ, Harman CD. Structure-function relations of parasol cells in the normal and glaucomatous primate retina. Invest Ophthalmol Vis Sci. 2005;46(9):3197–3207. doi:10.1167/iovs.04-0834
128. Ansari EA, Morgan JE, Snowden RJ. Psychophysical characterisation of early functional loss in glaucoma and ocular hypertension. Br J Ophthalmol. 2002;86(10):1131–1135. doi:10.1136/bjo.86.10.1131
129. Maunsell JH, Nealey TA, DePriest DD. Magnocellular and parvocellular contributions to responses in the middle temporal visual area (MT) of the macaque monkey. J Neurosci. 1990;10(10):3323. doi:10.1523/JNEUROSCI.10-10-03323.1990
130. Burr DC, Morrone MC, Ross J. Selective suppression of the magnocellular visual pathway during saccadic eye movements. Nature. 1994;371(6497):511–513. doi:10.1038/371511a0
131. Burton R, Crabb DP, Smith ND, Glen FC, Garway-Heath DF. Glaucoma and Reading: exploring the Effects of Contrast Lowering of Text. Optometry Vision Sci. 2012;89(9):1282–1287. doi:10.1097/OPX.0b013e3182686165
132. Burton R, Smith ND, Crabb DP. Eye movements and reading in glaucoma: observations on patients with advanced visual field loss. Graefe’s Arch Clin Exp Ophthalmol. 2014;252(10):1621–1630. doi:10.1007/s00417-014-2752-x
133. Cerulli A, Cesareo M, Ciuffoletti E, et al. Evaluation of eye movements pattern during reading process in patients with glaucoma: a microperimeter study. Invest Opthalmol Visual Sci. 2013;6.
134. Ishii M, Seki M, Harigai R, Abe H, Fukuchi T. Reading performance in patients with glaucoma evaluated using the MNREAD charts. Jpn J Ophthalmol. 2013;57(5):471–474. doi:10.1007/s10384-013-0259-3
135. Smith ND, Glen FC, Mönter VM, Crabb DP. Using eye tracking to assess reading performance in patients with glaucoma: a within-person study. J Ophthalmol. 2014;2014:1–10. doi:10.1155/2014/120528
136. Kasneci E, Sippel K, Aehling K, et al. Driving with binocular visual field loss? A study on a supervised on-road parcours with simultaneous eye and head tracking. PLoS One. 2014;9(2):e87470. doi:10.1371/journal.pone.0087470
137. Lee SS-Y, Black AA, Wood JM. Scanning behavior and daytime driving performance of older adults with glaucoma. J Glaucoma. 2018;27(6):558–565. doi:10.1097/IJG.0000000000000962
138. Martínez-Almeida Nistal I, Lampreave Acebes P, Martínez-de-la-casa JM, Sánchez-González P. Validation of virtual reality system based on eye-tracking technologies to support clinical assessment of glaucoma. Eur J Ophthalmol. 2020;1:112067212097604.
139. Wood JM, Black AA, Mallon K, Thomas R, Owsley C. Glaucoma and driving: on-road driving characteristics. PLoS One. 2016;11(7):e0158318. doi:10.1371/journal.pone.0158318
140. Sippel K. Smooth pursuit eye movements and optokinetic nystagmus. In: Straube A, Büttner U, editors. Neuro-ophthalmology: Neuronal Control of Eye Moments. Basel [Switzerland]; New York: Karger. 2007:76–89.
141. Crabb DP, Smith ND, Glen FC, Burton R, Garway-Heath DF. How Does Glaucoma Look? Ophthalmology. 2013;120(6):1120–1126. doi:10.1016/j.ophtha.2012.11.043
142. Nelson P, Aspinall P, O’Brien C. Patients’ perception of visual impairment in glaucoma: a pilot study. Br J Ophthalmol. 1999;83(5):546–552. doi:10.1136/bjo.83.5.546
143. Altangerel U, Spaeth GL, Steinmann WC. Assessment of function related to vision (AFREV). Ophthalmic Epidemiol. 2006;13(1):67–80. doi:10.1080/09286580500428500
144. Chen A-H, Jufri S, Congdon N. The impact of glaucomatous visual field defects on speed and eye movements during reading. Siriraj Med J. 2021;73(1):17–25. doi:10.33192/Smj.2021.03
145. Burton R, Saunders LJ, Crabb DP. Areas of the visual field important during reading in patients with glaucoma. Jpn J Ophthalmol. 2015;59(2):94–102. doi:10.1007/s10384-014-0359-8
146. Murata H, Hirasawa H, Aoyama Y, et al. Identifying areas of the visual field important for quality of life in patients with glaucoma. PLoS One. 2013;8(3):e58695. doi:10.1371/journal.pone.0058695
147. Stein J. The magnocellular theory of developmental dyslexia. Dyslexia. 2001;7(1):12–36. doi:10.1002/dys.186
148. Stein J, Talcott J. Impaired neuronal timing in developmental dyslexia—the magnocellular hypothesis. Dyslexia. 1999;5(2):59–77. doi:10.1002/(SICI)1099-0909(199906)5:2<59::AID-DYS134>3.0.CO;2-F
149. Smith ND, Glen FC, Crabb DP. Eye movements during visual search in patients with glaucoma. BMC Ophthalmol. 2012;12(1):45. doi:10.1186/1471-2415-12-45
150. Glen FC, Smith ND, Crabb DP. Saccadic eye movements and face recognition performance in patients with central glaucomatous visual field defects. Vision Res. 2013;82:42–51. doi:10.1016/j.visres.2013.02.010
151. Crabb DP, Smith ND, Zhu H. What’s on TV? Detecting age-related neurodegenerative eye disease using eye movement scanpaths. Front Aging Neurosci. 2014;6. doi:10.3389/fnagi.2014.00312
152. Wetzel SJ. Unsupervised learning of phase transitions: from principal component analysis to variational autoencoders. Physical Review E. 2017;96(2):022140. doi:10.1103/PhysRevE.96.022140
153. Soans RS, Grillini A, Saxena R, Renken RJ, Gandhi TK, Cornelissen FW. Eye-movement-based assessment of the perceptual consequences of glaucomatous and neuro-ophthalmological visual field defects. Transl Vis Sci Technol. 2021;10(2):1. doi:10.1167/tvst.10.2.1
154. Black AA, Wood JM, Lovie-Kitchin JE. Inferior field loss increases rate of falls in older adults with glaucoma. Optometry Vision Sci. 2011;88(11):1275–1282. doi:10.1097/OPX.0b013e31822f4d6a
155. Friedman DS, Freeman E, Munoz B, Jampel HD, West SK. Glaucoma and mobility performance: the salisbury eye evaluation project. Ophthalmology. 2007;114(12):2232–2237.e2231. doi:10.1016/j.ophtha.2007.02.001
156. Haymes SA, LeBlanc RP, Nicolela MT, Chiasson LA, Chauhan BC. Risk of falls and motor vehicle collisions in glaucoma. Invest Ophthalmol Vis Sci. 2007;48(3):1149–1155. doi:10.1167/iovs.06-0886
157. Lamoreux EL, Chong E, Wang JJ, et al. Visual impairment, causes of vision loss, and falls: the Singapore Malay eye study. Invest Ophthalmol Vis Sci. 2008;49(2):528–533. doi:10.1167/iovs.07-1036
158. Turano KA, Rubin GS, Quigley HA. Mobility Performance in Glaucoma. Invest Ophthalmol Vis Sci. 1999;40(12):2803–2809.
159. Shabana N, Cornilleau-Pérès V, Droulez J, Goh JC, Lee GS, Chew PT. Postural stability in primary open angle glaucoma. Clin Exp Ophthalmol. 2005;33(3):264–273. doi:10.1111/j.1442-9071.2005.01003.x
160. Black AA, Wood JM, Lovie-Kitchin JE, Newman BM. Visual impairment and postural sway among older adults with glaucoma. Optom Vis Sci. 2008;85(6):489–497. doi:10.1097/OPX.0b013e31817882db
161. Lajoie K, Miller AB, Strath RA, Neima DR, Marigold DS. Glaucoma-related differences in gaze behavior when negotiating obstacles. Transl Vis Sci Technol. 2018;7(4):10. doi:10.1167/tvst.7.4.10
162. Sippel K, Kasneci E, Aehling K, et al. Binocular glaucomatous visual field loss and its impact on visual exploration - a supermarket study. PLoS One. 2014;9(8):e106089. doi:10.1371/journal.pone.0106089
163. Geruschat DR, Hassan SE, Turano KA, Quigley HA, Congdon NG. Gaze behavior of the visually impaired during street crossing. Optometry Vision Sci. 2006;83(8):550–558. doi:10.1097/01.opx.0000232219.23362.a6
164. Dive S, Rouland JF, Lenoble Q, Szaffarczyk S, McKendrick AM, Boucart M. Impact of peripheral field loss on the execution of natural actions: a study with glaucomatous patients and normally sighted people. J Glaucoma. 2016;25(10):e889–e896. doi:10.1097/IJG.0000000000000402
165. Goh YW, Ang GS, Azuara‐Blanco A. Lifetime visual prognosis of patients with glaucoma. Clin Experiment Ophthalmol. 2011;39(8):766–770. doi:10.1111/j.1442-9071.2011.02559.x
166. Saunders LJ, Russell RA, Crabb DP. Practical landmarks for visual field disability in glaucoma. Br J Ophthalmol. 2012;96(9):1185. doi:10.1136/bjophthalmol-2012-301827
167. Andersson R, Nystrom M, Holmqvist K. Sampling frequency and eye-tracking measures: how speed affects durations, latencies, and more. J Eye Mov Res. 2010;3(3):1–12. doi:10.16910/jemr.3.3.6
168. Holmqvist K, Andersson R. Eye Tracking: A Comprehensive Guide to Methods, Paradigms, and Measures.
169. Chris W, David CB Analysis of eye-tracking experiments performed on a Tobii T60. Paper presented at: Proc.SPIE; 2008.
170. Hooge ITC, Holleman GA, Haukes NC, Hessels RS. Gaze tracking accuracy in humans: one eye is sometimes better than two. Behav Res Methods. 2019;51(6):2712–2721. doi:10.3758/s13428-018-1135-3
171. Mazumdar D, Meethal NSK, George R, Pel JJM. Saccadic reaction time in mirror image sectors across horizontal Meridian in eye movement perimetry. Sci Rep. 2021;11(1):2630. doi:10.1038/s41598-021-81762-y
172. Sylvester R, Josephs O, Driver J, Rees G. Visual fMRI responses in human superior colliculus show a temporal–nasal asymmetry that is absent in lateral geniculate and visual cortex. J Neurophysiol. 2007;97(2):1495–1502. doi:10.1152/jn.00835.2006
173. Waitzman DM, Ma TP, Optican LM, Wurtz RH. Superior colliculus neurons mediate the dynamic characteristics of saccades. J Neurophysiol. 1991;66(5):1716–1737. doi:10.1152/jn.1991.66.5.1716
174. Smalianchuk I, Jagadisan UK, Gandhi NJ. Instantaneous midbrain control of saccade velocity. J Neurosci. 2018;38(47):10156. doi:10.1523/JNEUROSCI.0962-18.2018
175. Bergeron A, Guitton D. The superior colliculus and its control of fixation behavior via projections to brainstem omnipause neurons. Prog Brain Res. 2001;134:97–107.
176. Chen H, Zhao Y, Liu M, et al. Progressive degeneration of retinal and superior collicular functions in mice with sustained ocular hypertension. Invest Ophthalmol Vis Sci. 2015;56(3):1971–1984. doi:10.1167/iovs.14-15691
177. Zhang S, Wang H, Lu Q, et al. Detection of early neuron degeneration and accompanying glial responses in the visual pathway in a rat model of acute intraocular hypertension. Brain Res. 2009;1303:131–143. doi:10.1016/j.brainres.2009.09.029
178. King WM, Sarup V, Sauvé Y, Moreland CM, Carpenter DO, Sharma SC. Expansion of visual receptive fields in experimental glaucoma. Vis Neurosci. 2006;23(1):137–142. doi:10.1017/S0952523806231122
179. Crish SD, Sappington RM, Inman DM, Horner PJ, Calkins DJ. Distal axonopathy with structural persistence in glaucomatous neurodegeneration. Proce National Acad Sci. 2010;107(11):5196–5201. doi:10.1073/pnas.0913141107
180. Martinez-Conde S, Macknik SL, Hubel DH. The role of fixational eye movements in visual perception. Nat Rev Neurosci. 2004;5(3):229–240. doi:10.1038/nrn1348
181. Moher D, Liberati A, Tetzlaff J, Altman DG. Preferred reporting items for systematic reviews and meta-analyses: the PRISMA statement. PLoS Med. 2009;6(7):e1000097. doi:10.1371/journal.pmed.1000097
 © 2022 The Author(s). This work is published and licensed by Dove Medical Press Limited. The full terms of this license are available at https://www.dovepress.com/terms.php and incorporate the Creative Commons Attribution - Non Commercial (unported, v3.0) License.
By accessing the work you hereby accept the Terms. Non-commercial uses of the work are permitted without any further permission from Dove Medical Press Limited, provided the work is properly attributed. For permission for commercial use of this work, please see paragraphs 4.2 and 5 of our Terms.
© 2022 The Author(s). This work is published and licensed by Dove Medical Press Limited. The full terms of this license are available at https://www.dovepress.com/terms.php and incorporate the Creative Commons Attribution - Non Commercial (unported, v3.0) License.
By accessing the work you hereby accept the Terms. Non-commercial uses of the work are permitted without any further permission from Dove Medical Press Limited, provided the work is properly attributed. For permission for commercial use of this work, please see paragraphs 4.2 and 5 of our Terms.