")
Back to Journals » Journal of Healthcare Leadership » Volume 15
Do Organizational Values and Leadership Impact Staff Engagement, Wellbeing, and Patient Satisfaction?
Authors Kang JY , Lee MK, Fairchild EM, Caubet SL, Peters DE, Matti L, Howell TG Jr
Received 17 May 2023
Accepted for publication 29 August 2023
Published 11 September 2023 Volume 2023:15 Pages 209—219
DOI https://doi.org/10.2147/JHL.S421692
Checked for plagiarism Yes
Review by Single anonymous peer review
Peer reviewer comments 4
Editor who approved publication: Dr Pavani Rangachari
Ji Yun Kang,1 Minji K Lee,2 Erin M Fairchild,3 Suzanne L Caubet,1 Dawn E Peters,4 Linda Matti,1 Thomas G Howell Jr5
1Human Resources, Mayo Clinic, Rochester, MN, USA; 2Quantitative Health Sciences, Mayo Clinic, Rochester, MN, USA; 3Office of Patient Experience, Mayo Clinic, Rochester, MN, USA; 4Quality Management, Mayo Clinic, Phoenix, AZ, USA; 5Ob/Gyn, Mayo Clinic, Faribault, MN, USA
Correspondence: Ji Yun Kang, Department of Human Resources, Mayo Clinic, 200 First Street SW, Rochester, MN, 55905, USA, Tel +1 507 250 5834, Email [email protected]
Purpose: Organizational culture has been shown to be an important characteristic that influences behaviors of groups and individuals within an organization. This study seeks to examine the relationships among various organizational values, staff engagement, staff wellbeing, and patient satisfaction in community hospitals.
Participants and Methods: Organizational values and engagement data were retrieved from all-staff survey results from 387 clinical units at Mayo Clinic Health Systems. For patient satisfaction data, Press Ganey scores were matched with data for 17 outpatient units from the all-staff survey. Cluster analysis was used to create constructs from the staff satisfaction survey. Reliability was obtained using Cronbach’s alpha. Structural equation modeling (SEM) was used to create the measurement model for prediction of constructs. Correlation was used to examine the relationship between culture and patient satisfaction.
Results: From the all-staff survey results, we identified nine constructs related to organizational cultural values, staff well-being, and employee engagement. We were able to determine a structural equation model for values and engagement that had an excellent fit. Staff’s sense of fairness had a significant impact on how staff provide service excellence. Cultural values of excellence and innovation were positively correlated with large effect size in ten out of eleven patient satisfaction measurement domains and all were statistically significant.
Conclusion: Values of excellence had a larger positive relationship with patient satisfaction than all other variables. How staff perceive the level of the organization’s commitment to its values had impact on both staff engagement and wellbeing. This study also showed that the construct of wellbeing and patient satisfaction scores are not correlated. Staff will strive to provide excellent experience and good patient care regardless of their state of wellbeing.
Keywords: culture, values, engagement, well-being, patient satisfaction
Introduction
This study is part 2 of our previous study on organizational culture, staff engagement and patient satisfaction in an academic medical center.1 Our previous study focused on the academic medical setting where this study focuses on a community practice setting.
Organizational culture has been shown to be an important characteristic that influences behaviors of groups and individuals within an organization. Organizational culture is categorized in three different levels: artifacts, espoused belief and values, and basic underlying assumptions.2 Shared organizational values provide comfort, meaning, and purpose to employees. Pololi et al3 have stated that when there is cultural alignment and congruence between organizational cultural values and individual values, employees are committed, more engaged, and perform better. According to Kotrba et al,4 examples of various indices that are positively related with organizational performance include organizational mission, adaptability, competitiveness, entrepreneurial culture, and innovation. When organizations value individual development, team collaboration, and communication, they are known to have positive relationships with relational leadership style and high performance.5 An organization’s cultural values and the work environment it creates serve as a foundation for staff’s discretionary effort toward their work.6 When staff have a positive perspective about the organizational culture, it influences their willingness to engage and enhances the citizenship behaviors characterized by helping, taking charge, and being creative.7
Organizational leaders play a key role in creating and maintaining a culture of high performance. Leading in a 21st century healthcare environment requires competence with leading teams, telehealth, rapid changes in technology, digital transformation, diversity, and the VUCA (vague, uncertain, complex, ambiguous) environment.8 Effective leaders help staff understand and interpret complex problems, foster trust and respect, facilitate learning, advocate for resources, and promote social justice.9 Leaders create the environment that empowers employees to deliver safe, patient-centered care by team collaboration, creativity, and effective communication. Leaders who empower staff have strong interpersonal skills, are inclusive, coach, mentor, and provide ongoing feedback. Leaders who create a workplace culture of inclusiveness, trust, and psychological safety foster positive emotion (eg being more open-minded, resilient, motivated, and persistent), which positively influence employee engagement and ultimately the patient experience.10–12
Tzeng, Ketefian, and Redman13 describe the strength of organizational culture as the extent to which the staff view the organization as having clear direction and aligned values, which was shown to positively correlate with job and patient satisfaction. Patient satisfaction is an important measure of clinical outcomes and health care performance. In a systematic review, Braithwaite et al14 found that culture was positively associated with a range of patient outcomes; mortality rates, failure to rescue, readmission rates, adverse events and medication errors. Also included are well-being outcomes, notably patient satisfaction, quality of life, and patient mood. A more human relation-centered culture was also found to enhance patient satisfaction.15.
With recent healthcare reform, providing values to patients is more important than ever. Yet there has not been an extensive study linking organizational culture and leadership with patient outcome. Against this backdrop, the purpose of this study is to examine the relationship between organizational cultural values, staff engagement, staff wellbeing and how those impact patient satisfaction. We intend to answer the research question of “how does organization values and culture impact staff engagement, well-being, and ultimately patient satisfaction?”
Materials and Methods
This study consists of two parts. The first part focuses on studying the relationships among values and engagement and the second part of the study focuses on relationships among values, engagement, staff well-being, and patient satisfaction scores.
Samples and Measures
Organizational Values, Employee Engagement, and Burnout
We retrieved the sample data from the November 2018 All-Staff Survey from entire community Health System sites consisting of 387 units to measure the organizational values and employee engagement. All the survey results were rolled up to the unit level to ensure anonymity of the respondents. Unit refers to all clinical work groups with five or more staff reporting to the supervisor. This survey was not originally designed for assessing cultural values. However, we found that most questions were relevant for assessing the staff’s perception of the degree of how much organizational cultural values aligned at the unit level. During the initial stage, researchers consisting of a physician, Human Resources and Quality staff examined the content questions to ensure they mapped to relevant organizational values, including assessing the feasibility of using the existing survey prior to running a cluster analysis which identified nine constructs.
Patient Satisfaction
Press Ganey served as our vendor, measuring patient satisfaction. To examine the relationships between values data from the All-Staff Survey described in Organizational Values, Employee Engagement, and Burnout and patient satisfaction data, we matched the business units used for the two surveys. We pulled the patient satisfaction data that matched the All-Staff survey administration date. With All-Staff survey work units being more granular than patient satisfaction data, the business units were condensed into larger level units which serve as the unit of analysis for this part of the study. This generated a sample size of seventeen units encompassing all four health system sites in Minnesota and Wisconsin.
Data Analysis
Cluster Analysis
Without a priori hypothesis of any item-to-construct relationships, we built constructs using a cluster analysis. All items from both All Staff Survey and patient satisfaction data were entered in cluster analysis. Cluster analysis partitions variables to homogeneous classes. Hierarchical agglomerative cluster analyses were performed using Ward’s method with squared Euclidean Distance as the distance measure. It identifies items that are close in the distance measure and arranges the clusters of the related items in a tree diagram (ie, dendrogram). The content matter experts reviewed the solution from the cluster analysis and gave names to the clusters of items (ie, constructs).
Structural Equation Modeling (SEM)
We conducted structural equation modeling (SEM) to explore the relationships among the nine constructs. The nine variables were (1) Organizational-level commitment to values, (2) Empowering leadership (3) Wellbeing, (4) Sense of belonging, (5) Staff engagement, (6) Teamwork/trust, (7) Psychological safety, (8) Fairness, and (9) Excellence and innovation.16 The first step for SEM involved testing the relationship between each of the nine factors and the items that were hypothesized to measure it. The diagram that summarizes the measurement model is presented in Figure 1, and the content of the items and their respective factor are presented in Table 1 and Table 2. The fit of the measurement model was inspected with the guidelines that are indicative of a desirable model fit, which was a joint criterion of Standardized Root Mean square Residual (SRMR) ≤0.09 and Root Mean Square Error of Approximation (RMSEA) ≤0.06.16 In addition, the reliabilities of the domains were investigated by coefficient alpha.
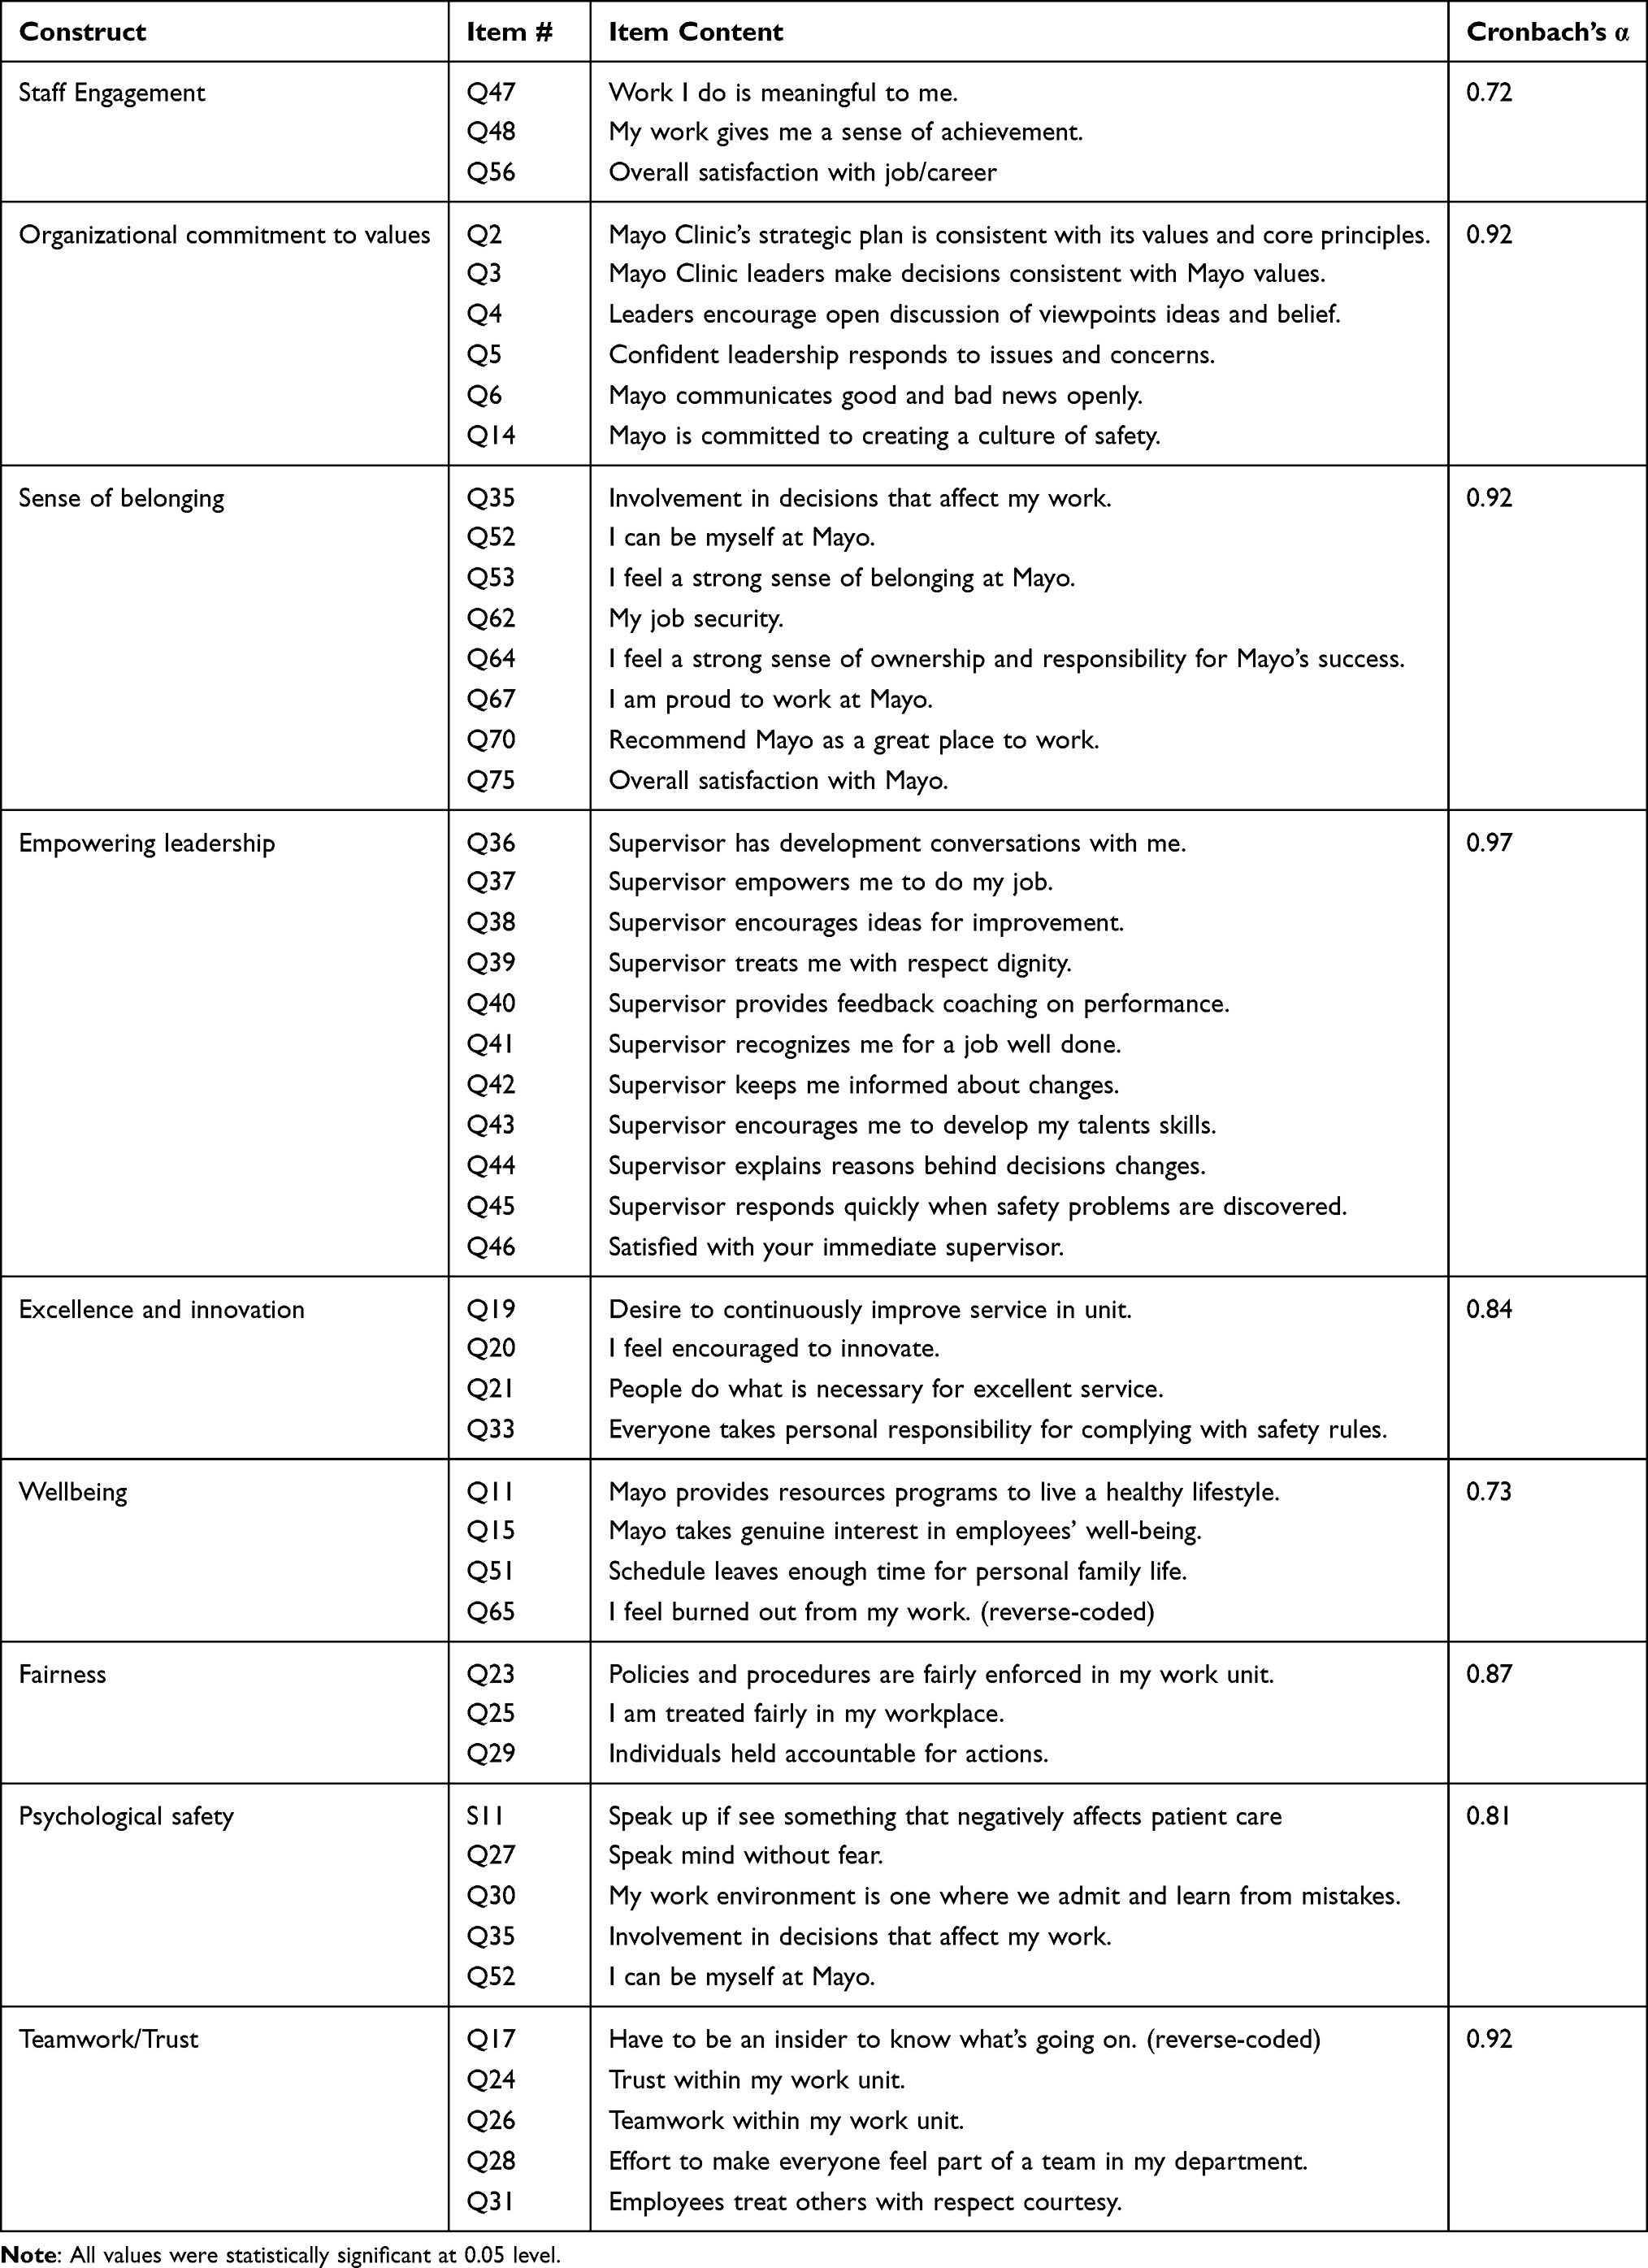 |
Table 1 Correlations Among Factors from the Second-Order Measurement Model |
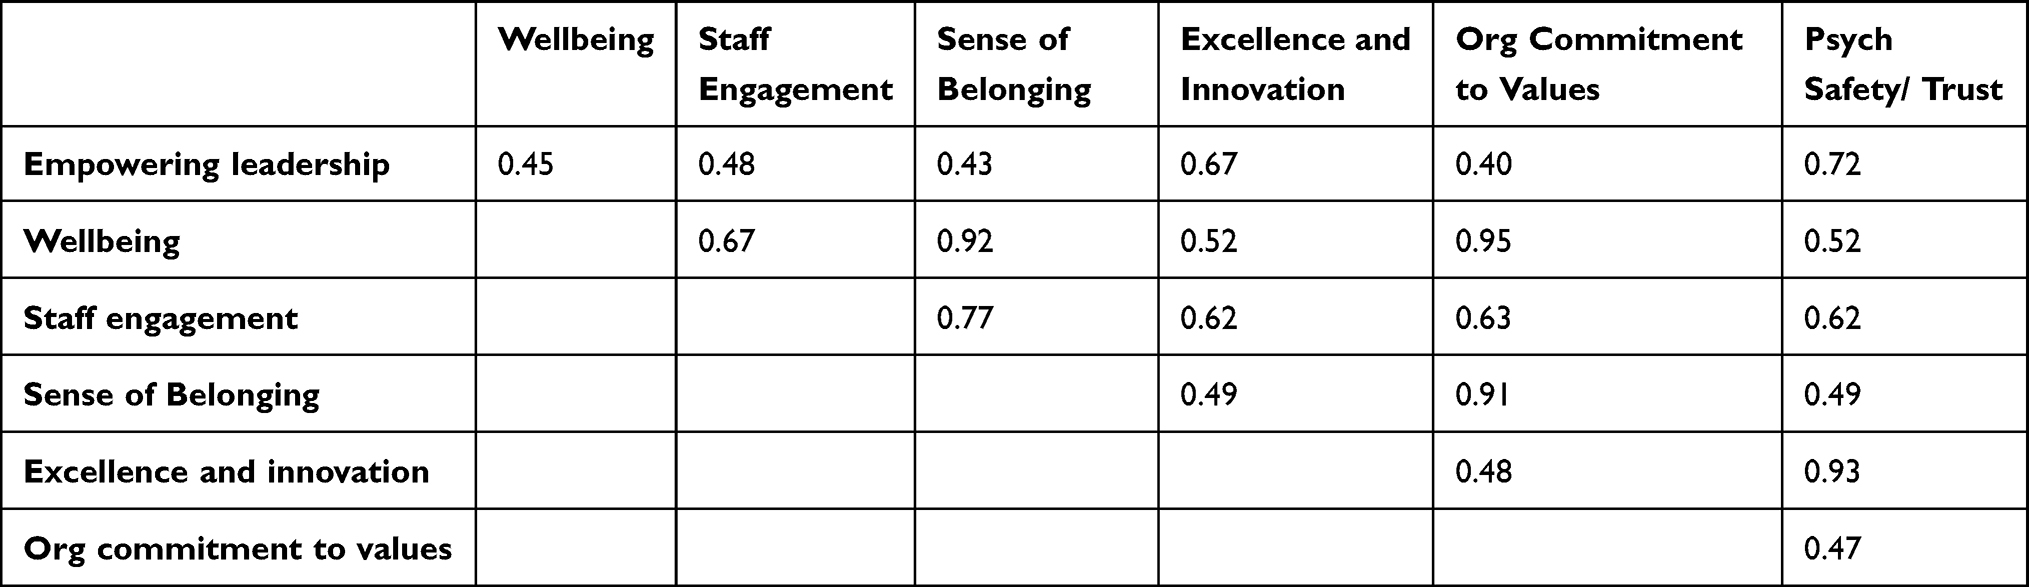 |
Table 2 Correlations Among the Latent Factors |
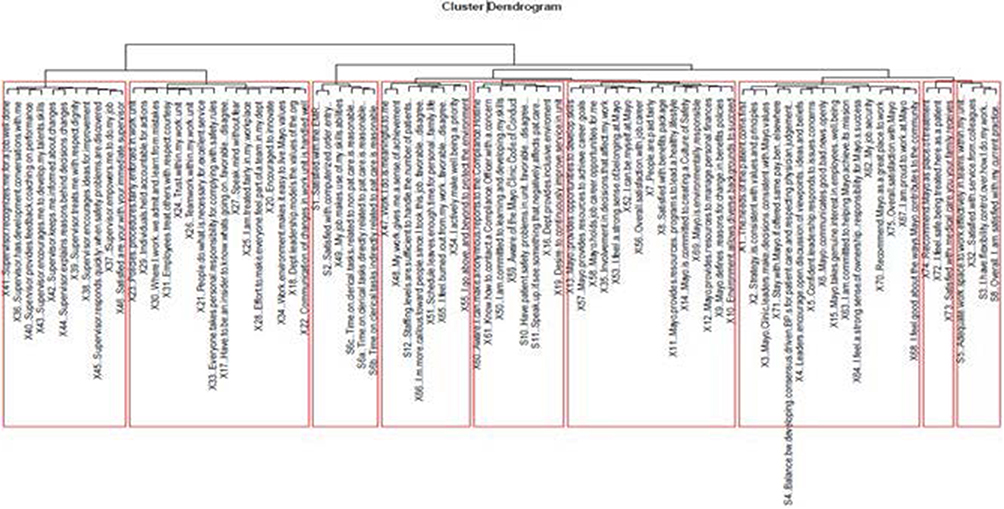 |
Figure 1 Cluster tree diagram or dendrogram. |
When the measurement model had a desirable model fit, we proceeded to testing the structural model, which answers our research question about the relationships among factors. We evaluated the fit indices for the structural model. The direct and indirect effects were tested.17,18 The variances in the variables explained by the model were obtained using the R2 statistics.
Correlation Analyses
We investigated the relationship between the constructs of values studied in cluster and SEM analyses and the patient satisfaction items for 17 units using Pearson correlation. We used the Cohen’s19 method of interpretation. According to Cohen Pearson correlation coefficient of 0.3 is a medium effect size with 9% explained variance and correlation of 0.5 is a large effect size with 25% explained variance. If 0.3 or higher, then the correlation can be interpreted as a non-trivial relationship.
We used the STROBE cross-sectional reporting guidelines.
Results
Cluster Analyses to Identify Coherent Constructs
The study employed cluster analyses to identify coherent constructs. Figure 1 displays the item-to-construct membership resulting from the cluster analysis, categorizing variables into nine homogenous classes. These classes are presented in Table 1, along with their corresponding Cronbach’s alpha values and examples of statements derived from the cluster analysis.
SEM Analyses Investigating the Relationships Among Variables
Measurement Model
Figure 2 depicts the measurement model, which exhibited excellent fit based on the following fit indices: Comparative Fit Index (CFI) of 0.951, Root Mean Square Error of Approximation (RMSEA) of 0.051 with a 90% confidence interval of 0.047 to 0.054, and Standardized Root Mean Square Residual (SRMR) of 0.067. Each of the nine factors demonstrated good internal consistency, with estimates ranging from 0.72 to 0.97 and an average of 0.86. Due to high correlation (>0.95) among Teamwork/Trust, Psychological Safety, and Fairness, a second-order factor model was fitted with an overarching factor termed “psych safety/trust”, onto which these three factors were loaded. The second-order measurement factor model also showed good fit: CFI = 0.92, RMSEA = 0.061 (90% CI 0.058, 0.064), SRMR = 0.066. The correlations among the latent factors are provided in Table 2.
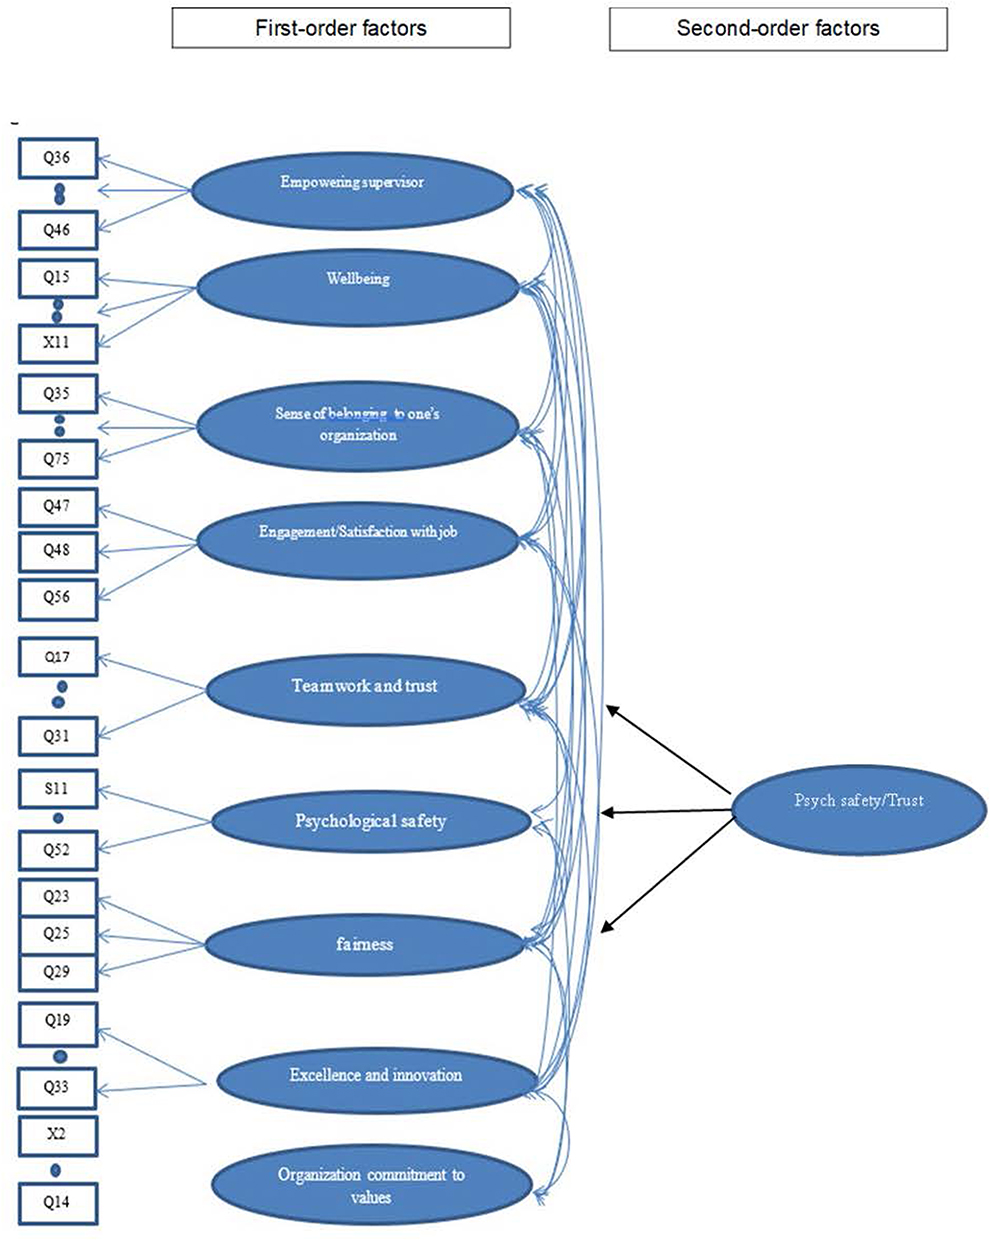 |
Figure 2 Measurement model using second order factors. CFI: 0.92, RMSEA 0.061 (90% CI 0.058, 0.064), SRMR 0.066. Abbreviations: CFI, Comparative fit index; RMSEA, Root mean square error of approximation; SRMR, Standardized root mean square residual. |
Structural Model
Building upon the second-order measurement model, the structural model in Figure 3 was developed, aiming to understand the relationships between variables. Considering prior research by Kang et al, which emphasized the final outcome of excellence, the current study hypothesized a similar structure. All direct paths and correlations in Figure 3 were statistically significant. However, the fit statistics did not meet the criteria for desirable model fit (RMSEA = 0.066, 90% CI 0.063, 0.069; SRMR = 0.153).
 |
Figure 3 First structural model. Notes: The red double-headed arrow is correlation. The blue arrows are regression paths. RMSEA = 0.066 (90% CI 0.063, 0.069), SRMR = 0.153. |
Further analysis using modification indices revealed that the data suggested two final outcomes instead of one (Figure 4). These two outcomes were excellence/innovation and wellbeing. The model considering these two outcomes demonstrated desirable model fit: RMSEA = 0.061 (90% CI 0.058, 0.064), SRMR = 0.069, and was hence chosen as the final model. Notably, employee wellbeing was positively influenced by their sense of belonging to the organization and the organizational commitment to values. Excellence was influenced by job engagement and trust, which were in turn influenced by empowering supervisors. Empowering supervisors also positively influenced employees’ sense of belonging to the workplace.
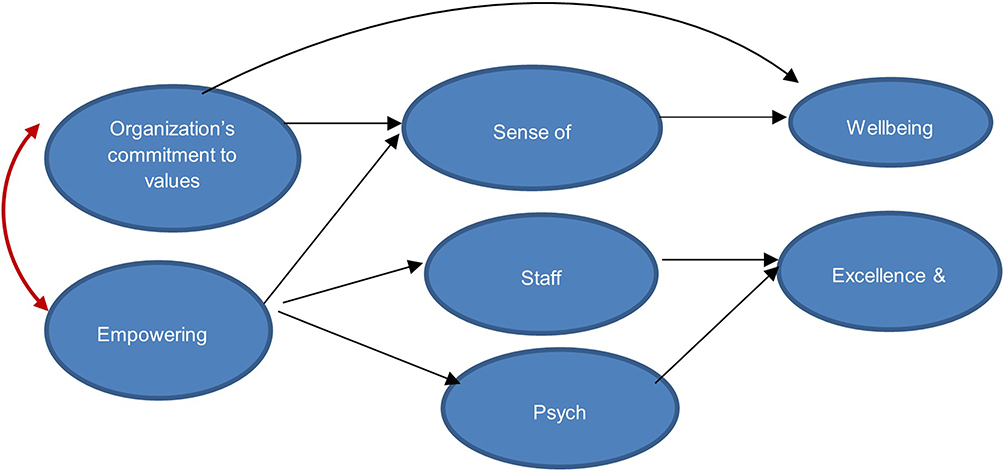 |
Figure 4 Alternative (Final) structural mode. Notes: The red double-headed arrow is correlation. The blue arrows are regression paths. RMSEA = 0.061 (90% CI 0.058, 0.064), SRMR = 0.069. “Empowering supervisor” and “organizational commitment to values” were correlated at 0.41. |
According to our alternative structural model, when staff perceive that the organization is committed to its values, they felt a higher sense of belonging that ultimately increased staff wellbeing. The degree to which leaders empowered their staff increased staff engagement and trust at a team level which helped to drive excellence and innovation. In our previous study, when there was psychological safety in teams, it helped supervisors do a better job in empowering employees. However, this study showed that empowering leadership creates greater psych safety and trust in teams. Increased engagement was associated with excellence, consistent with our previous study. Table 3 presents the path coefficients, and coefficient of determination (R2), the amount of explained variance. Organizational commitment to values had a positive effect on employee wellbeing through employees’ sense of belonging to one’s organization. Our final model described in Figure 4 and Table 3 explained 85% of the variance in excellence and innovation, 60% of the variance in staff engagement, 82% of the variance of sense of belonging in workplace, 61% of the variance in psych safety/trust, and 90% of the variance in wellbeing.
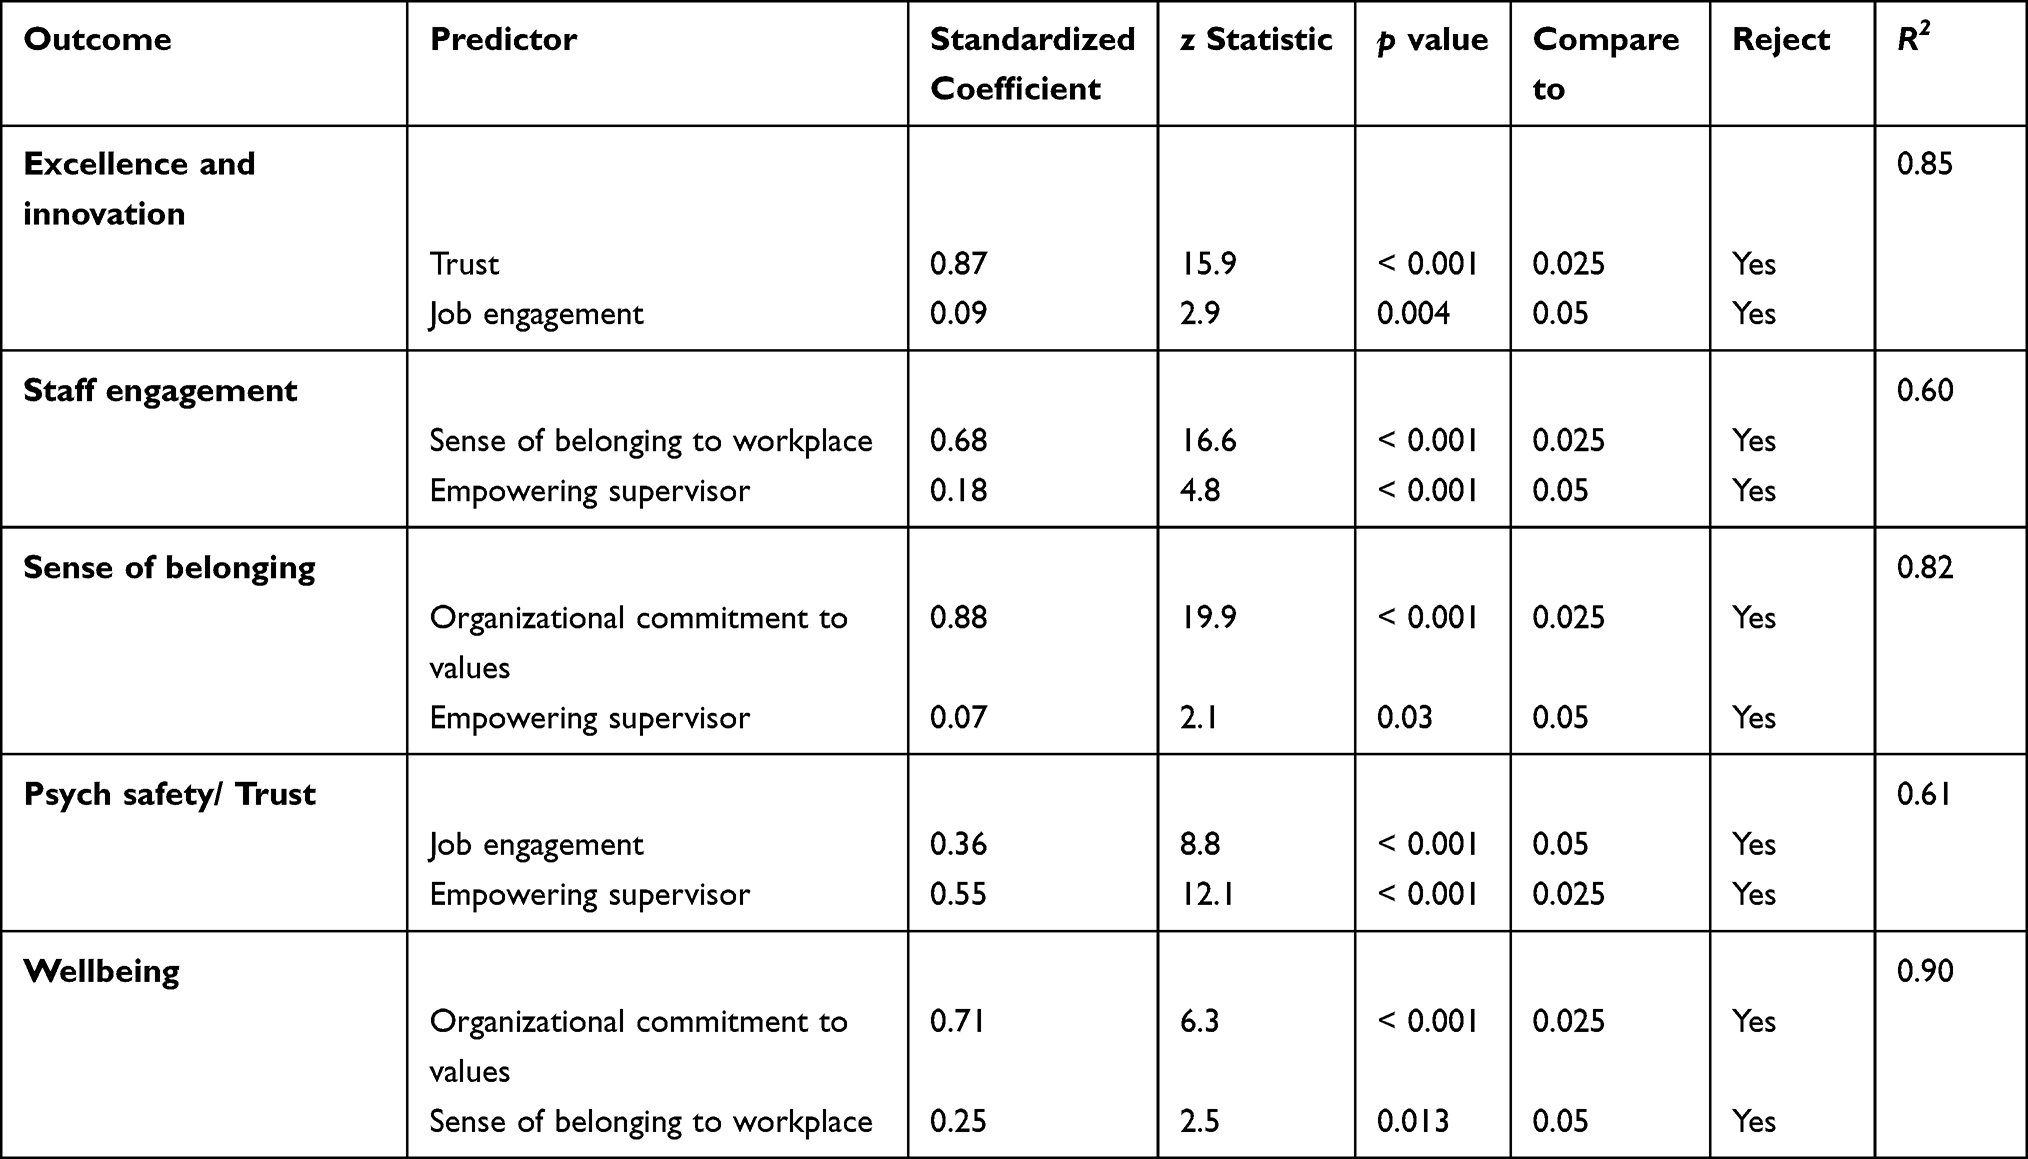 |
Table 3 Direct Effects from the Final Structural Model |
Correlations Analysis Investigating the Relationships Among Cultural Values, Engagement Wellbeing and Patient Satisfaction
Table 4 presents the Pearson correlation among the summed item scores for cultural values, staff engagement, well-being, and item-level scores for care provider patient satisfaction scores. Values of Excellence and Innovation had the highest correlation with patient satisfaction scores across all items (0.25–0.74), with most of them at large effect size followed by culture of teamwork and trust. We found well-being and empowering leadership to be mostly negatively correlated with the patient satisfaction scores.
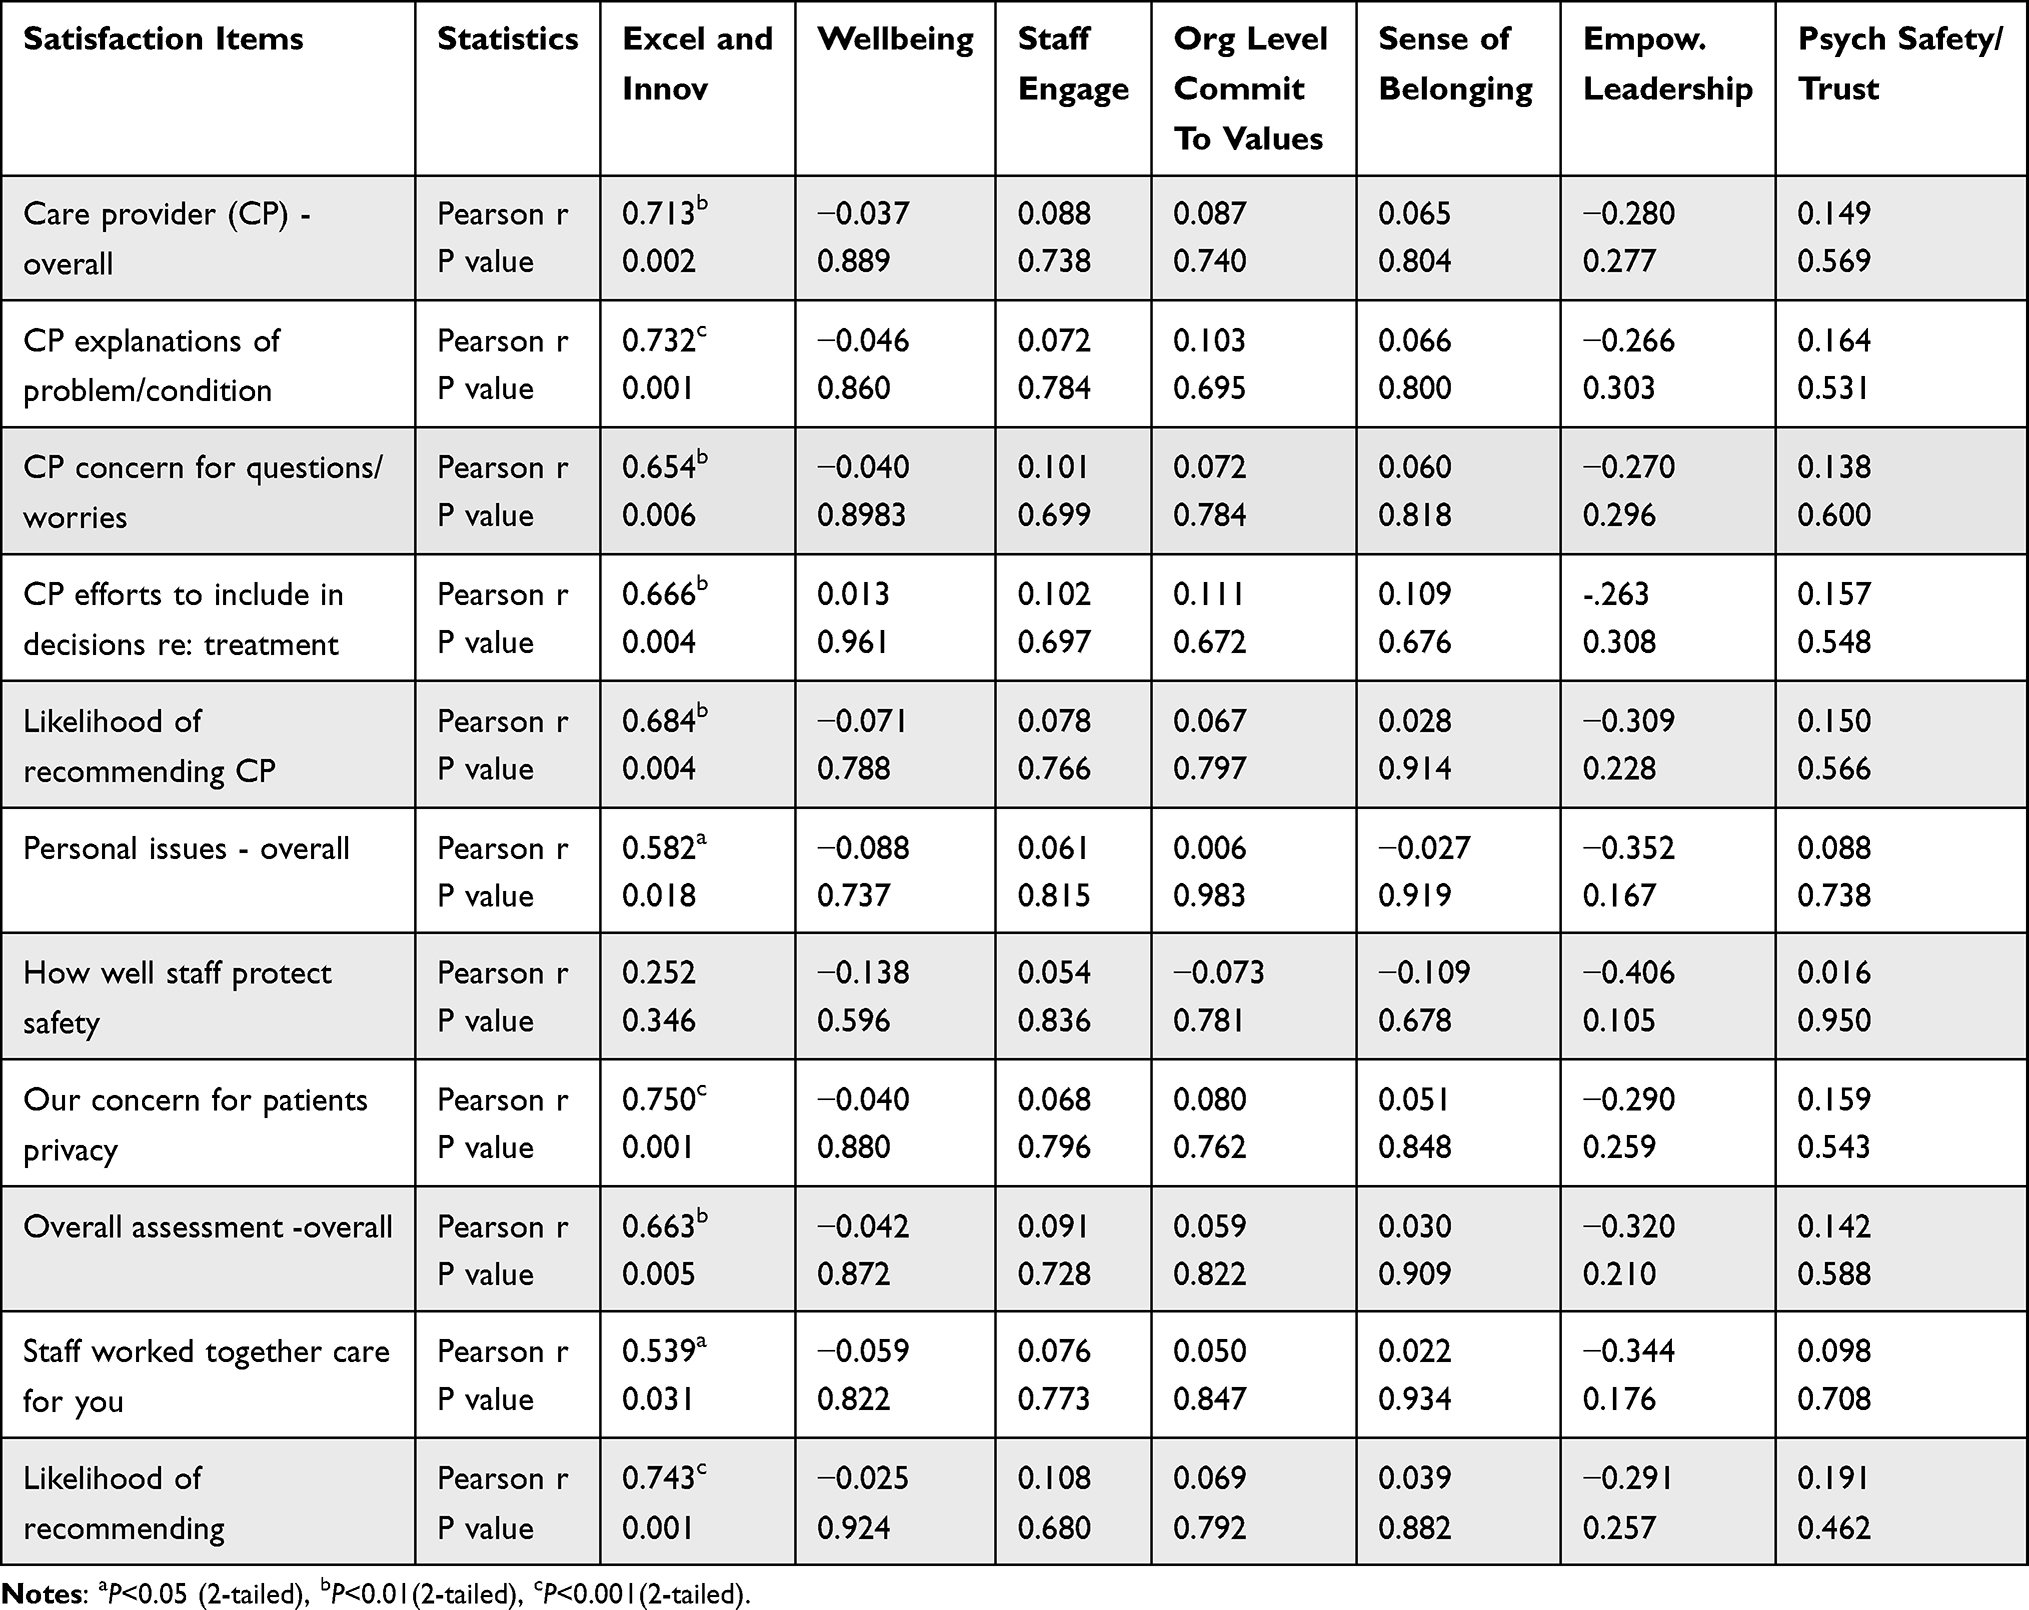 |
Table 4 Pearson Correlation Among the Summed Items Scores for Cultural Values, Staff Engagement, Well-Being, and Item-Level Scores for Care Provider Patient Satisfaction Scores |
Discussion
There were some common findings in previous and current studies. Fairness was a strong predictor of psychological safety, people’s perception of how the organization is committed to its values was a predictor of staff engagement, and psychological safety predicted empowering leadership for both studies. We added a new variable (wellbeing) for this study, and it also was predictive of an organization’s commitment to its core values. This study truly emphasized the importance of employees’ perception of the organization’s commitment to its values as this was a predictor for staff wellbeing, sense of belonging, and engagement. It was evident that staff engagement is not something individuals can create but generated through group characteristics such as the organizational culture and teamwork.
While we want leaders to demonstrate empowering behavior, they first need to feel safe to do so. When leaders feel safe within teams, they can trust their team members and feel safe to empower and develop them. For both studies, it was not the leadership behavior that created psychological safety but the other way round. This is consistent with Edmonson’s assertion that psychological safety is a team construct.20
Fairness was a significant predictor for excellence and innovation for both studies. When staff feel that organization processes are fair and just, they are willing to work hard to provide excellent service. This finding was consistent with a study by Conway and Coyle-Shapiro21 where they found a reciprocal relationship between perception of psychological contract fulfillment and employee performance.
The correlation study between unit level cultural values and patient satisfaction showed different results compared to the previous study in academic medicine. Culture of excellence and innovation was positively correlated with large effect size in ten out of eleven patient satisfaction measurement domains and all were statistically significant. The variable of wellbeing was newly added to this study and showed no relationship with patient satisfaction scores. This could suggest that staff will try to improve patient satisfaction regardless of their state of wellbeing. This finding was supported by the study done by Howell et al which showed that burnout and lack of ability to decompress were not associated with decreased patient satisfaction.22 Trust was another variable that was positively correlated with all the patient satisfaction scores but with small effect size. One notable element or item of this study was the relationship between empowering leadership and patient satisfaction scores. In our previous study, empowering leadership was positively correlated with all patient satisfaction scores. In this study, all the empowering leadership scores were negatively correlated with patient satisfaction scores at small to medium effect size. According to Restubog et al23 there is a negative relationship between employee performance and leadership behavior when their psychological contract has been breached, or if they do not feel that they have the support of leaders. In this study, empowering leadership was a better predictor of and showed higher association with overall wellbeing than with the staff’s performance on patient satisfaction scores.
Due to data accessibility, we limited the study to unit level only. For future, exploring the relationship between individual’s alignment with values, staff engagement, and well-being, and provider-level patient satisfaction scores will provide meaningful findings for healthcare organizations to address retention, satisfaction of staff, and patient outcomes.
Conclusion
For a community practice, values of excellence had a stronger positive relationship with patient satisfaction than all other variables, including leadership behaviors. How staff perceive the level of the organization’s commitment to its values had impact on both staff engagement and wellbeing. Staff’s sense of fairness had a significant impact on how staff provide service excellence. Organizations that are aligned in their practices with commitment and demonstration to their values have increased engagement and wellbeing of their staff. When staff feel trust and fairness, there is increased commitment to excellence and innovation. The results indicate that there needs to be continuous assessment of staff on how they perceive their organization honors and lives its values using organization-wide surveys. This study also showed that the construct of wellbeing and patient satisfaction scores are not correlated, suggesting that professionals who provide excellent service may be prone to overworking and burnout. Committed staff will strive to provide excellent patient experience regardless of their state of wellbeing.
Ethics
This study has been deemed exempt by the Mayo Clinic IRB (study ID:19-001207) as this study does not involve humanitarian use device for clinical treatment or diagnosis, emergency use situation, creation of a repository that will store identifiable private information or identifiable biospecimens from living individuals, or a systematic investigation.
Acknowledgments
This study has been funded by the Mayo Clinic Values Council.
Disclosure
The authors report no conflicts of interest in this work.
References
1. Kang JY, Lee M, Fairchild EM, et al. Relationships among organizational values, employee engagement, and patient satisfaction in an academic medical center. Mayo Clin Proc. 2020;4(1):8–20. doi:10.1016/j.mayocpiqo.2019.08.001
2. Schein EH. Organizational Culture and Leadership. Vol. 2. Hoboken, NJ: John Wiley and Sons; 2010:7–22.
3. Pololi L, Kern DE, Carr P, Conrad P, Knight S. The culture of academic medicine: faculty perceptions of the lack of alignment between individual and institutional values. JGIM. 2009;24(12):1289–1295. doi:10.1007/s11606-009-1131-5
4. Kotrba LM, Gillespie MA, Schmidt AM, Smerek RE, Ritchie SA, Denison DR. Do consistent corporate cultures have better business performance? Exploring the interaction effects. Hum Relat. 2012;65(2):241–262. doi:10.1177/0018726711426352
5. Hartnell CA, Ou AY, Kinicki AJ, Choi D, Karam EP. A meta-analytic test of organizational culture’s association with elements of an organization’s system and its relative predictive validity on organizational outcomes. J Appl Psychol. 2019;104(6):832–850. doi:10.1037/apl0000380
6. Marinova SV, Cao X, Park H. Constructive organizational values climate and organizational citizenship behaviors: a configurational view. J Manage. 2019;45(5):2045–2071. doi:10.1177/0149206318755301
7. Van Dyne L, LePine JA. Helping and voice extra-role behavior: evidence of construct and predictive validity. Acad Manage J. 1998;41:108–119. doi:10.2307/256902
8. Lipstein SH, Kellermann AL. Workforce for 21st-century health and health care. JAMA. 2016;316(16):1665–1666. doi:10.1001/jama.2016.13715
9. Landy FJ, Conte JM. Work in the 21st Century: An Introduction to Industrial and Organizational Psychology. John Wiley & Sons; 2016:492–505.
10. Delizonna L. High-performing teams need psychological safety. Here’s how to create It. HBR Digital Articles; 2017:2–5. Available from: http://web.a.ebscohost.com/ehost/pdfviewer/pdfviewer?vid=5&sid=e63261d4-abc7-4048-9e05-ca489a05549c%40sessionmgr4010.
11. Edmondson A. Speaking up in the operating room: how team leaders promote learning in interdisciplinary action teams. J Manage Stud. 2003;40(6):1419–1452. doi:10.1111/1467-6486.00386
12. Islam T, Khatoon A, Cheema AU, Ashraf Y. How does ethical leadership enhance employee work engagement? The roles of trust in leader and harmonious work passion. Kybernetes. 2023;ahead-of-print No. ahead-of-print. doi:10.1108/K-09-2022-1343
13. Tzeng HM, Ketefian S, Redman RW. Relationship of nurses’ assessment of organizational culture, job satisfaction, and patient satisfaction with nursing care. Int J Nurs Stud. 2002;39(1):79–84. doi:10.1016/S0020-7489(00)00121-8
14. Braithwaite J, Herkes J, Ludlow K, et al. Association between organizational and workplace cultures, and patient outcomes: systematic review. BMJ open. 2017;7(11):e017708. doi:10.1136/bmjopen-2017-017708
15. Ancarani A, Di Mauro C, Giammanco MD. Linking organizational climate to work engagement: a study in the healthcare sector. Int J Public Adm. 2019;42(7):547–557. doi:10.1080/01900692.2018.1491595
16. Mueller RO, Hancock GR. Best practices in structural equation modeling. In: Osborne JW, editor. Best Practices in Quantitative Methods. Thousand Oaks, CA: SAGE Publication; 2008:488–508.
17. Benjamini Y, Hochberg Y. Controlling the false discovery rate: a practical and powerful approach to multiple testing. J R Stat Soc Series B. 1995;57(1):289–300.
18. Cribbie RA. Multiplicity control in structural equation modeling. Structural Equation Modeling. A Multidiscip J. 2007;14(1):98–112.
19. Cohen J. Statistical Power Analysis for the Behavioral Sciences. UK: Routledge; 2013.
20. Edmondson A. Psychological safety and learning behavior in work teams. Adm Sci Q. 1999;44(2):350–383. doi:10.2307/2666999
21. Conway N, Coyle-Shapiro JA. Reciprocity and psychological contracts: employee performance and contract fulfillment. Acad Manag Perspect. 2006;2006(1):Q1–Q6. doi:10.5465/ambpp.2006.22898644
22. Howell TG, Mylod DE, Lee TH, Shanafelt T, Prissel P. Physician burnout, resilience, and patient experience in a community practice: correlations and the central role of activation. J Patient Exp. 2020;7(6):1491–1500. doi:10.1177/2374373519888343
23. Restubog S, Bordia P, Tang RL, Krebs SA. Investigating the moderating effects of leader–member exchange in the psychological contract breach–employee performance relationship: a test of two competing perspectives. Br J Manag. 2010;21(2):422–437.
 © 2023 The Author(s). This work is published and licensed by Dove Medical Press Limited. The full terms of this license are available at https://www.dovepress.com/terms.php and incorporate the Creative Commons Attribution - Non Commercial (unported, v3.0) License.
By accessing the work you hereby accept the Terms. Non-commercial uses of the work are permitted without any further permission from Dove Medical Press Limited, provided the work is properly attributed. For permission for commercial use of this work, please see paragraphs 4.2 and 5 of our Terms.
© 2023 The Author(s). This work is published and licensed by Dove Medical Press Limited. The full terms of this license are available at https://www.dovepress.com/terms.php and incorporate the Creative Commons Attribution - Non Commercial (unported, v3.0) License.
By accessing the work you hereby accept the Terms. Non-commercial uses of the work are permitted without any further permission from Dove Medical Press Limited, provided the work is properly attributed. For permission for commercial use of this work, please see paragraphs 4.2 and 5 of our Terms.