")
Back to Archived Journals » Cell Health and Cytoskeleton » Volume 8
Dispersion relations of cytoskeleton dynamics
Authors Wang R, Lei L, Sridharan S, Wang Y, Levine A, Popescu G
Received 14 July 2015
Accepted for publication 2 October 2015
Published 21 January 2016 Volume 2016:8 Pages 1—7
DOI https://doi.org/10.2147/CHC.S62865
Checked for plagiarism Yes
Review by Single anonymous peer review
Peer reviewer comments 2
Editor who approved publication: Professor Denis Wirtz
Ru Wang,1,2 Lei Lei,3 Shamira Sridharan,1,3 Yingxiao Wang,3 Alex J Levine,4,5 Gabriel Popescu,1,3,6
1Quantitative Light Imaging Laboratory, Beckman Institute for Advanced Science and Technology, 2Department of Mechanical Science and Engineering, 3Department of Bioengineering, University of Illinois at Urbana-Champaign, Urbana, IL, 4Department of Chemistry and Biochemistry, 5Department of Physics and Astronomy, University of California, Los Angeles, CA, 6Department of Electrical and Computer Engineering, University of Illinois at Urbana-Champaign, Urbana, IL, USA
Abstract: While it is well known that the cytoskeleton plays a fundamental role in maintaining cell shape, performing cell division, and intracellular transport, its spatiotemporal dynamics are insufficiently understood. The dispersion relation, which is fundamental for understanding the connection between spatial and temporal scales of a dynamic system, was employed here for the first time to study the activity of actin and microtubules. Using green fluorescence protein for time-lapse imaging of the cytoskeleton, we showed that the dispersion relation can distinguish between diffusive and active transport of actin and microtubule filaments. Our analysis revealed that along the filaments, the transport was deterministic, as one might expect as the result of the active polymerization process, while across the filaments diffusion was dominant. Furthermore, using drugs to block the polymerization–depolymerization of both actin and microtubules, we measured that the transport immediately became diffusive, as expected. However, unexpectedly, our results indicated that within a few minutes from blocking its polymerization, actin recovered an active transport component. This deterministic component vanished upon treatment with nocodazole, indicating that fragments of actin were actively transported along microtubules. Because it provides information over broad temporal and spatial scales, this approach promises to provide a new window into the active processes associated with live cells.
Keywords: quantitative phase imaging, QPI, spatial light interference microscopy, SLIM, microtubule dynamics, actin dynamics
Introduction
Mass transport along actin and microtubules within the live cell plays a crucial role in regulating cell function, from cell differentiation and motility to mitosis and apoptosis.1 Studying cytoskeletal dynamics is extremely interesting not only at the basic science level but also at the clinical level, as it may open new avenues for the treatment of important disease.2 For example, disruption of cargo transport along neural processes can lead to neurodegenerative diseases, such as Alzheimer’s disease.3,4
Despite great progress on the subject, the role of the cytoskeleton in intracellular transport remains insufficiently understood.5–7 Trafficking at the intracellular level results from both thermal diffusion and the activity of molecular motors.8 This process has been examined through techniques that generally rely on fluorescence imaging,9 eg, fluorescence speckle microcopy,10 fluorescence correlation spectroscopy,11 Forster resonance energy transfer,12 fluorescence recovery after photobleaching,13 and fluorescence lifetime imaging microscopy.14 Recently, there has been significant progress in superlocalization microscopy, such as stochastic optical reconstruction microscopy,15 photoactivated localization microscopy,16,17 and their precursor, fluorescence imaging with 1 nm accuracy,18 which are closing the gap between cellular- and molecular-scale biology. In combination with fluorescence microscopy, particle tracking is a widely used approach for studying the transport of discrete objects inside the cell, such as embedded particles, organelles, and vesicles.19–22 Analyzing the trajectories of these particles in terms of their mean squared displacements provides valuable information about the nature of transport and even the rheology of the surrounding medium. However, this approach has limited applicability when the system of interest is continuous, such as actin and microtubule cytoskeletons at spatial scales larger than the mesh size. Furthermore, particle tracking does not contain explicit spatial information.
In order to meet this experimental challenge of investigating mass transport in live cells over broad spatiotemporal scales, recently we proposed a new approach, referred to as dispersion-relation fluorescence spectroscopy (DFS).23 This method analyzes the full-field fluorescence images in a time lapse and provides the dispersion relation associated with the dynamic transport. This dispersion relation is in the form of a power law – Γ(q)–qα – which describes the relaxation rate (in rad/s) of the spatial mode q (in μm/s). Physically, 1/Γ describes the correlation time associated with a spatial disturbance of wavelength 1/q. Importantly, the dispersion curve allows us to distinguish between diffusion and directed transport and their specific spatiotemporal scales.
In our study, we used time-lapse imaging of green fluorescence protein (GFP) fused to actin and microtubules to study their spatiotemporal fluctuations. We found that DFS is capable of revealing subtle changes in the cytoskeleton dynamics associated with the integrity of the polymerization process. Specifically, we demonstrated that DFS can quantitatively monitor the transition from deterministic to random transport when the polymerization of the cytoskeleton is blocked. Our study suggested that cells may have an interesting mechanism for active transport of actin along microtubules.
Materials and methods
Cell culture
Mouse embryonic fibroblasts (MEFs) were obtained from American Type Culture Collection (Manassas, VA, USA). These cells were cultured in a 37°C incubator with humid atmosphere, 5% CO2, and 95% air, and were grown in Dulbecco’s modified Eagle’s medium supplemented with 100 μg/mL ampicillin, 100 μg/mL streptomycin, 2 g/L sodium bicarbonate, and 10% fetal bovine serum (FBS).
Transfection and cell treatment
MEFs (2×10⁵) were plated on a 35 mm dish 1 day before transfection. On day 2, MEFs were transfected with Lipofectamine 2000 (Thermo Fisher Scientific, Waltham, MA, USA) following the protocol described in the manual. Briefly, 1 μg plasmid was mixed with 2 μL Lipofectamine 2000 in 200 μL Opti-MEM (Thermo Fisher Scientific) medium, and then the mixture was added to a cell-culture dish after 20 minutes’ incubation. At 24 hours after transfection, MEFs were plated on 13 mm glass-bottom dishes, which were coated with 10 μg/mL fibronectin with 20%–30% confluence, and cultured for another 12–24 hours in Dulbecco’s modified Eagle’s medium with 10% FBS. During the imaging process, the cells were maintained in CO2-independent medium (Thermo Fisher Scientific) with 10% FBS. Cytochalasin D (cyto-D) and nocodazole were added to the medium to get a final concentration of 1 μM during imaging, individually.
Time-lapse epifluorescence imaging
To perform time-lapse epifluorescence imaging, we used a motorized Carl Zeiss AG (Jena, Germany) microscope (Z1 model) equipped with 63×/1.4 oil-immersion objective and chose single cells that were not associated with neighboring cells as targets. During time-lapse imaging, the cells were maintained in an incubator with both heat and CO2 control. The camera was a PhotonMax EMCCD from Princeton Instruments (Trenton, NJ, USA), and the illumination source in the fluorescence microscopy was the Zeiss HBO 100 high pressure mercury vapor arc discharge lamp manufactured by Carl Zeiss AG. The filter set used for imaging MEF cells was GFP/fluorescein isothiocyanate with excitation wavelength of 495 nm and emission wavelength 517 nm, respectively.
Results
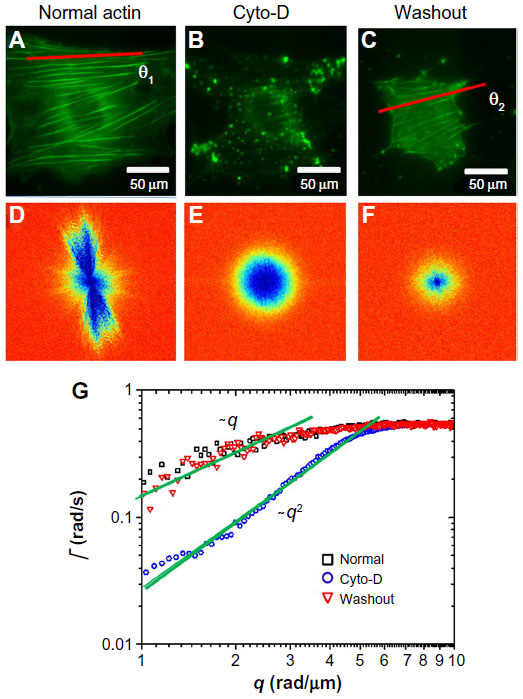
We used DFS to study actin dynamics under the effect of cyto-D. GFP-fused actin of MEF cells was imaged continuously using epifluorescence (see the Materials and methods section for details on GFP transfection and imaging). Time-lapse images were acquired over 4.25 minutes at an acquisition rate of 1 frame/second. The results of the first experiment are summarized in Figure 1. Individual images of normal cells revealed the actin bundles oriented along certain directions, as illustrated in Figure 1A. Consequently, the dispersion map (Figure 1D) was also anisotropic, indicating that transport along the bundles was significantly different than that across them. Interestingly, along the filament bundles, DFS revealed deterministic transport, as indicated by the linear dependence of the Γ vs q curve (black squares in Figure 1G). By contrast, the dynamics across the actin filaments were diffusive – Γ∞q2. This result suggests that the continuous polymerization process at the end of the actin filaments was an active process governed by ATP consumption rather than thermal noise. In order to test this hypothesis, we imaged the same cells after adding cyto-D, which blocks the polymerization process. Clearly, cyto-D destroyed the actin filamentous structure, as evidenced by Figure 1B. As a result of crumbling the filaments, the dispersion map became isotropic (Figure 1E). More importantly, the dispersion relation indicated a clear q2 behavior, and thus Brownian transport (blue circles in Figure 1G). Further, as a control experiment, we washed out the cyto-D using culture medium and incubated the cells at 37°C and 5% CO2 for 1 hour. After the washout, the actin structure partially recovered (Figure 1C), and remarkably the transport along the filaments returned to deterministic behavior (red triangles in Figure 1G).
 | Figure 1 Short-term effect of cyto-D treatment on MEFs. |
These experiments demonstrate that the active transport is strongly dependent on the integrity of the actin filaments. At the same time, DFS appears to be a valuable tool for studying such dynamics, where particle-tracking methods are limited. Note that at high q-values, the curves in Figure 1G deviate from the power laws of q1 and q2 and level off. This is because of the finite acquisition rate of our measurement, which set the maximum Γ-value. The q1 curves level at lower q-values were due to the faster transport process.
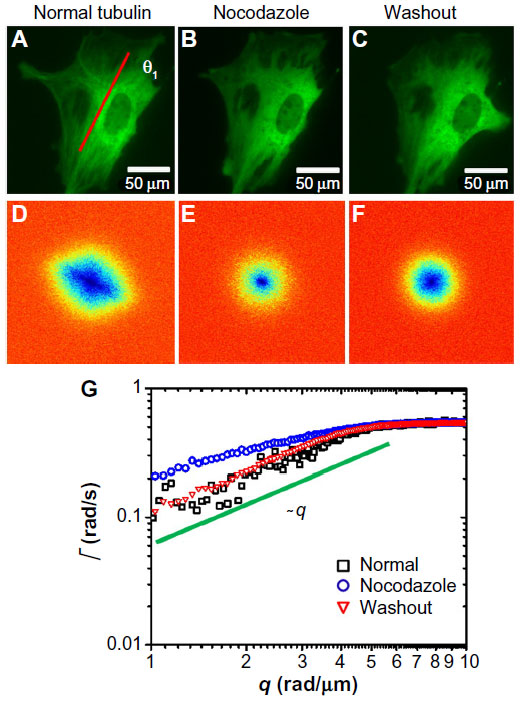
Next, we tested the sensitivity of DFS to microtubule dynamics. We performed experiments on GFP-labeled microtubules of MEFs under normal and nocodazole-treatment conditions (Figure 2). The fluorescence images were taken with the same acquisition rate, 1 frame/second, for 4.25 minutes. Figure 2A and D show the image and DFS map, respectively, of a normal MEF with its microtubules labeled by GFP. The dispersion curve (Figure 2G) indicates that the transport along microtubule filaments was directed (Γ∞q). The same cell is shown in Figure 2B after nocodazole was added to the cell petri dish to depolymerize the microtubules. Interestingly, while the image itself is not informative about the microtubule-polymerization state, the DFS map, ie, Figure 2E, reveals significant changes from its normal counterpart, shown in Figure 2D. Due to the nocodazole, the DFS map became narrower and isotropic. This transition from anisotropy to isotropy indicates that the microtubules were characterized by polarity, which plays a role in intracellular transport. The effect is further illustrated in Figure 2G, where profiles along the direction indicated in Figure 2A are presented. Note that after addition of the drug, the dispersion curve flattened (blue-circle curve). Again, we performed a control experiment where we washed out the drug with fresh medium and kept the cells at 37°C and 5% CO2 for approximately an hour. This washout procedure partially recovered the filament structure. After the washout, the dispersion curve (red triangles in Figure 2G) overlapped perfectly with the one before treatment (black square), indicating that the microtubule active dynamics also recovered.
 | Figure 2 Short-term effect of nocodazole treatment on MEFs. |
Next, we studied in more detail the effect of the two drugs as it developed in time. Figure 3 illustrates the gradual effect of nocodazole used to block the microtubule polymerization. In order to monitor this highly dynamic process, we recorded time-lapse image sets at intervals of 20 minutes. Each fluorescence-data set (Figure 3A–D) was taken at the same acquisition rate of 1 frame/second over 4.25 minutes. It can be seen that due to nocodazole, the DFS maps gradually became isotropic (Figure 3E–H). The dispersion relation was analyzed along two particular directions, marked by the black and red lines in Figure 3E–H; the azimuthal average is also shown. These dispersion curves consistently flattened out after the polymerization of tubulin was disrupted by nocodazole, as shown in Figure 3I–L. As the microtubule filaments were broken down, the resulting monomers were smaller in size and thus moved faster in the solution. Since our acquisition rate and therefore maximum Γ was constant, the effect of the drug was to gradually level off the DFS curves. We expected that transport would become diffusive upon filament depolymerization. Nocodazole-treated tubulin did not show this q2 curve, only because its motion was faster than the acquisition rate. Note the highest value of Γ was limited by the frame rate, and the lowest Γ-value was due to the total acquisition time.
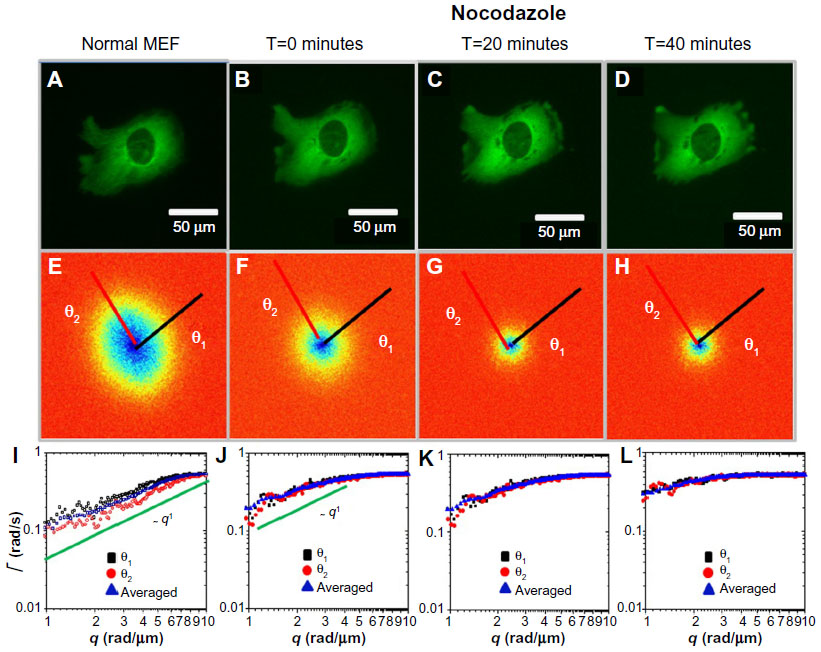 | Figure 3 Long-term effect of nocodazole treatment on MEFs. |
We performed an analog experiment to study the effect of the cyto-D on actin. The results are summarized in Figure 4 and reveal an unexpected behavior, as follows. Immediately after the addition of cyto-D (Figure 4B), not surprisingly, the actin-filament transport transitioned from a combination of directed and diffusive motions (Figure 4I) to a largely diffusive motion (Figure 4J). However, after approximately 20 minutes, the data indicated directed transport again, as illustrated by the q1 dependence in Figure 4K. Imaging the cell over a longer period of time did not reveal a tendency to return to diffusion. This result was unexpected. We hypothesize that this effect was due to the actin fragments that became attached to the microtubules and thus were subjected to active transport. Results from these experiments are summarized in Figure 5. In order to prove this hypothesis, we ran a double-treatment test, ie, after the actin polymerization was blocked with cyto-D (Figure 5B and C), the microtubule polymerization was further disrupted with nocodazole (Figure 5D–F). Therefore, following cyto-D-induced transition from directed motion, (q1 in Figure 5N) to diffusive transport (q2 in Figure 5O) and directed again (q1 in Figure 5P), the actin-filament transport eventually became purely diffusive (q2 in Figure 5Q and R) after the addition of nocodazole. The viability of cells was confirmed by the reversibility of both structure and function after the drug washout. These results show that along with the microtubule-structure dissociation, the actin fragments eventually dissolved in the cytoplasm and underwent random motion, thus proving our hypothesis.
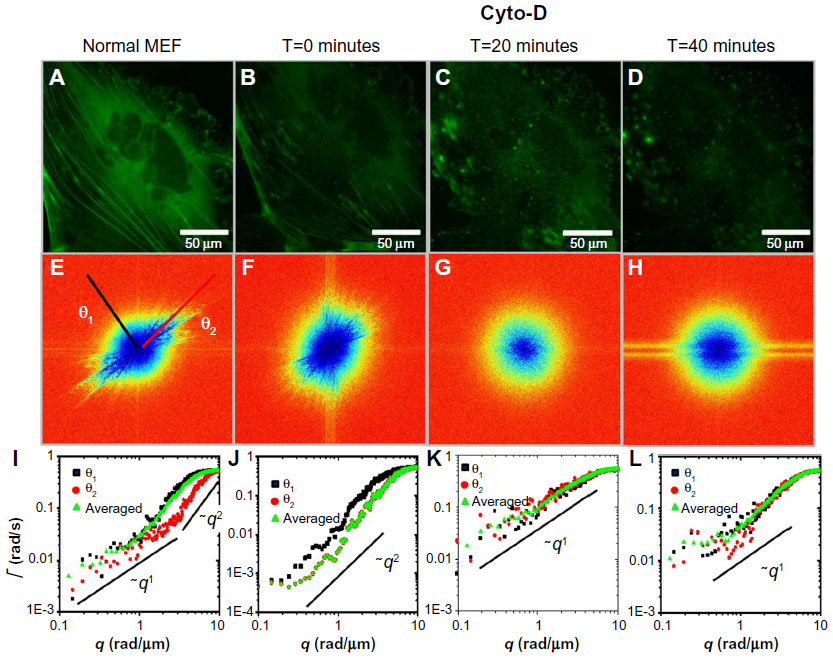 | Figure 4 Long-term effect of cyto-D treatment on MEFs. |
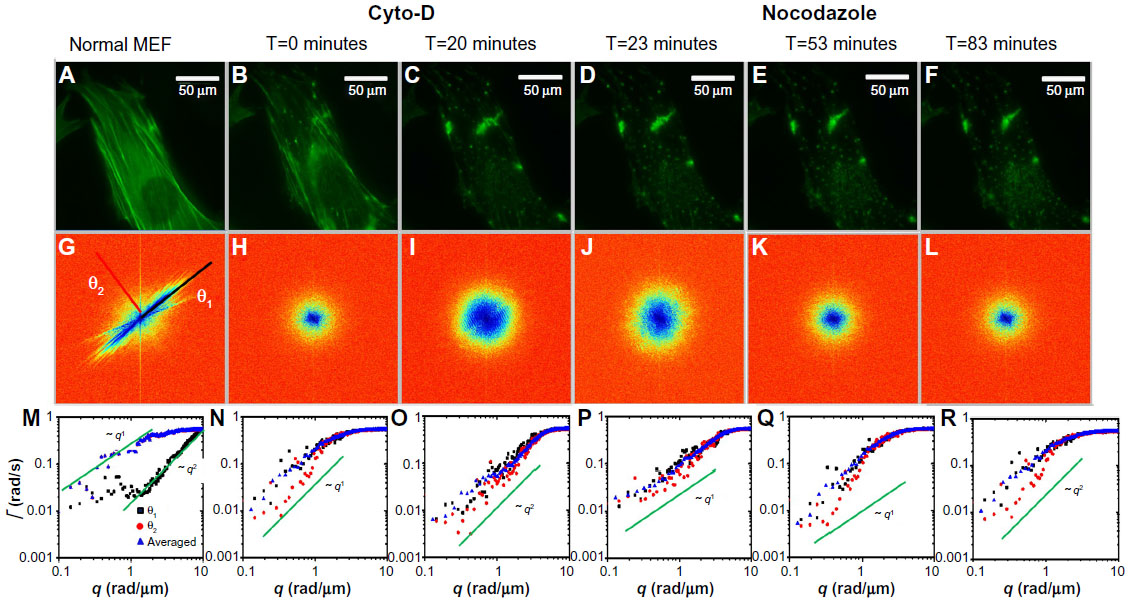 | Figure 5 Effects of MEF treatment with cyto-D and nocodazole. |
Discussion
Aberrant cytoskeleton dynamics have been established to reflect the cellular characteristics of various diseases.24 As such, the knowledge about cytoskeleton dynamics obtained by DFS has the potential to shed new light and provide readouts to assess the pathophysiological status of cells for diagnostic purposes.
We used the dispersion relation to study actin and microtubule polymerization and depolymerization dynamics in live cells. DFS is a full-field and tracking-free method, which is ideally suited for studying dynamics of both continuous and discrete structures inside living cells. While in this study we used MEF cells, DFS can be applied to any cell line with fluorescently labeled organelles. The ability to distinguish between diffusion and deterministic transport over broad spatiotemporal scales promises to shed new light on understanding many cell functions. The specific study presented here on cytoskeleton dynamics under the influence of various motor-protein inhibitors suggests cross talk between actin and microtubule transport. Since many basic and clinical questions related to actin- and microtubule-mediated transport are insufficiently understood, we anticipate that DFS will contribute meaningfully to such studies in the future. We repeated each experiment three times, and found that the trends of dispersion curves agreed qualitatively. Future control experiments will be focused on understanding the underlying mechanisms responsible for the mass transport taking place at the subcellular level. DFS provides a new and efficient way to analyze fluorescence dynamics, and may shed new light on our understanding of the dynamics of continuous structures, including actin filaments and microtubules.
Acknowledgment
This research was supported by the National Science Foundation: CBET 0846660 CAREER (GP), CBET 1040462 MRI (GP), CBET-0939511 STC (GP and YW), NIH HL098472 (YW), and NSF DMR-1006162 (AJL).
Disclosure
The authors report no conflicts of interest in this work.
References
Segev N, editor. Trafficking Inside Cells: Pathways, Mechanisms and Regulation. New York: Springer; 2009. | |
Ohba T, Nakamura M, Nishitani H, Nishimoto T. Self-organization of microtubule asters induced in Xenopus egg extracts by GTP-bound Ran. Science. 1999;284(5418):1356–1358. | |
Hirokawa N, Takemura R. Molecular motors in neuronal development, intracellular transport and diseases. Curr Opin Neurobiol. 2004;14(5):564–573. | |
Mandelkow E, Mandelkow EM. Kinesin motors and disease. Trends Cell Biol. 2002;12(12):585–591. | |
Schuh M. An actin-dependent mechanism for long-range vesicle transport. Nat Cell Biol. 2011;13(12):1431–1436. | |
Often M, Nandi A, Arcizet D, Gorelashvili M, Lindner B, Heinrich D. Local motion analysis reveals impact of the dynamic cytoskeleton on intracellular subdiffusion. Biophysical J. 2012;102(4):758–767. | |
Trifaró JM, Gasman S, Gutiérrez LM. Cytoskeletal control of vesicle transport and exocytosis in chromaffin cells. Acta Physiol (Oxf). 2008;192(2):165–172. | |
Wang R, Wang Z, Millet L, Gillette MU, Levine AJ, Popescu G. Dispersion-relation phase spectroscopy of intracellular transport. Opt Express. 2011;19(21):20571–20579. | |
Ross JL, Ali MY, Warshaw DM. Cargo transport: molecular motors navigate a complex cytoskeleton. Curr Opin Cell Biol. 2008;20(1):41–47. | |
Danuser G, Waterman-Storer CM. Quantitative fluorescent speckle microscopy of cytoskeleton dynamics. Annu Rev Biophys Biomol Struct. 2006;35:361–387. | |
Krichevsky O, Bonnet G. Fluorescence correlation spectroscopy: the technique and its applications. Rep Prog Phys. 2002;65(2):251–297. | |
Giepmans BN, Adams SR, Ellisman MH, Tsien RY. The fluorescent toolbox for assessing protein location and function. Science. 2006;312(5771):217–224. | |
Reits EA, Neefjes JJ. From fixed to FRAP: measuring protein mobility and activity in living cells. Nat Cell Biol. 2001;3(6):E145–E147. | |
Gadella TW, Jovin TM, Clegg RM. Fluorescence lifetime imaging microscopy (FLIM): spatial resolution of microstructures on the nanosecond time scale. Biophys Chem. 1993;48(2):221–239. | |
Rust MJ, Bates M, Zhuang XW. Sub-diffraction-limit imaging by stochastic optical reconstruction microscopy (STORM). Nat Methods. 2006;3(10):793–795. | |
Betzig E, Patterson GH, Sougrat R, et al. Imaging intracellular fluorescent proteins at nanometer resolution. Science. 2006;313(5793):1642–1645. | |
Hess ST, Girirajan TP, Mason MD. Ultra-high resolution imaging by fluorescence photoactivation localization microscopy. Biophys J. 2006;91(11):4258–4272. | |
Yildiz A, Forkey JN, McKinney SA, Ha T, Goldman YE, Selvin PR. Myosin V walks hand-over-hand: single fluorophore imaging with 1.5-nm localization. Science. 2003;300(5628):2061–2065. | |
Trepat X, Deng LH, An SS, et al. Universal physical responses to stretch in the living cell. Nature. 2007;447(7144):592–595. | |
Fabry B, Maksym GN, Butler JP, Glogauer M, Navajas D, Fredberg JJ. Scaling the microrheology of living cells. Phys Rev Lett. 2001;87(14):148102. | |
Caspi A, Granek R, Elbaum M. Enhanced diffusion in active intracellular transport. Phys Rev Lett. 2000;85(26 Pt 1):5655–5658. | |
Mizuno D, Tardin C, Schmidt CF, MacKintosh FC. Nonequilibrium mechanics of active cytoskeletal networks. Science. 2007;315(5810):370–373. | |
Wang R, Lei L, Wang Y, Levine A, Popescu G. Dispersion relation fluorescence spectroscopy. Phys Rev Lett. 2012;109(18):188104. | |
Ramaekers FC, Bosman FT. The cytoskeleton and disease. J Pathol. 2004;204(4):351–354. |
 © 2016 The Author(s). This work is published and licensed by Dove Medical Press Limited. The full terms of this license are available at https://www.dovepress.com/terms.php and incorporate the Creative Commons Attribution - Non Commercial (unported, v3.0) License.
By accessing the work you hereby accept the Terms. Non-commercial uses of the work are permitted without any further permission from Dove Medical Press Limited, provided the work is properly attributed. For permission for commercial use of this work, please see paragraphs 4.2 and 5 of our Terms.
© 2016 The Author(s). This work is published and licensed by Dove Medical Press Limited. The full terms of this license are available at https://www.dovepress.com/terms.php and incorporate the Creative Commons Attribution - Non Commercial (unported, v3.0) License.
By accessing the work you hereby accept the Terms. Non-commercial uses of the work are permitted without any further permission from Dove Medical Press Limited, provided the work is properly attributed. For permission for commercial use of this work, please see paragraphs 4.2 and 5 of our Terms.