")
Back to Journals » Drug Design, Development and Therapy » Volume 10
Diminazene aceturate: an antibacterial agent for Shiga-toxin-producing Escherichia coli O157:H7
Authors Wu SY, Park GY , Kim SH, Hulme J, An SSA
Received 12 June 2016
Accepted for publication 15 July 2016
Published 14 October 2016 Volume 2016:10 Pages 3363—3378
DOI https://doi.org/10.2147/DDDT.S114832
Checked for plagiarism Yes
Review by Single anonymous peer review
Peer reviewer comments 3
Editor who approved publication: Prof. Dr. Wei Duan
Si-Ying Wu,1 Gil-Yong Park,1 So-Hee Kim,2 John Hulme,1 Seong Soo A An1
1Department of BioNano Technology, Gachon BioNano Research Institute, Gachon University, Seongnam-si, 2Seoul National University Bundang Hospital, Gyeonggi-do, Republic of Korea
Abstract: The aim of this study was to investigate the bacteriostatic and bactericidal effects of diminazene aceturate (DA) against five strains of pathogenic bacteria and two strains of nonpathogenic bacteria. The results showed that 5 µg/mL of DA suppressed the growth of pathogenic Escherichia coli by as much as 77% compared with the controls. Enterohemorrhagic E. coli EDL933 (an E. coli O157:H7 strain) was the most sensitive to DA with a minimum inhibitory concentration of 20 µg/mL. Additional investigations showed that DA induced the highest level of intracellular reactive oxygen species in EDL933. A positive correlation between the reactive oxygen species levels and DA concentration was demonstrated. DA (5 µg/mL) was also a potent uncoupler, inducing a stationary phase collapse (70%–75%) in both strains of E. coli O157:H7. Further investigation showed that the collapse was due to the NaCl:DA ratio in the broth and was potassium ion dependent. A protease screening assay was conducted to elucidate the underlying mechanism. It was found that at neutral pH, the hydrolysis of H-Asp-pNA increased by a factor of 2–3 in the presence of DA, implying that DA causes dysregulation of the proton motive force and a decrease in cellular pH. Finally, a commercial verotoxin test showed that DA did not significantly increase toxin production in EDL933 and was a suitable antibacterial agent for Shiga-toxin-producing E. coli.
Keywords: E. coli O157, Berenil©, ROS, reversible, protease, enterohemorrhagic
Introduction
According to recent reports from the Center for Disease Control and Prevention, there were eleven multistate outbreaks of Shiga-toxin (Stx)-producing Escherichia coli (STEC) in the US from 2011 to 2014 with six of them attributed to E. coli O157:H7.1 Most E. coli O157:H7 strains produce Stx type 2; its subunits bind to the surface of intestinal cells, and its A subunits enter and turn off protein synthesis by disrupting the large ribosomal unit.2–4 Bloody diarrhea is a hallmark of symptomatic cases. STEC-producing bacteria also cause hemolytic uremic syndrome (HUS). HUS is a disease characterized by hemolysis, thrombocytopenia, and acute kidney injury, although other organs may be involved. Most cases of HUS are due to infection with STEC.5–10 The use of antibiotics is controversial. It is recommended not to use antibiotics to treat STEC infection (E. coli O157) because of either no benefit or potential increase in the risk of developing HUS.11,12 Stx toxicity and the acute inflammatory response raised by the host determine the development of HUS. Currently, there is no specific therapy to control Stx damage. The pathogenic role of reactive oxygen species (ROS) on endothelial injury is well documented.13,14 Therefore, it is not surprising that antibiotics, bactericidal agents, and nanomaterials that utilize ROS-dependent mechanisms to kill pathogenic Stx bacteria increase the potential risk of HUS in certain individuals. In addition, reports from the microbiological community show that extracellular ROS can induce Stx production,15 which in turn induces ROS production in the host tissue.
One way to counter ROS damage to host tissue is to administer an antioxidant with an antibiotic. This was eloquently shown in the work by Kalghatgi et al16 in which N-acetyl-L-cysteine was used in combination with tetracycline (growth inhibitor) to inhibit the growth of E. coli and minimize ROS mammalian cell damage. Whether tetracycline induces Stx 1 or Stx 2 production, STEC O157 via ROS-dependent or ROS-independent pathways has not been reported. There are many old and new antioxidant/antibacterial compounds such as N-acetyl-L-cysteine and S-ethyl-L-cysteine that can be used to neutralize ROS.17 Another old antibacterial compound is diminazene aceturate (DA; active compound in Berenil), which is a potent inhibitor of trypsin-like enzymes18 and useful in the treatment of many diseases such as coronary and cerebral infraction, vascular clotting, arthritis, tumor cell invasion, and pancreatitis.19–23 Recent toxicity studies by Cappoen et al showed that adding DA to mammalian cell cultures did not induce ROS production.24 DA is reported to selectively inhibit the growth of commensal E. coli by binding to the ribosomal subunits.25 However, the commensal population of E. coli should be maintained to prevent enterohemorrhagic E. coli gaining a competitive foothold in the ileum and lower intestine. Moreover, there are many contradictory reports regarding the toxicity and clinical benefits of DA. For example, DA is classified as a topoisomerase II (Top II)26 poison in eukaryotes but improves the remodeling of damaged cardiac tissue which is dependent on Top IIβ activity in muscle cells.27
Given the numerous reports on STEC28–31 and the various factors (genetic and culturing conditions) that influence Stx induction, a potential antibacterial agent should exhibit two of the following three properties: first, bactericidal agents, antibiotics, and nanomaterials must inhibit and kill the pathogen (duality required) at several stages of the fission cycle. Second, the compound should not significantly induce either Stx 1 or Stx 2 production. Third, the compound must not induce ROS in mammalian cells.
The aim of this work was to investigate whether DA exhibited the first two properties. This was performed by studying the effects and antibacterial mechanisms of DA on the growth and viability of different strains of STEC O157:H7, commensal, and other pathogenic bacteria. The effects of DA on intracellular and extracellular ROS levels in different strains of E. coli O157:H7 were measured by ROS probe and peroxidase assay. Physical changes in cell morphology and membrane integrity after exposure to DA were imaged with scanning electron microscopy (SEM). The effects of DA and common antibiotics on Stx production were measured with a commercial verotoxin (VT) test.
Materials and methods
Bacterial strains and growth cultures
E. coli O157:H7 (Korean Agricultural Culture Collection [KACC] 11598, EDL933) isolated from the 1982 outbreak of hemorrhagic colitis in Michigan was obtained from the KACC (South Korea) as were E. coli strains (KACC 10005 and K-12). E. coli O157:H7 (KACC 10765, EDL931) was donated by Professor Lee’s laboratory. Listeria monocytogenes (ATCC 19115) and Enterococcus faecalis (ATCC 29212) were purchased from the American Type Culture Collection (ATCC, Manassas, VA, USA). Staphylococcus aureus (KACC 13252, STA) was a gift from Professor Seong Soo A An’s laboratory. All of these strains were maintained in 15% glycerol stock at −80°C and reactivated in proper broth before culturing.
The effects of DA on bacterial growth patterns
For the negative controls, K-12, EDL931, and EDL933 (106 CFU/mL) were grown in Luria–Bertani (LB) broth (Sigma-Aldrich Co., St Louis, MO, USA). L. monocytogenes, E. faecalis, and S. aureus (106 CFU/mL) were grown in nutrient broth (NB; Sigma-Aldrich Co.) (pH 7.0) at 34°C. L. monocytogenes, S. aureus, and E. faecalis were grown in NB media, because they grew poorly in LB broth. E. coli strains were grown in LB broth, because they grew well. K-12 and E. coli 10005 (EC10005) were chosen as model commensal strains. The optical density (OD; 600 nm) value was recorded every 2 hours using an ultraviolet (UV)–visible spectrophotometer for 24 hours; all the measurements were performed in triplicate; and the final results were averaged. This process was repeated at 37°C and 42°C.
Minimum inhibitory concentrations
In the sample groups, DA was added to the broth at the beginning with variable concentrations at 2 μg/mL, 5 μg/mL, 10 μg/mL, 20 μg/mL, 40 μg/mL, 60 μg/mL, 80 μg/mL, 120 μg/mL, and 150 μg/mL. Sample groups were incubated at 37°C and the growth was recorded using a UV–visible spectrophotometer (600 nm) every 2 hours; all the measurements were run in duplicate.
The effect of administering DA in the log phase
The incubation method was identical to the procedure mentioned earlier. For the sample groups, a fixed concentration of DA was added to each strain of bacteria in the mid-log phase (OD value 0.45) at 34°C. The change in the OD was subsequently recorded every 2 hours; all the measurements were performed in triplicate. This process was repeated at 37°C and 42°C.
The effects of LB broth pH on the antibacterial activity of DA
K-12, EDL931, and EDL933 were grown in acidic LB/DA broth (pH 5.0) at 34°C for 8 hours. This process was repeated using neutral LB/DA broth. After such time, the bacteria were centrifuged at 4000 rpm for 5 minutes and then resuspended in either fresh acidic or neutral LB/DA broth. Cell density was measured every 2 hours over a 24-hour period. Control was set by changing the broth with a new LB broth (pH 7.0) with 5 μg/mL DA at 8 hours.
Reactive oxidative species assay
K-12, EDL931, and EDL933 were grown in LB broth (control) and LB-broth-containing DA (5 μg/mL) at 34°C for 6 hours and 12 hours (DA was added to LB broth in the mid-log phase). Three samples were taken of each strain, harvested by centrifugation, and then washed twice with Hanks’ balanced salt solution (HBSS) as reported earlier.32 All samples were resuspended in HBSS and then diluted with the same solution until each sample contained ~108 CFU/mL. A stock solution of the ROS probe, 2′,7′-dichlorofluorescin-diacetate (DCFHDA), was dissolved in dimethyl sulfoxide at a concentration of 1 mM and stored in dark at −20°C. In an eppendorf tube, 1 mL of suspended bacteria cells from each sample was then mixed with 1 mL of 20 mM DCFHDA/HBSS. Each tube was then wrapped in aluminum foil and placed in an automatic shaker (150 rpm) at 37°C for 2 hours. Cells were then collected by centrifugation at 5,000 rpm for 2 minutes and then washed twice with fresh medium to remove the free probe. The fluorescent intensity of the oxidized product, namely dichlorofluorescin, was detected at an emission wavelength of 535 nm (excitation wavelength [Ex] 488 nm) by a fluorescence spectrophotometer (F-4500; Hitachi Ltd., Tokyo, Japan). The fluorescent intensity of DA-treated bacteria was then compared with untreated bacteria, and the level of intracellular ROS was estimated.
Whole cell and lysate peroxidase activity
For the cell peroxidase test, K-12, EDL931, and EDL933 were grown in LB broth with and without 2% glucose at 37°C in a 130 rpm shaker for 6 hours. Then, 1 mL samples were taken of each bacterium and centrifuged (4,000 rpm for 5 minutes). In accordance with earlier reports,33 the supernatant was removed and the pellet was washed and resuspended with phosphate-buffered saline (PBS) solution. Cell concentrations were read at 600 nm, then diluted with PBS until an OD value of 0.1 (108 CFU/mL) was achieved. Aliquots of 20 μL of cell solution were dispensed into the microtiter plate, and 3,3′,5,5′-tetramethylbenzidine (TMB) solution was added. The plate was incubated at 37°C for 30 minutes, and the absorbance of the wells read at 405 nm. The procedure was repeated using cells grown in LB broth containing 2% glucose in the presence of increasing concentrations of DA (control: 0 μg/mL; samples: 1 μg/mL, 2 μg/mL, and 5 μg/mL).
For the cell lysis peroxidase assay, 1 mL of a fixed concentration of cells was removed from the broth, centrifuged, washed in deionized water, and then resuspended with PBS. Lysozyme was added to each sample (2 μg/mL); the samples were placed in an ice bath for 15 minutes and then sonicated for 2 minutes (ice bath) to help the cells to break. Samples were then washed with cold PBS and then diluted with PBS to an OD value of 0.1 at 600 nm before use. Then, 20 μL aliquots of lysate solution were added to a series of microwells and incubated with TMB solution at 37°C for 30 minutes. The reaction was stopped by H2SO4, and the absorbance was measured at 405 nm.
Two stock solutions of horseradish peroxidase (HRP; 20 μg/mL) were prepared in PBS (pH 7.4). A series of phosphate-buffered HRP solutions containing 0.1–5 μg/mL of enzyme were then prepared and left to equilibrate at 37°C for 1 hour. Aliquots of 20 μL of HRP solutions were then distributed into 20 μL wells (0.5 mL capacity) to which 80 μL of either TMB (positive control) or TMB and DA (5 μg/mL, well concentration) was added. The plate was then placed in a 37°C incubator and shaken at 80 rpm for 30 minutes. After incubation, 50 μL of 2 N H2SO4 (aq) was added to stop the reaction and the OD was measured at 450 nm using a Perkin Elmer plate reader (Victor3 spectrophotometer; PerkinElmer Inc., Waltham, MA, USA).
Examination of cell morphology by SEM
Samples of DA-treated E. coli O157:H7 (108 CFU/mL) were transferred to fresh glass slides, and then fixed using 10% glutaraldehyde/Tris-buffered solution (0.1 M, pH 7.5) for 1 hour at room temperature. Samples were dried to critical point with CO2, spluttered, coated, and then analyzed under field emission (FE)-SEM (SU9000 UHR FE-SEM; Hitachi High Technologies, Tokyo, Japan). Atomic force microscopy images of live and dead bacteria were obtained using an atomic force microscope (Nanoscope 111; Digital Instruments, Oyster Bay, NY, USA) in tapping mode (cantilever length: 125 μm) with Vecco RTSEP probes at a scan rate of 1 Hz and scan size of 5 μm. Average height and surface roughness values for live and dead bacteria were collected and analyzed using Nanoscope software.
The effect of KCl on the viability of EDL933
In LB broth, 1 M stock KCl solution was prepared. To ten 50 mL of sterile polypropylene tubes, ~40 mL of EDL933 (106 CFU/mL) LB broth was added. The experiment consisted of two sample groups: A (tubes 1–4) and B (tubes 5–7). Tube 1 contained EDL933 broth solution (negative control). Aliquots of DA were added to tubes 2 (positive control), 3, and 4 giving a final concentration of 5 μg/mL in each tube. To tube 3 (50 mM KCl), KCl broth solution was added (time zero). Tubes 1–4 were placed in a 37°C incubator; after 9 hours of growth, an aliquot of KCl broth solution was then added to tube 4 (50 mM KCl).
For sample group B, tube 5 was the negative control. To tube 6, a KCl aliquot was added (50 mM KCl). Tubes 5, 6, and 7 were then placed in a 37°C incubator. After 6 hours, DA (5 μg/mL) was added to tubes 6 and 7. To tube 7, an aliquot of KCl broth solution was added after 9 hours of growth. Sample groups A and B were cultured for 24 hours, and the OD was recorded every 2 hours. All the samples were performed in triplicate.
Protease screening assay
Bacterial strains, K-12, EDL933, and EDL931 were grown separately in LB broth for 6 hours at 37°C. A total of 21 para-nitroaniline (pNA) substrates were purchased from Bachem Americas, Inc. (Torrance, CA, USA) (H-Gly-Arg-βNA·HCl, H-Arg-Arg-βNA·3HCl, H-Gly-Phe-pNA, H-Lys-Ala-βNA, Ac-Glu-pNA, AC-Asp-pNA, H-Glu-Gly-Arg-pNA·acetate salt, H-Gly-Pro-βNA, H-Asp-pNA·HCl, Suc-Ala-Ala-Ala-pNA, Suc-Ala-Ala-Pro-Glu-pNA, Suc-Gly-Gly-Phe-pNA, Suc-Ala-Phe-Pro-Phe-pNA, Suc-Ala-Ala-Pro-Arg-pNA, Suc-Gly-Gly-Phe-pNA, H-Phe-pNA, Sar-Pro-Arg-pNA, H-D-Ile-Phe-Lys-pNA·salt, Z-Tyr-Lys-Arg-pNA·2TFA, Tos-Gly-Pro-Lys-pNA, MeOSuc-Ala-Ala-Pro-Met-pNA, and Z-Arg-pNA). A stock solution of each substrate (20 mM) was prepared in dimethyl sulfoxide and refrigerated until use. Dilution buffers, sodium citrate (0.1 M; pH 4 and 5), sodium phosphate (0.1 M, pH 6.0), and saline Tris buffer (0.1 M, pH 7.4) were prepared in deionized water.
From each broth, 1 mL of bacterial suspension was removed and centrifuged at 130 rpm for 5 minutes. The supernatant was removed, and the cells were diluted to 108 CFU/mL in pH buffer. Then, 40 μL of cells (108 CFU/mL), 50 μL of buffer (pH 4), and 10 μL of pNA substrate (2 mM) were added to each well; all the samples were performed in triplicate. The reaction was left to run overnight at 37°C, and the production of pNA was read at 405 nm the next morning. The procedure was repeated using pH buffers 5, 6, and 7 and pH buffers 5, 6, 7 containing 5% glucose.
VT test
In six separate tubes (50 mL), EDL933 was grown in LB broth at 37°C until an OD value of 0.35 was obtained. To tube 1, no antibacterial agent was added (negative control), to tubes 2–6, 0.5 μg/mL of Mitomycin, 1 μg/mL of Ampicillin, 5 μg/mL of DA, 5 μg/mL of Novobiocin, and 5 μg/mL of Pentamidine were added, respectively; all tubes were then incubated at 37°C for 20 hours. OD values of the broths were recorded on a UV spectrometer. The tubes were then centrifuged at 2,000 rpm for 10 minutes; 200 μL of the supernatant was dispensed onto the test surface in accordance with manufacturer’s instructions (Duopath Verotoxins; EMD Millipore, Billerica, MA, USA). The test can detect both VT1 and VT2. Band intensities (obtained by Kodak Image Station 4000MM PRO) were converted into peak images via Free ImageJ analysis software. The amounts of VTs produced were estimated by calculating the cumulative area of the peaks (OriginLab Corporation, Northampton, MA, USA).
Results
The effects of DA on the growth of pathogenic and nonpathogenic bacteria
Figure 1A–D shows the effect of DA (5 μg/mL) in LB broth on the growth of different strains of bacteria at a fixed temperature (34°C). When compared with the negative controls, DA suppressed the growth of K-12 the most (−78%), followed by EDL933 (−75%), EDL931 (−72%), and EC10005 (−35%). DA/NB broth did not significantly suppress the growth of neither L. monocytogenes and S. aureus nor E. faecalis. Figure 1E shows the effects of temperature on the percentage population of different strains of E. coli grown for 24 hours in DA/LB (5 μg/mL) broth compared with the control. An 8°C rise in temperature from 34°C to 42°C increased the percentage populations of K-12 by 46%, EDL931 and EC10005 by 9%. EDL933 samples grown for 24 hours (Table S1) in 2 μg/mL and 20 μg/mL of DA/LB broth revealed similar OD values of 0.182 and 0.168 after 24 hours of growth implying that DA not only inhibits EDL933 growth but also kills the bacteria during the fission cycle.
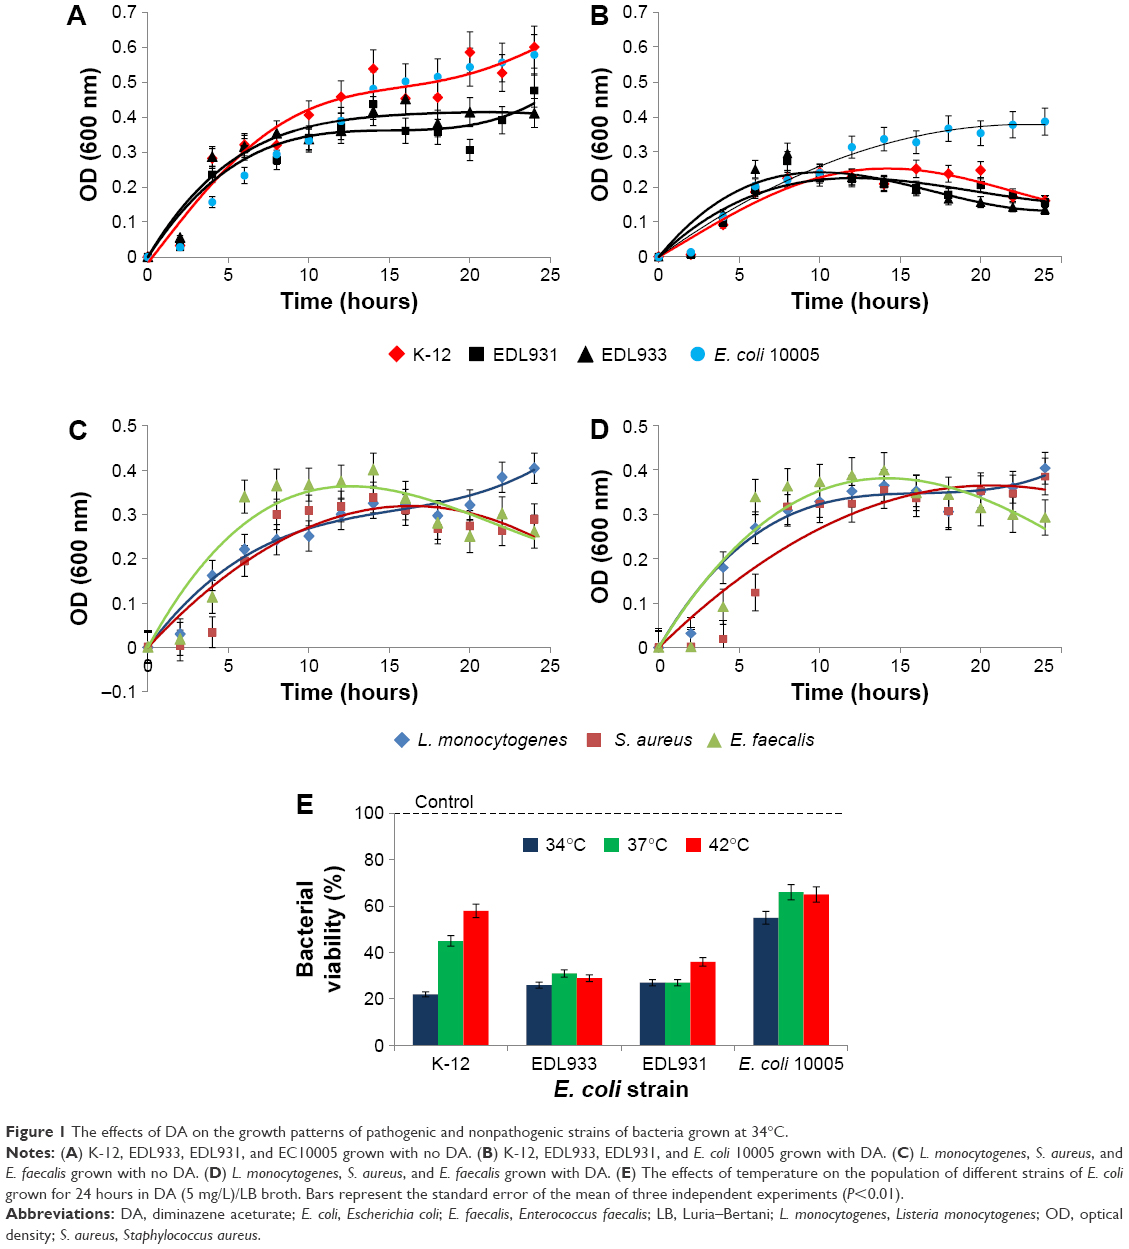 | Figure 1 The effects of DA on the growth patterns of pathogenic and nonpathogenic strains of bacteria grown at 34°C. |
The minimum inhibitory concentrations for each strain of bacteria are shown in Table 1. EDL933 and K-12 strains of E. coli were the most and least sensitive to DA exhibiting values of 20 μg/mL and 120 μg/mL, respectively. L. monocytogenes, S. aureus, and E. faecalis were highly resistant to DA exhibiting minimum inhibitory concentrations >120 μg/mL. Such concentrations are toxic to humans; therefore, these strains were excluded from further testing.34,35
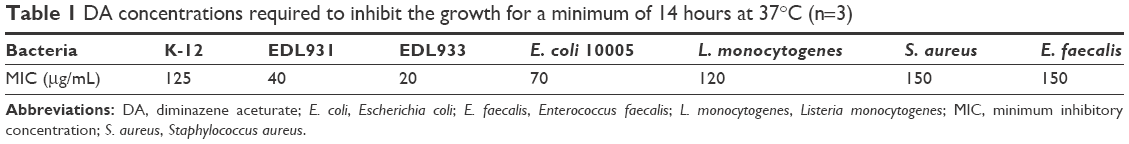 | Table 1 DA concentrations required to inhibit the growth for a minimum of 14 hours at 37°C (n=3) |
The effect of administering DA in the log phase
In the next stage of this study, we examined the effect of adding DA (5 μg/mL) to growing bacteria (mid-log phase) to see whether DA could kill as well as inhibit the growth of different strains of E. coli O157 in accordance with the first part of the criteria. Figure 2A shows the impact of adding DA in mid-log phase on the growth patterns of K-12 and both strains of E. coli O157:H7. The growth pattern of K-12 is unaffected by the addition of DA in the mid-log phase. However, 6–8 hours after the addition of DA, the growth curves for both strains of E. coli O157:H7 collapse with mortality rates ranging from 70% to 75%. The experiment was then repeated at 37°C and 42°C, and the results are shown in Figure 2B. An 8°C rise in temperature from 34°C to 42°C improved the population viability of K-12 by 23.4%, EDL931 by 26.6%, and EDL933 by 2.8%. The effects of broth pH on the antibacterial activity of DA are shown in Figure S1. The next part of the investigation aims to elucidate the mechanisms by which DA inhibits the growth and induces the collapse in populations of EDL933 and EDL931.
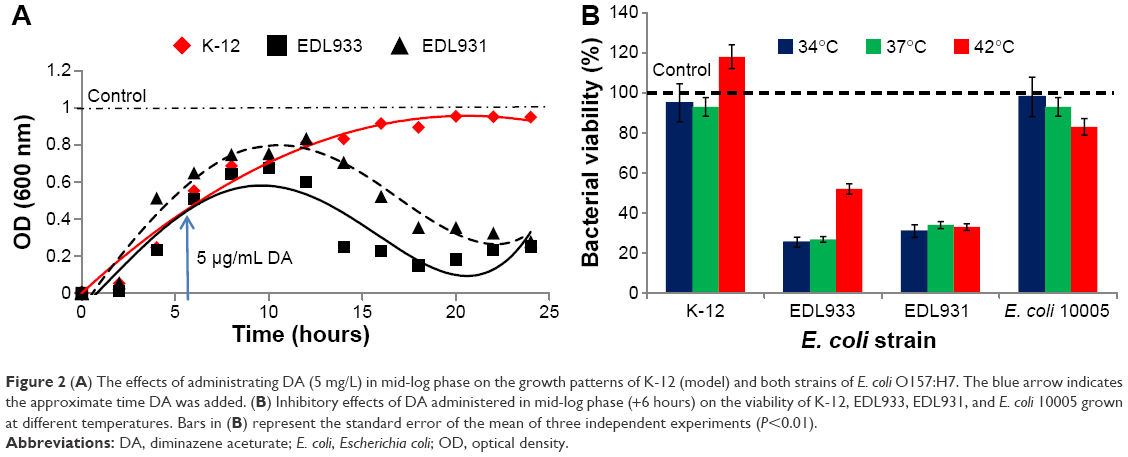 | Figure 2 (A) The effects of administrating DA (5 mg/L) in mid-log phase on the growth patterns of K-12 (model) and both strains of E. coli O157:H7. The blue arrow indicates the approximate time DA was added. (B) Inhibitory effects of DA administered in mid-log phase (+6 hours) on the viability of K-12, EDL933, EDL931, and E. coli 10005 grown at different temperatures. Bars in (B) represent the standard error of the mean of three independent experiments (P<0.01). |
DA inhibits the growth of EDL933
As mentioned earlier, ROS are known to enhance VT production. The level of ROS generated in E. coli strains, K-12, EDL931, and EDL933, grown in DA (5 μg/mL) in LB broth was detected using the fluorescent probe DCFHDA. The probe is hydrolyzed via an esterase to form DCFH in the cytoplasm of the bacteria and converted into a fluorescent product (DCF) only in the presence of ROS. Figure 3A–C shows that the amount of ROS generated in the controls was negligible. Samples (Figure 3D–F) showed that ROS production was strain dependent with EDL933 producing approximately ten times (735 AU) more ROS than K-12 (68 AU). We also recorded the fluorescence signal when DA was added in mid-log phase (samples, Figure 3G–I), but no significant amount of ROS was detected in any of the samples compared with the control. It must be noted that the oxidative stresses experienced by these cells in aerobic culture may not occur when the cells are cultured under anaerobic conditions. ROS causes the induction of Stx-converting prophages, but the relationship between extracellular ROS and its effects on extracellular peroxidase activity has not been reported.
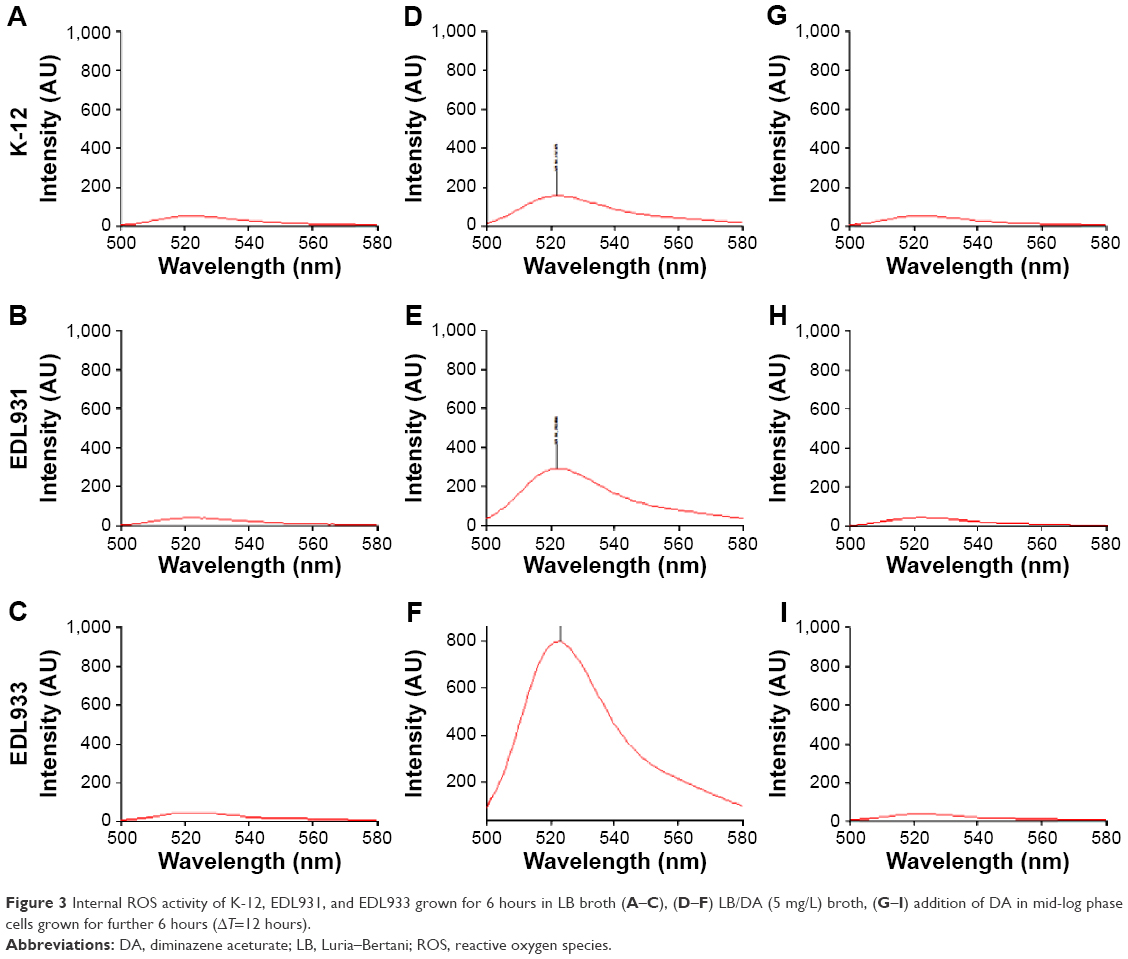 | Figure 3 Internal ROS activity of K-12, EDL931, and EDL933 grown for 6 hours in LB broth (A–C), (D–F) LB/DA (5 mg/L) broth, (G–I) addition of DA in mid-log phase cells grown for further 6 hours (ΔT=12 hours). |
The effect of DA and glucose on extracellular peroxidase activity
In this section, we investigated whether glucose or DA can render EDL933 more susceptible to external ROS attack when it is grown in saturated glucose LB broth and saturated glucose LB-containing DA using a simple TMB assay. Figure S2 shows that glucose (2%, w/v) produces a negligible drop in the peroxidase activity of K-12 and EDL931, while the peroxidase activity of EDL933 decreases >65%. Figure 4A also shows that the extracellular peroxidase activity of live EDL933 and its lysate is inhibited in a concentration-dependent manner by DA. Overall, the highest decrease (−80%) in extracellular peroxidase activity was recorded for EDL933 grown in 2% glucose/DA (5 μg/mL) broth. The drop in peroxidase activity could be a simple case of enzyme inhibition. Figure 4B shows that there is no statistical difference between the standard positive control and DA samples; therefore, DA does not directly affect TMB catalysis.
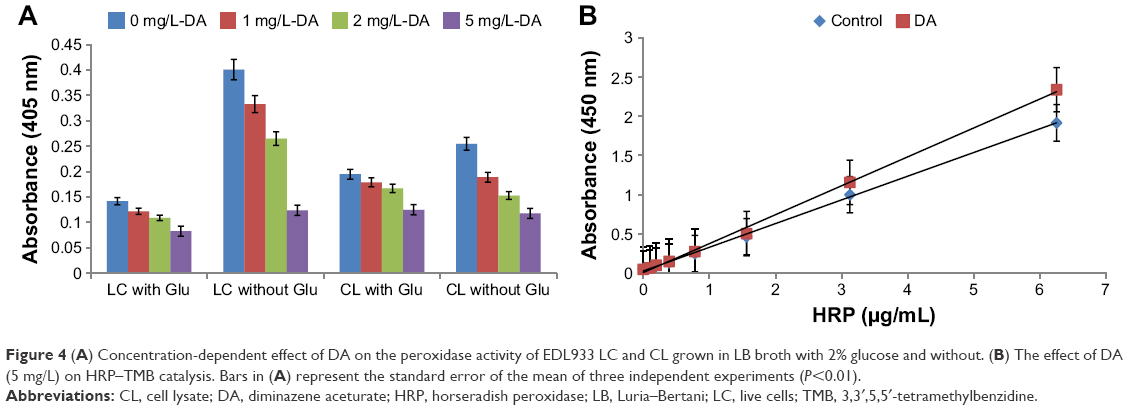 | Figure 4 (A) Concentration-dependent effect of DA on the peroxidase activity of EDL933 LC and CL grown in LB broth with 2% glucose and without. (B) The effect of DA (5 mg/L) on HRP–TMB catalysis. Bars in (A) represent the standard error of the mean of three independent experiments (P<0.01). |
The effect of potassium on EDL933 viability
In addition to ROS, there are other factors such as pH, temperature, hydrostatic pressure, chelating agents, and UV irradiation that enhance VT production. We have shown that DA can kill EDL933 and EDL931 in the absence of ROS. Therefore, what are these shared properties that make these strains equally susceptible to DA? In this section, we examine the effects of potassium ion concentration on population collapse. If DA is acting as a proton uncoupler and thereby limiting the uptake of K+, saturating, the medium with the potassium will ensure sufficient uptake (via chemical gradient) of the ion by EDL933 and prevent a collapse in the proton motive force.
Figure 5A shows that the addition of potassium salt to LB/DA broth at 0 hour and +9 hours does not improve the viability of E. coli O157:H7 compared with the controls. On the other hand, the viability of EDL933 significantly improves when DA is added to LB/KCl (50 mM) broth after 6 hours of growth. We then repeated the latter experiment using LB broth containing 80 mM, 100 mM, 150 mM, and 200 mM of KCl. Figure 5B shows that the viability of EDL933 increases with increasing KCl concentration. Then, 100% viability was restored using a concentration of 200 mM KCl, which is approximately five times higher than the potassium concentration in tryptone soya broth.
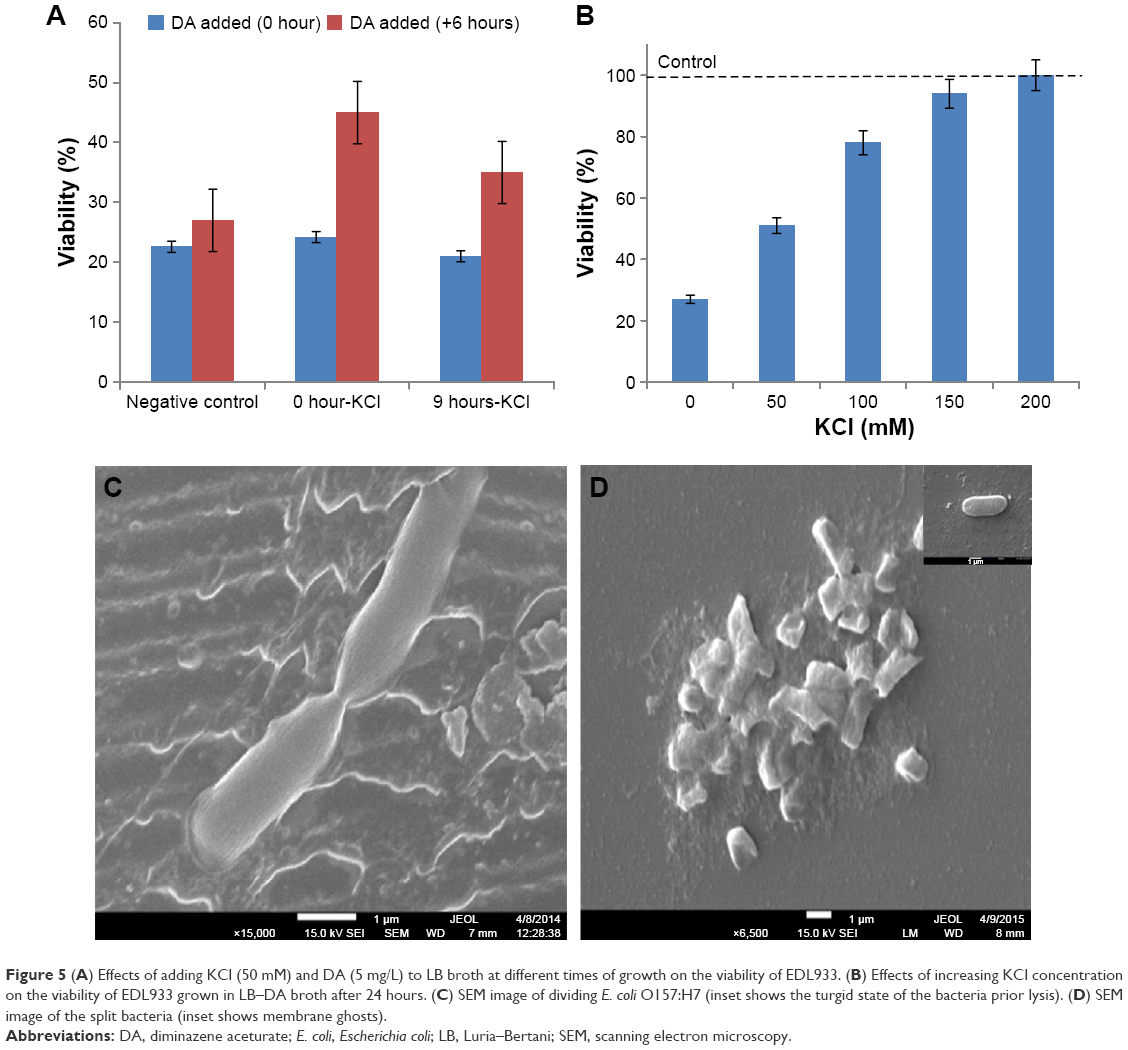 | Figure 5 (A) Effects of adding KCl (50 mM) and DA (5 mg/L) to LB broth at different times of growth on the viability of EDL933. (B) Effects of increasing KCl concentration on the viability of EDL933 grown in LB–DA broth after 24 hours. (C) SEM image of dividing E. coli O157:H7 (inset shows the turgid state of the bacteria prior lysis). (D) SEM image of the split bacteria (inset shows membrane ghosts). |
Limited potassium ion uptake may be the cause of the collapse, but it does not tell us how DA induces the collapse, or why both strains of E. coli O157:H7 are particularly vulnerable to collapse in the log phase. SEM images of EDL933 before the addition of DA to LB broth and an hour prior population collapse are shown in Figure 5C. The image provides a unique insight into the effects of cell division on the shape of the bacteria, elasticity of the membrane, and the surface area of the poles. The number of creases/folds in the membrane at the polls is significantly higher compared with the main body of the bacteria. Further examination of the surface of main body of bacteria shows a terrace-like structure along its longitudinal axis. However, the bacteria in the insert appear swollen, distorted, and elevated from the surface, with no discernable creases in the membrane. Further SEM analysis (Figure 5D) shows that the dead bacteria are split into two or appear as membrane ghosts. The internal force required to split a bacteria in half is significantly greater than the force required to perforate one. The type of debris in Figure 5D is often seen in osmotically lysed cells.
We then investigated the effects of increasing DA concentrations on the viability of EDL933. Surprisingly, 10 μg/L and 20 μg/L of DA induced a smaller population collapse than 5 μg/L, suggesting that the concentration of broth constituents may influence the antibacterial activity of DA. In the final part of this section, we measured the effects of increasing NaCl concentrations (5 g/L, 6 g/L, and 7 g/L NaCl) in LB broth on the viability of E. coli O157:H7 using a fixed concentration of 20 μg/L of DA (data not shown). At 7 g/L of NaCl, the viability of bacteria decreases to 20%; thus, the speed and severity of the collapse seen in both strains of E. coli O157:H7 are due to the concentration ratio of sodium to DA and not DA alone.
The effects of DA on protease activity of E. coli
The effect of buffer pH and glucose (Figure S3) on the proteolytic activity of K-12 is shown in Figure 6A. In the absence of glucose, cellular protease activity was highest at pH 5 and lowest at pH 6, H-Phe was identified as a potential marker for K-12 (pH 5). When excess glucose was present in the assay medium (S4), cellular protease activity was lowest at pH 5 and highest at pH7, and H-Asp-pNA and Ac-Asp-pNA were identified as potential markers for K-12 (pH 7). Across the pH range (5–7), the sum of protease/proteolytic activity of K-12 measured in saturated glucose buffer was 6% lower compared with the negative control (K-12 in buffer only).
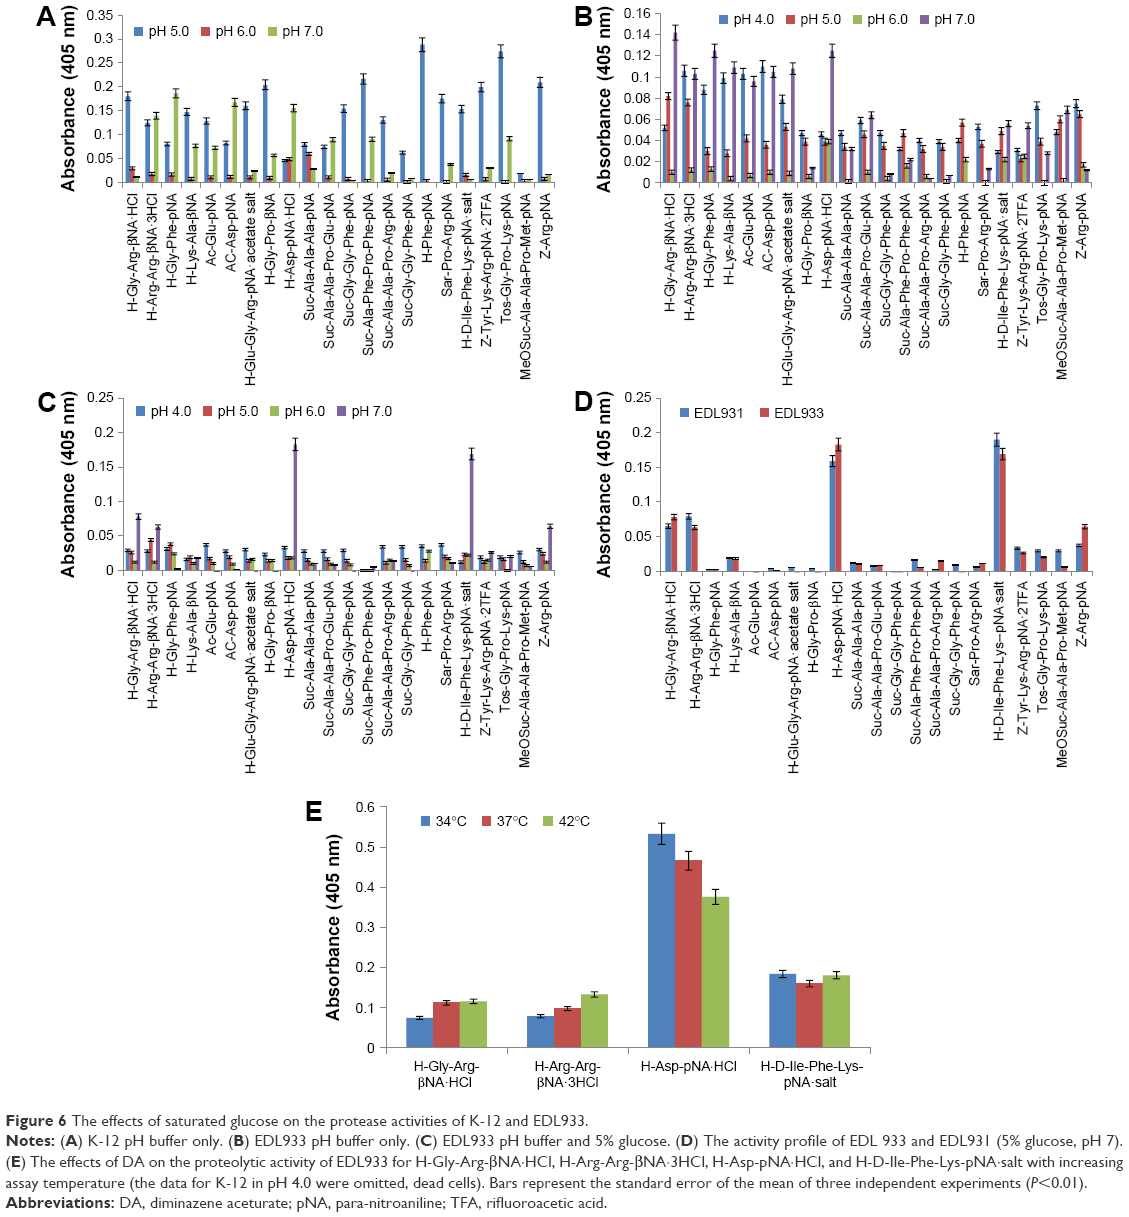 | Figure 6 The effects of saturated glucose on the protease activities of K-12 and EDL933. |
Figure 6B and C shows the influence of glucose on the protease/proteolytic activity of EDL 933. In the absence of glucose, activity is broad, weak, and nonspecific, but when the media is saturated with glucose the profile changes completely. This trend is also observed in the activity profile of EDL931 (Figure 6D). Across the pH range (5–7), the sum of protease/proteolytic activity of EDL933 measured in glucose buffer was 48% lower compared with the negative control (EDL933 buffer alone). Substrates H-Gly-Arg-βNA·HCl, H-Arg-Arg-βNA·3HCl, H-Asp-pNA·HCl, and H-D-Ile-Phe-Lys-pNA·salt were identified as potential markers for E. coli O157:H7.
A similar experiment to the one described earlier using the four substrates and EDL933 (control) was then conducted, and the results are shown in Figure 6E. EDL933 incubated with DA showed a small increase in protease/proteolytic activity to two of the four substrates; there was no change in the activity to H-D-Ile-Phe-Lys-pNA (serine protease substrate) salt, but a significant increase (×2.5) in protease activity for H-Asp-pNA (substrate for peptidase E, B and L-asparaginases). The experiment was repeated at 37°C and 42°C as well.
DA does not induce VT production in EDL933
Figure 7A shows the visual results of the commercial test. The control (LB broth) is weakly positive for VT2 and negative for VT1. Mitomycin C tests were positive for VT1 and VT2; Novobiocin and Pentamidine test was negative for VT1 and VT2, whereas DA is weakly positive for VT1 compared with the control. However, Ampicillin tested positive for VT1 and negative for VT2, which is surprising. To confirm the visual observations, samples were also imaged under UV light (Figure 7B) and subsequently analyzed (Figure 7C), and the total amount of VT was tabulated (Figure 7D). Overall, Ampicillin/LB media (1 μg/mL) contained low levels of VT2 but significantly higher levels of VT1 (57%), while LB media containing DA had significantly lower levels of VT2 and slightly higher levels of VT1 compared with the controls. In terms of total verotoxins (VT1 and VT2) in the broth, Mitomycin C produced the highest value of 1.21 followed by Ampicillin, LB broth, DA, Pentamidine, and Novobiocin. It should be noted that neither Pentamidine nor Novobiocin induced a collapse in the EDL933 population when administered in the mid-log phase.
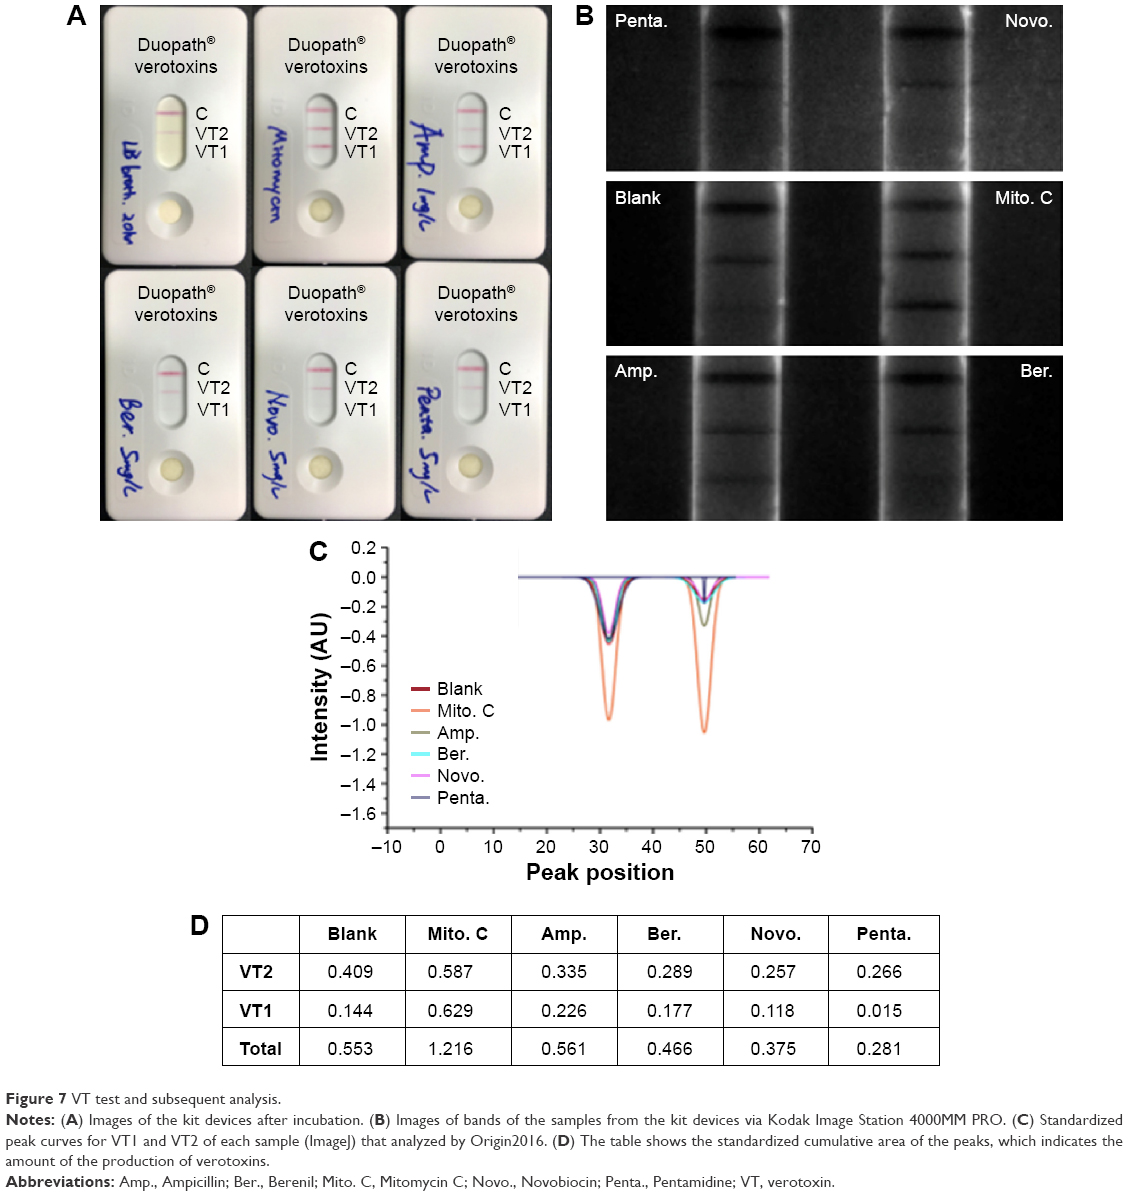 | Figure 7 VT test and subsequent analysis. |
Discussion
The first line of defense against any pathogenic infection is a healthy diverse commensal microbiome. E. coli is believed to be an all-rounder running a thin line between commensalism and pathogenicity. Thus, it is essential to prove that DA is selective for STEC O157 over the commensal population. Within the microbiological community, K-12 is considered the model strain of E. coli commensalism, whereas EC10005 can act as both depending on environment stresses. It is well reported that antibiotic resistance of many strains of K-12 and wild-type E. coli O157 increases with temperature.36 Antibiotic resistance in E. coli is governed by two properties of genes: pleiotropy and epistasis. The latter describes how the antibiotic resistance mutations affect other functions, hence their fate in other environments. Epistasis describes how well different mutations combine in their effect on resistance.37 Therefore, it is necessary to know what effect temperature has on the resistance of both pathogenic and commensal E. coli to DA and if such effects are of benefit to the commensal population. The results in Figure 1 show that at higher temperatures DA is more selective for both strains of E. coli O157 than the commensal strains. The results in Figure 2 also shows that the viability of commensal strains improves significantly when DA is administered in the log phase which could be due to a change in the membrane permeability of the commensal strains during the log phase. Taking the results from Figures 1 and 2, in addition to the pH data given in Figure S2, it is reasonable to suggest that at neutral pH DA is a selective antibacterial agent for E. coli O157:H7 when it is administered at 37°C.
Recent work has illustrated that phenotypes such as cell death, mutagenesis, oxidative stress, and OxyR activation can all be reduced depending on the method of culturing.38 Another interesting observation was that in the presence of catalase, which can break down H2O2, STEC-dependent Tetrahymena killing in cocultures diminished.39 Saturated glucose media is known to increase ROS in mammalian cells and reverse the effect of citrate and the inhibition of 933WΔtox in STEC.40 In addition, earlier reports hinted at a possible feedback mechanism between ROS, phage induction, and membrane peroxidase activity.41 The results in Figures 3 and 4 suggest that DA inhibits the growth of EDL933 by increasing intracellular ROS levels and decreasing extracellular peroxidase activity making the host bacteria more susceptible to external ROS attack. Whether a drop in extracellular peroxidase activity indicates the bacteria has entered the lytic cycle requires further investigation, but it is reasonable to assume that the elevated ROS levels will reduce membrane integrity making lysis easier.
K+ transport is one of a large number of mechanisms contributing to pH homeostasis. Many bacteria primarily use net potassium uptake to compensate for proton extrusion that establishes the proton motive force (PMF), thus alkalinizing the cytoplasm at low external pH. In E. coli, the ΔpH of potassium-depleted cells varies with the K+ concentration of resuspension medium. The regulation of cytoplasmic pH during acid stress depends on ion transport and catabolic acid consumption. It is well known42 that K-12 has a much higher intracellular store of potassium than E. coli O157:H7, which may account for the absence of a population collapse in Figure 2. If DA is simply acting as a PMF uncoupler, akin to carbonylcyanide-m-chlorophenylhydrazone as suggested earlier, one way to test this theory is to measure the drop in the uptake of gentamicin-labeled Texas Red in O157 cells using FACS as the PMF drops. Taking the results from Figures 1 to 5 into account, it is apparent that DA can inhibit, suppress, and uncouple EDL933 by acting on multiple targets within the bacteria. In an effort to identify as many targets as possible, we then examined the effects of DA on the protease activity of EDL933 and EDL931. The assay was performed in saturated glucose to ensure that a strong PMF was maintained in EDL933 and EDL931. This resulted in both strains of O157 exhibiting near-identical proteolytic profiles (Figure 6D).
In the presence of DA, there is twofold to threefold (Figure 6E) increase in proteolytic activity for Asp at 34°C and 37°C, which indicates DA is upregulating either the dctA or aspA gene (aspartate ammonia-lyase enzyme function) in the gluconeogenesis pathway. Further investigation should be conducted as to the effect of DA on the genes responsible for the assimilation of ethanolamine, urea, agmatine, and amino acids (Asp, Thr, Gly, Ser, and Trp) and how DA influences the gluconeogenesis pathway in EDL933 and other pathogenic strains.
As mentioned in the Introduction, a suitable antibacterial agent for STEC should not induce VT production. To show DA does not induce the phage induction cascade and is a suitable antibacterial agent for EDL933, we investigated the effects of DA on VT production. The results in Figure 7 clearly show that both Mitomycin C and Ampicillin induce the production of VTs in EDL933, whereas DA does not. Moreover, DA is a much better antibacterial agent lysing 77% of the EDL933 population compared with 30% and 20% (data not shown) for Mitomycin C and Ampicillin, respectively. The weakly VT2 positive seen in the control and DA samples is probably due to the nitrates (10 mM) in the LB media. It should be noted that the degree of lysis will affect the total VT concentration as such the peak values for Mitomycin C and Ampicillin are negatively bias (underestimated). Future work will focus on the quantification of VT and investigate the exciting possibility that DA inhibits the autocatalytic serine protease activity of the CI repressor rendering the prophage uninducible.43
Conclusion
To our knowledge, no investigations regarding the ability of DA to inhibit or suppress the growth of E. coli O157:H7 via ROS accumulation have been reported. EDL933 demonstrated the highest peroxidase activity and the highest internal ROS levels out of all the strains investigated. In addition, we have also shown that DA is an effective uncoupler of the PMF in more than one strain of E. coli O157:H7 and that the underlying mechanism does not induce the production of VTs. Therefore, we conclude that DA is a suitable antibacterial agent for E. coli O157, because it can inhibit and kill different strains of STEC at various stages of the fission cycle using a variety of ROS-dependent and ROS-independent mechanisms without inducing a significant increase in Stx production.
Acknowledgment
This work was supported by the GRRC program of Gyeonggi Province (GRRC Gachon 2016-B02, Development of Micro-fluidic Chip for Diagnosing Diseases).
Disclosure
The authors report no conflicts of interest in this work.
References
Choi KS, Kim SH, Kim EO, et al. Protection from hemolytic uremic syndrome by eye drop vaccination with modified enterohemorrhagic E. coli outer membranes vesicles. PLoS One. 2014;9:e100229. | ||
Tarr PI, Gordon CA, Chandler WL. Shiga-toxin-producing Escherichia coli and haemolytic uraemic syndrome. Lancet. 2005;365(9464):1073–1086. | ||
Dallman TJ, Byrne L, Ashton PM, et al. Whole genome sequencing for national surveillance of Shiga toxin producing Escherichia coli O157. Clin Infect Dis. 2015;61(3):305–312. | ||
Yoon JW, Hovde CJ. All blood, no stool: enterohemorrhagic Escherichia coli O157 infection. J Vet Sci. 2008;9:219–231. | ||
Campbell DM, Rappocciolo G, Jenkins FJ, Rinaldo CR. Dendritic cells: key players in human herpesvirus 8 infection and pathogenesis. Front Microbiol. 2014;5:452. | ||
Obrig TG. Escherichia coli Shiga toxin mechanism of action in renal disease. Toxins. 2010;2:2769–2794. | ||
Kim SH, Lee YH, Lee SH, et al. Mouse model for hemolytic uremic syndrome induced by outer membrane vesicles of Escherichia coli O157:H7. FEMS Immnol Med Microbiol. 2011;63(3):427–434. | ||
Gomez SA, Recalde MJA, Panek CA, et al. The oxidative stress induced in vivo by Shiga toxin-2 contributes to the pathogenicity of haemolytic uraemic syndrome. Clin Exp Immunol. 2013;173(3):463–472. | ||
Grisaru S. Management of hemolytic-uremic syndrome in children. Int J Nephrol Renovasc Dis. 2014;7:231–239. | ||
Bitzman M. Treatment options for HUS secondary to Escherichia coli O157:H7. Kidney Int Suppl. 2009;75:S62–S66. | ||
Bitzan M, Poole R, Mehran M, et al. Safety and pharmacokinetics of chimeric anti-Shiga toxin 1 and anti-Shiga toxin 2 monoclonal antibodies in healthy volunteers. Antimicrob Agents Chemother. 2009;53(7):3081–3087. | ||
Rhode H, Qin J, Cui Y, et al; E. coli O104:H4 Genome Analysis Crowd-Sourcing Consortium. Open-source genomic analysis of Shiga-toxin–producing E. coli O104:H4. N Engl J Med. 2011;365(8):718–724. | ||
McGannon CM, Fuller CA, Weiss AA. Different classes of antibiotics differentially influence Shiga toxin production. Antimicrob Agents Chemother. 2010;54(9):3790–3798. | ||
Dundas S, Todd WT, Neill MA, Tarr PI. Using antibiotics in suspected haemolytic-uraemic syndrome: antibiotics should not be used in Escherichia coli O157:H7 infection. BMJ. 2005;330:1209. | ||
Los JM, Los M, Wegrzyn A, Wegrzyn G. Altruism of Shiga toxin-producing Escherichia coli: recent hypothesis versus experimental results. Front Cell Infect Microbiol. 2012;2:166. | ||
Kalghatgi S, Spina CS, Costello JC, et al. Bactericidal antibiotics induce mitochondrial dysfunction and oxidative damage in mammalian cells. Sci Transl Med. 2013;5(192):192ra85. | ||
Gomez SA, Abrey-Recalde MJ, Panek CA, et al. The oxidative stress induced in vivo by Shiga toxin-2 contributes to the pathogenicity of haemolytic uraemic syndrome. Clin Exp Immunol. 2013;173(3):463–472. | ||
Perilo CS, Pereira MT, Santoro MM, Nagem RAP. Structural binding evidence of the trypanocidal drugs Berenil® and Pentacarinate® active principles to a serine protease model. Int J Biol Macromol. 2010;46:502–511. | ||
Qi YF, Zhang J, Colllen T, et al. Diminazene aceturate enhances angiotensin-converting enzyme 2 activity and attenuates ischemia-induces cardiac pathophysiology. Hypertension. 2013;62:746–752. | ||
Velkoska E, Patel SK, Griggs K, Pickering RJ, Tikellis C, Burrell LM. Short-term treatment with diminazene aceturate ameliorates the reduction in kidney ACE2 activity in rats with subtotal nephrectomy. PLoS One. 2015;10(3):e0118758. | ||
Malek M, Nematbakhsh M. The preventive effects of diminazene aceturate in renal ischemia/reperfusion injury in male and female rats. Adv Prev Med. 2014;2014:740647. | ||
Zhang Y, Liu J, Luo J, et al. Upregulation of angiotensin (1-7)-mediated signaling preserves endothelial function through reducing oxidative stress in diabetes. Antioxid Redox Signal. 2015;23(11):880–892. | ||
Kuriakose S, Uzonna JE. Diminazene aceturate (Berenil©), a new use for an old compound. Int Immunopharmacol. 2014;21:342–345. | ||
Cappoen D, Vajs J, Uythehtofken C, et al. Anti-mycobacterial activity of 1,3-diaryltriazenes. Eur J Med Chem. 2014;77:193–203. | ||
Bielawski K, Bielawska A, Popławska B, Bołkun-Skórnicka U. Synthesis, DNA-binding affinity and cytotoxicity of the dinuclear platinum(II) complexes with berenil and amines ligands. Acta Pol Pharm. 2008;65(3):363–370. | ||
Portugal J. Berenil acts as a poison of eukaryotic topoisomerase II. FEBS Lett. 1994;344(2–3):136–138. | ||
Meredith AM, Dass CR. Increasing role of the cancer chemotherapeutic doxorubicin. J Pharm Pharmacol. 2016;68:729–741. | ||
Taylor JS, Beeri K, Reynolds JL, et al. Prophage induction is enhanced and required for renal disease and lethality in an EHEC mouse model. PLoS Pathog. 2013;9(3):e10003236. | ||
Waldor MK, Friedman DI. Phage regulatory circuits and virulence gene expression. Curr Opin Microbiol. 2005;8(4):459–465. | ||
Xiong Y, Wang P, Lan R, et al. A novel Escherichia coli O157:H7 clone causing a major hemolytic uremic syndrome outbreak in China. PLoS One. 2012;7(4):e36144. | ||
Kang M, An SSA. Acetaminophen and its regioisomer, 3-acetamidophenol interfered with the growth of Escherichia coli O157:H7. Toxicol Environ Health Sci. 2010;2:278–283. | ||
Dwyer DJ, Belenky PA, Yang JH, et al. Antibiotics induce redox-related physiological alterations as part of their lethality. Proc Natl Acad Sci U S A. 2014;111(20):E2100–E2109. | ||
Ramasamy M, Yi DK, An SSA. Enhanced detection sensitivity of Escherichia coli O157:H7 using surface-modified gold nanorods. Int J Nanomedecine. 2015;10(Spec Iss):179–190. | ||
Corcoran JW, Hahn FE. Mechanism of Action of Antimicrobial and Antitumor Agents. Berlin: Springer Science & Business Media; 2012:36–45. | ||
Horner M, Giglio VF, Santos AJ, et al. Triazenos e atividade antibacteriana [Triazenes and antibacterial activity]. Rev Bras Cienc Farm [online]. 2008;44(3):441–449. | ||
Schroeder CM, Zhao C, DebRoy C, et al. Antimicrobial resistance of Escherichia coli O157 isolated from humans, cattle, swine, and food. Appl Environ Microbiol. 2002;68(2):576–581. | ||
Vogwill T, Kojadinovic M, MacLean RC. Epistasis between antibiotic resistance mutations and genetic background shape the fitness effect of resistance across species of Pseudomonas. Proc Biol Sci. 2016;283(1830):20160151. | ||
Lainhart W, Stolfa G, Koudelka GB. Shiga toxin as bacterial defense against a eukaryotic predator Tetrahymena thermophila. J Bacteriol. 2009;191:5112–5116. | ||
Licznerska K, Nejman-Faleńczyk B, Bloch S, et al. Oxidative stress in Shiga toxin production by enterohemorrhagic Escherichia coli. Oxid Med Cell Longev. 2016;2016:8. Article ID 3578368. | ||
Faleńczyk BN, Golec P, Maciąg M, Wegrzyn A, Węgrzyn G. Inhibition of development of Shiga toxin-converting bacteriophages by either treatment with citrate or amino acid starvation. Foodborne Pathog Dis. 2012;9:13–19. | ||
Martinez-Castillo A, Muniesa M. Implications of free Shiga toxin-converting bacteriophages occurring outside bacteria for the evolution and the detection of Shiga toxin producing Escherichia coli. Front Cell Infect Microbiol. 2014;4:1–7. | ||
Diez-Gonzalez F, Russell JB. Effects of carbonylcyanide-m-chlorophenylhydrazone (CCCP) and acetate on Escherichia coli O157:H7 and K-12: uncoupling versus anion accumulation. FEMS Microbiol Lett. 1997;151(1):71–76. | ||
Tyler JS, Beeri K, Reynolds JL, et al. Prophage induction is enhanced and required for renal disease and lethality in an EHEC mouse model. PLoS Pathog. 2013;9(3):e1003236. [Isberg RR, editor]. |
Supplementary materials
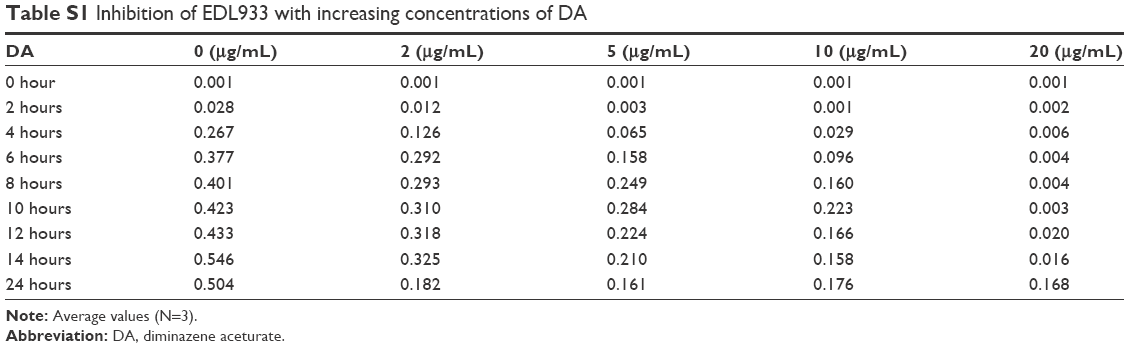 | Table S1 Inhibition of EDL933 with increasing concentrations of DA |
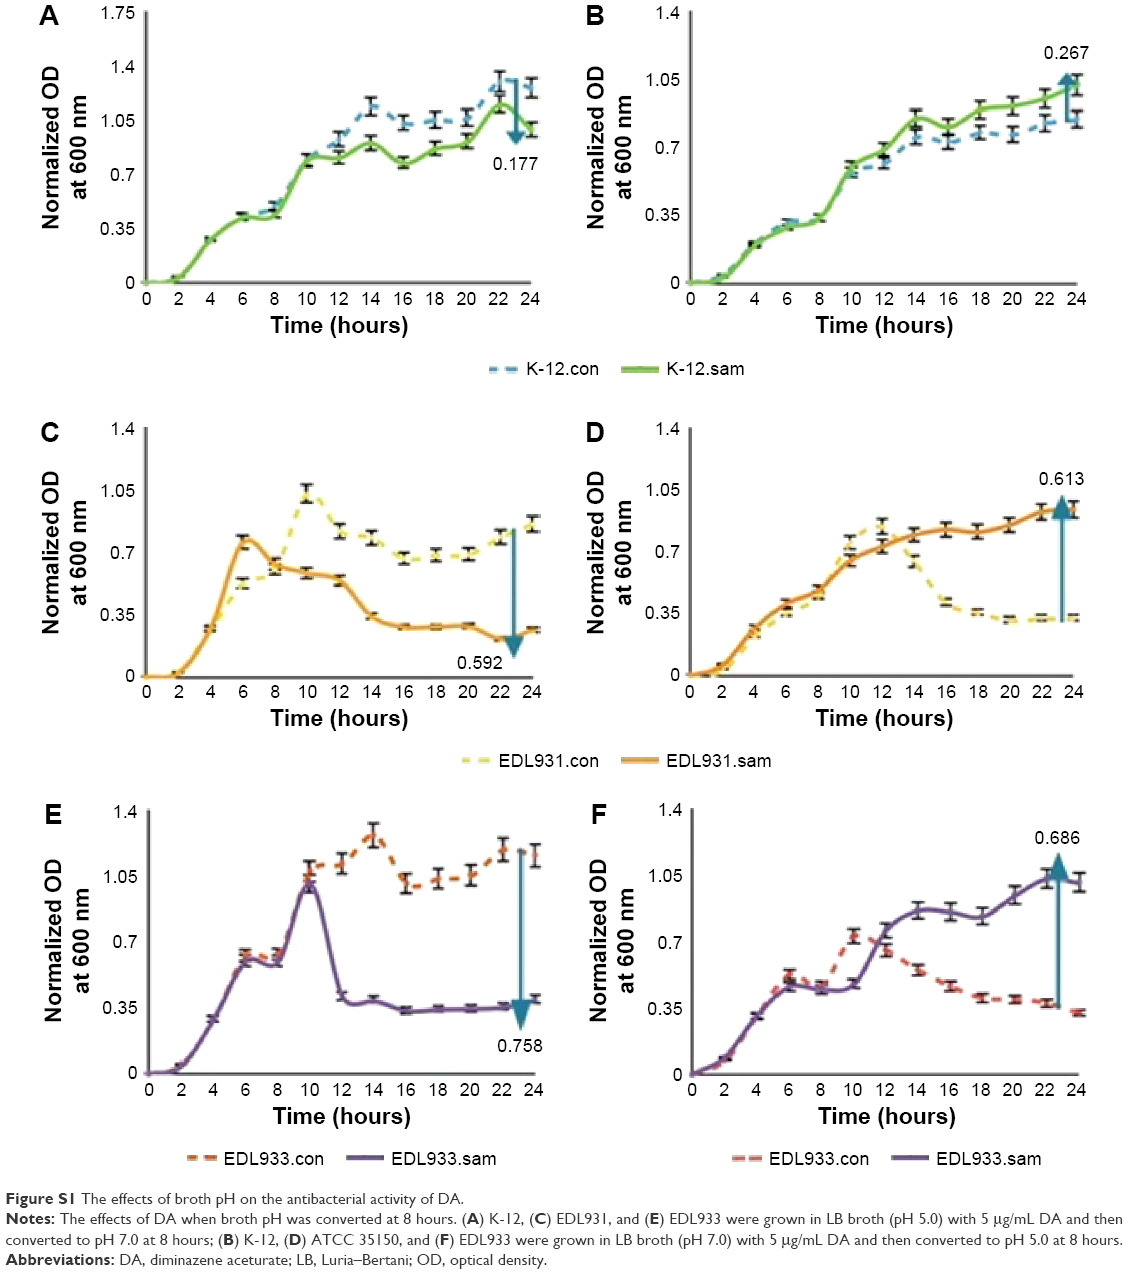 | Figure S1 The effects of broth pH on the antibacterial activity of DA. |
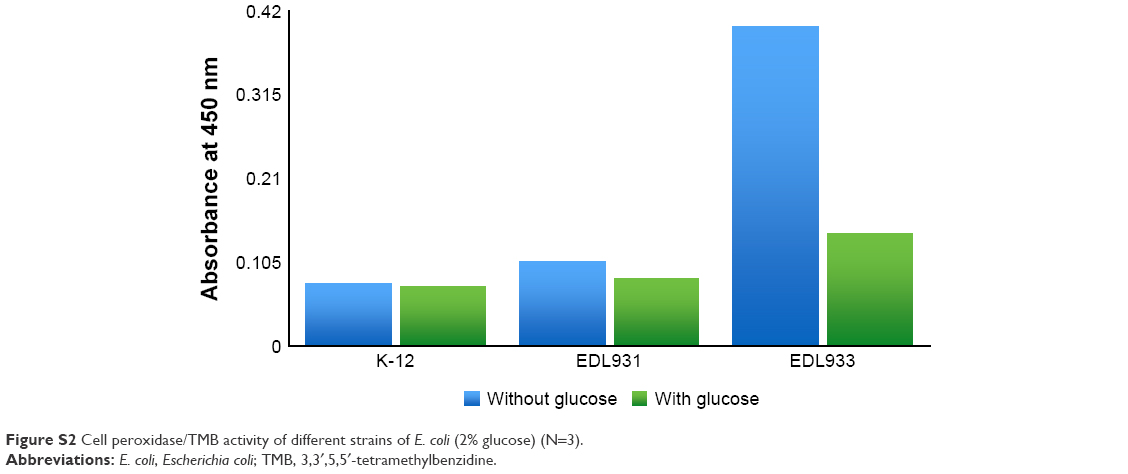 | Figure S2 Cell peroxidase/TMB activity of different strains of E. coli (2% glucose) (N=3). |
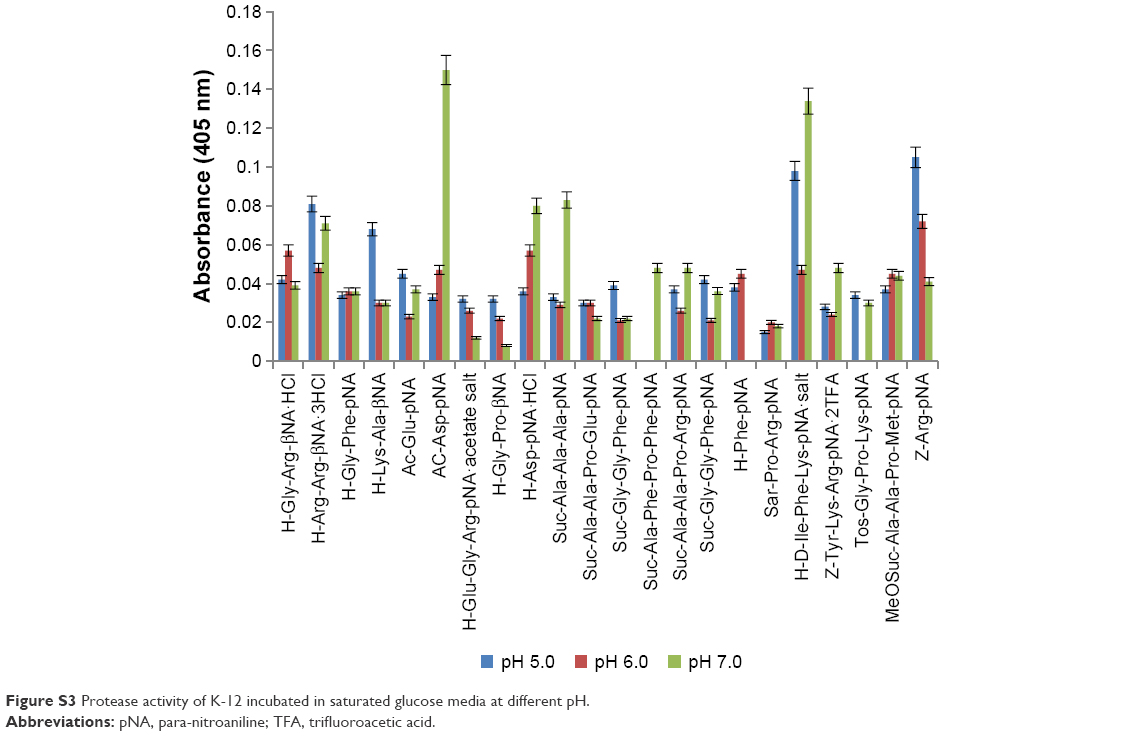 | Figure S3 Protease activity of K-12 incubated in saturated glucose media at different pH. |
 © 2016 The Author(s). This work is published and licensed by Dove Medical Press Limited. The full terms of this license are available at https://www.dovepress.com/terms.php and incorporate the Creative Commons Attribution - Non Commercial (unported, v3.0) License.
By accessing the work you hereby accept the Terms. Non-commercial uses of the work are permitted without any further permission from Dove Medical Press Limited, provided the work is properly attributed. For permission for commercial use of this work, please see paragraphs 4.2 and 5 of our Terms.
© 2016 The Author(s). This work is published and licensed by Dove Medical Press Limited. The full terms of this license are available at https://www.dovepress.com/terms.php and incorporate the Creative Commons Attribution - Non Commercial (unported, v3.0) License.
By accessing the work you hereby accept the Terms. Non-commercial uses of the work are permitted without any further permission from Dove Medical Press Limited, provided the work is properly attributed. For permission for commercial use of this work, please see paragraphs 4.2 and 5 of our Terms.