")
Back to Journals » International Journal of Nanomedicine » Volume 14
Development and screening of brain-targeted lipid-based nanoparticles with enhanced cell penetration and gene delivery properties
Authors dos Santos Rodrigues B, Lakkadwala S, Kanekiyo T, Singh J
Received 16 May 2019
Accepted for publication 18 July 2019
Published 14 August 2019 Volume 2019:14 Pages 6497—6517
DOI https://doi.org/10.2147/IJN.S215941
Checked for plagiarism Yes
Review by Single anonymous peer review
Peer reviewer comments 4
Editor who approved publication: Dr Thomas Webster
Bruna dos Santos Rodrigues,1 Sushant Lakkadwala,1 Takahisa Kanekiyo,2 Jagdish Singh1
1Department of Pharmaceutical Sciences, School of Pharmacy, College of Health Professions, North Dakota State University, Fargo, ND 58105, USA; 2Department of Neuroscience, Mayo Clinic, Jacksonville, FL 32224, USA
Background: The potential of gene therapy for treatment of neurological disorders can be explored using designed lipid-based nanoparticles such as liposomes, which have demonstrated ability to deliver nucleic acid to brain cells. We synthesized liposomes conjugated to cell-penetrating peptides (CPPs) (vascular endothelial-cadherin-derived peptide [pVec], pentapeptide QLPVM and HIV-1 trans-activating protein [TAT]) and transferrin (Tf) ligand, and examined the influence of surface modifications on the liposome delivery capacity and transfection efficiency of encapsulated plasmid DNA. The design of liposomes was based on targeting molecular recognition of transferrin receptor overexpressed on the blood–brain barrier (BBB) with enhanced internalization ability of CPPs.
Methods: CPP-Tf-liposomes were characterized by particle size distribution, zeta potential, protection of encapsulated plasmid DNA, uptake mechanisms and transfection efficiencies. An in vitro triple co-culture BBB model selected the liposomal formulations that were able to cross the in vitro BBB and subsequently, transfect primary neuronal cells. The in vivo biodistribution and biocompatibility of selected formulations were also investigated in mice.
Results: Liposomal formulations were able to protect the encapsulated plasmid DNA against enzymatic degradation and presented low hemolytic potential and low cytotoxicity at 100 nM phospholipid concentration. Cellular internalization of nanoparticles occurred via multiple endocytosis pathways. CPP-Tf-conjugated liposomes mediated robust transfection of brain endothelial (bEnd.3), primary glial and primary neuronal cells. Liposomes modified with Tf and TAT demonstrated superior ability to cross the barrier layer and subsequently, transfect neuronal cells compared to other formulations. Quantification of fluorescently labeled liposomes and in vivo imaging demonstrated that this system could efficiently overcome the BBB and penetrate the brain of mice (7.7% penetration of injected dose).
Conclusion: In vitro screening platforms are important tools to enhance the success of brain-targeted gene delivery systems. The potential of TAT-Tf-liposomes as efficient brain-targeted gene carriers in vitro and in vivo was suggested to be related to the presence of selected moieties on the nanoparticle surface.
Keywords: liposomes, transferrin, pVec, QLPVM, TAT, gene delivery
Introduction
Gene therapy represents a potential transformative therapy to provide long-term effects by ameliorating the symptoms, slowing the progression or even correcting the disease, with potential applications for treatment of central nervous system (CNS) disorders.1–3 The presence of the blood–brain barrier (BBB) and cerebrospinal fluid barrier is the main problem faced during treatment of CNS diseases.4–6 Brain endothelial cells together with perivascular elements create a selective and dynamic cellular barrier, the BBB, which restricts the movement of molecules from the blood into the brain.7 Many delivery strategies have been developed to attempt brain penetration, including neurosurgical, pharmacological and physiological approaches. All three techniques have disadvantages that hamper the success of the treatment. With the advances in gene transfer technologies, an alternative approach to overcome some drawbacks of the existing methods is the use of engineered nanoparticles.8,9 Owing to easy preparation methods, adjustable physicochemical properties and the ability to overcome the BBB, liposomes have become a widely used nanoparticle for gene delivery to the brain.10
Many of the brain-targeted gene delivery platforms base their brain penetration strategies on targeting transferrin receptors (TfRs).11 TfRs are highly expressed on the surface of brain capillary endothelial cells, but also found on immature erythroid cells, placental tissue and rapidly dividing cells, both normal and malignant.12 These receptors are responsible for the transport of iron into cells and maintenance of iron homeostasis and metabolism. Consequently, TfRs play important roles in neural conductivity and proper brain function13 Taking the advantages of the TfR system as a strategy to access the brain, liposomes coupled with transferrin (Tf) ligands have demonstrated enhanced ability to cross the BBB and deliver the therapeutic agents into brain parenchyma.14–17
A relatively new and non-invasive approach for transporting pharmaceutical agents into cells is the use of cell-penetrating peptides (CPPs). CPPs are a family of various peptides of about 5–30 amino acids long, which can pass through tissue and cell membranes via energy-dependent or energy-independent mechanisms with no interactions with specific receptors, and are relatively non-toxic.18–20 Several different criteria are used to classify CPPs. Regarding their physicochemical properties, they are divided into cationic, amphipathic and hydrophobic peptides.21 The first CPP to be characterized was TAT, a cationic peptide derived from the trans-activating protein of HIV-1.22,23 The transduction ability of TAT is facilitated by the interaction of its positive charges with the negatively charged glycosaminoglycans on the cell surface.24,25 The carrier properties of TAT have been extensively studied, including surface modification of liposomal formulations for enhanced BBB permeation.26–28
Amphipathic CPPs such as vascular endothelial-cadherin-derived peptide (pVec) are characterized by hydrophobic and hydrophilic regions in opposite directions. The charged region interacts with the cell membrane, while the hydrophobic region causes membrane perturbation, enabling the translocation.21,29 The CPP pVec is an 18-amino acid peptide derived from vascular endothelial cadherin, which has shown an ability to effectively reach brain parenchyma without significant efflux out of the brain.30 Hydrophobic peptides have a low global net charge, which could be associated with their exhibited low toxicity. The hydrophobic motif is crucial for uptake, assisting the peptide's direct translocation through the cell membrane. This could be advantageous owing to their immediate availability in cytosol eliminating issues regarding endosomal entrapment and degradation.29,31 The hydrophobic pentapeptide QLPVM (QL) is part of the group of pentapeptides derived from the Bax-binding domain of Ku-70 protein, also known as cell-penetrating pentapeptides. This group of pentapeptides has been reported to possess cell permeability and cell death inhibition properties.31–33
In the present study, we compared the targeting efficiency of TfR-targeting liposome-encapsulated cargo (plasmid DNA) conjugated to different classes of CPP (TAT, pVec, QL) via uptake and transfection studies, and the ability of these systems to cross an in vitro BBB model followed by transfection of primary neuronal cells. We quantified the transport of the liposomal formulations across a co-culture BBB model comprised of brain endothelial cells and glial cells, and the ability of these liposomes to transfect primary neuronal cells cultured in the same system. The in vitro BBB model was used as a screening tool to select the liposomal formulations with the best performance and subsequent investigation of their potential to cross the in vivo BBB and reach the brain after intravenous injection into mice (Figure 1). The in vivo tissue distribution and biocompatibility of liposomes were also investigated.
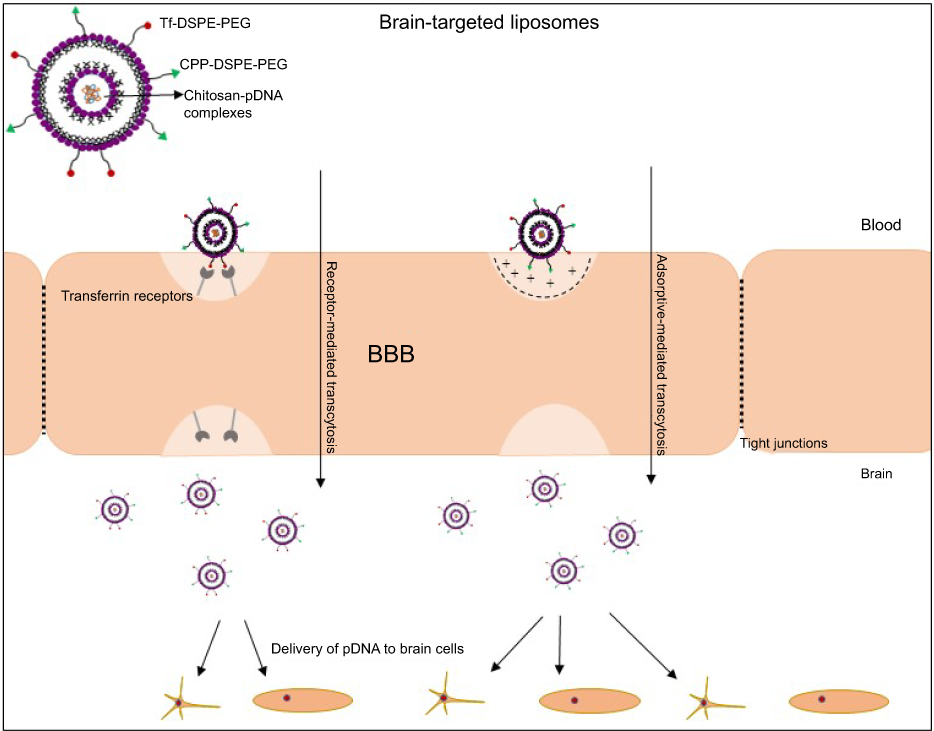 |
Figure 1 Liposome surface modified with Tf and CPP for targeted delivery of plasmid DNA to the brain.Abbreviations: BBB, blood–brain barrier; CPP, cell-penetrating peptide; DSPE-PEG, 1,2-distearoyl-sn-glycero-3-phosphoethanolamine-N-[amino(polyethyleneglycol)]; Tf, transferrin. |
Materials and methods
Synthesis of CPP with DSPE-PEG2000-NHS and Tf with DSPE-PEG2000-NHS
In brief, CPPs (pVec [LLIILRRRIRKQAHAHSK], QL and TAT (YGRKKRRQRRR); Ontores Biotechnologies Inc, Hangzhou, Zejiang, China) were reacted with 1,2-distearoyl-sn-glycero-3-phosphoethanolamine-N-[amino(polyethylene glycol)-2000]-N-hydrixysuccinimide (DSPE-PEG2000-NHS) (Biochempeg Scientific, Watertown, MA, USA) at 1:5 molar ratio in anhydrous dimethylformamide (DMF), adjusted pH to 8.0–9.0 with triethylamine.34 The reaction was carried out at room temperature for about 120 hours with moderate stirring. The final product was dialyzed in deionized water for 48 hours using a dialysis membrane with molecular weight cut-off of 3,500 Da to remove uncoupled CPPs. Following dialysis, the product was lyophilized and stored at −20°C until use.
Holo-Tf (Sigma, St Louis, MO, USA) was conjugated to DSPE-PEG2000-NHS (125 µg Tf/µM phospholipid) in anhydrous DMF, and adjusted to pH to 8.0–9.0 with triethylamine under gentle stirring for 24 hours at room temperature.35 Unbound Tf was removed by passing through a Sephadex G-100 column. Coupling efficiencies of CPP and Tf conjugated to DSPE-PEG2000-NHS were determined using a bicinchoninic acid (BCA) protein assay (Thermo Scientific, Waltham, MA, USA). Synthesis schemes of CPP-DSPE-PEG2000 and Tf-DSPE-PEG2000 are represented in Figure 2.
 |
Figure 2 Synthesis scheme of (A) CPP-DSPE2000-PEG and (B) Tf-DSPE-PEG2000.Abbreviations: CPP, cell-penetrating peptide; DSPE-PEG2000, 1,2-distearoyl-sn-glycero-3-phosphoethanolamine-N-[amino(polyethylene glycol)-2000]; NHS, N-hydroxysuccinimide; Tf, transferrin. |
Preparation of liposomal formulations
For liposome preparation, 1,2-dioleoyl-sn-glycero-3-phosphoethanolamine (DOPE)/2,3-dioleoyl oxy-propyl-trimethylammonium chloride (DOTAP)/cholesterol/CPP-PEG-lipid (Avanti Polar Lipids, Alabaster, AL, USA) were mixed in chloroform:methanol (2:1, v/v) at a molar ratio of 45:45:2:4 mol%, respectively.36–38 The solvents were evaporated, and the thin lipid film was hydrated with HEPES buffer (pH 7.4) yielding CPP-liposomes. Labeled liposomes were prepared by adding DiI or Lisamine rhodamine B (0.5 molar ratio) to the phospholipid mixture. CPP-liposomes were stirred overnight with Tf-micelles (4 mol%) to form CPP-Tf-liposomes. A Sephadex G-100 column was used to remove the free Tf-micelles from the liposomal formulations. Chitosan–plasmid DNA complexes (N/P of 5) were added to the hydration buffer for incorporation into liposomes (1 μg pDNA complexed with chitosan/100 nM liposomes).
Characterization of liposomes
The hydrodynamic size, polydispersity index (PDI) and zeta potential of the liposomal formulations were determined using a Zetasizer Nano ZS 90 (Malvern Instruments, Malvern, UK) at 25°C.36–38 Morphological examination of liposomes was performed via transmission electron microscopy (TEM) (JEM-2100; JEOL, Peabody, MA, USA). Encapsulation efficiencies of chitosan–pDNA complexes into liposomal formulations were determined using Hoechst 33342 (0.15 µg/mL). Fluorescence intensity was measured using a SpectraMax M5 spectrophotometer (Molecular Devices, San Jose, CA, USA) at λex 354 nm and λem 458 nm. Percent encapsulation was calculated following the equation: Encapsulation efficiency (EE) = (FTotal – FNE)/FToatl ×100%, where FTotal is the fluorescence intensity of total amount of plasmid (addition of Hoechst 33342 followed by addition of Triton X-100) and FNE is the fluorescence intensity of non-encapsulated plasmid into liposomes (addition of Hoechst 33342).36–38 To investigate the stability of liposomes, TAT-Tf-liposomes were added to 1 mL culture medium containing 10% FBS. Variations in particle size of liposomes were analyzed after 1 hour, 24 hours and 7 days of incubation at 37°C.39 Release of pDNA from liposomal formulation was determined by incubating the liposomal formulation containing 50 µg of pDNA in 30 mL of PBS (pH 7.4) with 10% FBS at 37°C under constant shaking at 50 rpm. At predetermined time intervals, 300 µL of suspension was withdrawn and centrifuged at 30,000 g at 4°C for 30 minutes. After staining with Hoechst 33342 (0.15 µg/mL), the content of pDNA was determined using a fluorescence spectrophotometer. The cumulative amount of pDNA released from the liposomes was calculated.38,39
Protective properties of liposomal formulations against nucleic acid digestion by DNases
Protection of pDNA by liposomal formulations against enzymatic degradation was evaluated by a DNase I protection assay.37,38 Liposomal formulations containing 1 µg pDNA were incubated for 60 minutes at 37°C with 1 unit DNase I. Naked pDNA with DNase I was used as a positive control. Addition of 5 µL of EDTA (100 mM) stopped the reaction. Complexes were dissociated with 20 µL of heparin (5 mg/mL) incubated for 2 hours at room temperature. The released pDNA samples were subjected to agarose gel electrophoresis 0.8% (w/v) stained with EtBr (0.5 µg/mL) and electrophoresed at 80 V in 0.5× Tris–acetate–EDTA (TAE) (Bio-Rad, Hercules, CA, USA) buffer for 80 minutes.
Cell culture and animals
Different cell lines were cultured for in vitro studies: mouse brain endothelial cells (bEnd.3 cells), primary rat glial and primary rat neuronal cells. The bEnd.3 cells were obtained from ATCC (Manassas, VA, USA) and cultured in DMEM 10% v/v FBS (Omega Scientific, Tarzana, CA, USA) and 1% v/v antibiotics (Corning, Corning, NY, USA). Primary cultures of glial and neuronal cells were obtained from dissected brain of 1-day-old Sprague–Dawley rats, as follows.40 In brief, the blood vessels and meninges were removed from dissected brains, which were chopped into small pieces. The brain areas were suspended in DMEM containing 0.25% trypsin and DNase I (8 µg/mL) and placed in a shaker bath at 37°C to dissociate the cells. For preparation of primary glial cultures, the dissociated cells were diluted with DMEM 10% v/v FBS and 1% v/v antibiotics and centrifuged at 1,500 rpm for 10 minutes. Then, cells were cultured in DMEM 10% v/v FBS and 1% v/v antibiotics. The purity of glial cultures was tested by immunostaining for glial fibrillary acidic protein (GFAP) and were considered ideal when they consisted of >80% glial cells. To obtain primary neuronal cells, the dissociated cells were diluted with DMEM 10% v/v plasma-derived horse serum 1% v/v antibiotics and centrifuged at 1,500 rpm for 10 minutes. Cells were incubated in DMEM 10% v/v 1% antibiotics for 3 days. On day 3, cells were treated with 10 µM cytosine arabinoside to provide cultures enriched in neuronal cells. After 2 days, the medium was replaced, and the cells were allowed to grow for a further 10 days before being used in experiments. The purity of the culture was tested by immunostaining for anti-MAP2 antibody. Cells were incubated in an atmosphere of 5% CO2 at 37ºC.
All animal experiments with rats or mice were conducted in accordance with the protocol approved by the Institutional Animal Care and Use Committee (IACUC) at North Dakota State University (Protocol A17078). Male/female Sprague–Dawley rats (Charles River Laboratories, Wilmington, MA, USA) and C57BL/6 mice (Jackson Laboratory, Bar Harbor, ME, USA) were maintained under standard housing conditions, and controlled temperature and light conditions (12-hour dark/light cycle) with free access to food and water.
Cell viability assay
The cell lines, bEnd.3, primary glial and primary neuronal cells (1×10⁴ cells/well) were plated on 96-well plates and cultured for 24 hours.38,41 The cells were treated for 4 hours with liposomal formulations at different phospholipid concentration (100, 200, 400 and 600 nM). After 48 hours, MTT (Sigma, St Louis, MO, USA) method was used to determine cell viability. Untreated cells were used as a control and the viability was expressed as the percentage of the absorbance of control.
Cellular uptake and internalization mechanisms
Cellular uptake study
Cellular internalization was measured by labeling the liposomes with DiI. bEnd.3, glial and primary neuronal cells (1×10⁵ cells/well) were seeded on to 24-well plates 24 hours before the uptake analysis.37,38 Media were replaced for liposomal formulations (100 nM) and incubated at different time intervals. Following liposomal uptake, cells were washed three times with PBS (pH 7.4) to remove unbound liposomes. Cell membranes were lysed with Triton X-100 1% v/v followed by extraction of fluorescent dye in methanol, and the fluorescence was read by spectrofluorometric methods (λex 553 nm, λem 570 nm).
Uptake mechanism
The aforementioned cells were pretreated for 30 minutes at 37°C with different endocytosis inhibitors: sodium azide (10 mM) to inhibit all energy-dependent endocytosis, chlorpromazine (10 µg/mL) to prevent clathrin-mediated endocytosis, colchicine (100 µg/mL) to inhibit caveolae formation, and amiloride (50 µg/mL) to block micropinocytosis. Thereafter, the cells were treated for 4 hours with DiI-liposomal formulations (100 nM).41 Fluorescence intensity was analyzed using a spectrophotometer (λex 553 nm, λem 570 nm) and a fluorescence microscope (Leica DMi8; Leica Microsystems, Buffalo Grove, IL, USA).
In vitro transfection efficiency
After 24 hours of culturing bEnd.3, primary glial and primary neuronal cells (1×10⁶ cells/well) on six-well plates, the cells were treated for 4 hours with liposomal formulations (100 nM) containing either chitosan–plasmid vector encoding green fluorescent protein (pGFP) (gWiz GFP; Aldevron, Fargo, ND, USA) or plasmid vector encoding β-galactosidase (pβgal) (gWiz βgal; Aldevron) complexes.35,39 Media were replaced and cells were incubated for 48 hours. The percentage of cells expressing green fluorescent protein (GFP) was analyzed using a flow cytometer (BD Accuri C6; BS Biosciences, San Jose, CA, USA) with λex 488 nm and λem 533/30 nm (optical filter FL1). GFP expression in cells was also observed using a fluorescence microscope. The induction of β-galactosidase enzyme activity was quantified using a β-galactosidase reagent assay (Promega Corporation, Madison, WI, USA). In brief, cells were lysed using βgal assay buffer and incubated with substrate for 60 minutes at 37°C. After the addition of stop solution, the absorbance was measured at 420 nm. Total cellular protein levels were determined by the BCA protein assay.
In vitro transport across co-culture BBB model
For the in vitro BBB model,42,43 glial cells (1.5×10⁴ cells/cm2) were seeded on the bottom side of polycarbonate transwell inserts (0.4 µm pore size and 0.33 cm2 culture area) and bEnd.3 cells (1.5×10⁴ cells/cm2) were seeded on the upper side of culture inserts. Formation of tight junctions was assessed by measuring transendothelial electrical resistance (TEER) values using the EVOM2 (World Precision Instruments, Sarasota, FL, USA). Inserts containing only bEnd.3 cells on the upper side and inserts with only glial cells on the underside were also constructed and maintained similarly.
Lissamine rhodamine labeled-liposomes (100 nM) and sodium fluorescein (Na-F, 100 µg/mL, molecular weight 376 kDa) were added into the inserts containing the in vitro BBB model.37 The flux of liposomal formulation and Na-F was evaluated in sterile PBS (pH 7.4) containing 10% FBS. The inserts were transferred at 0.25, 0.5, 1, 2, 4 and 8 hours to new wells with serum–PBS. Fluorescence intensity in the upper and the lower compartments was determined by a spectrophotometer (λex 560 nm, λem 580 nm) and the percentage transport was calculated over a period of 8 hours. The permeability of the endothelial barrier was calculated using the following equation: 1/Pe=1/Pt – 1/Pf (cm/s), where Pt is the permeability coefficient of the total system (in vitro model) and Pf is the permeability coefficient across cell-free inserts. The permeability coefficient for each liposomal formulation is calculated by dividing the amount of liposomes transported per minute (µg/min) through the total system (Pt) or cell-free insert (Pf) by the surface area of the transwell membrane (cm2), by the initial concentration of liposomes (µg/mL) and by 60 (conversion factor from minutes to seconds). Na-F (molecular weight 376.275 g/mol) (100 µg/mL) was used as a barrier integrity marker for the study of permeability. The integrity of the barrier layer after the study was evaluated by comparing TEER before and after (8 hours) liposome transport across the in vitro BBB using the EVOM22
Liposome transfection efficiency in the triple cell culture model
Primary neuronal cells were seeded in 24-well plates, and culture inserts seeded with bEnd.3 cells and glial cells were placed in the same wells containing primary neuronal cells.44 Liposomal suspensions (100 nM) encapsulating pGFP (1 µg) were added to the upper compartment of the inserts and incubated for 8 hours. Then, the inserts were removed, and the media were replaced with fresh media. After 48 hours, the percentage of cells expressing GFP was analyzed using a flow cytometer and fluorescence microscope.
Blood compatibility study
Freshly harvested blood from Sprague–Dawley rats was centrifuged (1,500 rpm, 10 minutes) and washed three times with PBS 10 mM CaCl2. After blank (PBS), positive control (Triton X-100 1%) and liposome dilutions (31.25–1,000 µM) were prepared, erythrocyte solution containing 1.5×10⁷ cells was added and incubated for 1 hour at 37ºC, 5% CO2. Then, the cell suspension was centrifuged at 1,500 rpm for 10 minutes. The supernatant was removed and the absorbance (540 nm) of released hemoglobin was measured and transformed into the hemolysis percentage, considering the absorbance in the presence of Triton X-100 as 100%.35,36 All experiments were performed in triplicate and repeated four times.
In vivo biodistribution and biocompatibility
Biodistribution studies were performed using six animals per group (three male and three female), which were intravenously injected through the tail vein with either PBS or fluorescently labeled liposomes (TAT-lip and TAT-Tf-lip) at a dose of approximately 15.2 µmoles phospholipid/kg body weight.35,37 After 24 hours of administration, fluorescently labeled liposomes were quantified in brain, liver, lungs, kidneys, heart, spleen and blood. The tissues were weighed, homogenized with PBS and fluorescent dye extracted in chloroform:methanol (2:1, v/v). The fluorescence intensity was measured by a spectrophotometer at λex 560 nm and λem 580 nm. Data were normalized with the control group, ie, PBS administration. For biocompatibility studies, tissue sections (30 µm) were stained with H&E and signs of inflammation, necrosis, morphological alterations and cellular damage were evaluated.
Statistical analysis
Data were expressed as mean ± SD and were evaluated using one-way ANOVA followed by Tukey's multiple comparison post-hoc test (GraphPad Prism version 5.0; GraphPad Software, La Jolla, CA, USA). Statistical significance was considered at p<0.05. Six mice per in vivo experimental condition were used to provide statistically valid data.
Results
Preparation and characterization of liposomal formulations
The peptides (pVec, QL and TAT) and Tf protein were successfully conjugated to DSPE-PEG2000-NHS, obtaining coupling efficiencies of 76.7±1.0%, 84.2±0.1%, 77.5±0.2% and 75.1±1.0% for pVec, QL, TAT and Tf, respectively. Unbound Tf was removed from liposomal formulations to eliminate the impact of free Tf. Preparation of CPP-liposomes involved the thin lipid film rehydration method, while Tf-CPP-liposomes followed the subsequent post-insertion method. Liposomal formulations had an average size of approximately 155 nm and a positive zeta potential. Liposome surface modifications had no negative effect on encapsulation efficiencies of pDNA, which were above 80% for all liposomal formulations. A detailed description of the particle size, PDI, zeta potential and encapsulation efficiencies of chitosan–pDNA complexes into liposomes can be observed in Table 1. The TEM images revealed that TAT-liposomes (Figure 3A) and TAT-Tf-liposomes (Figure 3B) encapsulating chitosan–pDNA complexes had spherical morphology. The stability of liposomal formulations was investigated in the presence of FBS. We observed that the presence of FBS during 1 hour, 24 hours and 7 days of incubation did not cause significant changes in the particle size of liposomes (Table S1). In addition, the release of pDNA from the liposomes (Figure 3C) showed that liposomes could release pDNA in a sustained manner.
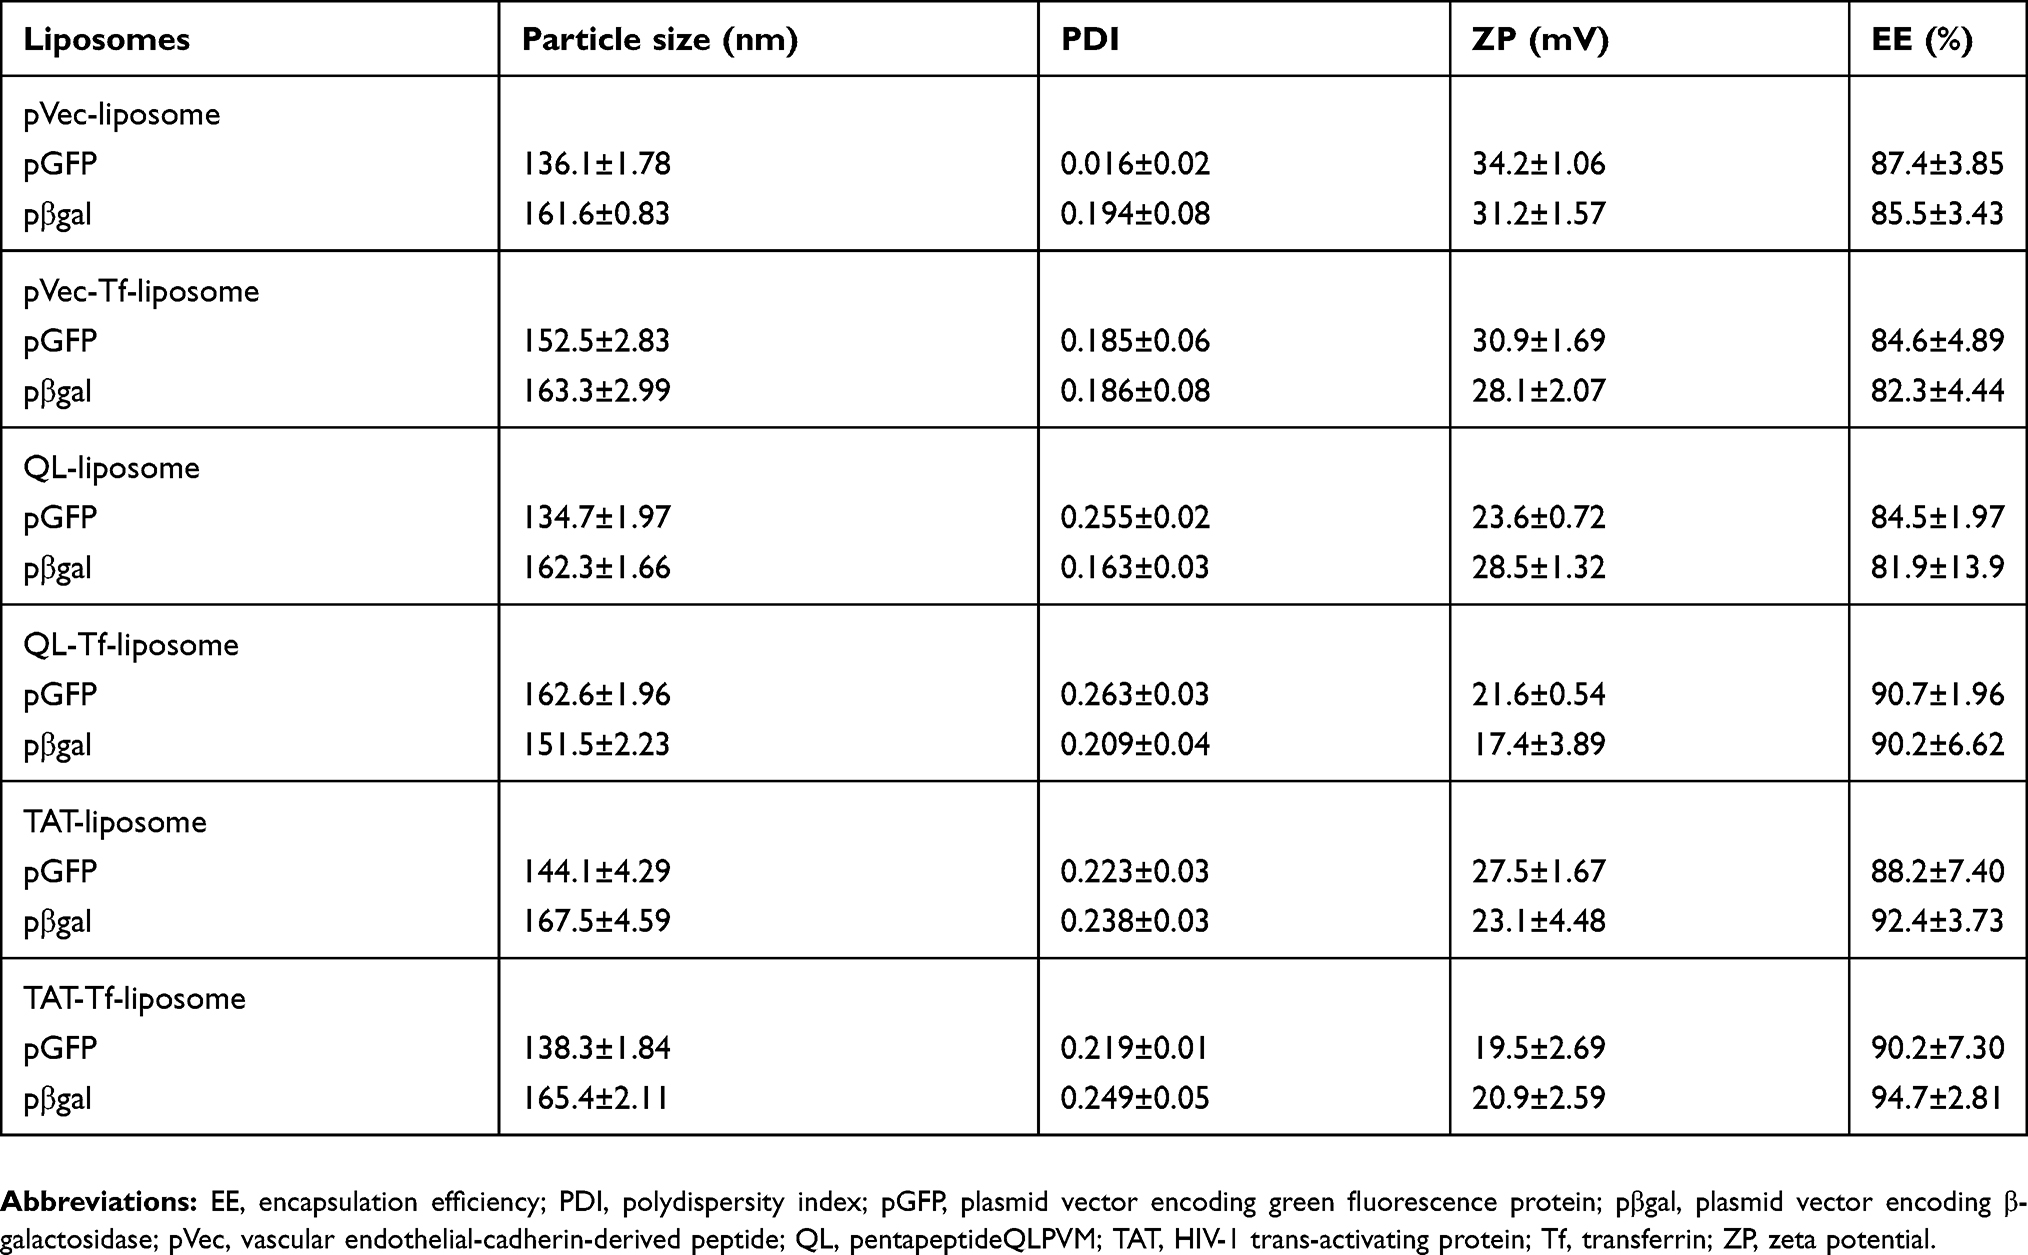 |
Table 1 Characterization of liposomal formulations |
Liposomes' effective protection of encapsulated pDNA against DNases
The protective effect of liposomal formulations containing chitosan–pDNA complexes against enzymatic degradation was evaluated in the presence of DNase I (Figure 3D). Free pGFP was used as a positive control and pGFP + DNase I as a negative control. Each liposomal formulation (pVec-lip, pVec-Tf-lip, QL-lip, QL-Tf-lip, TAT-lip and TAT-Tf-lip) containing chitosan–pGFP complexes was exposed to DNase I. Analysis of the samples was performed through gel agarose electrophoresis. In Figure 2D, lane a corresponds to free pGFP and the integrity of pDNA sample was demonstrated by the presence of a bright DNA band. The presence of DNase I in the pGFP sample degraded completely the pDNA, as observed by the absence of the pDNA band in Figure 2D lane b. The bright bands in lanes c–h demonstrate the protective effect of liposomal formulations containing chitosan–pGFP complexes against DNase I degradation, which suggests that the pDNA was sufficiently protected from DNase degradation.
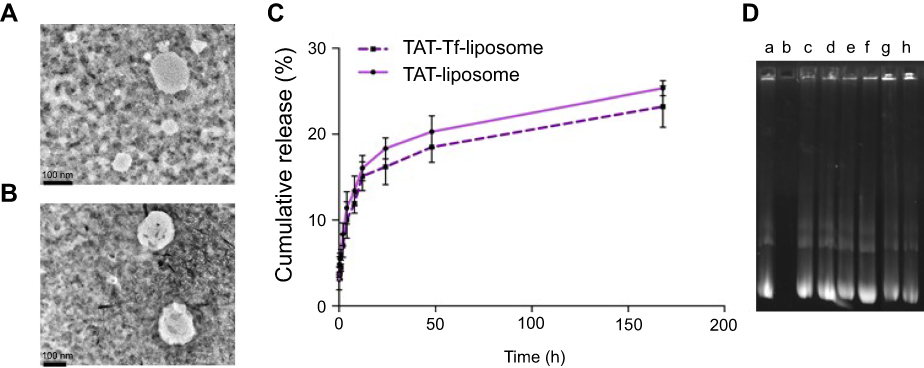 |
Figure 3 Transmission electron microscope images of (A) TAT-liposomes and (B) TAT-Tf-liposomes (scale bars: 100 nm). (C) In vitro cumulative release of TAT-liposomes and TAT-Tf-liposomes in the presence of 10% FBS. (D) Protection of chitosan–pDNA complexes by liposomal formulations against nuclease degradation. Lane a, naked pGFP; lane b, naked pGFP+DNase I; lanes c–h, pVec-lip, pVec-Tf-lip, QL-lip, QL-Tf-lip, TAT-lip and TAT-Tf-lip containing chitosan–GFP complexes (N/P 5), respectively, plus DNase I.Abbreviations: GFP, green fluorescent protein; lip, liposome; pGFP, plasmid vector encoding green fluorescence protein; pVec, vascular endothelial-cadherin-derived peptide; QL, pentapeptide QLPVM; TAT, HIV-1 trans-activating protein; Tf, transferrin. |
In vitro cell viability assay
The cytotoxicity potential of liposomal formulations was assessed in bEnd.3 (Figure 4A), glial (Figure 4B) and primary neuronal cells (Figure 4C) by quantifying cell viability after 4 hours of treatment with different liposomal concentrations (100, 200, 400 and 600 nM) using the MTT assay. The wells containing only cells and medium were considered as having cell viability of 100%. Liposomal formulations presented a concentration-dependent cytotoxic effect in bEnd.3, glial and primary neuronal cells. The cell viability of the aforementioned cells exposed to 100 nM liposomes was on average 90%, and was significantly reduced to 65% at 600 nM phospholipid concentration. Owing to the low cytotoxicity of liposomal formulations at 100 nM phospholipid concentration in the tested cells, this concentration was chosen for the following experiments.
 |
Figure 4 Cell viability of (A) bEnd.3 cells, (B) glial cells, and (C) primary neuronal cells after 4 hours of treatment with pVec-lip, pVec-Tf-lip, QL-lip, QL-Tf-lip, TAT-lip and TAT-Tf-liposomes at different phospholipid concentrations (100, 200, 400 and 600 nM). Cell viability was measured by MTT assay and expressed as percentage of control (untreated cells). Data are expressed as mean ± SD (n=4). Statistically significant (p<0.05) differences are shown as (*).Abbreviations: bEnd.3, brain endothelial cells; lip, liposome; pVec, vascular endothelial-cadherin-derived peptide; QL, pentapeptide QLPVM; TAT, HIV-1 trans-activating protein; Tf, transferrin. |
Cellular uptake
The quantification of pVec-lip, pVec-Tf-lip, QL-lip, QL-Tf-lip, TAT-lip and TAT-Tf-lip penetration in bEnd.3, glial and primary neuronal cells (Figure 5) depicted a time-dependent uptake. A significant increase (p<0.05) in liposomal uptake was observed from 0.1 to 4 hours of incubation in the aforementioned cells. The uptake of all liposomal formulations increased on average from 33% to 71% in bEnd.3 cells (Figure 5A) after 1 hour and 4 hours of incubation, respectively. The percentage uptake quantified in glial cells (Figure 5C) increased from 35% to 66%, on average, after the same time interval. In primary neuronal cells (Figure 5E), an increase in liposome uptake from 33% to 65%, on average, was observed after 1 hour and 4 hours of incubation, respectively. The contribution of endocytosis to liposomal internalization was investigated by pretreating the cells with known endocytosis inhibitors for clathrin-mediated endocytosis (chlorpromazine), caveolae-mediated endocytosis (colchicine), macropinocytosis (amiloride) and energy-dependent endocytosis (sodium azide), and the percentage of liposomal uptake was quantified after 4 hours of incubation. We noted the influence of liposome surface modifications as well as the cell type on the extent of uptake (Figures 5B and S1A, bEnd.3 cells; Figures 5D and S1B, glial cells; and Figures 5F and S1C, primary neuronal cells). The ATP depletion caused by sodium azide resulted in significant (p<0.05) inhibition of uptake of all liposomal formulations, but higher inhibition was observed in dual-modified liposomes compared to single-modified liposomes. In general, the results highlighted energy-dependent endocytosis as the main mechanism for liposome internalization into cells. The uptake after sodium azide pretreatment in bEnd.3 cells (Figure 5B) for pVec-lip, QL-lip and TAT-lip was 23.4%, 40.8% and 49.9%, respectively, versus 13.2%, 17.9% and 19.9% for PF-Tf-lip, QL-Tf-lip and TAT-Tf-liposomes, respectively. In glial cells (Figure 5D), the uptake after sodium azide pretreatment was 17.3%, 27.6% and 44.3% for pVec-lip, QL-lip and TAT-lip, respectively, versus 13.6%, 18.3% and 15.1% for pVec-Tf-lip, QL-Tf-lip and TAT-Tf-liposomes, respectively. The uptake in primary neuronal cells (Figure 5F) in the same conditions was 23.1%, 17.0% and 36.5% for pVec-lip, QL-lip and TAT-lip, respectively, versus 19.1%, 17.5% and 26.7% for pVec-Tf-lip, QL-Tf-lip and TAT-Tf-liposomes, respectively.
The internalization of pVec-liposomes in bEnd.3 cells showed lower dependence of the caveolae-mediated endocytosis pathway, which inhibited the uptake by 28%, but a superior impact of clathrin-mediated endocytosis and macropinocytosis, corresponding to approximately 70% and 60% uptake inhibition, respectively. In glial and primary neuronal cells, a similar contribution of the studied pathways was observed in pVec-liposome uptake. Clathrin- and caveolae-mediated endocytosis was important for pVec-Tf-liposome uptake in bEnd.3 cells, causing 80% uptake inhibition, and macropinocytosis had a lower impact, reducing the uptake by 24%. An equivalent contribution of the investigated endocytosis pathways was observed on the uptake of pVec-Tf-liposomes in glial and primary neuronal cells. In contrast, a low influence of endocytosis pathways was observed on QL-liposome uptake in bEnd.3 (<20% uptake inhibition for all pathways) and glial cells (<25% uptake inhibition for all pathways), suggesting that the transport could occur also through passive transport. Clathrin-mediated endocytosis, caveolae-mediated endocytosis and macropinocytosis participated in the uptake of QL-liposomes with equivalent contribution in primary neuronal cells. Internalization of QL-Tf-liposomes into the cells showed the participation of all three investigated endocytosis pathways. Penetration of TAT-liposomes into bEnd.3 and primary neuronal cells showed an average of 79% uptake reduction for clathrin-mediated endocytosis, caveolae-mediated endocytosis and macropinocytosis. On glial cells, macropinocytosis was significantly inhibited (68%). All studied pathways were involved in TAT-Tf-liposome internalization into the bEnd.3, glial and primary neuronal cells.
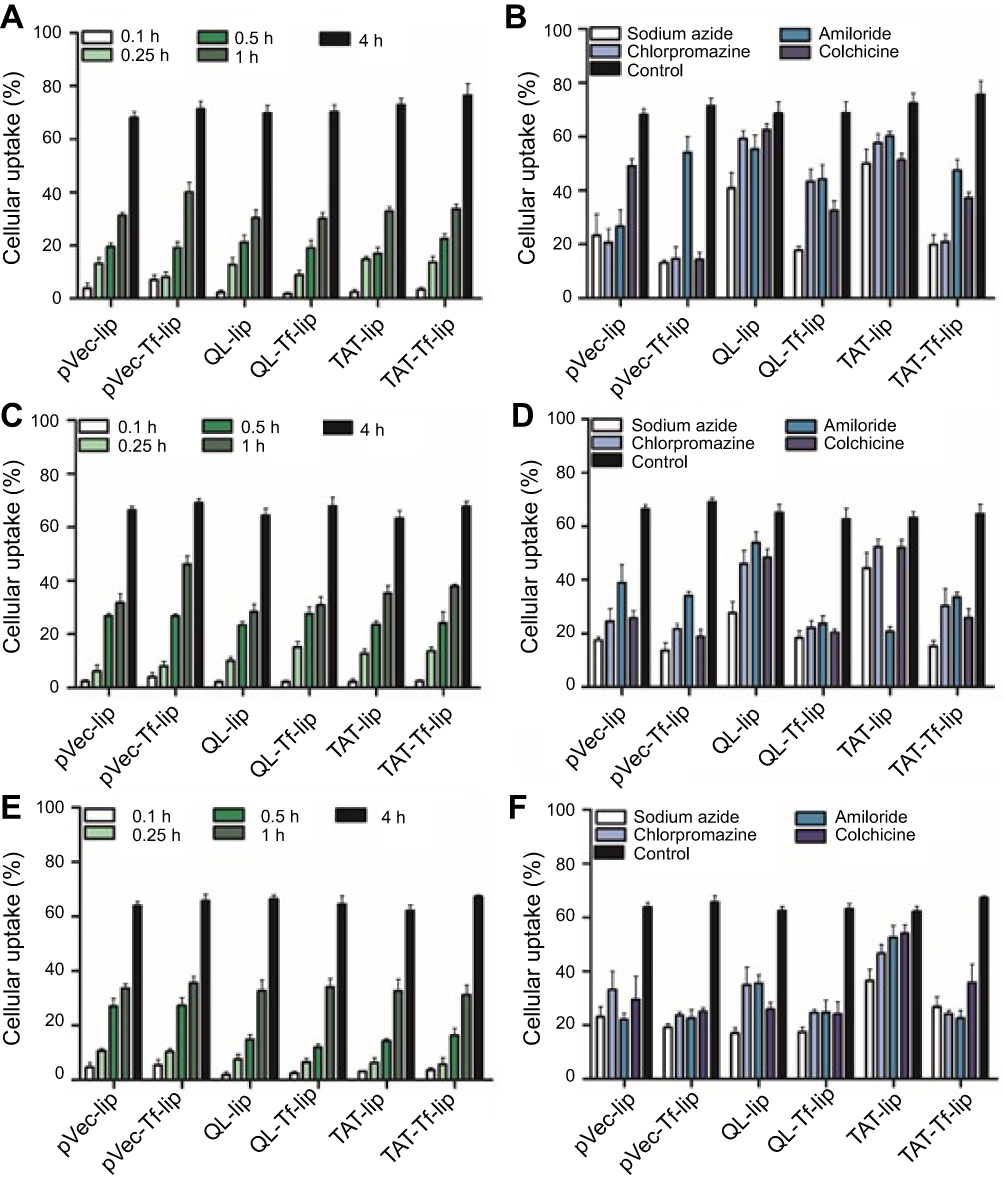 |
Figure 5 Quantitative analysis of penetration of liposomal formulations pVec-lip, pVec-Tf-lip, QL-lip, QL-Tf-lip, TAT-lip and TAT-Tf-lip in (A) bEnd.3, (C) glial, and (E) primary neuronal cells after 0.1, 0.25, 0.5, 1 and 4 hours of incubation. Quantitative analysis of penetration of pVec-lip, pVec-Tf-lip, QL-lip, QL-Tf-lip, TAT-lip and TAT-Tf-liposomes after 4 hours of incubation in (B) bEnd.3, (D) glial, and (F) primary neuronal cells pretreated with endocytosis inhibitors (sodium azide, chlorpromazine, amiloride and colchicine). Data are expressed as mean ± SD (n=5).Abbreviations: bEnd.3, brain endothelial cells; lip, liposome; pVec, vascular endothelial-cadherin-derived peptide; QL, pentapeptide QLPVM; TAT, HIV-1 trans-activating protein; Tf, transferrin. |
Transfection efficiency
The GFP levels in bEnd.3 (Figure 6A), primary glial (Figure 6B) and primary neuronal cells (Figure 6C) treated with liposomal formulations containing chitosan–pGPF complexes and Lipofectamine 3000/pGFP were quantified by flow cytometry. The liposomal formulations conjugated with both CPP and Tf could induce higher GFP gene expression in the aforementioned cells compared to liposomes conjugated only with CPP. Furthermore, TAT-Tf-liposomes could significantly (p<0.05) enhance the number of bEnd.3 (62.3%) and primary glial cells (41.3%) expressing GFP compared to the other formulations. TAT-Tf-liposome treatment resulted in 12.8% of primary neuronal cells expressing GFP, which was significantly (p<0.05) higher compared to the GFP levels induced by Lipofectamine 3000 (6.7%), Lip (3.8%), pVec-lip (6.3%) and QL-liposomes (5.6%). The expression of GFP in bEnd.3, primary glial and primary neuronal cells was also observed using a fluorescence microscope (Figure 6D). A differential extent of GFP expression was observed in each cell line, with bEnd.3 cells expressing the highest levels, followed by primary glial and then primary neuronal cells.
Following the same trend observed in transfection studies with liposomes containing chitosan–pGFP complexes, TAT-Tf-liposomes containing chitosan–pβgal complexes (Figure S2) showed significantly (p<0.05) higher ability to induce protein expression in bEnd.3 (12.6 mU of β-galactosidase/mg of total protein), primary glial (3.8 mU of β-galactosidase/mg of total protein) and primary neuronal cells (1.4 mU of β-galactosidase/mg of total protein) compared to the other liposomal formulations. Again, the protein expression was induced to a differential extent in the tested cells. The highest levels of proteins were quantified in bEnd.3 cells, followed by primary glial cells and primary neuronal cells.
 |
Figure 6 Percentage levels of GFP in bEnd.3 (A), glial (B), and primary neuronal cells (C) after 48 hours of treatment with Lipofectamine 3000, Lip, pVec-lip, pVec-Tf-lip, QL-lip, QL-Tf-lip, TAT-lip and TAT-Tf-lip containing chitosan–pGFP complexes as determined by flow cytometry. Data are expressed as mean ± SD (n=4). Statistically significant (p<0.05) differences are shown as (*) with Lipofectamine and (†) with TAT-liposomes. (D) Fluorescence microscopy images of GFP expression in bEnd.3, glial and primary neuronal cells transfected with Lipofectamine 3000, pVec-lip, pVec-Tf-lip, QL-lip, QL-Tf-lip, TAT-lip and TAT-Tf-lip containing chitosan–pGFP complexes after 48 hours. (Scale bars: 100 µm).Abbreviations: bEnd.3, brain endothelial cells; GFP, green fluorescent protein; lip, liposome; pVec, vascular endothelial-cadherin-derived peptide; pGFP, plasmid vector encoding green fluorescence protein; QL, pentapeptide QLPVM; TAT, HIV-1 trans-activating protein; Tf, transferrin. |
Transport of liposomes across the in vitro BBB model and membrane integrity
The quantification of transport of liposomal formulations across the in vitro BBB model detected a significantly (p<0.05) higher amount of TAT-Tf-liposomes in the lower chamber compared to the other liposomal formulations after 2, 4 and 8 hours of incubation (Figure 7A). The permeability coefficient of TAT-Tf-liposomes was 5-fold higher than that of Na-F, a barrier integrity marker (Figure 7B). In addition, the permeability of TAT-Tf-liposomes was 2.2-fold higher than of pVec-lip, 1.7-fold higher than that of Lip, pVec-Tf-lip, QL-lip and TAT-lip, and 1.5-fold higher than that of QL-Tf-lip. The TEER of each insert administered with pVec-lip, pVec-Tf-lip, QL-lip, QL-Tf-lip, TAT-lip and TAT-Tf-lip was monitored to keep them similar to control levels throughout the transport detection (Figure 7C), indicating that liposomes had not disrupted the in vitro barrier layer.
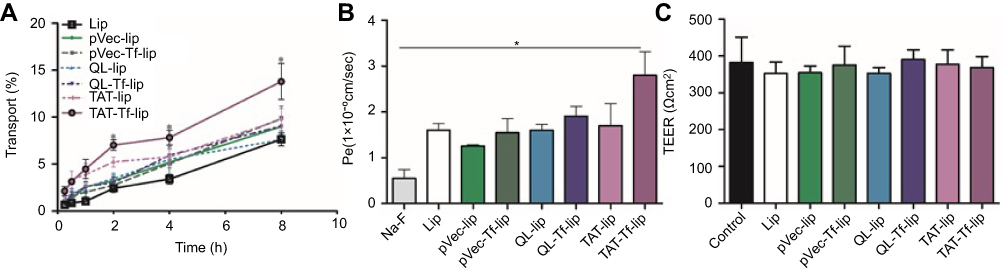 |
Figure 7 (A) Transport percentage of Lip, pVec-lip, pVec-Tf-lip, QL-lip, QL-Tf-lip, TAT-lip and TAT-Tf-lip over a period of 8 hours across the in vitro BBB model. (B) Permeability of Na-F and liposomal formulations (Lip, pVec-lip, pVec-Tf-lip, QL-lip, QL-Tf-lip, TAT-lip and TAT-Tf-lip) across the in vitro BBB model. (C) TEER after 8 hours of transport of liposomal formulations (Lip, pVec-lip, pVec-Tf-lip, QL-lip, QL-Tf-lip, TAT-lip and TAT-Tf-lip) across the in vitro BBB model compared to TEER of control (before liposome incubation). All data are expressed as mean ± SD (n=4). Statistically significant (p<0.05) differences are shown as (*).Abbreviations: BBB, blood–brain barrier; lip, liposomes; Na-F, sodium fluorescein; Pe, permeability; pVec, vascular endothelial-cadherin-derived peptide; QL, pentapeptide QLPVM; TAT, HIV-1 trans-activating protein; TEER, transendothelial electrical resistance; Tf, transferrin. |
Transfection in primary neuronal cells after transport of liposomes across the in vitro BBB model
The ability of liposomal formulations to transfect primary neuronal cells after transport of liposomes across the in vitro BBB model was assessed with liposomes surface-modified with CPP and Tf owing to their enhanced transfection efficiency compared to CPP-liposomes. TAT-Tf-liposomes containing chitosan–pGFP complexes induced significantly (p<0.05) higher GFP levels compared to pVec-Tf-lip and QL-Tf-lip (Figure 8A), which were quantified using flow cytometry (7.2% vs 4.2% and 2.8% GFP-expressing cells, respectively). The expression of GFP induced by these liposomal formulations was confirmed by fluorescence microscopy (Figure 8B).
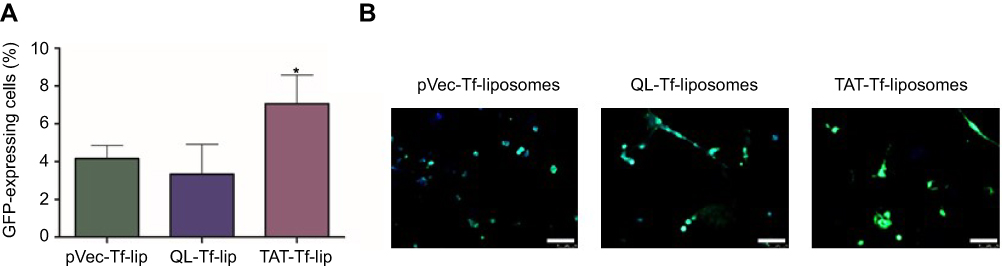 |
Figure 8 (A) Percentage levels of GFP in primary neuronal cells transfected with pVec-Tf-lip, QL-Tf-lip and TAT-Tf-lip containing chitosan–GFP complexes after liposome transport through the in vitro BBB model as determined by flow cytometry. Data are expressed as mean ± SD (n=4). Statistically significant (p<0.05) difference from pVec-Tf-lip and QL-Tf-lip is shown as (*). (B) Fluorescence microscopy images of GFP expression in primary neuronal cells transfected with pVec-Tf-lip, QL-Tf-lip and TAT-Tf-lip containing chitosan–GFP complexes after liposome transport study. (Scale bar: 100 µm.)Abbreviations: BBB, blood–brain barrier; GFP, green fluorescent protein; lip, liposome; pVec, vascular endothelial-cadherin-derived peptide; QL, pentapeptide QLPVM; TAT, HIV-1 trans-activating protein; Tf, transferrin. |
Hemolytic potential
The effect of liposomal formulations at different phospholipid concentrations on rat erythrocytes was evaluated after 1 hour of incubation at 37°C (Figure 9). The hemolytic activity of liposomal formulations showed concentration-dependent hemolysis. The lowest phospholipid concentration (31.25 nM) resulted in an average of 1.4% hemolysis, which gradually increased to 12.2% hemolysis at 1,000 nM phospholipid concentration.
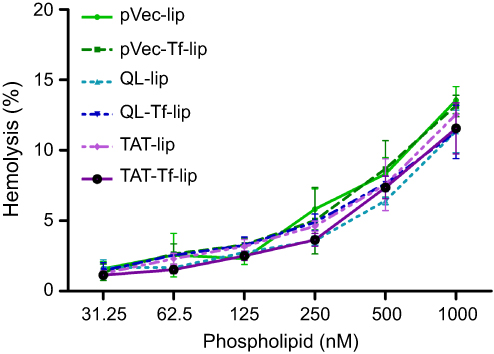 |
Figure 9 Hemolysis percentage after treatment of rat erythrocytes with pVec-lip, pVec-Tf-lip, QL-lip, QL-Tf-lip, TAT-lip and TAT-Tf-lip as a function of phospholipid concentration (31.25–1000 µM) at 37°C. Hemolytic activity of 1% v/v Triton X-100 was considered as 100% hemolysis. Data are expressed as mean ± SD (n=4).Abbreviations: lip, liposome; pVec, vascular endothelial-cadherin-derived peptide; QL, pentapeptide QLPVM; TAT, HIV-1 trans-activating protein; Tf, transferrin. |
In vivo biodistribution and biocompatibility
The ability of lissamine rhodamine-labeled liposomal formulations to cross the BBB was evaluated by quantification of fluorescence intensity of the dye and near-infrared (NIR) imaging. After 24 hours of TAT-lip and TAT-Tf-lip administration via the tail vein, a considerable number of liposomes remained in the liver, kidneys, heart and lungs (Figure 10A). Furthermore, the developed liposomes were also found in the brain, 3.1% of injected dose (ID)/g of tissue for TAT-liposomes and 7.7% ID/g of tissue for TAT-Tf-liposomes. NIR imaging (Figure 10B) confirmed the superior efficiency of TAT-Tf-liposomal nanoparticles to penetrate the brains of mice compared to TAT-liposomal nanoparticles, which indicates that dual-modified liposomes had stronger efficacy in brain targeting.
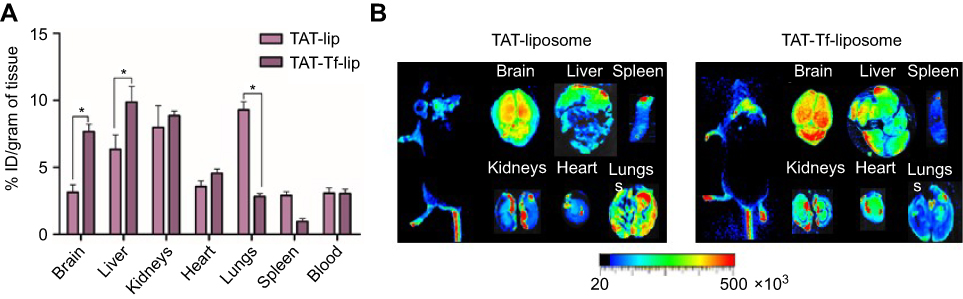 |
Figure 10 (A) In vivo biodistribution of TAT-lip and TAT-Tf-lip in brain, liver, kidneys, heart, lungs, spleen and blood of C57BL/6 mice after 24 hours of liposomal administration. Data are expressed as mean ± SE (n=6). Statistically significant (p<0.05) differences are shown as (*). (B) Near-infrared imaging of relative fluorescence intensity of mice, brain, liver, kidneys, heart, lungs and spleen from C57BL/6 mice 24 hours after administration of TAT-lip and TAT-Tf-lip.Abbreviations: lip, liposome; TAT, HIV-1 trans-activating protein; Tf, transferrin. |
Treatment of mice with liposomal formulations (~15.2 µmoles of phospholipids/kg body weight) did not induce mortality or clinical signs of toxicity (eg, body weight loss, or changes in skin/fur or behavioral patterns). The evaluation of tissue sections stained with H&E did not show changes in tissue morphology or any signs of inflammation or cellular damage, suggesting that there was no toxicity in the animals under the tested conditions (Figure 11).
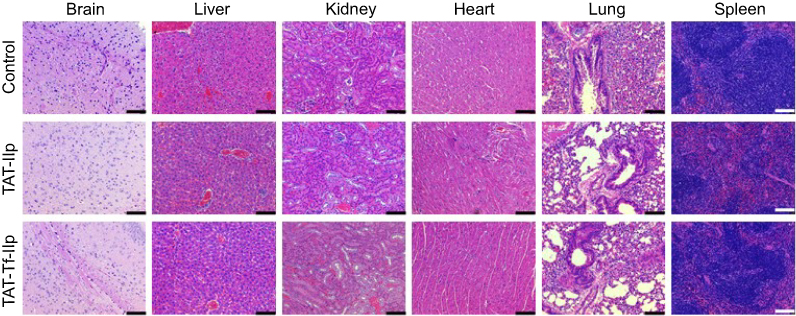 |
Figure 11 H&E staining of brain, liver, kidneys, heart, lungs and spleen sections of C57BL/6 mice following tail vein administration of saline (used as control), TAT-lip and TAT-Tf-lip (n=6). Histological analysis of representative organs. (Scale bar: 100 µm.)Abbreviations: lip, liposome; TAT, HIV-1 trans-activating protein; Tf, transferrin. |
Discussion
In this study, we designed liposomal formulations through surface coupling of selected moieties as a targeting agent for brain delivery and efficient transfection. We performed in vitro screening of the multi-functionalized liposomes to select the most appropriate gene carrier for in vivo studies. We focused on targeting TfRs, which are overexpressed on the surface of brain endothelial cells, for specific brain delivery of pDNA. Enhancement of liposome delivery and transfection properties was intended by conjugating CPPs on the liposome surface. Liposomal characteristics were optimized to obtain homogeneous and stable gene carriers.
Having high DNA packing ability, low immunogenicity and the capacity for large-scale production, liposomes are one of the most commonly used gene delivery vectors.45 Our liposomal formulation constituted of an equimolar mixture of DOTAP, a cationic lipid, and DOPE, a zwitterionic lipid. A balance between DOTAP/DOPE would provide improved liposome translocation into cells and reduced cytotoxicity and, consequently, would promote transfection.46–48 The hydrophilic and inert polymer DSPE-PEG imparted a steric barrier to the surface of nanoparticles, mitigating the binding of serum proteins, which would avoid reticuloendothelial system recognition and clearance, leading to extended systemic circulation of nanoparticles.49 Sufficient PEG coverage of the liposome surface in the presence of 8 mol% PEGylation was intended to maximize the protection against opsonization.27,50 The physicochemical properties of liposomes contributed to the encapsulation and protection of pDNA against enzymatic degradation. With the use of well-known phospholipids and ligands, the safety and biocompatibility of liposomal formulations were predictable and controllable. As expected, the nanoparticles showed low hemolytic potential as well as low cytotoxicity in bEnd.3, glial and primary neuronal cells at low phospholipid concentrations.
To understand further the role of coupled moieties in liposome internalization and transfection efficiency, in vitro cellular uptake and transfection studies were performed in bEnd.3, glial and primary neuronal cells. Using fluorescently labeled liposomes, we showed that cellular uptake of liposomal formulations occurred in a time-dependent manner via multiple endocytosis pathways, in which clathrin-mediated endocytosis and caveolae-mediated endocytosis played important roles. Furthermore, the results suggest that liposome uptake is a function of surface modifications as well as cell type, which is in good agreement with studies performed with surface-modified liposomes.51,52 Studies performed with pVec have shown its ability to internalize murine brain endothelial cells and accumulate in the nucleus.53 Cellular translocation of amphiphilic peptides such as pVec was suggested to occur through initial contact of peptide-positive charges with the cell membrane,54 and was based on both non-endocytic and endocytic pathways.55,56 As suggested by studies performed with hydrophobic pentapeptides, penetration of QL-liposomes into cells took place through non-energy-dependent as well as energy-dependent mechanisms.31,32
Electrostatic interaction between the anionic cell membrane and cationic liposomes conjugated to TAT is believed to be the first step in carrier internalization. Several studies have investigated the contribution of endocytotic pathways on the uptake of TAT; however, no predominant endocytotic pathway was observed.27,57–59 The interaction with the plasma membrane could be changed by peptide concentration and cargo properties, resulting in activation of different entry routes. Consistent with those findings, our results suggested that TAT-liposomes may not only use different endocytotic pathways for cellular entry but also use non-endocytotic entry routes. For dual-modified liposomes (pVec-Tf-lip, QL-Tf-lip and TAT-Tf-lip), the results strongly indicated entry through multiple endocytosis pathways and a low contribution of non-endocytotic routes. We hypothesize that cell entry via distinctive pathways could be triggered by differential interaction of nanoparticles with the plasma membrane, and that such interactions would depend on several variables, including the plasma membrane composition, the cationic characteristics of liposomes and the ligands. It is likely that the Tf ligand provides contact with the TfR present on the cell surface, coordinating TfR-mediated transport into cells via clathrin-mediated endocytosis.60 CPP may enhance nanoparticle non-specific surface interaction with the cell membrane, leading to adsorptive endocytosis and other endocytosis pathways, which could compensate for the possible saturation of TfR.61
We observed that the designed dual modification on liposomes contributed to a stronger delivery, and consequently, transfection effect in bEnd.3, primary glial and primary neuronal cells compared to non-targeting and single-modified nanoparticles. Furthermore, a consistently superior ability to transfect cells was demonstrated by TAT-Tf-liposomes. Despite the efficient ability to be internalized into cells, pVec and QL conjugation to liposomes did not provide the same gene expression as TAT-modified liposomes. We can speculate as to the reasons behind this difference, which may include the instability of the liposomal formulations to endosomal escape, resistance to enzymatic degradation or release of pDNA, or even the loss of CPP properties.62 After binding to cell surface and undergoing endocytosis, arginine-rich peptides including TAT have demonstrated an ability to overcome endocytotic vesicles and be detected in the cytosol, which have been attributed to the promotion of endosomal escape.63–65 The mechanisms underlying this process remain unclear. Some groups have argued that arginine-rich peptides destabilize or disrupt the endosomal membrane and subsequently access the cytosol.66 Others claim that escape from endosomes occurs through membrane fusion and the guanidinium groups play a major role,24 but studies performed with TAT-coupled liposomes proposed inducing lipid fusion to the endosome membrane followed by membrane leakage.67 Moreover, cationic peptides provide nuclear localization of condensed pDNA.72 Remarkably, conjugation of two moieties on the liposome surface was shown to be an important factor in enhancing the transfection efficiency of liposomes.10
The evaluation of BBB permeability and toxicity through in vitro BBB models has become an important step in the development of formulations focused on brain therapy. This platform not only provides the selection of suitable formulations, and thus reduces the failures in clinical trials, but also can provide a comprehensive study of the mechanisms behind the transport to CNS, the kinetics of the transport, and the expression and functionality of transporters.43,68,69 Liposome transport across the in vitro BBB showed that transport of liposomes modified with TAT and Tf was evidently higher than that of the other liposomal formulations, especially liposomes without surface modifications. Subsequently, TAT-Tf-liposomes efficiently transfected primary neuronal cells. Therefore, this is suggestive evidence that TAT and Tf contributed to the translocation of liposomes across the in vitro BBB, thereby delivering cargo into the cells.
Owing to their superior ability to bypass the in vitro BBB model and transfect primary neuronal cells, liposomes modified with TAT and liposomes modified with TAT and Tf were chosen for biodistribution studies. In the brain of mice, dual-targeting delivery of TAT-Tf-liposomes could be clearly observed as this combination led to significantly higher fluorescent intensity. The role of dual surface modification in the enhancement of liposome transport across the in vitro and in vivo BBB and transfection of neuronal cells has also been observed.36 The brain-targeted delivery of TAT-Tf-liposomes also implied the reduction of non-specific accumulations in the lungs and spleen. The quantitative study of biodistribution could reveal accumulations of TAT-Tf-liposomes mainly in the brain, liver and kidneys after 24 hours of administration. Although the designed liposomes could not exclude accumulation in other organs, it is important to emphasize the significant amount of TAT-Tf-modified liposomal nanoparticles quantified in mouse brain in our study, which was also significantly superior to the amounts of TAT-modified liposomes in mouse brain reported in previous studies.27,28 Analysis through H&E staining of tissue sections did not show evidence of morphological changes or signs of toxicity after treatment with liposomal formulations. For accurate evaluation of the in vivo toxicity of nanoparticles, assessment of organ-specific biomarkers is recommended, including immunogenicity and genotoxicity markers.70,71 Additional detailed investigation of in vivo toxicity of our designed liposomal formulations will be included in our future studies. The dual-target in vivo delivery provided by TAT-Tf-liposomes highlighted the relevance of TfR targeting and the contribution of TAT in enhancing liposome translocation across the BBB and penetration into the brain of mice.
Conclusion
In the present study, we established that the design and screening of dual-modified liposomes using an in vitro BBB model are important steps in the development of efficient brain-targeted gene delivery systems. The liposome system consisted of cholesterol, an equimolar combination of DOTAP and DOPE, and DSPE-PEG2000 conjugated to Tf and CPP on their surface for targeting and enhanced gene delivery. Liposome characterization showed efficient encapsulation of pDNA, ability to protect the encapsulated pDNA against enzymatic degradation, low hemolytic potential and low cytotoxicity at 100 nM phospholipid concentration. The time-dependent internalization of liposomal formulations into the cells occurred through multiple endocytosis pathways. Dual surface modification was shown to provide an important improvement in the transfection efficiency as well as in the in vitro and in vivo ability of liposomes to cross the BBB. Liposomes modified with TAT and Tf showed a higher ability to overcome the in vitro BBB model and transfect primary neuronal cells, showing greater advantages over the other formulations. In vivo studies confirmed the biocompatibility and ability of TAT-Tf-liposomes, which were shown to cross the BBB and penetrate the brain of mice. Therefore, this system has great potential for effective and safe brain-targeted gene delivery.
Acknowledgment
This work was supported by the National Institutes of Health (grant R01AG051574).
Disclosure
B.S.R. is supported by a doctoral fellowship from The Brazilian National Council for Scientific and Technological Development (CNPq, Brazil) with a scholarship for B.S.R (Full Doctorate Fellowship (GDE): 221327/2014-2). The authors report no other conflicts of interest in this work.
References
1. Lykken EA, Shyng C, Edwards RJ, Rozenberg A, Gray SJ. Recent progress and considerations for AAV gene therapies targeting the central nervous system. J Neurodev Disord. 2018;10(1):1–10. doi:10.1186/s11689-018-9234-0
2. Costantini LC, Bakowska JC, Breakefield XO, Isacson O. Gene therapy in the CNS. Gene Ther. 2000;7(2):93–109. doi:10.1038/sj.gt.3301119
3. Pardo J, Morel GR, Astiz M, et al. Gene therapy and cell reprogramming for the aging brain : achieve- ments and promise. Curr Gene Ther. 2014;14(1):24–34.
4. Furtado D, Björnmalm M, Ayton S, Bush AI, Kempe K, Caruso F. Overcoming the blood–brain barrier: the role of nanomaterials in treating neurological diseases. Adv Mater. 2018;30:46. doi:10.1002/adma.201801362
5. Hersh DS, Wadajkar AS, Roberts N, et al. Evolving Drug Delivery Strategies to Overcome the Blood Brain Barrier. Curr Pharm Des. 2016;22(9):1177-1193. doi:10.2174/1381612822666151221150733.
6. Vieira DB, Gamarra LF. Getting into the brain: liposome-based strategies for effective drug delivery across the blood–brain barrier. Int J Nanomedicine. 2016;11:5381–5414. doi:10.2147/IJN.S117210
7. Pardridge WM. Blood – brain barrier delivery. Drug Discov Today. 2007;12(January):54–61. doi:10.1016/j.drudis.2006.10.013
8. Pandey PK, Sharma AK, Gupta U. Blood brain barrier: an overview on strategies in drug delivery, realistic in vitro modeling and in vivo live tracking. Tissue Barriers. 2016;4(1):1–14. doi:10.1080/21688370.2015.1129476
9. Tapeinos C, Battaglini M, Ciofani G. Advances in the design of solid lipid nanoparticles and nanostructured lipid carriers for targeting brain diseases. J Control Release. 2017;264(July):306–332. doi:10.1016/j.jconrel.2017.08.033
10. Agrawal M, Ajazuddin AA, Tripathi DK, et al. Recent advancements in liposomes targeting strategies to cross blood-brain barrier (BBB) for the treatment of alzheimer’s disease. J Control Release. 2017;260(April):61–77. doi:10.1016/j.jconrel.2017.05.019
11. Paterson J, Webster CI. Exploiting transferrin receptor for delivering drugs across the blood-brain barrier. Drug Discov Today Technol. 2016;20:49–52. doi:10.1016/j.ddtec.2016.07.009
12. Ponka P, Lok CN. The transferrin receptor: role in health and disease. Int J Biochem Cell Biol. 1999;31(10):1111–1137. doi:10.1016/S1357-2725(99)00070-9
13. Leitner DF, Connor JR. Functional roles of transferrin in the brain. Biochim Biophys Acta. 2012;1820(3):393–402. doi:10.1016/j.bbagen.2011.10.016
14. Johnsen KB, Burkhart A, Melander F, et al. Targeting transferrin receptors at the blood-brain barrier improves the uptake of immunoliposomes and subsequent cargo transport into the brain parenchyma. Sci Rep. 2017;7(1):1–13. doi:10.1038/s41598-017-11220-1
15. da Cruz MTG, Cardoso ALC, de Almeida LP, Simões S, de Lima MCP. Tf-lipoplex-mediated NGF gene transfer to the CNS: neuronal protection and recovery in an excitotoxic model of brain injury. Gene Ther. 2005;12(16):1242–1252. doi:10.1038/sj.gt.3302516
16. Zheng C, Ma C, Bai E, Yang K, Xu R. Transferrin and cell-penetrating peptide dual-functioned liposome for targeted drug delivery to glioma. Int J Clin Exp Med. 2015;8(2):1658–1668.
17. Lee SM, Kim J-S, Oh Y-K, Lee Y-B, Sah H. Biodistribution and genotoxicity of transferrin- conjugated liposomes/DNA complexes in mice. Macromol Res. 2005;13(3):218–222. doi:10.1007/BF03219055
18. Zhang D, Wang J, Xu D. Cell-penetrating peptides as noninvasive transmembrane vectors for the development of novel multifunctional drug-delivery systems. J Control Release. 2016;229(81170255):130–139. doi:10.1016/j.jconrel.2016.03.020
19. Bashyal S, Noh G, Keum T, Choi YW, Lee S. Cell penetrating peptides as an innovative approach for drug delivery; then, present and the future. J Pharm Investig. 2016;46(3):205–220. doi:10.1007/s40005-016-0253-0
20. Copolovici DM, Langel K, Eriste E, Langel Ü. Cell-penetrating peptides: design, synthesis, and applications. ACS Nano. 2014;8(3):1972–1994. doi:10.1021/nn4057269
21. Guidotti G, Brambilla L, Rossi D. Cell-penetrating peptides: from basic research to clinics. Trends Pharmacol Sci. 2017;38(4):406–424. doi:10.1016/j.tips.2017.01.003
22. Frankel AD, Pabo CO. Cellular uptake of the tat protein from human immunodeficiency virus. Cell. 1988;55(6):1189–1193. doi:10.1016/0092-8674(88)90263-2
23. Green M, Loewenstein PM. Autonomous functional domains of chemically synthesized human immunodeficiency virus tat trans-activator protein. Cell. 1988;55(6):1179–1188. doi:10.1016/0092-8674(88)90262-0
24. Ramsey JD, Flynn NH. Cell-penetrating peptides transport therapeutics into cells. Pharmacol Ther. 2015;154:78–86. doi:10.1016/j.pharmthera.2015.07.003
25. Simon MJ, Gao S, Kang WH, Banta S, Morrison B. TAT-mediated intracellular protein delivery to primary brain cells is dependent on glycosaminoglycan expression. Biotechnol Bioeng. 2009;104(1):10–19. doi:10.1002/bit.22377
26. Malhotra M, Tomaro-Duchesneau C, Prakash S. Synthesis of TAT peptide-tagged PEGylated chitosan nanoparticles for siRNA delivery targeting neurodegenerative diseases. Biomaterials. 2013;34(4):1270–1280. doi:10.1016/j.biomaterials.2012.10.013
27. Qin Y, Chen H, Yuan W, et al. Liposome formulated with TAT-modified cholesterol for enhancing the brain delivery. Int J Pharm. 2011;419(1–2):85–95. doi:10.1016/j.ijpharm.2011.07.021
28. Qin Y, Chen H, Zhang Q, et al. Liposome formulated with TAT-modified cholesterol for improving brain delivery and therapeutic efficacy on brain glioma in animals. Int J Pharm. 2011;420(2):304–312. doi:10.1016/j.ijpharm.2011.09.008
29. Milletti F. Cell-penetrating peptides: classes, origin, and current landscape. Drug Discov Today. 2012;17(15–16):850–860. doi:10.1016/j.drudis.2012.03.002
30. Stalmans S, Bracke N, Wynendaele E, et al. Cell-penetrating peptides selectively cross the blood-brain barrier in vivo. PLoS One. 2015;10(10):1–22. doi:10.1371/journal.pone.0139652
31. Gomez JA, Chen J, Ngo J, et al. Cell-penetrating penta-peptides (CPP5s): measurement of cell entry and protein-transduction activity. Pharmaceuticals. 2010;3(12):3594–3613. doi:10.3390/ph3123594
32. Gomez JA, Gama V, Yoshida T, et al. Bax-inhibiting peptides derived from Ku70 and cell-penetrating pentapeptides. Biochem Soc Trans. 2007;35(Pt4):797–801. doi:10.1042/BST0350797
33. Yoshida T, Tomioka I, Nagahara T, et al. Bax-inhibiting peptide derived from mouse and rat Ku70. Biochem Biophys Res Commun. 2004;321(4):961–966. doi:10.1016/j.bbrc.2004.07.054
34. Cai D, Gao W, He B, et al. Hydrophobic penetrating peptide PFVYLI-modified stealth liposomes for doxorubicin delivery in breast cancer therapy. Biomaterials. 2014;35(7):2283–2294. doi:10.1016/j.biomaterials.2013.11.088
35. Li X, Ding L, Xu Y, Wang Y, Ping Q. Targeted delivery of doxorubicin using stealth liposomes modified with transferrin. Int J Pharm. 2009;373(1–2):116–123. doi:10.1016/j.ijpharm.2009.01.023
36. dos Santos Rodrigues B, Oue H, Banerjee A, Kanekiyo T, Singh J. Dual functionalized liposome-mediated gene delivery across triple co-culture blood brain barrier model and specific in vivo neuronal transfection. J Control Release. 2018;286(July):264–278. doi:10.1016/j.jconrel.2018.07.043
37. Sharma G, Modgil A, Sun C, Singh J. Grafting of cell-penetrating peptide to receptor-targeted liposomes improves their transfection efficiency and transport across blood-brain barrier model. J Pharm Sci. 2012;101(7):2468–2478. doi:10.1002/jps.23152
38. dos Santos Rodrigues B, Banerjee A, Kanekiyo T, Singh J. Functionalized liposomal nanoparticles for efficient gene delivery system to neuronal cell transfection. Int J Pharm. 2019;566(April):717–730. doi:10.1016/j.ijpharm.2019.06.026
39. Sharma G, Modgil A, Layek B, et al. Cell penetrating peptide tethered bi-ligand liposomes for delivery to brain in vivo: biodistribution and transfection. J Control Release. 2013;167(1):1–10. doi:10.1016/j.jconrel.2013.01.016
40. Sumners C, Fregly MJ. Modulation of angiotensin II binding sites in neuronal cultures by mineralocorticoids. Am J Physiol. 1989;256:C121–C129. doi:10.1152/ajpcell.1989.256.1.C121
41. Layek B, Haldar MK, Sharma G, Lipp L, Mallik S, Singh J. Hexanoic acid and polyethylene glycol double grafted amphiphilic chitosan for enhanced gene delivery: influence of hydrophobic and hydrophilic substitution degree. Mol Pharm. 2014;11(3):982–994. doi:10.1021/mp400633r
42. Nakagawa S, Deli MA, Kawaguchi H, et al. A new blood-brain barrier model using primary rat brain endothelial cells, pericytes and astrocytes. Neurochem Int. 2009;54(3–4):253–263. doi:10.1016/j.neuint.2008.12.002
43. Helms HC, Abbott NJ, Burek M, et al. In vitro models of the blood–brain barrier: an overview of commonly used brain endothelial cell culture models and guidelines for their use. J Cereb Blood Flow Metab. 2016;36(5):862–890. doi:10.1177/0271678X16630991
44. Xue Q, Liu Y, Qi H, et al. A novel brain neurovascular unit model with neurons, astrocytes and microvascular endothelial cells of rat. Int J Biol Sci. 2013;9(2):174–189. doi:10.7150/ijbs.5115
45. Balbino TA, Gasperini AAM, Oliveira CLP, Azzoni AR, Cavalcanti LP, De La Torre LG. Correlation of the physicochemical and structural properties of pDNA/cationic liposome complexes with their in vitro transfection. Langmuir. 2012;28(31):11535–11545. doi:10.1021/la302608g
46. Kim BK, Hwang GB, Seu YB, Choi JS, Jin KS, Doh KO. DOTAP/DOPE ratio and cell type determine transfection efficiency with DOTAP-liposomes. Biochim Biophys Acta - Biomembr. 2015;1848(10):1996–2001. doi:10.1016/j.bbamem.2015.06.020
47. Ciani L, Ristori S, Salvati A, Calamai L, Martini G. DOTAP/DOPE and DC-Chol/DOPE lipoplexes for gene delivery: zeta potential measurements and electron spin resonance spectra. Biochim Biophys Acta - Biomembr. 2004;1664(1):70–79. doi:10.1016/j.bbamem.2004.04.003
48. Kolašinac R, Kleusch C, Braun T, Merkel R, Csiszár A. Deciphering the functional composition of fusogenic liposomes. Int J Mol Sci. 2018;19:2. doi:10.3390/ijms19020346
49. Nakamura K, Yamashita K, Itoh Y, Yoshino K, Nozawa S, Kasukawa H. Biochimica et biophysica acta comparative studies of polyethylene glycol-modi fi ed liposomes prepared using different PEG-modi fi cation methods. BBA - Biomembr. 2012;1818(11):2801–2807. doi:10.1016/j.bbamem.2012.06.019
50. Li SD, Huang L. Stealth nanoparticles: high density but sheddable PEG is a key for tumor targeting. J Control Release. 2010;145(3):178–181. doi:10.1016/j.jconrel.2010.03.016
51. Kang JH, Jang WY, Ko YT. The effect of surface charges on the cellular uptake of liposomes investigated by live cell imaging. Pharm Res. 2017;34(4):704–717. doi:10.1007/s11095-017-2097-3
52. Lee S, Sato Y, Hyodo M, Harashima H. Topology of surface ligands on liposomes : characterization based on the terms, incorporation ratio, surface anchor density, and reaction yield. Biol Pharm Bull. 2016;39(12):1983–1994. doi:10.1248/bpb.b16-00462
53. Elmquist A, Lindgren M, Bartfai T, Langel U. VE-cadherin-derived cell-penetrating peptide, pVEC, with carrier functions. Exp Cell Res. 2001;269(2):237–244. doi:10.1006/excr.2001.5316
54. Akdag IO, Ozkirimli E. The uptake mechanism of the cell-penetrating pVEC peptide. J Chem. 2013;2013. doi:10.1155/2013/851915
55. Kang S, Suresh A, Kim YC. A highly efficient cell penetrating peptide pVEC-mediated protein delivery system into microalgae. Algal Res. 2017;24(May):360–367. doi:10.1016/j.algal.2017.04.022
56. Elmquist A, Hansen M, Langel U. Structure-activity relationship study of the cell-penetrating peptide pVEC. Biochim Biophys Acta. 2006;1758(6):721–729. doi:10.1016/j.bbamem.2006.05.013
57. Yamano S, Dai J, Yuvienco C, Khapli S, Moursi AM, Montclare JK. Modified Tat peptide with cationic lipids enhances gene transfection efficiency via temperature-dependent and caveolae-mediated endocytosis. J Control Release. 2011;152(2):278–285. doi:10.1016/j.jconrel.2011.02.004
58. Yuan M, Qiu Y, Zhang L, Gao H, He Q. Targeted delivery of transferrin and TAT co-modified liposomes encapsulating both paclitaxel and doxorubicin for melanoma. Drug Deliv. 2016;23(4):1171–1183. doi:10.3109/10717544.2015.1040527
59. Richard JP, Melikov K, Brooks H, Prevot P, Lebleu B, Chernomordik LV. Cellular uptake of unconjugated TAT peptide involves clathrin-dependent endocytosis and heparan sulfate receptors. J Biol Chem. 2005;280(15):15300–15306. doi:10.1074/jbc.M401604200
60. Johnsen KB, Moos T. Revisiting nanoparticle technology for blood-brain barrier transport: unfolding at the endothelial gate improves the fate of transferrin receptor-targeted liposomes. J Control Release. 2016;222:32–46. doi:10.1016/j.jconrel.2015.11.032
61. Jobin ML, Alves ID. On the importance of electrostatic interactions between cell penetrating peptides and membranes: a pathway toward tumor cell selectivity? Biochimie. 2014;107(Part A):154–159. doi:10.1016/j.biochi.2014.07.022
62. Mo RH, Zaro JL, Shen WC. Comparison of cationic and amphipathic cell penetrating peptides for siRNA delivery and efficacy. Mol Pharm. 2012;9(2):299–309. doi:10.1021/mp200481g
63. Erazo-Oliveras A, Muthukrishnan N, Baker R, Wang TY, Pellois JP. Improving the endosomal escape of cell-penetrating peptides and their cargos: strategies and challenges. Pharmaceuticals. 2012;5(11):1177–1209. doi:10.3390/ph5111177
64. Tashima T. Intelligent substance delivery into cells using cell-penetrating peptides. Bioorganic Med Chem Lett. 2017;27(2):121–130. doi:10.1016/j.bmcl.2016.11.083
65. Trabulo S, Cardoso AL, Mano M, de Lima MCP. Cell-penetrating peptides-mechanisms of cellular uptake and generation of delivery systems. Pharmaceuticals. 2010;3(4):961–993. doi:10.3390/ph3040961
66. Åmand HL, Rydberg HA, Fornander LH, Lincoln P, Nordén B, Esbjörner EK. Cell surface binding and uptake of arginine- and lysine-rich penetratin peptides in absence and presence of proteoglycans. Biochim Biophys Acta - Biomembr. 2012;1818(11):2669–2678. doi:10.1016/j.bbamem.2012.06.006
67. Yang ST, Zaitseva E, Chernomordik LV, Melikov K. Cell-penetrating peptide induces leaky fusion of liposomes containing late endosome-specific anionic lipid. Biophys J. 2010;99(8):2525–2533. doi:10.1016/j.bpj.2010.08.029
68. Wilhelm I, Krizbai IA. In vitro models of the blood-brain barrier for the study of drug delivery to the brain. Mol Pharm. 2014;11(7):1949–1963. doi:10.1021/mp500046f
69. Aday S, Cecchelli R, Hallier-Vanuxeem D, Dehouck MP, Ferreira L. Stem cell-based human blood-brain barrier models for drug discovery and delivery. Trends Biotechnol. 2016;34(5):382–393. doi:10.1016/j.tibtech.2016.01.001
70. Gerets HHJ, Hanon E, Cornet M, et al. Selection of cytotoxicity markers for the screening of new chemical entities in a pharmaceutical context: a preliminary study using a multiplexing approach. Toxicol Vitr. 2009;23(2):319–332. doi:10.1016/j.tiv.2008.11.012
71. Campion S, Aubrecht J, Boekelheide K, et al. The current status of biomarkers for predicting toxicity. Expert Opin Drug Metab Toxicol. 2013;9(11):1391–1408. doi:10.1517/17425255.2013.827170
72. Yao J, Fan Y, Li Y, Huang L. Strategies on the nuclear-targeted delivery of genes. J Drug Target. 2013;21(10):926-939. doi: 10.3109/1061186X.2013.830310
Supplementary materials
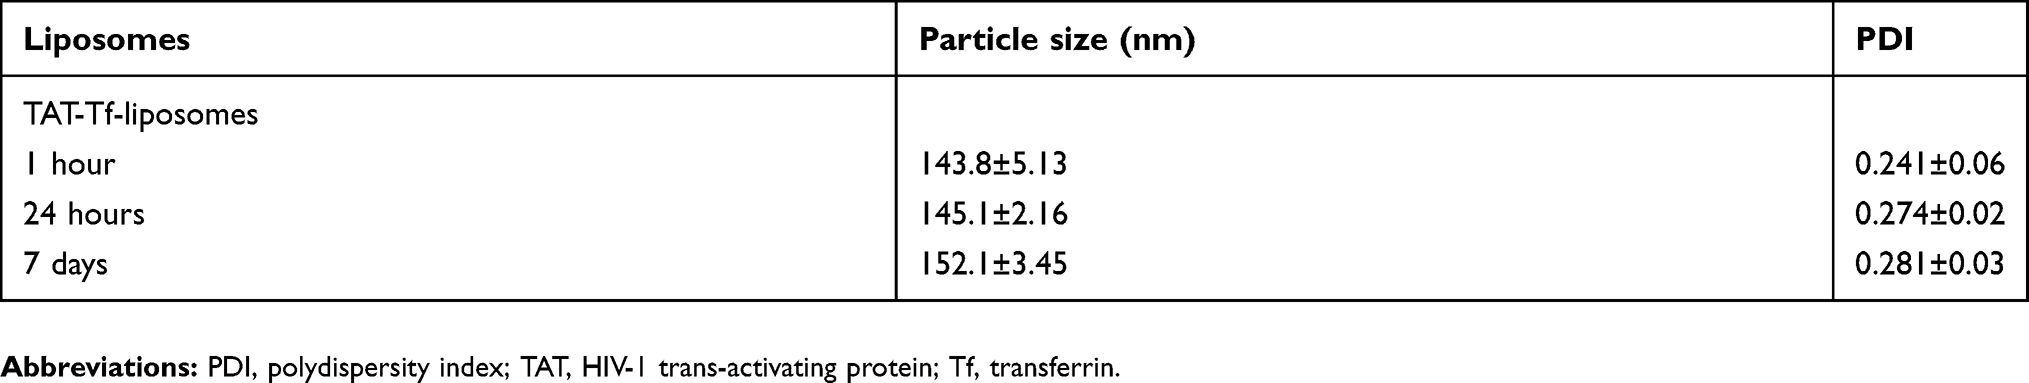 |
Table S1 Characterization of liposomal formulations |
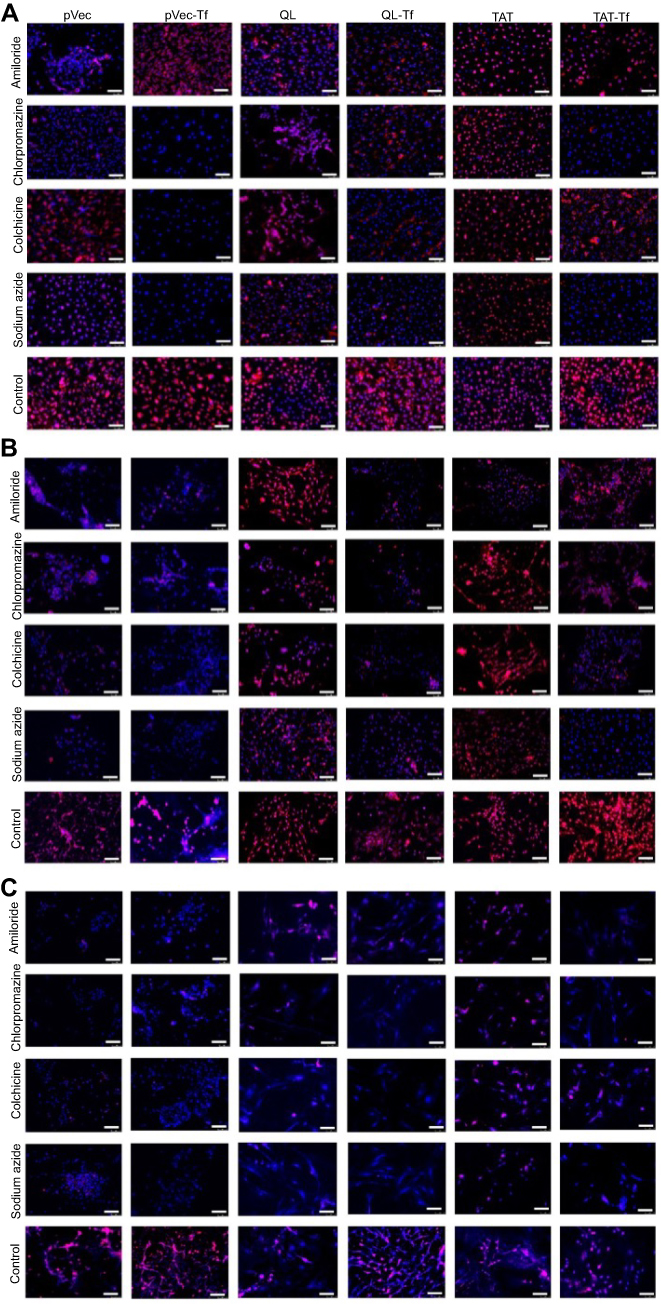 |
Figure S1 Fluorescence microscopy images indicating the effect of chemical inhibitors (amiloride, chlorpromazine, colchicine and sodium azide) on uptake of pVec-lip, pVec-Tf-lip, QL-lip, QL-Tf-lip, TAT-lip and TAT-Tf-lip in bEnd.3 (A), glial (B), and primary neuronal cells (C) after 4 hours. (Scale bars: 100 µm.)Abbreviations: lip, liposome; pVec, vascular endothelial-cadherin-derived peptide; QL, pentapeptide QLPVM; TAT, HIV-1 trans-activating protein; Tf, transferrin. |
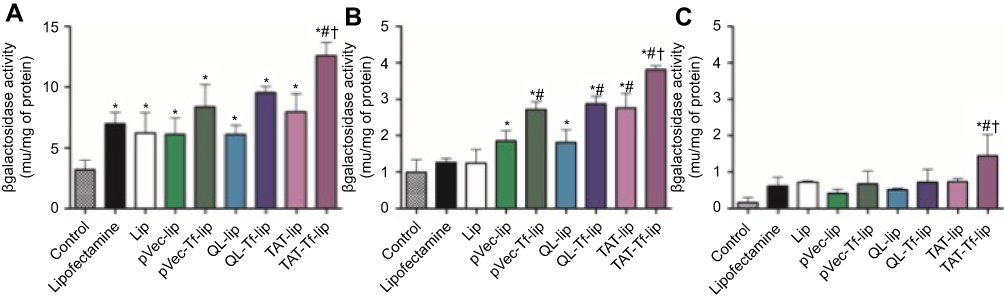 |
Figure S2 β-Galactosidase activity induced in bEnd.3 (A), glial (B), and primary neuronal cells (C) after 48 hours of treatment with Lipofectamine 3000, Lip, pVec-lip, pVec-Tf-lip, QL-lip, QL-Tf-lip, TAT-lip and TAT-Tf-lip containing chitosan–pβgal complexes as determined by the βgal assay kit. Data are expressed as mean ± SD (n=4). Statistically significant (p<0.05) differences are shown as (*) with control, (#) with lipofectamine and (†) with TAT-liposomes.Abbreviations: lip, liposome; pβgal, plasmid vector encoding β-galactosidase; pVec, vascular endothelial-cadherin-derived peptide; QL, pentapeptide QLPVM; TAT, HIV-1 trans-activating protein; Tf, transferrin. |
 © 2019 The Author(s). This work is published and licensed by Dove Medical Press Limited. The full terms of this license are available at https://www.dovepress.com/terms.php and incorporate the Creative Commons Attribution - Non Commercial (unported, v3.0) License.
By accessing the work you hereby accept the Terms. Non-commercial uses of the work are permitted without any further permission from Dove Medical Press Limited, provided the work is properly attributed. For permission for commercial use of this work, please see paragraphs 4.2 and 5 of our Terms.
© 2019 The Author(s). This work is published and licensed by Dove Medical Press Limited. The full terms of this license are available at https://www.dovepress.com/terms.php and incorporate the Creative Commons Attribution - Non Commercial (unported, v3.0) License.
By accessing the work you hereby accept the Terms. Non-commercial uses of the work are permitted without any further permission from Dove Medical Press Limited, provided the work is properly attributed. For permission for commercial use of this work, please see paragraphs 4.2 and 5 of our Terms.