")
Back to Journals » Journal of Experimental Pharmacology » Volume 16
Dapagliflozin Pretreatment Prevents Cardiac Electrophysiological Changes in a Diet and Streptozotocin Induction of Type 2 Diabetes in Rats: A Potential New First-Line?
Authors Juttla PK , Chege BM , Mwangi PW, Bukachi F
Received 15 October 2023
Accepted for publication 22 February 2024
Published 20 March 2024 Volume 2024:16 Pages 123—133
DOI https://doi.org/10.2147/JEP.S443169
Checked for plagiarism Yes
Review by Single anonymous peer review
Peer reviewer comments 2
Editor who approved publication: Dr Roger Pinder
Prabhjot Kaur Juttla,1 Boniface Mwangi Chege,2 Peter Waweru Mwangi,1 Frederick Bukachi1
1Department of Medical Physiology, University of Nairobi, Nairobi, Kenya; 2School of Health Sciences, Dedan Kimathi University of Technology, Nyeri, Kenya
Correspondence: Prabhjot Kaur Juttla, Department of Medical Physiology, University of Nairobi, P.O. Box 30197 – 00100, Nairobi, Kenya, Email [email protected]
Purpose: Dapagliflozin exerts cardioprotective effects in Type 2 Diabetes Mellitus (T2DM). However, whether these effects prevent electrocardiographic changes associated with T2DM altogether remain unknown. Our aim was to investigate the prophylactic effect of dapagliflozin pretreatment on the rat ECG using a high-fat, high-fructose (HFHf) diet and a low dose streptozotocin (STZ) model of T2DM.
Methods: Twenty-five (25) rats were randomized into five (5) groups: normal control receiving a normal diet while the other groups received an 8-week HFHf and 40mg/kg STZ on day 42, and either: saline for the diabetic control (1 mg/kg/d), low dose (1.0 mg/kg/d) and high dose dapagliflozin (1.6 mg/kg/d), or metformin (250 mg/kg/d). Oral glucose tolerance (OGT), electrocardiograms (ECGs), paracardial adipose mass, and left ventricular fibrosis were determined. Data were analyzed using GraphPad version 9.0.0.121, with the level of significance at p < 0.05.
Results: Compared to the diabetic control group, a high dose of dapagliflozin preserved the OGT (p = 0.0001), QRS-duration (p = 0.0263), QT-interval (p = 0.0399), and QTc intervals (p = 0.0463). Furthermore, the high dose dapagliflozin group had the lowest paracardial adipose mass (p = 0.0104) and fibrotic area (p = 0.0001). In contrast, while metformin showed favorable effects on OGT (p = 0.0025), paracardial adiposity (p = 0.0153) and ventricular fibrosis (p = 0.0291), it did not demonstrate significant antiarrhythmic effects.
Conclusion: Pretreatment with higher doses of Dapagliflozin exhibits prophylactic cardioprotective characteristics against diabetic cardiomyopathy that include antifibrotic and antiarrhythmic qualities. This suggests that higher doses of dapagliflozin could be a more effective initial therapeutic option in T2DM.
Keywords: electrocardiogram, diabetic cardiomyopathy, sodium glucose co-transporter inhibitors, prophylaxis, animal model
Introduction
Cardiovascular disease stands as the leading cause of both morbidity and mortality in patients with Type 2 Diabetes mellitus (T2DM).1 Approximately 20% of patients diagnosed with T2DM develop heart failure, primarily due to a distinctive type of cardiomyopathy referred to as diabetic cardiomyopathy (DCM).2 DCM is the presence of abnormal cardiac structure and impaired cardiac performance, independent of other risk factors,3,4 and is responsible for more than half of the deaths in diabetic patients.5 While the precise patho-mechanisms leading to the development of DCM occur irrespective of glycemic control, medical management primarily focuses on glycemic management as a key preventive strategy.2,6
T2DM directly affects the cardiac electrical conduction system.7 Changes due to diabetes include sinus tachycardia, long QTc, ST-T height changes, and left ventricular hypertrophy.8,9 Signs of myocardial ischemia can also be detected on the ECG.8,9 This prolonged and frequent ischemia contributes to extensive myocardial fibrosis that impedes cardiac filling and thus diastolic heart failure.4 In addition, the increased volume of pericardial fat depots in T2DM has been shown to alter cardiac electrophysiology.10,11
Sodium-glucose cotransporter-2 inhibitors (SGLT2i) are a class of oral antidiabetic agents that act on the SGLT2 receptors in the kidney to prevent glucose reuptake by the proximal renal tubules.12 This results in an insulin-independent achievement of euglycemia. It was shown in the Dapagliflozin Effect on Cardiovascular Events Trial [(DECLARE)–TIMI 58] that dapagliflozin reduced hospitalization due to heart failure by a third in diabetic patients.13 Reducing cardiac preload and afterload; myocardial fibrosis and apoptosis; and the size of the epicardial adipose tissue depots are some of the proposed mechanisms of SGLT2i mediated cardio-protection in diabetes.14 Currently, the first-line oral antidiabetic agent is Metformin, which itself possesses significant cardioprotective benefits alongside glucose control.15 Comparing the effects of SGLT2i against the effects of this first-line agent would therefore be beneficial. Furthermore, to our knowledge, a rodent in vivo study to elucidate the effects of early dapagliflozin administration on the ECG has not been previously carried out. Therefore, our aim was to investigate the prophylactic effect of dapagliflozin pretreatment on the rat ECG using a high-fat, high-fructose diet and a low dose of streptozotocin model of T2DM.
Materials and Methods
Animals
Twenty-five (25) (4–6-week-old) freshly weaned male Sprague Dawley rats were procured from the Department of Zoology, University of Nairobi and housed in the animal house located within the Department of Medical Physiology, University of Nairobi, under the following ambient conditions: room temperature of 24° C, relative humidity of 30–50% with a 12-hour light and dark cycle. The rats were group-housed in standard animal cages. There was a habituation period of one week prior to the start of the experiment.
Study Groups
The Sprague-Dawley rats were randomized into 5 experimental groups (n = 5), as below:
- The normal control, NC: rats fed on standard chow pellets and water for 56 days with an intraperitoneal (i.p.) injection of normal saline on day 42,
- Diabetic control, DC: rats fed on a high-fat, high-fructose diet with low-dose streptozotocin [(40mg/kg i.p. on day 42)] and oral normal saline (1mg/kg/d vehicle) for 56 days,
- Low dose Dapagliflozin (Dapa) group, LD: rats fed on a high-fat, high-fructose diet with low-dose streptozotocin (40 mg/kg i.p. on day 42) and 1 mg/kg/day oral Dapagliflozin for 56 days,
- High dose Dapa group, HD: rats fed on a high-fat, high-fructose diet with low-dose streptozotocin (40 mg/kg i.p. on day 42) and oral 1.6 mg/kg/day Dapagliflozin for 56 days,
- Metformin group, MET: rats fed on a high-fat, high-fructose diet with low-dose streptozotocin (40mg/kg i.p. on day 42) and administration of 250 mg/kg/day Metformin for 56 days.
Specifically, for the LD, HD, DC, and MET groups, the high-fat diet was begun and administered ad libitum following the baseline investigations while simultaneously administering the corresponding intervention.
Dosing and Drug Information
The Dapa dosage used in the LD group was based on a previous study by Ye et al,16 while for the HD group it was converted from the human dose for T2DM patients with cardiovascular comorbidities to the rodent dose using the formula: Human equivalent dose (mg / kg) = Animal does (mg / kg) × Km ratio.17 The MET dosage used in the study was equivalent to that used by Argun et al.18
The Dapa used in the experiment was manufactured by AstraZeneca Pharmaceuticals LP, the MET by MerckSerono, Nkunzi Pharmaceuticals (Pty) Ltd. and the streptozotocin by Wako Pure Chemical Industries LTD., Japan.
Diabetes Induction
The 40.8% fat diet and the 20% fructose solution were prepared daily as previously described by Chege et al.19 The high fat diet was prepared daily by adding 15 grams of vegetable cooking fat to 85 grams of standard chow pellets (energy content due to carbohydrate: 70%, protein: 20%, fat 10%) (Unga Feeds Limited, Nairobi, Kenya). The mixture was heated for thirty (30) minutes with regular stirring. Eight (8) grams of Monosodium glutamate (0.9%) (Pradip Enterprises E.A. Ltd.) was added to 15 mL of water and added to every 225 grams of chow pellets. Twenty (20) grams of fructose was dissolved in 100mL of water daily to achieve 20% fructose concentration. This diet was provided to the experimental animals except for the ones in the NC group, ad libitum for eight weeks.
Body Mass Measurement
Each rat was weighed weekly as previously described by Novelli et al.20 A standard electronic weighing scale was used and each rat was weighed individually.
Fasting Plasma Glucose Measurement and Oral Glucose Tolerance Test
Fasting plasma glucose and oral glucose tolerance tests (OGTT) were determined according to the method described by Ayala et al,21 using a hand-held glucometer (Accu-Chek® Active Blood Glucose Meter, Roche Diabetes Care, Inc., Chennai, India). Fasting plasma glucose was recorded after a six-hour fast. OGTT was recorded after the rats were fasted for six-hours, a baseline plasma glucose measurement was recorded after which a 2g/kg bolus of glucose was administered to each rat via oral gavage and subsequent plasma glucose measurements recorded at the 30th, 60th, 90th and 120th minute.
Electrocardiogram (ECG) Recording
Lead II ECG recording on day 56 was performed in accordance with the methods described by Mutiso et al22 using the Power Lab™ data acquisition apparatus and was set to analyze Rat ECGs (Model ML865, AD instruments, Dunedin, New Zealand). The animals were sedated using i.p. injection of Ketamine hydrochloride (75 mg/kg) and Midazolam (2.5 mg/kg). The leads were placed as follows: the positive electrode on the left hind paw, the negative electrode on the right front paw and the ground electrode on the left front paw. The ECG recording settings were: a range of 2 mV, a low pass filter of 20 Hz, and a high pass filter of 0.3 Hz. Averaging the different parameters was performed using Chart 8™ (AD Instruments). QTc was analyzed by the software using the Bazett’s correction. The only morphological difference between rat and human ECG waveforms is the absence of a ST segment in the former.22
Euthanization and Tissue Collection Procedure
The experimental animals were euthanized using 200 mg/kg pentobarbital delivered i.p. on day 56 after an overnight fast. Loss of corneal reflex and pain reflex were used to verify the presence of deep terminal anesthesia. The heart and paracardial fat (adipose tissue adherent and external to the parietal pericardium) were surgically excised and weighed.
Histology
The left ventricular tissue samples were prepared and analyzed using a method described by Ye et al.16 The samples were fixed and stained using Mason’s trichrome, and the percentage fibrotic area was analyzed using ImageJ™ (National Institutes of Health and the Laboratory for Optical and Computational Instrumentation (LOCI, University of Wisconsin)) analysis software. Five (5) microscopic fields from each sample were analyzed.
Ethical Approval
Ethical approval to conduct the study was sought and obtained from the Biosafety, Animal Care and Use Committee of the Department of Veterinary Anatomy and Physiology, University of Nairobi (BAUEC/2020/279). This study conformed to the guidelines for animal studies set out by the Biosafety, Animal Care and Use Committee of the Department of Veterinary Anatomy and Physiology, University of Nairobi Guide for the Care and Use of Laboratory Animals.
Five animals per experimental group was chosen in compliance with the 5R’s of animal research ethics (replace, reduce, refine, reuse, and rehabilitate), and corresponding statistical analyses has been carried out to accommodate this sample size.23
Statistical Analysis
All data were expressed as mean ± SEM. Shapiro–Wilk test was used to determine the distribution of the data using R version 4.1.2 (Copyright© 2021 The R Foundation for Statistical Computing). The data were then analyzed using GraphPad Prism Version 9.0.0.121 (GraphPad U.S.A.). Normally distributed experimental data variables were analyzed using one-way ANOVA and post-hoc statistical analysis performed using Tukey’s multiple comparisons test in cases of significance. Nonparametric experimental data variables were analyzed using the Kruskal–Wallis test with post-hoc statistical analysis carried out with Dunn’s test of significance. The significance level in all the experiments was set at p < 0.05.
Results
Effect on Body Mass Measurement
The body mass of all the experimental groups increased as the study progressed from day 0 until day 56. However, on day 56, the HD group and NC group both had a significantly lower body mass compared to the DC group [240.8 ± 9.249 g (NC) vs 311.4 ± 15.25 g (DC) vs 286.6 ± 18.33 g (LD) vs 247.6 ± 16.17 g (HD) vs 271.2 ± 14.01 g (MET): p = 0.0197].
The significant differences existed between the NC vs the DC (p = 0.0237) and the HD vs DC (p = 0.0467) (Figure 1A).
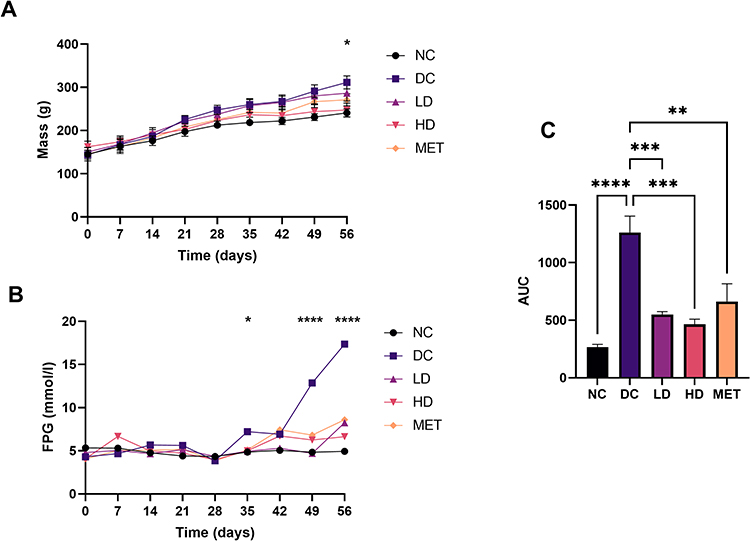 |
Figure 1 (A) Body mass: The weekly body mass measurements during the experimental period. (B) Fasting plasma glucose: The weekly fasting plasma glucose measurements during the experimental period. i.p 40mg/kg of streptozotocin injected on day 42 for all groups except the normal control (NC). (C) Oral glucose tolerance: The area under the curve (AUC, measured in mmol/l×min) calculated values from the oral glucose tolerance curves after an oral bolus of 2g/kg of glucose solution. Abbreviations: NC, normal control. DC, diabetic control. LD, low dose. HD, high dose. MET, metformin. Notes: Values are expressed as mean ± SEM (n = 5 rats in each group). Variable analyzed using one-way ANOVA and Tukey’s post-hoc multiple comparisons test (*p < 0.05, **p < 0.01, ***p < 0.001, ****p < 0.0001). |
Effect on Fasting Plasma Glucose and Oral Glucose Tolerance
At the beginning of the experiment, there were no significant differences between the fasting plasma glucose (FPG) measurements between the groups (Figure 1B). The FPG increased as the experiment progressed, most notably in the DC group and most drastically after the streptozotocin injection on day 42.
At the end of the experimental period, there were significant differences in the FPG, with the DC group having the highest FPG measurement while the NC having the lowest measurement [4.940 ± 0.1749 mmol/l (NC) vs 14.78 ± 0.8680 mmol/l (DC) vs 8.260 ± 1.430 mmol/l (LD) vs 6.640 ± 0.6282 mmol/l (HD) vs 8.600 ± 1.460 mmol/l (MET): p < 0.0001].
There were significant differences were between the DC and the NC (p < 0.0001), the DC and the LD (p = 0.0020), the DC and the HD group (p = 0.0002), and the DC and the MET (p = 0.0034).
At the end of the experiment, oral glucose tolerance was significantly different between the groups (p < 0.0001) (Figure 1C). The DC group was the most glucose intolerant. Significant differences were between the NC vs the DC (p < 0.0001), the DC vs the LD group (p = 0.0004), the DC vs the HD group (p = 0.0001) and the DC vs the MET group (p = 0.0025).
Effect on Electrocardiogram
The typical ECG recordings at the end of the experiment are illustrated in Figure 2.
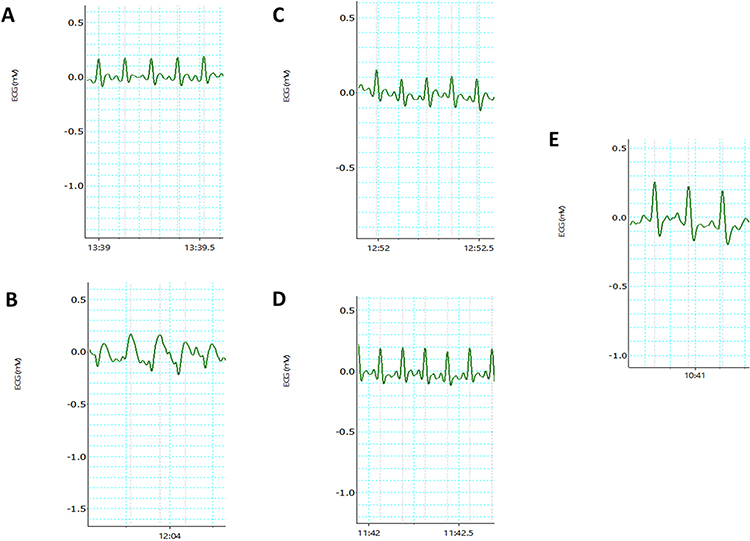 |
Figure 2 Typical electrocardiogram tracings obtained at the end of the experimental period of the (A) NC group, (B) DC group, (C) LD group, (D) HD group and (E) MET group. Dotted lines indicate where measurements were taken by the LabChart™ software. Abbreviations: NC, normal control. DC, diabetic control. LD, low dose. HD, high dose. MET, metformin. |
There were statistically significant differences between the experimental groups in the QT-interval [0.07790 ± 0.003167 s (NC) vs 0.1148 ± 0.01993 s (DC) vs 0.08178 ± 0.001023 s (LD) vs 0.08127 ± 0.001691 (HD) vs 0.08652 ± 0.002114 (MET): p = 0.0048] and the corrected QT-interval [0.2079 ± 0.003550 s (NC) vs 0.2701 ± 0.01376 s (DC) vs 0.2198 ± 0.009013 s (LD) vs 0.2122 ± 0.01183 s (HD) vs 0.2329 ± 0.01632 s (MET): p = 0.0088].
In addition, the QRS-duration was also significantly different between the groups [0.04545 ± 0.001004 s (NC) vs 0.07761 ± 0.01301 s (DC) vs 0.04968 ± 0.003807 s (LD) vs 0.04681 ± 0.002980 s (HD) vs 0.05075 ± 0.001724 (MET): p = 0.0164]. These findings are shown in Figure 3.
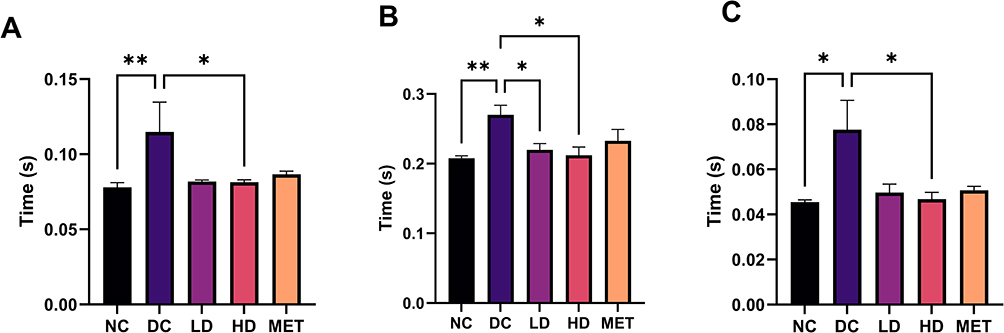 |
Figure 3 (A) QT interval duration at the end of the experiment. (B) QTc duration at the end of the experiment. (C) QRS interval at the end of the experiment. Values are expressed as mean ± SEM. n = 5 rats in each group (*p < 0.05, **p < 0.01). Abbreviations: NC, normal control; DC, diabetic control; LD, low dose; HD, high dose; MET, metformin. |
The heart rate of the NC group was the lowest compared to the rest of the groups, however these changes did not reach the threshold for statistical significance [313.2 ± 19.34 bpm (NC) vs 421.0 ± 77.69 bpm (DC) vs 383.5 ± 27.41 bpm (LD) vs 441.1 ± 26.73 bpm (HD) vs 440.5 ± 36.28 bpm (MET): p = 0.0649]. Other ECG findings are depicted in Table 1.
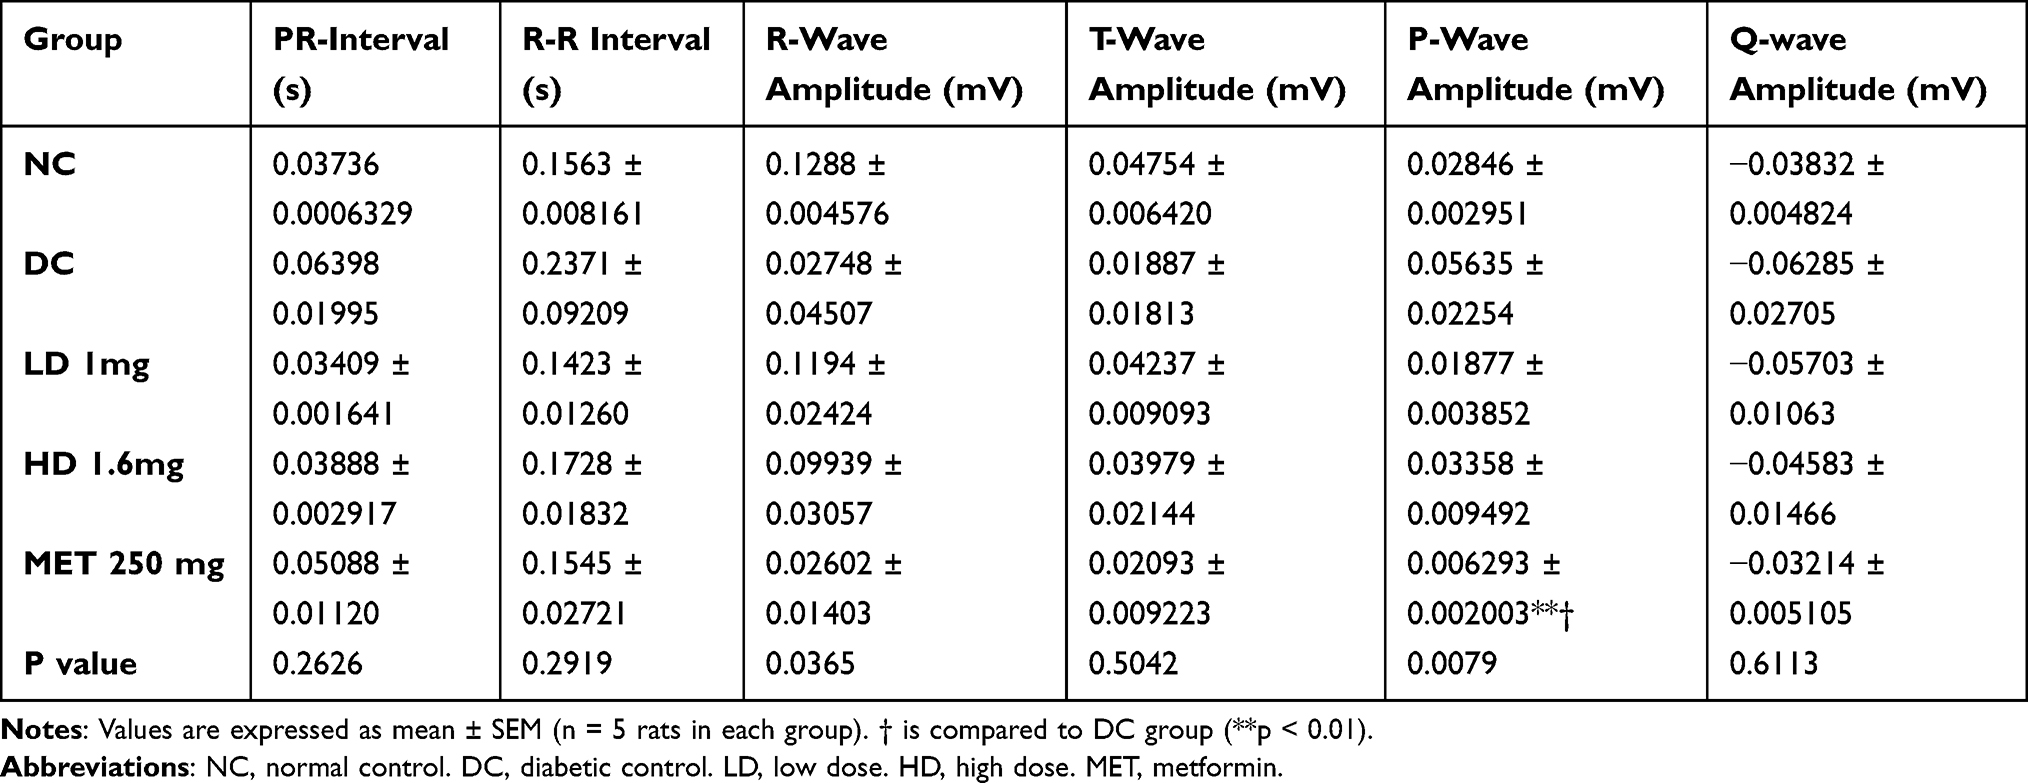 |
Table 1 Other Electrocardiogram Measurements at the End of the Experimental Period |
Effect on Cardiac Anatomic Indices
The heart mass of the DC group was significantly higher than the NC and LD group (Table 2). While it did not reach the threshold for significant, both the HD and MET groups had lower heart masses than the DC group.
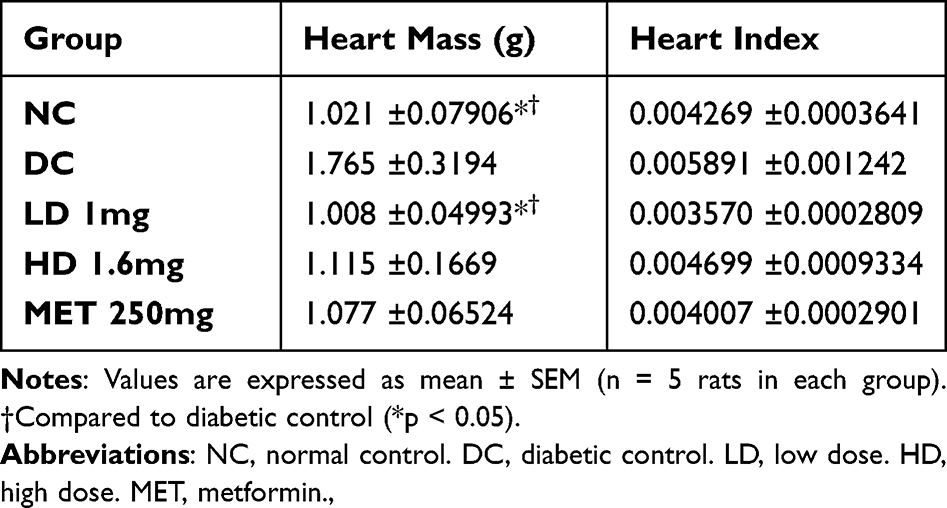 |
Table 2 Heart Mass and Indices at the End of the Experimental Period |
Effect on Paracardial Adipose Tissue
The paracardial adipose masses were significantly different by the end of the study period (Figure 4). We found that the difference was greater between the high dose and diabetic control (p = 0.0104) compared to the metformin and diabetic control (p = 0.0153).
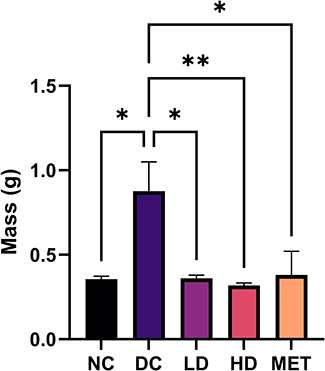 |
Figure 4 Paracardial adipose mass between experimental groups. Values are expressed as mean ± SEM. n = 5 rats in each group, (*p < 0.05, **p < 0.01, one-way ANOVA). Abbreviations: NC, normal control; DC, diabetic control; LD, low dose; HD, high dose; MET, metformin. |
Effect on Left Ventricular Fibrosis
Figure 5 depicts the typical histological findings in the left ventricle between the experimental groups [20.02 ± 1.196% (NC) vs 35.65 ± 3.410% (DC) vs 20.60 ± 2.676% (LD) vs 19.12 ± 2.250% (HD) vs 25.52 ± 1.970% (MET): p < 0.0001]. The diabetic control group had the highest percentage area fibrosis compared to all the experimental groups. Representative histological images can be found in Supplementary Figure 1.
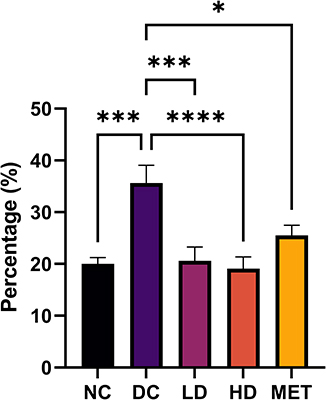 |
Figure 5 The percentage fibrotic area of the experimental groups calculated using longitudinal sections of the left ventricle, (*p < 0.05, ***p < 0.001, **** p < 0.0001, one-way ANOVA). Abbreviations: NC, normal control; DC, diabetic control; LD, low dose; HD, high dose; MET, metformin. |
The left ventricular fibrotic area was significantly reduced between the NC and the DC group (p = 0.0001), the DC and the LD group (p = 0.0002), the DC group and the HD group (p < 0.0001), and the DC and the MET group (p = 0.0291).
Discussion
Diabetic cardiomyopathy (DCM) is characterized by abnormal ventricular function independent of arterial disease and hypertension.24 Recent studies have shown that SGLT2i can reduce new-onset arrhythmias in newly diagnosed T2DM patients.25 However, it remains unclear whether these agents can prevent electrophysiological features of DCM when administered early. Considering the positive cardiac effects of SGLT2is, we investigated whether prophylactic dapagliflozin pretreatment could prevent electrocardiographic and fibrotic changes associated with DCM.
The QT interval after prophylaxis with dapagliflozin was significantly shorter, and QT interval prolongation is associated with progressively worsening glucose tolerance in T2DM.26 In contrast to our findings, a randomized controlled trial in healthy human volunteers showed that empagliflozin treatment did not alter the QTi.27 However, our study, albeit in animals, differs by having paralleled treatment with a dietary and chemical insult of diabetes induction.
Dapagliflozin maintained the QTc interval duration at higher doses. Electrocardiographic prolongations in QTc intervals are considered reliable predictors of heart disease and fatal ventricular arrhythmias,28 the latter being a common cause of mortality among T2DM patients.29 This contrasts with the findings of a study that used dapagliflozin at supratherapeutic doses, in which there was no clinically significant effect on the QTc interval in healthy volunteers.30
The duration of the QRS interval was significantly shorter with high dose dapagliflozin pre-treatment. The prolonged QRS complex represents intraventricular conduction disturbances in heart failure,9 and is predictive of increased cardiovascular risk in asymptomatic diabetes.26 In addition, prolonged QRS interval is associated with left ventricular hypertrophy and is a marker of adverse ventricular remodelling.31
To the best of our knowledge, the electrocardiographic findings we present here in relation to dapagliflozin pretreatment have not been previously documented in existing literature. These results unveil the remarkable cardioprotective effects of dapagliflozin on ventricular function in T2DM and it is noteworthy that the same effects were not produced by metformin, which is in contrast to previous in vivo experiments.32
The preservation of QTc in the Dapa results is particularly noteworthy. QTc has been shown to predict all-cause mortality in T2DM patients.33 Furthermore, these ECG changes are directly associated with DCM, which is known to adversely affect ventricular function,24 and is associated with an increased risk of sudden death.34 These finding underscores the significance of dapagliflozin in preserving cardiac electrophysiology and hence, the potential of dapagliflozin to mitigate these ECG changes holds great promise for enhancing cardiovascular outcomes in T2DM patients if used as the first-line agent as opposed to metformin.
Dapagliflozin’s effects on the ECG may be achieved through multiple mechanisms. In this study, dapagliflozin reduced the size of the paracardial adipose tissue depot, similar to previous reports with canagliflozin and dapagliflozin in T2DM patients.35,36 This reduction in paracardial fat alleviates myocardial inflammation and arrhythmias,12 which are associated with diabetes-induced perturbations in pericardial fat, such as interleukin-1b (IL-1b), tumor necrosis factor-alpha (TNF-α), and interleukin-6 (IL-6) altering ion leakiness.11 This occurs along with the modification of gap junctions by FFAs from adipose tissue, such as oleic acid, which activates L-type calcium channels while inhibiting fast and slow rectifying potassium channels.11 These changes lead to action potential prolongation (manifesting on ECG as increased QTc intervals) increasing arrhythmogenicity.11
Furthermore, dapagliflozin treatment also conferred a reduction in the weight of the left ventricle. These results are corroborated with those of a randomized controlled trial that showed regression of left ventricular hypertrophy after dapagliflozin treatment in T2DM patients.37 Cross-talk between adipose and cardiomyocyte tissue has been suggested to foster hypertrophic changes in DCM. Adipocyte-derived TNF-α and IL-6 promote transcriptional programs that induce LVH and therefore the positive effects of dapagliflozin on pericardial fat may also underpin these anti-hypertrophic effects.38 These effects may also have been further compounded by the sodium and water loss through the kidney after SGLT2i administration,1,17 which improves ventricular loading conditions.17
High dose dapagliflozin treatment reduced the body mass of the rodents compared to the diabetic group, and this effect was not observed in the metformin treated group. This effect has previously been reported after SGLT2i treatment,12,39 and is postulated to occur secondary to the urinary caloric loss which induces a lipolytic state with fat depot reduction.39 This postulation is further supported by a study by Daniele et al40 which showed that dapagliflozin increased lipid oxidation and the production of ketone bodies. In particular, the ketone β-hydroxyburate produced after SGLT2i therapy is preferred by cardiomyocytes and improves heart function because it is energetically cheaper compared to free fatty acids (FFAs) and glucose.12 This shift, therefore, serves the dual purpose of reducing the modifiable risk factor for arrhythmogenesis (obesity) and improving the availability of the preferred fuel for the heart.
Furthermore, dapagliflozin exerted significant euglycemic effects. This is in line with its well-documented insulin-independent glycemic effects.12,13 Lowering the plasma glucose levels attenuates the proclivity for the development of advanced glycosylation end-products.4,12 Advanced glycosylation end-products (AGEs) result from irreversible non-enzymatic post-translational glycosylation of matrix proteins.41 This modification by AGEs is thought to provide a physical impediment to myocardial compliance.4,41 Thus, this glucotoxicity-dependent development of DCM may have been prevented by the plasma-glucose lowering effect of dapagliflozin therapy.
Dapagliflozin also reduced the percentage of left ventricular fibrosis with chronic therapy, supported by studies in diabetic mice using dapagliflozin.16 This effect may result from dapagliflozin-induced natriuresis and osmotic diuresis antagonizing the renin-angiotensin-aldosterone system (RAAS).1 Additionally, SGLT2i activate non-classical RAAS pathways, increasing the production of angiotensin-1-7, which competes with angiotensin-II, further antagonizing the classical RAAS pathway and potentially exerting antiarrhythmic and positive inotropic effects.1
The effect on fibrosis suggests that early treatment with a higher dose of dapagliflozin prevented DCM manifestation, further underscoring the importance of early initiation of SGLTi. Further, there exists supportive evidence for early aggressive treatment of T2DM to tightly control blood glucose levels to reduce cardiovascular risks.42 This is defined as “metabolic memory” which postulates that the benefits of early aggressive treatment are maintained in chronic diabetes.42 These effects are underpinned by prompt mitigation of mitochondrial damage and decreased production of AGEs and AGE receptors.43 The results of the current study taken together may be due to the metabolic memory that was achieved with early intensive treatment.
Our study has some limitations that should be taken into consideration. One of these limitations relates to the use of Ketamine for sedation during the recording of the ECG. It is worth noting that Ketamine has been found to interact with voltage-sensitive calcium channels, which could potentially influence the electrical activity of cardiac cells.9 However, an attempt to mitigate this influence on the results was made by including the normal group in the study. Another limitation arises from the use of a rodent model which have a few physiologically different ion channels compared to the human heart. The sole recording of the lead II of the ECG would only locate changes in the inferior wall of the myocardium as opposed to the heart in its entirety, but this is a common locus for the changes to the myocardium associated with the diabetic state.44
Conclusion
The findings of this study show that the SGLT2 inhibitor dapagliflozin has significant cardioprotective effects in T2DM that include antifibrotic and antiarrhythmic effects, of which the latter effect was not exerted by metformin. These results are, in our view, especially important because the findings were obtained within a background of a high-fat, high-fructose diet, indicating that these agents can be used as prophylactic agents within a clinical setting. They can also, potentially, replace metformin as first-line oral antidiabetic agents. It remains uncertain whether these observed effects are unique to dapagliflozin alone or extend to other drugs in the same class. Future studies should strive to bridge this knowledge gap and facilitate the translation of these findings into practical applications within clinical practice.
Abbreviations
NC, normal control; DC, diabetic control; LD, low dose dapagliflozin; HD, high dose dapagliflozin; MET, metformin; STZ, streptozotocin.
Acknowledgments
We thank Mr. F. Ungaya Mmbaya and Mr. Mwaniki from the Department of Biochemistry, University of Nairobi for assistance with lab reagents and procedures pertaining to the handling of the animals respectively.
Author Contributions
All four authors (PKJ, BMC, PWM and FB) meet the criteria for authorship. PKJ and PWM conceptualized and designed the study. PKJ and BMC executed the study, collected and analyzed the data. PKJ, PWM and FB interpreted the results. PKJ drafted the initial manuscript, and all four authors critically reviewed the article. All four authors reached an agreement on the journal to which the article will be submitted, approved all versions of the article before and during revision, accepted the final version for publication, and managed any significant changes introduced during the proofing stage. Furthermore, all authors agree to take responsibility and be accountable for the contents of the article.
Disclosure
The authors report no conflicts of interest in this work.
References
1. Maejima Y. SGLT2 inhibitors play a salutary role in heart failure via modulation of the mitochondrial function. Front Cardiovasc Med. 2020;6. doi:10.3389/fcvm.2019.00186
2. Ferrini M, Johansson I, Aboyans V. Heart failure and its complications in patients with diabetes: mounting evidence for a growing burden. Eur J Prev Cardiol. 2019;26(2_suppl):106–113. doi:10.1177/2047487319885461
3. Tan Y, Zhang Z, Zheng C, Wintergerst KA, Keller BB, Cai L. Mechanisms of diabetic cardiomyopathy and potential therapeutic strategies: preclinical and clinical evidence. Nat Rev Cardiol. 2020;17(9):585–607. doi:10.1038/s41569-020-0339-2
4. Borghetti G, Von Lewinski D, Eaton DM, Sourij H, Houser SR, Wallner M. Diabetic cardiomyopathy: current and future therapies. Beyond glycemic control. Front Physiol. 2018;9:1–15. doi:10.3389/fphys.2018.01514
5. Filardi T, Ghinassi B, Di Baldassarre A, et al. Cardiomyopathy associated with diabetes: the central role of the cardiomyocyte. Int J Mol Sci. 2019;20(13):3299. doi:10.3390/ijms20133299
6. Varma U, Koutsifeli P, Benson VL, Mellor KM, Delbridge LMD. Molecular mechanisms of cardiac pathology in diabetes – experimental insights. Biochim Biophys Acta Mol Basis Dis. 2018;1864(5):1949–1959. doi:10.1016/j.bbadis.2017.10.035
7. Zhang Y, Wang Y, Yanni J, et al. Electrical conduction system remodeling in streptozotocin-induced diabetes mellitus rat heart. Front Physiol. 2019;10:1–15. doi:10.3389/fphys.2019.00826
8. Stern S, Sclarowsky S. The ecg in diabetes mellitus. Circulation. 2009;120(16):1633–1636. doi:10.1161/CIRCULATIONAHA.109.897496
9. Konopelski P, Ufnal M. Electrocardiography in rats: a comparison to human. Physiol Res. 2016;65(5):717–725. doi:10.33549/physiolres.933270
10. Pabon MA, Manocha K, Cheung JW, Lo JC. Linking arrhythmias and adipocytes: insights, mechanisms, and future directions. Front Physiol. 2018;9:1–12. doi:10.3389/fphys.2018.01752
11. Patel KHK, Hwang T, Liebers CS, Ng FS. Epicardial adipose tissue as a mediator of cardiac arrhythmias. Am J Physiol Heart Circ Physiol. 2022;322(2):H129–H144. doi:10.1152/ajpheart.00565.2021
12. Filippatos TD, Liontos A, Papakitsou I, Elisaf MS. SGLT2 inhibitors and cardioprotection: a matter of debate and multiple hypotheses. Postgrad Med. 2019;131(2):82–88. doi:10.1080/00325481.2019.1581971
13. Wiviott SD, Raz I, Bonaca MP, et al. Dapagliflozin and cardiovascular outcomes in type 2 diabetes. N Engl J Med. 2019;380(4):347–357. doi:10.1056/NEJMoa1812389
14. Ni L, Yuan C, Chen G, et al. SGLT2i: beyond the glucose-lowering effect. Cardiovasc Diabetol. 2020;19(1). doi:10.1186/s12933-020-01071-y
15. Driver C, Bamitale KDS, Kazi A, Olla M, Nyane NA, Owira PMO. Cardioprotective Effects of Metformin. J Cardiovasc Pharmacol. 2018;72(2):121–127. doi:10.1097/FJC.0000000000000599
16. Ye Y, Bajaj M, Yang HC, Perez-Polo JR, Birnbaum Y. SGLT-2 inhibition with dapagliflozin reduces the activation of the Nlrp3/ASC inflammasome and attenuates the development of diabetic cardiomyopathy in mice with type 2 diabetes. further augmentation of the effects with saxagliptin, a DPP4 inhibitor. Cardiovasc Drugs Ther. 2017;31(2):119–132. doi:10.1007/s10557-017-6725-2
17. Nair A, Jacob S. A simple practice guide for dose conversion between animals and human. J Basic Clin Pharm. 2016;7(2):27. doi:10.4103/0976-0105.177703
18. Argun M, Üzüm K, Sönmez MF, et al. Cardioprotective effect of metformin against doxorubicin cardiotoxicity in rats. Anatol J Cardiol. 2016;16(4):234–241. doi:10.5152/akd.2015.6185
19. Chege BM, Waweru MP, Frederick B, Nyaga NM. The freeze-dried extracts of Rotheca myricoides (Hochst.) Steane & Mabb possess hypoglycemic, hypolipidemic and hypoinsulinemic on type 2 diabetes rat model. J Ethnopharmacol. 2019;232:244. doi:10.1016/j.jep.2019.112077
20. Novelli ELB, Diniz YS, Galhardi CM, et al. Anthropometrical parameters and markers of obesity in rats. Lab Anim. 2007;41(1):111–119. doi:10.1258/002367707779399518
21. Ayala JE, Samuel VT, Morton GJ, et al. Standard operating procedures for describing and performing metabolic tests of glucose homeostasis in mice. DMM Dis Models Mech. 2010;3(9–10):525–534. doi:10.1242/dmm.006239
22. Mutiso SK, Rono DK, Bukachi F. Relationship between anthropometric measures and early electrocardiographic changes in obese rats. BMC Res Notes. 2014;7(1). doi:10.1186/1756-0500-7-931
23. Kumar AHS. Effectively communicating the 5R’s (replace, reduce, refine, reuse, and rehabilitate) of research ethics, biomedical waste, personalized medicines and the rest. J Nat Sci Biol Med. 2012;3(1):1–2. doi:10.4103/0976-9668.95932
24. Mauricio D, Alonso N, Gratacòs M. Chronic Diabetes Complications: the Need to Move beyond Classical Concepts. Trends Endocrinol Metab. 2020;31(4):287–295. doi:10.1016/j.tem.2020.01.007
25. Chen HY, Huang JY, Siao WZ, Jong GP. The association between SGLT2 inhibitors and new-onset arrhythmias: a nationwide population-based longitudinal cohort study. Cardiovasc Diabetol. 2020;19(1). doi:10.1186/s12933-020-01048-x
26. Gupta S, Gupta RK, Kulshrestha M, Chaudhary RR. Evaluation of ECG abnormalities in patients with asymptomatic type 2 diabetes mellitus. J Clin Diagn Res. 2017;11(4):OC39–OC41. doi:10.7860/JCDR/2017/24882.9740
27. Ring A, Brand T, Macha S, et al. The sodium glucose cotransporter 2 inhibitor empagliflozin does not prolong QT interval in a thorough QT (TQT) study. Cardiovasc Diabetol. 2013;12(1):70. doi:10.1186/1475-2840-12-70
28. Zhang Y, Post WS, Blasco-Colmenares E, Dalal D, Tomaselli GF, Guallara E. Electrocardiographic QT interval and mortality: a meta-analysis. Epidemiology. 2011;22(5):660–670. doi:10.1097/EDE.0b013e318225768b
29. Siscovick DS, Sotoodehnia N, Rea TD, Raghunathan TE, Jouven X, Lemaitre R. Type 2 diabetes mellitus and the risk of sudden cardiac arrest in the community. Rev Endocr Metab Disord. 2012;11(1):53–59. doi:10.1007/s11154-010-9133-5.Type
30. Carlson GF, Tou CKP, Parikh S, Birmingham BK, Butler K. Evaluation of the effect of dapagliflozin on cardiac repolarization: a thorough QT/QTc study. Diabetes Therapy. 2011;2(3):123–132. doi:10.1007/s13300-011-0003-2
31. Dhingra R, Pencina MJ, Wang TJ, et al. Electrocardiographic QRS duration and the risk of congestive heart failure: the Framingham heart study. Hypertension. 2006;47(5):861–867. doi:10.1161/01.HYP.0000217141.20163.23
32. Nantsupawat T, Wongcharoen W, Chattipakorn SC, Chattipakorn N. Effects of metformin on atrial and ventricular arrhythmias: evidence from cell to patient. Cardiovasc Diabetol. 2020;19(1):198. doi:10.1186/S12933-020-01176-4
33. Okin PM, Devereux RB, Lee ET, Galloway JM, Howard BV. Electrocardiographic repolarization complexity and abnormality predict all-cause and cardiovascular mortality in diabetes: the strong heart study. Diabetes. 2004;53(2):434–440. doi:10.2337/diabetes.53.2.434
34. Solomon SD, Zelenkofske S, Mcmurray JJ, et al. Sudden death in patients with myocardial infarction and left ventricular dysfunction, heart failure, or both. N Engl J Med. 2005;352(25):2581–2588.
35. Sato T, Aizawa Y, Yuasa S, et al. The effect of dapagliflozin treatment on epicardial adipose tissue volume. Cardiovasc Diabetol. 2018;17(1):1–9. doi:10.1186/s12933-017-0658-8
36. Yagi S, Hirata Y, Ise T, et al. Canagliflozin reduces epicardial fat in patients with type 2 diabetes mellitus. Diabetol Metab Syndr. 2017;9(1):1–7. doi:10.1186/s13098-017-0275-4
37. Paneni F, Costantino S, Hamdani N. Regression of left ventricular hypertrophy with SGLT2 inhibitors. Eur Heart J. 2020;41(36):3433–3436. doi:10.1093/eurheartj/ehaa530
38. Oikonomou EK, Antoniades C. The role of adipose tissue in cardiovascular health and disease. Nat Rev Cardiol. 2019;16(2):83–99. doi:10.1038/s41569-018-0097-6
39. Tsimihodimos V, Panagiotopoulou T, Tzavella E, Elisaf M. Clinical pharmacology of sodium glucose cotransporter 2 inhibitors. Hellenic J Atherosc. 2017;8(2):61–72.
40. Daniele G, Xiong J, Solis-Herrera C, et al. Dapagliflozin enhances fat oxidation and ketone production in patients with type 2 diabetes. Diabetes Care. 2016;39(11):2036–2041. doi:10.2337/dc15-2688
41. Ritchie RH, Dale Abel E. Basic mechanisms of diabetic heart disease. Circ Res. 2020;126(11):1501–1525. doi:10.1161/CIRCRESAHA.120.315913
42. Drzewoski J, Kasznicki J, Trojanowski Z. The role of “metabolic memory” in the natural history of diabetes mellitus. Pol Arch Med Wewn. 2009;119(7–8):493–500. doi:10.20452/PAMW.747
43. Testa R, Bonfigli AR, Prattichizzo F, La Sala L, De Nigris V, Ceriello A. The “Metabolic Memory” theory and the early treatment of hyperglycemia in prevention of diabetic complications. Nutrients. 2017;9(5):437. doi:10.3390/nu9050437
44. Jia G, Hill MA, Sowers JR. Diabetic cardiomyopathy: an update of mechanisms contributing to this clinical entity. Circ Res. 2018;122(4):624–638. doi:10.1161/CIRCRESAHA.117.311586
 © 2024 The Author(s). This work is published and licensed by Dove Medical Press Limited. The full terms of this license are available at https://www.dovepress.com/terms.php and incorporate the Creative Commons Attribution - Non Commercial (unported, v3.0) License.
By accessing the work you hereby accept the Terms. Non-commercial uses of the work are permitted without any further permission from Dove Medical Press Limited, provided the work is properly attributed. For permission for commercial use of this work, please see paragraphs 4.2 and 5 of our Terms.
© 2024 The Author(s). This work is published and licensed by Dove Medical Press Limited. The full terms of this license are available at https://www.dovepress.com/terms.php and incorporate the Creative Commons Attribution - Non Commercial (unported, v3.0) License.
By accessing the work you hereby accept the Terms. Non-commercial uses of the work are permitted without any further permission from Dove Medical Press Limited, provided the work is properly attributed. For permission for commercial use of this work, please see paragraphs 4.2 and 5 of our Terms.