")
Back to Journals » Therapeutics and Clinical Risk Management » Volume 14
CYP3A5 genotype-based model to predict tacrolimus dosage in the early postoperative period after living donor liver transplantation
Received 17 August 2018
Accepted for publication 6 October 2018
Published 25 October 2018 Volume 2018:14 Pages 2119—2126
DOI https://doi.org/10.2147/TCRM.S184376
Checked for plagiarism Yes
Review by Single anonymous peer review
Peer reviewer comments 2
Editor who approved publication: Professor Garry Walsh
Eunhee Ji,1,* Myeong Gyu Kim,2,* Jung Mi Oh3
1College of Pharmacy and Research Institute of Pharmaceutical Sciences, Gachon University, Incheon 21936, Republic of Korea; 2Graduate School of Clinical Pharmacy, CHA University, Pocheon 11160, Republic of Korea; 3College of Pharmacy and Research Institute of Pharmaceutical Sciences, Seoul National University, Seoul 08826, Republic of Korea
*These authors contributed equally to this work
Purpose: Liver transplantation is the treatment of choice for patients with end-stage liver disease. Due to the between- and within-individual pharmacokinetic variability in tacrolimus, used to prevent rejection after transplantation, it is difficult to predict the dose needed achieve the target levels in the blood. This study aimed to construct a population pharmacokinetic model of tacrolimus dosage prediction for therapeutic drug monitoring in clinical settings for Korean adult patients receiving living donor liver transplantation (LDLT).
Methods: A total of 58 Korean adult patients receiving LDLT with tacrolimus administration were enrolled. Demographic, clinical, and CYP3A5*1/*3 polymorphism data were collected. Population pharmacokinetic modeling of tacrolimus during the first 14 days after transplantation was performed using NONMEM program. Parameters were estimated by the first-order conditional estimation with interaction method. The internal validation of the final model was assessed by the bootstrap and visual predictive check methods using 500 samples from the original data.
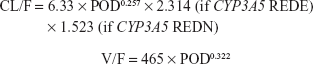
Results: One-compartmental model was selected as a base model. After the stepwise covariate model building process, postoperative day (POD) and combinational CYP3A5 genotype of the recipient and donor were incorporated into clearance (CL/F). The estimated typical values of CL/F and volume of distribution (V/F) were 6.33 L/h and 465 L, respectively. The final model was CL/F =6.33× POD0.257×2.314 (if CYP3A5 expresser recipient grafted from CYP3A5 expresser donor) ×1.523 (if CYP3A5 expresser recipient grafted from CYP3A5 nonexpresser donor) and V/F =465× POD0.322.
Conclusion: A population pharmacokinetic model for tacrolimus was established successfully in Korean adult patients receiving LDLT. This model is expected to contribute to improving patient outcomes by optimizing tacrolimus dose adjustment for liver transplant patients.
Keywords: tacrolimus, dosage prediction, living donor liver transplantation, CYP3A5, population pharmacokinetics, nonlinear mixed-effects modeling
Introduction
Liver transplantation is the treatment of choice for patients with end-stage liver disease. In 2016, a total of 1,473 liver transplantations were performed in Korea, with 508 from cadaveric donors and 965 from living donors.1 Five-year patient survival rates were 70.43% from cadaveric donors and 80.41% from living donors. Eleven-year survival rates were 64.21% and 74.25%, respectively.1 In 2014–2015, ~12% of the adult liver transplantation recipients experienced acute rejection in the first posttransplant year in the United States.2 In Korea, 32.8% of de novo adult recipients of living donor liver transplantation (LDLT) experienced acute cellular rejection within the first 4 weeks after transplantation.3 Rejection of a transplanted organ can take place at any time following surgery, and is one of the primary causes for the failure of the newly transplanted liver to function.4
Immunosuppressive agents are used to prevent rejection after organ transplantation, and calcineurin inhibitors are the principal choice, prescribed to nearly 97% of liver transplanted patients discharged from the hospital.5 Among calcineurin inhibitors, tacrolimus is the drug of choice in almost 90% of liver transplantation patients and results in better long-term graft and patient survival than cyclosporine.5 Tacrolimus has a narrow therapeutic window and displays significant between- and within-individual variability in pharmacokinetics, particularly during the early posttransplant period.6,7 A number of factors have been reported to influence the pharmacokinetics of tacrolimus, including time after transplant, patient demographics, comorbidities, concomitant medications, graft type, hepatic function, donor liver characteristics, food administration, diarrhea, hematocrit, and the patient and donor genotypes associated with metabolic enzyme and protein transporter expression.8 Among the potential causes for large variability, recent pharmacogenetic studies have implicated the genetic association between the CYP/CYP450 (CYP) 3A5 (CYP3A5) genotype and tacrolimus pharmacokinetics. Solid-organ recipients with at least one wild-type allele CYP3A5*1 achieved lower tacrolimus blood concentration and required higher doses to reach the same concentrations in the blood than the recipients with homozygous CYP3A5*3 allele.8 Tacrolimus is metabolized by both intestinal and hepatic CYP3A5 enzymes. In our previous study, we found that the combination CYP3A5 genotype of both the recipient’s native intestine and the donor’s liver allograft was the most important factor affecting tacrolimus dose-adjusted concentration in the patients receiving LDLT.3
To overcome the large pharmacokinetic variability and to optimize the efficacy and minimize the toxicity, therapeutic drug monitoring (TDM) of tacrolimus is widely performed.9 An established association between tacrolimus exposure and its efficacy in many groups provides strong rationale to support TDM.10 The whole blood trough concentrations (Ctrough) are used in most transplant centers for the monitoring and adjustment of the tacrolimus dosage. To optimize the tacrolimus dosage, a number of population models and Bayesian forecasting methods have been developed.11 It is well known that genetic polymorphism differs between ethnicities, and there are differences in therapeutic outcomes after transplantation depending on whether the graft is from a cadaveric donor or living donor. Therefore, a dose prediction model considering ethnicity, donor type, and age is needed. There is a report on the population pharmacokinetic analysis of Korean adult liver transplant patients; however, in the study, the grafts from cadaveric donors and living donors were mixed and CYP3A5 genotype was not considered.12 Therefore, the aim of the present study was to construct a population pharmacokinetic model of tacrolimus dosage prediction for TDM in clinical settings for Korean adult patients receiving LDLT that reflects the recent pharmacogenetic research.
Materials and methods
Patients and data
Fifty-eight Korean adult patients from our previous study3 were included in the present study. Patients received de novo LDLT and were on a triple- or double-drug regimen, including tacrolimus and corticosteroids, with or without mycophenolate mofetil. The study protocol was approved by the Institutional Review Board (C-0505-148-005) of Seoul National University Hospital, Korea. All procedures were performed in accordance with the recommendations of the Declaration of Helsinki on Biomedical Research Involving Human Subjects, as well as the International Conference on the Harmonization of the Technical Requirements for the Registration of Pharmaceuticals for Human Use – Good Clinical Practice guidelines. All participants provided written informed consent before enrollment in the study.
Tacrolimus (Astellas Ireland Co., Ltd., Prograf®, Dublin, Ireland) was administered twice daily at 10:00 and 22:00 on an empty stomach starting on postoperational day (POD) 1. The doses were adjusted based on the measured blood concentration in order to achieve target Ctrough of 8–13 ng/mL for the triple regimen and 13–17 ng/mL for the double regimen until POD 14. For routine TDM of tacrolimus, blood samples were collected daily at around 09:00 in the morning, beginning the day after the first dose and continuing until the day of discharge. The trough concentrations were measured after surgery for 14 days starting from the first day of tacrolimus administration and used for modeling. Whole blood tacrolimus concentrations were determined by enzyme immunoassay.
The presence of the CYP3A5*3 allele (6986A>G, rs.776746) was identified by mismatch PCR-restriction fragment length polymorphism analysis using peripheral whole blood samples from graft recipients and corresponding donors, as described previously.13 The observed CYP3A5 genotype frequency distributions for the recipients and donors were consistent with the Hardy–Weinberg equilibrium (all P>0.05). People with at least one wild-type allele, CYP3A5*1, were defined as CYP3A5 expressers, whereas those with the homozygous CYP3A5*3 allele were considered CYP3A5 nonexpressers. Patients were categorized into four groups according to the CYP3A5 genotypes of the recipient and donor: CYP3A5 expresser recipient grafted from CYP3A5 expresser donor (REDE, n=10); CYP3A5 expresser recipient grafted from CYP3A5 nonexpresser donor (REDN, n=13); CYP3A5 nonexpresser recipient grafted from CYP3A5 expresser donor (RNDE, n=8); and CYP3A5 nonexpresser recipient grafted from CYP3A5 nonexpresser donor (RNDN, n=27).
Modeling method
A population pharmacokinetic model was built using the NONMEM version 7.4 (ICON plc, Dublin, Ireland) and Perl-speaks-NONMEM (PsN) programs. As a base model, the one-compartmental model was selected by comparing the one-compartmental model and two-compartmental model according to the Akaike information criterion. Pharmacokinetic parameters of clearance (CL/F) and volume of distribution (V/F) were estimated. Because the measured concentrations were Ctrough, it was difficult to estimate the absorption phase. Thus, the absorption rate constant (ka) was fixed at a value of 4.48 h−1 based on previously published reports.14,15 The interindividual variability (IIV) of CL/F and V/F was estimated by the exponential model, and the residual error was estimated by the combined proportional and additive model.
Candidate covariates such as age, sex, graft-to-recipient body weight ratio, hematocrit, total bilirubin, alanine aminotransferase (ALT), albumin, body weight, POD, and CYP3A5 groups were evaluated by adding each covariate into the model. Continuous variables were evaluated with the power-function model and categorical variables were evaluated with the exponential model. This step was processed as a stepwise covariate modeling with forward selection and backward elimination. The criteria for selecting a covariate were the objective function value (OFV) of 3.84 (P<0.05) for forward selection and OFV of 6.63 (P<0.01) for backward elimination. The forward selection started from the base model with no covariates, and covariates were included in the model if the OFV decreased by more than 3.84 (P<0.05) after inclusion of the covariates. The backward elimination started from the full model that included all covariates selected in the forward selection. To make a strict model, covariates were removed if OFV did not increase by more than 6.63 (P<0.01) after elimination of the covariates.
Parameters were estimated by the first-order conditional estimation with interaction method. The internal validation of the final model was assessed by the bootstrap and the visual predictive check methods using 500 samples from the original data.
Dosage suggestion
The dose required to reach the target Ctrough in multiple oral dosing can be calculated using the formula below:
|

where k is an elimination rate constant that equals CL/F divided by V/F and τ is the dosing interval that equals 12 hours. Using CL/F, V/F, and ka values derived from the model, the tacrolimus doses required to achieve the target concentrations of 10 or 15 ng/mL in the blood were calculated from POD 1 to 14.
Results
Patients
The written and electronic medical records of each subject were reviewed for the approximation of tacrolimus dose. The data regarding body weight, tacrolimus blood concentrations, and matching laboratory test results including hematocrit, albumin, total bilirubin, and ALT were obtained. The characteristics of the study population for 14 days after transplantation are shown in Table 1. Total number of blood samples was 605, and the average of 10 tacrolimus concentrations in the blood for each patient were available for modeling.
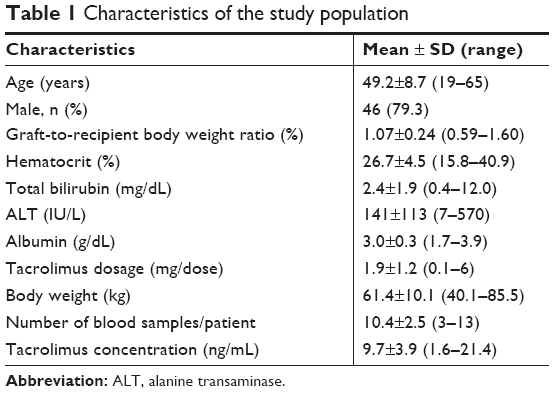 | Table 1 Characteristics of the study population |
Population modeling
The estimated typical values of CL/F and V/F were 6.33 L/h and 465 L, respectively. In the final model, the CL/F included POD and CYP3A5 group as covariates and the V/F included POD as covariate. CYP3A5 REDE and REDN had significantly increased CL/F compared with CYP3A5 RNDE and RNDN (Figure 1A). The parameters for CYP3A5 RNDE and RNDN were merged because the estimated parameter values of REDE and REDN were similar, and the combination of the two parameters had a lower value of Akaike information criterion than not combining. Furthermore, CL/F and V/F increased as POD increased (Figures 1B and 2). Other variables were not included in the final model.
 | Figure 1 Estimated clearance according to the CYP3A5 genotypes of the recipient and donor. |
 | Figure 2 Estimated volume of distribution from day 1 to 14. |
With covariates included, IIV values of CL/F and V/F were reduced from 45.1% and 56.4% in the base model to 34.2% and 45.5% in the final model, respectively. The estimated parameters are shown in Table 2, and the following model was identified as the final model:
|
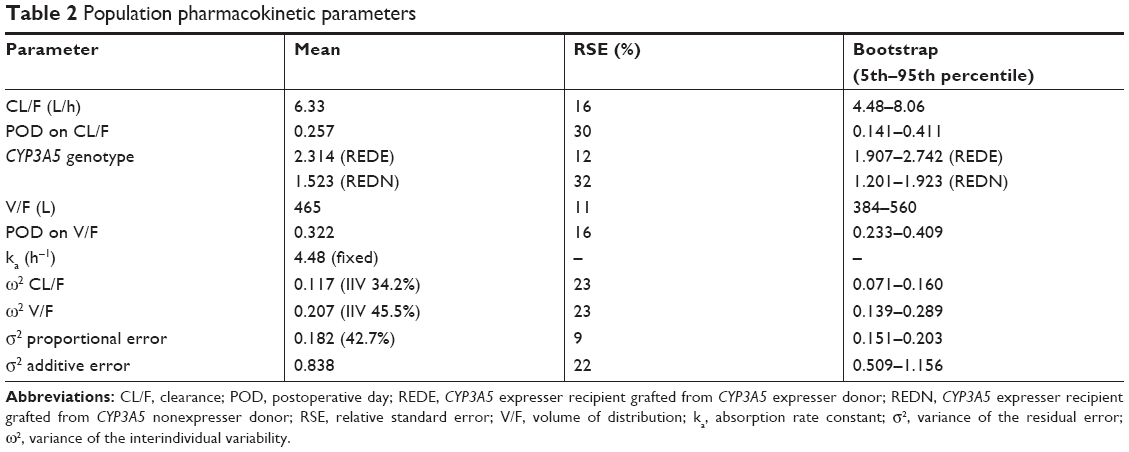 | Table 2 Population pharmacokinetic parameters |
The diagnostic plots of the final model are shown in Figure 3. The individual predictive values in the final model fit better at the actual observed concentrations than those in the base model. A strong correlation in the plots suggested that the resulting model fits the observed data in the patients. The conditional-weighted residuals were symmetrically distributed within three units, indicating fewer residuals.
 | Figure 3 Goodness-of-fit plot. |
Model validation
The results of the bootstrap analysis are described in Table 2. The estimates of each value calculated by NONMEM are between the 5th percentile and 95th percentile of bootstrap runs. The visual predictive check results also show that the median, 5%, and 95% values of the observed concentrations exist between the 95% CIs of each estimated value (Figure 4).
 | Figure 4 Visual predictive check plot. |
Dosage suggestion
The estimated CL/F and V/F values and the effects of POD and CYP3A5 group were used to provide dosage suggestion to achieve a tacrolimus target concentration of 10 ng/mL for the dual regimen or 15 ng/mL for the triple regimen from POD 1 to 14 (Table 3). The required doses to meet the target concentration increased with increase in time after transplantation.
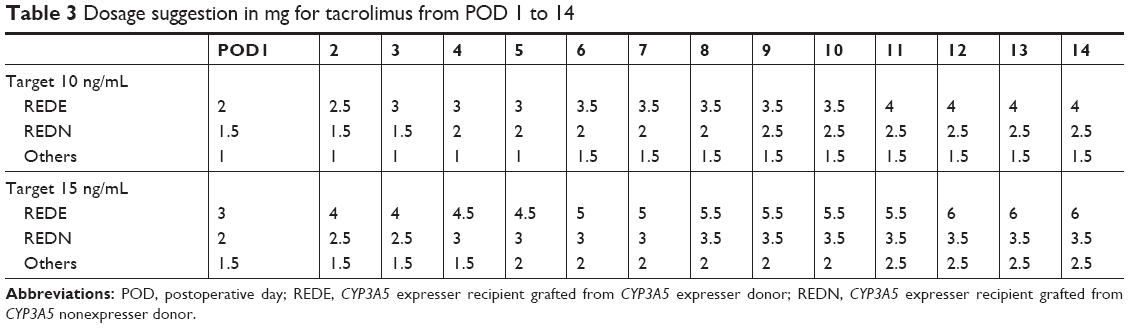 | Table 3 Dosage suggestion in mg for tacrolimus from POD 1 to 14 |
Discussion
After the first liver transplant in 1968, the survival rates of the patients and the graft improved significantly as a result of the introduction of new immunosuppressive agents and preservation solutions, the improvements in surgical techniques, and the early diagnosis and management of complications after transplantation.16 While the demand for transplantation continues to grow, the number of cadaveric donors has remained relatively stable during the past decade.1,5 In the United States, over 15,000 people awaited a liver in 2014, and the median wait time for a liver is ~1 year; more than 8,000 people on the transplantation waiting lists died in 2012.2 In Korea, over 5,000 people were on the waiting list for a liver transplant in 2017, and the average waiting time was 176 days.1 The waiting time in Korea is much shorter than in the United States due to higher transplantation rates from living donors. Transplantation from living donors reduces waiting time and increases the half-life of the graft compared to that from deceased donors.2 Liver transplantations from living donors and cadaveric donors have different pathological progression and outcomes; therefore, separate studies should be conducted on these processes. To the best of our knowledge, this is the first study to perform the population pharmacokinetic analysis of tacrolimus for Korean adult patients receiving liver transplants from living donors.
Graft rejection proceeds in the following sequence: recognition of the donor’s histocompatibility differences by the recipient’s immune system via MHC class I and II antigens, recruitment of the activated lymphocytes, initiation of immune effector mechanisms, and graft destruction.17 Immediately following transplantation, hyperacute and acute rejections are frequently observed. Therefore, high doses of immunosuppressants are required during the early phase after transplantation. Unfortunately, this induces a high risk of toxicity. The early phase is a clinically important period, as liver function does not becomes stable until 2 weeks after LDLT,18 and the trend in changes in the dose-adjusted concentration with time is observed at ~1 month posttransplantation, depending on the recovery of the grafted liver.3 According to the institutional protocol, patients are discharged 2 weeks after transplantation, if there are no undue complications. Thus, the patients are in the most unstable physiological condition during the hospitalization period and are at a high risk of rejection and drug toxicity. Since a high dose of tacrolimus is required to prevent rejection, the modeling of tacrolimus dose prediction during the first 14 days after LDLT was performed in this study.
Following oral administration, tacrolimus is extensively processed in the liver and intestines, being predominantly metabolized by CYP3A4 and CYP3A5 isoenzymes and transported by the efflux pump P-glycoprotein (encoded by the ABCB1 gene).7 Excretion of tacrolimus metabolites is mainly via the biliary route (>95%), with renal clearance accounting for only 2.4% of elimination, on average.7 These pharmacokinetic characteristics of tacrolimus represent variability between individuals or within individuals. Population pharmacokinetic models provide information on typical pharmacokinetic parameter values and variability associated with these values within the population, as well as how specific patient covariates (eg, age, weight, and genotype) influence the pharmacokinetics of a drug.11 In this study, the population mean of CL/F was estimated as 6.33 L/h with IIV of 34.2% and V/F was estimated as 465 L with IIV of 45.5% (Table 2). These results are in agreement with previous studies; after covariate inclusion, the remaining IIV in CL/F ranged from 31.2% to 59.9% in Chinese,15,19,20 Japanese,21 and Korean populations.12
Among the covariates investigated, the POD and combinational CYP3A5 genotype groups were included in the final model. For LDLT, the physiologic recovery of liver allograft should be different from a full sized liver transplantation because only a partial liver is transplanted.22 That is, in LDLT, the systemic clearance of tacrolimus by the partial graft liver will gradually increase with postoperative time as the grafted liver regenerates its mass. POD was included as a significant covariate in other studies as well.12,15,18,20,21,23–27
As reported in our previous study, the recipient and donor’s combinational CYP3A5 genotype has the greatest effect on the variability of tacrolimus (Figure 1). Different results were obtained when only the recipient’s CYP3A5 genotype, but not the donor’s, was considered; one study accepted the recipient’s CYP3A5 genotype as a significant covariate,15 whereas another did not.20 Neither study specified the donor type, but the pharmacokinetics following liver transplantation differs depending on whether the donor was a living or cadaveric donor. In addition, it is also important to consider whether a whole or partial graft was transplanted from a cadaveric donor. Further, the trend in changes with time was not considered in both studies. This is important because the recipient’s CYP3A5 genotype has a greater influence than the donor’s CYP3A5 genotype during the early period after transplantation and vice versa over time. Li et al19 reported that the donor’s CYP3A5 genotype, but not the recipient’s, exhibited a genetic effect on tacrolimus pharmacokinetics, which can be explained by the study population of full liver transplant patients. In a model for Japanese adult patients receiving LDLT, the recipient’s CYP3A5 genotype was concluded to be a significant covariate, while the donor’s was excluded during the backward elimination process.21 They created two separate variables, namely the recipient’s CYP3A5 genotype and the donor’s CYP3A5 genotype; but it did not treat the combinational genotype of the recipient and donor as one variable. However, a recent study supported our result on the combinational genotype of recipient and donor, where they reported that REDN, RNDE, and REDE showed higher clearances compared to RNDN.28
Conclusion
Tacrolimus dosage suggestion according to POD and CYP3A5 genotypes for LDLT during 2 weeks after transplant is shown in Table 3. This is believed to be helpful in the tacrolimus dosage adjustment during the routine TDM process. It is most often the pharmacists who are involved in the TDM. In the US, more than 65% of the centers for transplantation have a pharmacist on their teams, and over 250 pharmacists were members of the American College of Clinical Pharmacy’s Transplant Interest Group in 2009.29 In addition, the Centers for Medicare and Medicaid Services regulations require that the transplant programs have a multidisciplinary team including individuals with experience in pharmacology. While the regulations do not specifically state that each center must have a pharmacist, a pharmacist could provide the desired expertise in transplant pharmacotherapy as the regulations mandate.30 In Korea, the Korean society of health-system pharmacists has provided a specialty pharmacist program since 2010, which includes a specialty in organ transplantation; a total of 25 specialists completed this program in 2014.31 This study would help such pharmacists gain the relevant expertise.
Acknowledgment
This study was supported by the grant from Korea Food & Drug Administration (06132KFDA412) and the Gachon Institute of Pharmaceutical Science Research Fund 2013.
Author contributions
All authors contributed toward data analysis, drafting and revising the paper, and agreed to be accountable for all aspects of the work.
Disclosure
The authors report no conflicts of interest in this work.
References
Korean Network for Organ Sharing (KONOS). 2016 Annals of Transplantation Statistics. Seoul, Korea: Korean Network for Organ Sharing, Korea Centers for Disease Control & Prevention; 2017. | ||
Kim WR, Lake JR, Smith JM, et al. OPTN/SRTR 2016 Annual Data Report: Liver. Am J Transplant. 2018;18(Suppl 1):172–253. | ||
Ji E, Choi L, Suh KS, Cho JY, Han N, Oh JM. Combinational effect of intestinal and hepatic CYP3A5 genotypes on tacrolimus pharmacokinetics in recipients of living donor liver transplantation. Transplantation. 2012;94(8):866–872. | ||
Lucey MR, Terrault N, Ojo L, et al. Long-term management of the successful adult liver transplant: 2012 practice guideline by the American Association for the Study of Liver Diseases and the American Society of Transplantation. Liver Transpl. 2013;19(1):3–26. | ||
European Association for the Study of the Liver. EASL Clinical Practice Guidelines: Liver transplantation. J Hepatol. 2016;64(2):433–485. | ||
Shuker N, van Gelder T, Hesselink DA. Intra-patient variability in tacrolimus exposure: causes, consequences for clinical management. Transplant Rev. 2015;29(2):78–84. | ||
Staatz CE, Tett SE. Clinical pharmacokinetics and pharmacodynamics of tacrolimus in solid organ transplantation. Clin Pharmacokinet. 2004;43(10):623–653. | ||
Scott LJ, Mckeage K, Keam SJ, Plosker GL. Tacrolimus: a further update of its use in the management of organ transplantation. Drugs. 2003;63(12):1247–1297. | ||
Jusko WJ, Thomson AW, Fung J, et al. Consensus document: therapeutic monitoring of tacrolimus (FK-506). Ther Drug Monit. 1995;17(6):606–614. | ||
Wallemacq P, Armstrong VW, Brunet M, et al. Opportunities to optimize tacrolimus therapy in solid organ transplantation: report of the European consensus conference. Ther Drug Monit. 2009;31(2):139–152. | ||
Brooks E, Tett SE, Isbel NM, Staatz CE. Population Pharmacokinetic Modelling and Bayesian Estimation of Tacrolimus Exposure: Is this Clinically Useful for Dosage Prediction Yet? Clin Pharmacokinet. 2016;55(11):1295–1335. | ||
Lee JY, Hahn HJ, Son IJ, et al. Factors affecting the apparent clearance of tacrolimus in Korean adult liver transplant recipients. Pharmacotherapy. 2006;26(8):1069–1077. | ||
Yu KS, Cho JY, Jang IJ, et al. Effect of the CYP3A5 genotype on the pharmacokinetics of intravenous midazolam during inhibited and induced metabolic states. Clin Pharmacol Ther. 2004;76(2):104–112. | ||
Yang JW, Liao SS, Zhu LQ, et al. Population pharmacokinetic analysis of tacrolimus early after Chinese pediatric liver transplantation. Int J Clin Pharmacol Ther. 2015;53(1):75–83. | ||
Zhu L, Yang J, Zhang Y, Jing Y, Zhang Y, Li G. Effects of CYP3A5 genotypes, ABCB1 C3435T and G2677T/A polymorphism on pharmacokinetics of Tacrolimus in Chinese adult liver transplant patients. Xenobiotica. 2015;45(9):840–846. | ||
Dutkowski P, de Rougemont O, Müllhaupt B, Clavien PA. Current and future trends in liver transplantation in Europe. Gastroenterology. 2010;138(3):e804:802–809. | ||
Ingulli E. Mechanism of cellular rejection in transplantation. Pediatr Nephrol. 2010;25(1):61–74. | ||
Fukudo M, Yano I, Fukatsu S, et al. Forecasting of blood tacrolimus concentrations based on the Bayesian method in adult patients receiving living-donor liver transplantation. Clin Pharmacokinet. 2003;42(13):1161–1178. | ||
Li D, Lu W, Zhu JY, Gao J, Lou YQ, Zhang GL. Population pharmacokinetics of tacrolimus and CYP3A5, MDR1 and IL-10 polymorphisms in adult liver transplant patients. J Clin Pharm Ther. 2007;32(5):505–515. | ||
Chen B, Shi HQ, Liu XX, et al. Population pharmacokinetics and Bayesian estimation of tacrolimus exposure in Chinese liver transplant patients. J Clin Pharm Ther. 2017;42(6):679–688. | ||
Fukudo M, Yano I, Yoshimura A, et al. Impact of MDR1 and CYP3A5 on the oral clearance of tacrolimus and tacrolimus-related renal dysfunction in adult living-donor liver transplant patients. Pharmacogenet Genomics. 2008;18(5):413–423. | ||
Schiano TD, Kim-Schluger L, Gondolesi G, Miller CM. Adult living donor liver transplantation: the hepatologist’s perspective. Hepatology. 2001;33(1):3–9. | ||
Antignac M, Hulot JS, Boleslawski E, et al. Population pharmacokinetics of tacrolimus in full liver transplant patients: modelling of the post-operative clearance. Eur J Clin Pharmacol. 2005;61(5–6):409–416. | ||
Fukatsu S, Yano I, Igarashi T, et al. Population pharmacokinetics of tacrolimus in adult recipients receiving living-donor liver transplantation. Eur J Clin Pharmacol. 2001;57(6–7):479–484. | ||
Macchi-Andanson M, Charpiat B, Jelliffe RW, Ducerf C, Fourcade N, Baulieux J. Failure of traditional trough levels to predict tacrolimus concentrations. Ther Drug Monit. 2001;23(2):129–133. | ||
Oteo I, Lukas JC, Leal N, et al. Tacrolimus pharmacokinetics in the early post-liver transplantation period and clinical applicability via Bayesian prediction. Eur J Clin Pharmacol. 2013;69(1):65–74. | ||
Valdivieso N, Oteo I, Valdivieso A, et al. Tacrolimus dose individualization in “de novo” patients after 10 years of experience in liver transplantation: pharmacokinetic considerations and patient pathophysiology. Int J Clin Pharmacol Ther. 2013;51(7):606–614. | ||
Moes DJ, van der Bent SA, Swen JJ, et al. Population pharmacokinetics and pharmacogenetics of once daily tacrolimus formulation in stable liver transplant recipients. Eur J Clin Pharmacol. 2016;72(2):163–174. | ||
Alloway RR, Dupuis R, Gabardi S, et al. Evolution of the role of the transplant pharmacist on the multidisciplinary transplant team. Am J Transplant. 2011;11(8):1576–1583. | ||
Organ Procurement and Transplantation Network and Scientific Registry of Transplant Recipients. OPTN/SRTR 2012 Annual Data Report. Rockville, MD: Department of Health and Human Services, Health Resources and Services Administration, Healthcare Systems Bureau, Division of Transplantation; 2014. | ||
Korean Society of Health-System Pharmacists (KSHP). Guide For Pharmacy Specialists. Seoul, Korea: Korean Society of Health-System Pharmacists; 2015. |
 © 2018 The Author(s). This work is published and licensed by Dove Medical Press Limited. The full terms of this license are available at https://www.dovepress.com/terms.php and incorporate the Creative Commons Attribution - Non Commercial (unported, v3.0) License.
By accessing the work you hereby accept the Terms. Non-commercial uses of the work are permitted without any further permission from Dove Medical Press Limited, provided the work is properly attributed. For permission for commercial use of this work, please see paragraphs 4.2 and 5 of our Terms.
© 2018 The Author(s). This work is published and licensed by Dove Medical Press Limited. The full terms of this license are available at https://www.dovepress.com/terms.php and incorporate the Creative Commons Attribution - Non Commercial (unported, v3.0) License.
By accessing the work you hereby accept the Terms. Non-commercial uses of the work are permitted without any further permission from Dove Medical Press Limited, provided the work is properly attributed. For permission for commercial use of this work, please see paragraphs 4.2 and 5 of our Terms.