")
Back to Journals » Diabetes, Metabolic Syndrome and Obesity » Volume 17
Correlation Between Thyroid-Related Hormones and Diabetic Retinopathy in Type 2 Diabetes Mellitus Patients with Normal Thyroid Function: A Retrospective Study
Authors Xiao M, Luo G , Zhang Z, Liu Y, Gong R, Ke J
Received 19 January 2024
Accepted for publication 19 March 2024
Published 26 March 2024 Volume 2024:17 Pages 1481—1490
DOI https://doi.org/10.2147/DMSO.S455428
Checked for plagiarism Yes
Review by Single anonymous peer review
Peer reviewer comments 2
Editor who approved publication: Prof. Dr. Juei-Tang Cheng
Mei Xiao,1 Guangwen Luo,1 Zhaowei Zhang,1 Yanfen Liu,2 Rui Gong,3 Jianghuan Ke1
1Department of Pharmacy, Affiliated Jinhua Hospital, Zhejiang University School of Medicine, Jinhua, 321000, People’s Republic of China; 2Department of Endocrinology and Metabolism, Affiliated Jinhua Hospital, Zhejiang University School of Medicine, Jinhua, 321000, People’s Republic of China; 3Department of Clinical Laboratory, Affiliated Jinhua Hospital, Zhejiang University School of Medicine, Jinhua, 321000, People’s Republic of China
Correspondence: Guangwen Luo, Department of pharmacy, Affiliated Jinhua Hospital, Zhejiang University School of Medicine, Jinhua, Zhejiang, 321000, People’s Republic of China, Tel +86-0579-82552760, Email [email protected]
Purpose: To investigate the correlation between thyroid-related hormones and diabetic retinopathy (DR) in euthyroid patients with type 2 diabetes mellitus (T2DM).
Patients and Methods: Patients with T2DM admitted to our hospital between January 2023 and June 2023 were retrospectively analyzed. The patients were divided into DR and non-diabetic retinopathy (NDR) groups according to whether DR occurred. Thyroid function-related hormones (TSH, FT3, and FT4), blood glucose indices (FBG and HbA1c), and blood lipid indices (HDL-C, LDL-C, TC, and TG) of the two groups were analyzed by univariate and multivariate logistic regression to explore the risk factors for DR. Pearson correlation analysis and multiple stepwise regression analysis were used to investigate the correlation of TSH or FT3 with FBG, HbA1c, and TG in DR patients.
Results: Of the 286 patients with T2DM included in this study, 101 (35.31%) developed DR and 185 (64.69%) did not. High TG, FBG, HbA1c, and TSH and low FT3 levels were independent risk factors for DR in T2DM patients. TSH positively correlated with TG, whereas FT3 negatively correlated with TG and HbA1c in T2DM patients with DR.
Conclusion: Higher TSH and lower FT3 in T2DM patients with normal thyroid function may affect glucose and lipid metabolism, thereby increasing the risk of DR.
Keywords: type 2 diabetes mellitus, diabetic retinopathy, thyroid-stimulating hormone, free triiodothyronine, glucose and lipid metabolism
Introduction
Type 2 diabetes mellitus (T2DM), the most common metabolic disease, is characterized by abnormally high blood glucose levels and is often accompanied by disorders of glucose and lipid metabolism.1 With the development of the disease, T2DM can cause chronic progressive lesions in many tissues and organs, such as eyes, kidneys, nerves, heart, and blood vessels, and eventually lead to their functional decline and even failure. Diabetic retinopathy (DR) is a common microvascular complication of T2DM. DR can be classified into proliferative diabetic retinopathy (PDR) and non-proliferative diabetic retinopathy (NPDR). DR is the primary cause of visual impairment in middle-aged and elderly people.2 A meta-analysis of 22,896 diabetic patients from 35 studies worldwide showed that the prevalence of DR was 34.6%.3 DR seriously threatens the life quality of patients with diabetes and places a heavy economic burden on society. Patients with DR exhibit no obvious symptoms during the early stages of the disease. However, with continuous disease progression, blurred vision, decreased vision, and even blindness can occur.4 Therefore, it is of great significance to actively explore relevant indicators to predict the risk of visual impairment in T2DM patients for the evaluation of patient condition and the formulation of treatment plans.
Although the pathogenesis and etiology of DR have not been fully clarified, a long duration of diabetes, poor control of blood sugar, hypertension, hyperlipidemia, obesity, and genetics are considered risk factors for DR.5,6 However, some individuals with well-controlled blood sugar levels and no hypertension also develop severe DR, indicating that other risk factors also contribute to the occurrence of DR.7 The role of thyroid hormones (THs) in diabetic microangiopathy has recently attracted increasing attention. Several studies have confirmed that THs metabolism plays a key role in retinal development and increases retinal blood vessel density.8,9 It was found that low FT3 level was positively correlated with the risk of diabetic nephropathy in patients with type 2 diabetes or type 1 diabetes with normal thyroid function.10,11 In addition, high thyroid-stimulating hormone (TSH) levels have been shown to be an independent risk factor for DR.12 Subclinical hypothyroidism is closely associated with a high incidence of DR.13 It was reported that the fluctuation of thyroid hormone level significantly affected glucose and lipid metabolism in T2DM patients.14 However, few studies have investigated the relationship between thyroid-related hormone levels and glycolipid metabolism in patients with DR. Therefore, this study aimed to investigate the levels of thyroid-related hormones and glycolipid metabolism in DR patients with normal thyroid function and to analyze the potential correlation between thyroid-related hormones and DR.
Materials and Methods
Patient Selection
Patients with T2DM admitted to our hospital between January 2023 and June 2023 were retrospectively analyzed. The inclusion criteria were in accordance with the diagnostic criteria of T2DM: having a history of T2DM, or fasting blood glucose (FPG) level ≥ 7.0 mmol/L or postprandial blood glucose ≥ 11.1 mmol/L or glycosylated hemoglobin (HbA1c) ≥ 7.0%.15 The exclusion criteria were as follows: (1) abnormal thyroid function or thyroid malignant diseases; (2) acute complications of diabetes mellitus; (3) previous history of hypothalamic or pituitary diseases; (4) malignant tumors; (5) acute infection state; (6) using lipid-regulating drugs or drugs affecting blood lipids in the near future; (7) taking drugs that may affect thyroid function, such as iodine, glucocorticoids, and amiodarone; and (8) incomplete clinical data, such as personal history, relevant examinations, and medication records. Based on the occurrence of DR, patients were divided into DR group and non-diabetic retinopathy (NDR) group. Diabetic retinopathy was screened by professional ophthalmologists using non-mydriatic fundus photography. This study was approved by the Ethics Committee of Affiliated Jinhua Hospital, Zhejiang University School of Medicine. The requirement for informed consent was waived due to the retrospective nature of this study. The Declaration of Helsinki was strictly followed, and all patients’ data were kept confidential.
Data Collection
Demographic and clinical data including age, sex, height, weight, diabetes duration, hypertension history, coronary heart disease history, smoking status, and drinking status were collected from the Haitai Electronic Medical Record System. Body mass index (BMI) was calculated by dividing weight by the square of height (kg/m2). The blood biochemical indexes of all patients are also obtained from this system, including high-density lipoprotein cholesterol (HDL-C), low-density lipoprotein cholesterol (LDL-C), total cholesterol (TC), triglyceride (TG), FBG, HbA1c, TSH, free triiodothyronine (FT3), and free thyroxine (FT4). Venous blood was collected from all patients with an empty stomach for more than 12 h for clinical analysis on the day after admission. Blood sugar and lipid levels were measured using an automatic biochemical analyzer. HPLC was used to determine HbA1c levels. FT3, FT4, and TSH levels were detected using an electrochemiluminescence immunoassay.
Statistical Analysis
Data were analyzed using SPSS 23.0. The measurement data conforming to the normal distribution are expressed by  , and the comparison between groups is made by independent sample t-test or one-way ANOVA test. The LSD test was used for post-event pairwise comparisons. Measurement data that did not conform to the normal distribution are represented by M (P25–P75), and the Mann–Whitney U-test was used for comparison between groups. The counting data were expressed as [n (%)], and the comparison between groups was performed using χ2 test. Univariate and multivariate logistic regression analyses were used to explore risk factors for DR in T2DM patients. Pearson correlation analysis and multiple stepwise regression analysis were conducted to explore the correlation between TSH or FT3 and FBG, HbA1c, or TG levels in patients with DR. All tests were two-tailed, and a P value <0.05 was considered statistically significant.
Results
Clinical Characteristics of Included Patients
A total of 286 patients with T2DM were included in this study, with 101 and 185 patients in the DR and NDR groups, respectively (Figure 1). The average age of DR group was (62.52±11.89) years, and the average BMI was (21.51±3.73) kg/m2, including 68 males and 33 females. The average age of NDR group was (58.98±12.05) years, and the average BMI was (21.22±3.98) kg/m,2 including 110 males and 75 females. There were no significant differences in sex, BMI,coronary heart disease history, drinking history, or smoking history between the two groups (P > 0.05) (Table 1). However, age, diabetes duration, and the proportion of hypertensive patients were higher in the DR group than in the NDR group.
 |
Table 1 Clinical Characteristics of Included Patients |
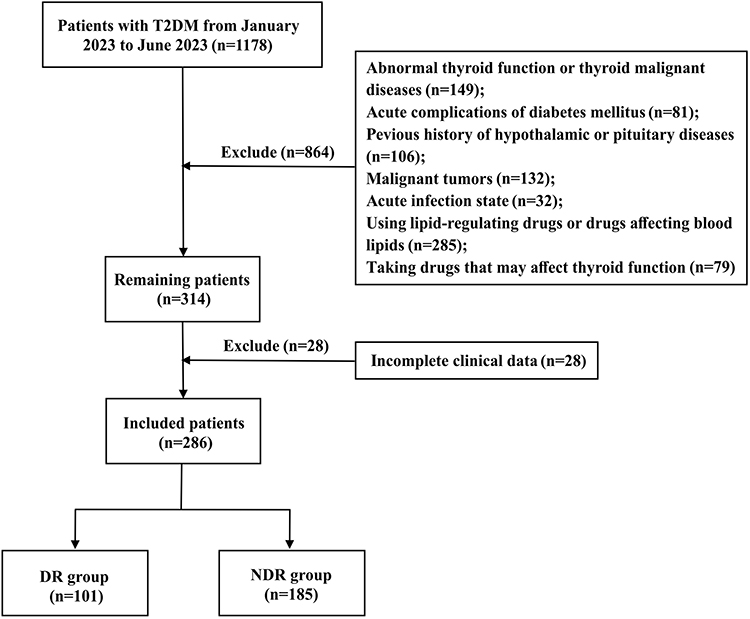 |
Figure 1 Flow chart of case screening. Abbreviations: T2DM, type 2 diabetes mellitus; DR, diabetic retinopathy; NDR, non-diabetic retinopathy. |
Comparison of Thyroid-Related Hormones, Blood Sugar and Blood Lipid
Compared with NDR group, LDL-C, TG, FBG, HbA1c, and TSH levels were higher in the DR group (P < 0.05), while FT3 level was lower (P < 0.05) (Table 2). HDL-C, TC, and FT4 levels were not significantly different between the two groups (P > 0.05).
 |
Table 2 Comparison of Thyroid-Related Hormones, Blood Sugar and Blood Lipid Levels |
Logistics Regression Analysis for Risk Factors of DR
Univariate and multivariate logistic regression analyses revealed that TG, FBG, HbA1c, TSH, and FT3 levels were risk factors for DR (P < 0.05) (Table 3). TG, FBG, HbA1c, and TSH levels in patients with T2DM were positively correlated with the risk of DR, with TSH being the risk factor with the strongest correlation (OR = 1.493, 95% CI 1.142–1.951, P = 0.003) among these risk factors. However, FT3 levels were negatively correlated with DR risk (OR = 0.752, 95% CI 0.582–0.972, P = 0.030).
 |
Table 3 Logistics Regression Analysis for the Risk Factors of Diabetic Retinopathy |
Comparison of FBG, HbA1c or TG at Different TSH Levels in DR Patients
According to the TSH concentration, the T2DM patients with DR divided into low-level group (≤2 mIU/L), middle-level group (2 mIU/L ~ 3.5 mIU/L) and high-level group (≥3.5 mIU/L). The differences in TG levels among the three groups were statistically significant (P < 0.05). With an increase in TSH levels, TG levels gradually increased. HbA1c levels in the high TSH-level group were significantly higher than those in the low and middle TSH-level group (P < 0.05). There were no significant differences in the FBG levels among the three groups (Figure 2).
 |
Figure 2 Comparison of FBG, HbA1c or TG at different TSH levels in diabetic retinopathy patients. *P < 0.05, **P < 0.01. Abbreviations: TG, triglycerides; FBG, fasting blood glucose; HbA1c, glycated hemoglobin; TSH, thyroid stimulating hormone. |
Comparison of FBG, HbA1c or TG at Different FT3 Levels in DR Patients
Similarly, based on FT3 level, the T2DM patients with DR were divided into low-level group (≤4.5 pmol/L), middle-level group (4.5 pmol/L ~ 6 pmol/L) and high-level group (≥6 pmol/L). The differences in TG levels among the three groups were statistically significant (P < 0.05). As FT3 levels increased, TG levels gradually decreased. There were no significant differences in TG levels among the three groups (P < 0.05). Compared with the low and middle FT3-level groups, HbA1c level in the low FT3-level group was significantly higher (P < 0.05). However, there was no significant difference in HbA1c levels between the middle and high FT3-level group (Figure 3).
 |
Figure 3 Comparison of FBG, HbA1c or TG at different FT3 levels in diabetic retinopathy patients. *P < 0.05, **P < 0.01. Abbreviations: TG, triglycerides; FBG, fasting blood glucose; HbA1c, glycated hemoglobin; FT3, free triiodothyronine. |
Correlation Analysis of TSH or FT3 with FBG, HbA1c or TG in DR Patients
Pearson correlation analysis (Figure 4) showed: (1) TSH was positively correlated with TG (r = 0.711, P < 0.001) and HbA1c (r = 0.321, P = 0.001), but not with FBG (P > 0.05); (2) FT3 was negatively correlated with TG (r = −0.537, P < 0.001), FBG (r = −0.241, P = 0.015) and HbA1c (r = −0.363, P < 0.001). Multiple stepwise regression analyses were performed with TSH or FT3 as dependent variables and FBG, HbA1c, and TG as independent variables. The results are as follows: (1) TSH is significantly correlated with TG (β = 0.711, P < 0.001), but not with FBG and HbA1c; (2) FT3 is closely related to TG (β = −0.468, P < 0.001) and HbA1c (β = −0.212, P = 0.017), but not to FBG (Table 4). Therefore, TSH negatively correlated with TG, whereas FT3 negatively correlated with TG and HbA1c levels in T2DM patients with DR.
 |
Table 4 Multivariate Linear Regression Analysis of TSH and FT3 Levels |
 |
Figure 4 Correlation of TSH or FT3 with FBG, HbA1c or TG in diabetic retinopathy patients. Abbreviations: TG, triglycerides; FBG, fasting blood glucose; HbA1c, glycated hemoglobin; TSH, thyroid stimulating hormone; FT3, free triiodothyronine. |
Discussion
With improvements in living standards and lifestyle changes, the incidence of T2DM is increasing. Untimely T2DM treatment can induce microvascular injury and cause DR, significantly increasing the risk of visual impairment. The continuous increase in blood glucose level in T2DM patients could damage the function of the retinal microvascular barrier, leading to the occurrence of DR.16 Therefore, it is important to identify clinically related indicators that can predict the risk of DR in T2DM patients for preventing and treating DR.
This study found that high serum TSH and low serum FT3 levels are independent risk factors for DR in T2DM patients. TSH, a hormone secreted by the adenohypophysis, can regulate the proliferation of thyroid cells, promote the synthesis and secretion of THs, and improve the blood supply to the thyroid. Abnormally high TSH expression can accelerate oxidative stress, induce vascular endothelial cell damage, and alter local hemodynamics in T2DM patients.17 These pathological changes can aggravate damage to endothelial cells in the fundus, thicken the basement membrane, and block capillaries, thereby causing visual impairment in T2DM patients. A cross-sectional study found that high TSH levels are an independent risk factor for diabetic macular edema in T2DM patients.12 Both FT3 and FT4 are the main active forms of THs in the body and can accurately reflect the metabolic state of the thyroid. T3 has the strongest biological activity among THs and plays an important role in metabolic processes. Many important biochemical processes in the human body, including fat production and decomposition, glucose metabolism, and insulin resistance, are affected by THs.18 Abnormal changes of THs are closely associated with the development of various diseases such as diabetes, coronary heart disease, and nonalcoholic fatty liver disease.19 Notably, THs are essential for retinal development and maturation of retina.20 Glaschke et al21 reported that THs deficiency affects the expression of retinal cone opsins and damages visual function in adult rodents. The decrease of T3 level can induce retinal cell dysfunction and death by aggravating the oxidative stress and inflammation in the eyes, thus promoting the onset of early diabetic retinopathy.22 In addition, low T3 level may have a protective effect on retinal stress in the early stage of diabetic retinopathy.23 Thus, timely correction of TSH and FT3 levels in T2DM patients may be helpful to prevent the occurrence or progress of DR.
FBG only represents the blood glucose level at the time of blood drawing. In addition, FBG is greatly influenced by diet, exercise, and mood, which do not fully reflect blood glucose control over a period of time. As a clinically stable index of glucose metabolism, HbA1c reflects the average blood glucose level in the last three months before measurement. Therefore, HbA1c can be used to evaluate the control of long-term blood glucose levels in patients with diabetes more accurately than FBG. Long-term hyperglycemia leads to the non-enzymatic glycosylation of proteins in T2DM patients. Proteins combine with non-glycated molecules to form macromolecular glycated products such as crystallin and collagen, which cause pathological changes such as thickening of the blood vessel basement membrane and turbidity of the lens in the eyes.24 A cross-sectional study of 13,473 patients with T2DM in China found that an elevated HbA1c level was an independent risk factor for early DR.25 Abnormal lipid metabolism has also been proved to be an important risk factor for the occurrence and development of DR.26 Kowluru et al27 pointed out that hyperlipidemia could accelerate mitochondrial damage induced by hyperglycemia and promote the progression of DR. Several studies have reported that the blood lipid levels of patients with DR were significantly higher than those of patients without DR, and this has a significant correlation with the severity of DR.28,29 TG is an important component of human blood lipids that regulates energy metabolism and maintains the balance of lipid metabolism. Notably, an increase in TG levels has been confirmed to be closely related to the occurrence of DR in T2DM patients.30,31 Our study also found that T2DM patients with higher serum TG, FBG, and HbA1c levels were more likely to develop DR. These findings suggest that the disorder of glycolipid metabolism increases the risk of DR in T2DM patients.
Our Pearson correlation analysis and multiple stepwise regression analysis showed that TSH was negatively correlated with TG, whereas FT3 was negatively correlated with TG and HbA1c in T2DM patients complicated with DR. This suggests that T2DM patients with higher TSH and lower FT3 levels are prone to glucose and lipid metabolism disorders, thus increasing the risk of retinopathy. Glucose metabolism in T2DM patients with poor long-term blood glucose control is weakened, leading to a disorder in cellular energy utilization32 Thus, the iodine pump function of the thyroid follicular cells is weakened, which reduces the iodine uptake ability of the thyroid gland and interferes with iodine organization. Thyroid follicular cells reduce the synthesis, eventually leading to a decline in serum FT3 level.33 In addition, a study found that the expression of iodothyronine deiodinase 2 decreased significantly when mouse retinal cells were exposed to hyperglycemia. This reduced the conversion from thyroxine (T4) to triiodothyronine (T3), thereby resulting in reduced FT3 production.22 Due to the insufficient synthesis and secretion of THs, the human body secretes a large amount of TSH to maintain the normal function of the thyroid gland, thus resulting in a significant increase in serum TSH levels. It was reported that the increase of TSH significantly increased the expression of interleukin-6 and anti-tumor necrosis factor-α in adipocytes, enhanced lipolysis and insulin resistance, and thus promoted the increase of TG level.34,35 The increased TG level is also closely related to the decrease in THs levels, and the potential mechanism is that decreased THs weaken the activity of lipoprotein lipase and lower the clearance rate of TG.36 The decrease of T3 level reduces the insulin synthesis of islet cells and weakens the sensitivity of peripheral tissues to insulin, leading to an increase in blood sugar.37 A study reported that exogenous T3 treatment significantly reduced the blood sugar of T2DM mice model, which may be achieved by improving insulin synthesis and insulin sensitivity.38 Therefore, abnormal levels of thyroid-related hormones have a significant effect on glucose and lipid metabolism, thereby accelerating the occurrence and development of DR.
There are still several limitations in this study. Firstly, it is a retrospective single-center study with small samples. Our findings need to be confirmed by a prospective multi-center and large-scale clinical study. In addition, all T2DM patients in our study chose oral metformin for hypoglycemic treatment. Some studies have reported that metformin may affect the serum levels of TSH, FT4, and FT3 in T2DM patients,39,40 which interferes with our research results to some extent. Moreover, this study is actually a retrospective analysis of medical records, and it is unable to obtain a complete record of patients’ diet, living habits and emotions. Because thyroid-related hormones, blood sugar and blood lipids are easily affected by these factors, our research results may have some deviations.
Conclusions
In conclusion, higher TSH and lower FT3 levels in euthyroid patients with DR may disturb the process of glucose and lipid metabolism, thus promoting the occurrence and development of DR. Therefore, closely monitoring the serum TSH, FT3, TG, FBG, and HbA1c levels in T2DM patients, and timely correcting TSH and FT3 levels and improving the disorder of glycolipid metabolism may be helpful to prevent DR.
Acknowledgment
Thanks to all who contributed to this study. We gratefully acknowledge Wenjie Chen for her guide in data analysis.
Disclosure
The authors declare that they have no conflicts of interest in this work.
References
1. Rehman K, Akash M. Mechanism of generation of oxidative stress and pathophysiology of type 2 diabetes mellitus: how are they interlinked? J Cell Biochem. 2017;118(11):3577–3585. doi:10.1002/jcb.26097
2. White NH, Pan Q, Knowler WC, et al. Risk factors for the development of retinopathy in prediabetes and type 2 diabetes: the diabetes prevention program experience. Diabetes Care. 2022;45(11):2653–2661. doi:10.2337/dc22-0860
3. Yau JW, Rogers SL, Kawasaki R, et al. Global prevalence and major risk factors of diabetic retinopathy. Diabetes Care. 2012;35(3):556–564. doi:10.2337/dc11-1909
4. Lin KY, Hsih WH, Lin YB, et al. Update in the epidemiology, risk factors, screening, and treatment of diabetic retinopathy. J Diabetes Investig. 2021;12(8):1322–1325. doi:10.1111/jdi.13480
5. Song SJ, Wong TY. Current concepts in diabetic retinopathy. Diabetes Metab J. 2014;38(6):416–425. doi:10.4093/dmj.2014.38.6.416
6. Kuo JZ, Wong TY, Rotter JI. Challenges in elucidating the genetics of diabetic retinopathy. JAMA Ophthalmol. 2014;132(1):96–107. doi:10.1001/jamaophthalmol.2013.5024
7. Zhang L, Krzentowski G, Albert A, et al. Risk of developing retinopathy in Diabetes Control and Complications Trial type 1 diabetic patients with good or poor metabolic control. Diabetes Care. 2001;24(7):1275–1279. doi:10.2337/diacare.24.7.1275
8. Enzsoly A, Hajdu RI, Turoczi Z, et al. The predictive role of thyroid hormone levels for early diabetic retinal changes in experimental rat and human diabetes. Invest Ophthalmol Vis Sci. 2021;62(6):20. doi:10.1167/iovs.62.6.20
9. Pessoa CN, Santiago LA, Santiago DA, et al. Thyroid hormone action is required for normal cone opsin expression during mouse retinal development. Invest Ophthalmol Vis Sci. 2008;49(5):2039–2045. doi:10.1167/iovs.07-0908
10. Zou J, Li Z, Tian F, et al. Association between normal thyroid hormones and diabetic retinopathy in patients with type 2 diabetes. Biomed Res Int. 2020;2020:8161797. doi:10.1155/2020/8161797
11. Falkowski B, Rogowicz-Frontczak A, Grzelka A, et al. Higher free triiodothyronine concentration is associated with lower prevalence of microangiopathic complications and better metabolic control in adult euthyroid people with type 1 diabetes. Endocrine. 2018;60(3):458–465. doi:10.1007/s12020-018-1582-8
12. Cao X, Lu M, Xie RR, et al. A high TSH level is associated with diabetic macular edema: a cross-sectional study of patients with type 2 diabetes mellitus. Endocr Connect. 2022;11(7). doi:10.1530/EC-22-0122
13. Heidari Z, Asadzadeh R. Subclinical hypothyroidism is a risk factor for diabetic retinopathy in patients with type 2 diabetes mellitus. Med J Islam Repub Iran. 2021;35:186. doi:10.47176/mjiri.35.186
14. Bao W, Dar S, Zhu Y, et al. Plasma concentrations of lipids during pregnancy and the risk of gestational diabetes mellitus: a longitudinal study. J Diabetes. 2018;10(6):487–495. doi:10.1111/1753-0407.12563
15. American Diabetes Association Professional Practice Committee, American Diabetes Association Professional Practice Committee. 2. Classification and diagnosis of diabetes: standards of medical care in diabetes-2022. Diabetes Care. 2022;45(Suppl 1):S17–S38. doi:10.2337/dc22-S002
16. Rao H, Jalali JA, Johnston TP, et al. Emerging roles of dyslipidemia and hyperglycemia in diabetic retinopathy: molecular mechanisms and clinical perspectives. Front Endocrinol. 2021;12:620045. doi:10.3389/fendo.2021.620045
17. Lin D, Qin R, Guo L. Thyroid stimulating hormone aggravates diabetic retinopathy through the mitochondrial apoptotic pathway. J Cell Physiol. 2022;237(1):868–880. doi:10.1002/jcp.30563
18. Iwen KA, Schroder E, Brabant G. Thyroid hormones and the metabolic syndrome. Eur Thyroid J. 2013;2(2):83–92. doi:10.1159/000351249
19. Maiden MJ, Torpy DJ. Thyroid Hormones in Critical Illness. Crit Care Clin. 2019;35(2):375–388. doi:10.1016/j.ccc.2018.11.012
20. Cheng SY, Leonard JL, Davis PJ. Molecular aspects of thyroid hormone actions. Endocr Rev. 2010;31(2):139–170. doi:10.1210/er.2009-0007
21. Glaschke A, Weiland J, Del TD, et al. Thyroid hormone controls cone opsin expression in the retina of adult rodents. J Neurosci. 2011;31(13):4844–4851. doi:10.1523/JNEUROSCI.6181-10.2011
22. Bapputty R, Sapa H, Masaru M, et al. Diabetes modulates iodothyronine deiodinase 2 expression in the mouse retina: a role for thyroid hormone in the pathogenesis of diabetic retinopathy. Invest Ophthalmol Vis Sci. 2023;64(15):3. doi:10.1167/iovs.64.15.3
23. Forini F, Nicolini G, Amato R, et al. Local modulation of thyroid hormone signaling in the retina affects the development of diabetic retinopathy. Biochim Biophys Acta Mol Basis Dis. 2024;1870(1):166892. doi:10.1016/j.bbadis.2023.166892
24. Gao X, Wang X, Zhong Y, et al. Serum antithyroglobulin antibody levels are associated with diabetic retinopathy among euthyroid type 2 diabetes patients: a hospital-based, retrospective study. J Diabetes Res. 2022;2022:2552186. doi:10.1155/2022/2552186
25. Liu Y, Yang J, Tao L, et al. Risk factors of diabetic retinopathy and sight-threatening diabetic retinopathy: a cross-sectional study of 13 473 patients with type 2 diabetes mellitus in mainland China. BMJ Open. 2017;7(9):e016280. doi:10.1136/bmjopen-2017-016280
26. Busik JV. Lipid metabolism dysregulation in diabetic retinopathy. J Lipid Res. 2021;62:100017. doi:10.1194/jlr.TR120000981
27. Kowluru RA. Diabetic retinopathy and NADPH oxidase-2: a sweet slippery road. Antioxidants. 2021;10(5):783. doi:10.3390/antiox10050783
28. Xuan Q, Zheng F, Yu D, et al. Rapid lipidomic profiling based on ultra-high performance liquid chromatography-mass spectrometry and its application in diabetic retinopathy. Anal Bioanal Chem. 2020;412(15):3585–3594. doi:10.1007/s00216-020-02632-6
29. Ezhilvendhan K, Sathiyamoorthy A, Prakash BJ, et al. Association of dyslipidemia with diabetic retinopathy in type 2 diabetes mellitus patients: a hospital-based study. J Pharm Bioallied Sci. 2021;13(Suppl 2):S1062–S1067. doi:10.4103/jpbs.jpbs_164_21
30. Tung TH, Chen SJ, Liu JH, et al. A community-based follow-up study on diabetic retinopathy among type 2 diabetics in Kinmen. EUR J EPIDEMIOL. 2005;20(4):317–323. doi:10.1007/s10654-004-6651-z
31. Zhang HY, Wang JY, Ying GS, et al. Serum lipids and other risk factors for diabetic retinopathy in Chinese type 2 diabetic patients. J Zhejiang Univ Sci B. 2013;14(5):392–399. doi:10.1631/jzus.B1200237
32. DeFronzo RA, Ferrannini E, Groop L, et al. Type 2 diabetes mellitus. NAT REV DIS PRIMERS. 2015;1:15019. doi:10.1038/nrdp.2015.19
33. Menon PS, Vaidyanathan B, Kaur M. Autoimmune thyroid disease in Indian children with type 1 diabetes mellitus. J Pediatr Endocrinol Metab. 2001;14(3):279–286. doi:10.1515/JPEM.2001.14.3.279
34. Zhang YJ, Zhao W, Zhu MY, et al. Thyroid-stimulating hormone induces the secretion of tumor necrosis factor-alpha from 3T3-L1 adipocytes via a protein kinase A-dependent pathway. Exp Clin Endocrinol Diabetes. 2013;121(8):488–493. doi:10.1055/s-0033-1347266
35. van de Woestijne AP, Monajemi H, Kalkhoven E, et al. Adipose tissue dysfunction and hypertriglyceridemia: mechanisms and management. Obes Rev. 2011;12(10):829–840. doi:10.1111/j.1467-789X.2011.00900.x
36. Pazos F, Alvarez JJ, Rubies-Prat J, et al. Long-term thyroid replacement therapy and levels of lipoprotein(a) and other lipoproteins. J Clin Endocrinol Metab. 1995;80(2):562–566. doi:10.1210/jcem.80.2.7852521
37. Gu L, Yang J, Gong Y, et al. Lower free thyroid hormone levels are associated with high blood glucose and insulin resistance; these normalize with metabolic improvement of type 2 diabetes. J Diabetes. 2021;13(4):318–329. doi:10.1111/1753-0407.13118
38. Lin Y, Sun Z. Thyroid hormone potentiates insulin signaling and attenuates hyperglycemia and insulin resistance in a mouse model of type 2 diabetes. Br J Pharmacol. 2011;162(3):597–610. doi:10.1111/j.1476-5381.2010.01056.x
39. Condorelli RA, Cannarella R, Aversa A, et al. Effects of slow-acting metformin treatment on the hormonal and morphological thyroid profile in patients with insulin resistance. Pharmaceutics. 2022;14(10):1987. doi:10.3390/pharmaceutics14101987
40. Pappa T, Alevizaki M. Metformin and thyroid: an update. Eur Thyroid J. 2013;2(1):22–28. doi:10.1159/000346248
 © 2024 The Author(s). This work is published and licensed by Dove Medical Press Limited. The full terms of this license are available at https://www.dovepress.com/terms.php and incorporate the Creative Commons Attribution - Non Commercial (unported, v3.0) License.
By accessing the work you hereby accept the Terms. Non-commercial uses of the work are permitted without any further permission from Dove Medical Press Limited, provided the work is properly attributed. For permission for commercial use of this work, please see paragraphs 4.2 and 5 of our Terms.
© 2024 The Author(s). This work is published and licensed by Dove Medical Press Limited. The full terms of this license are available at https://www.dovepress.com/terms.php and incorporate the Creative Commons Attribution - Non Commercial (unported, v3.0) License.
By accessing the work you hereby accept the Terms. Non-commercial uses of the work are permitted without any further permission from Dove Medical Press Limited, provided the work is properly attributed. For permission for commercial use of this work, please see paragraphs 4.2 and 5 of our Terms.