")
Back to Journals » Diabetes, Metabolic Syndrome and Obesity » Volume 14
Correlation Between Hemoglobin Glycosylation Index and Nerve Conduction Velocity in Patients with Type 2 Diabetes Mellitus
Authors Li Z, Gao Y, Jia Y, Chen S
Received 18 August 2021
Accepted for publication 13 October 2021
Published 4 December 2021 Volume 2021:14 Pages 4757—4765
DOI https://doi.org/10.2147/DMSO.S334767
Checked for plagiarism Yes
Review by Single anonymous peer review
Peer reviewer comments 4
Editor who approved publication: Professor Ming-Hui Zou
Zelin Li,1,2 Yuan Gao,3 Yujiao Jia,1,2 Shuchun Chen1,2,4
1Graduate School of Hebei Medical University, Shijiazhuang, Hebei, People’s Republic of China; 2Department of Endocrinology, Hebei General Hospital, Shijiazhuang, Hebei, People’s Republic of China; 3Shijiazhuang 16th Retired Cadre Rest Center of Hebei Military Region, Shijiazhuang, Hebei, People’s Republic of China; 4Hebei Key Laboratory of Metabolic Diseases, Shijiazhuang, Hebei, People’s Republic of China
Correspondence: Shuchun Chen
Department of Endocrinology, Hebei General Hospital, 348 Heping West Road, Shijiazhuang, Hebei, 050051, People’s Republic of China
Tel/Fax +86 311 85988406
Email [email protected]
Objective: This study aimed to investigate the relationship between hemoglobin glycation variation index (HGI) and peripheral nerve conduction velocity (NCV) in patients with type 2 diabetes mellitus (T2DM).
Materials and Methods: This is a cross-sectional study, including 324 patients with T2DM were included in this study. Basic information and blood indicators were collected. The motor conduction velocities (MCV) of the bilateral ulnar nerve, median nerve, and common peroneal nerve, and the sensory conduction velocities (SCV) of the ulnar nerve, median nerve, and superficial peroneal nerve were measured. The patients were divided into two groups according to the NCV: normal nerve conduction group (NCVN group) and abnormal nerve conduction group (NCVA group). When the NCV is less than the specific normal value, the patients were divided into the NCVA group. HGI was calculated as the difference between the measured and predicted values of glycosylated hemoglobin (HbA1c) using the linear relationship between HbA1c level and fasting plasma glucose levels. At last, all study participants were divided into High HGI and Low HGI groups using the median of HGI as the boundary. The study also analyzed the correlation between HGI and NCV.
Results: Compared to the NCVN group, the HGI levels of the NCVA group were higher (P < 0.001). The prevalence of NCVA in the high HGI group was higher than that in the low HGI group (P = 0.004). HGI was negatively correlated with bilateral ulnar nerve MCV, bilateral median nerve MCV, bilateral common peroneal nerve MCV, bilateral median nerve SCV and left superficial peroneal nerve SCV, and the correlation still existed after adjusting for confounding factors.
Conclusion: This study found that HGI is inversely associated with NCV in patients with T2DM, and this correlation is higher between HGI and MCV of peripheral nerve.
Keywords: hemoglobin glycation variation index, peripheral nerve conduction velocity, type 2 diabetes mellitus
Introduction
Type 2 diabetes mellitus (T2DM) is one of the most common metabolic diseases worldwide. The International Diabetes Federation estimated that approximately 425 million people with diabetes worldwide, including 115 million in China.1 T2DM is a disease caused by the disturbance of carbohydrate metabolism, because of insulin resistance and insufficient insulin secretion, characterized by chronic hyperglycemia. The most common and complex complication of T2DM is diabetic peripheral neuropathy (DN), especially diabetic polyneuropathy (DPN).2 Approximately 37–45% of T2DM patients had DN.3 Despite its high prevalence, it is often underdiagnosed, with approximately 50% of patients are asymptomatic.4 DN harms the quality of life and can cause an enormous financial burden. Late diagnosis of DN can lead to significant morbidity in the form of diabetic foot ulceration and amputation and increased mortality.5 Therefore, it is recommended that all patients should be screened for DN when T2DM is diagnosed.6 Peripheral nerve conduction velocity (NCV) detection is the most sensitive, accurate and reliable method for diagnosing DN.7
Several studies have shown that hyperglycemia, Vitamin D deficiency, diabetes duration, hypertension and hyperlipidemia are all risk factors for DN.8,9 Among them, poor glycemic control is considered the significant risk factor for DN.10 Glycosylated hemoglobin (HbA1c) is the gold standard for recent 2–3 months of glycemic control. Nevertheless, recent studies found that HbA1c levels are influenced by blood glucose levels and inter-individual biological differences.11,12 HbA1c can be affected by many factors, such as age, red blood cell lifespan, anemia, genetic factors, etc.13 Therefore, the hemoglobin glycosylation index (HGI) is introduced to quantify the individual differences between fasting blood glucose (FBG) and HbA1c.14 Researches found that high HGI levels are associated with many chronic complications of diabetes, including diabetic retinopathy and diabetic nephropathy, especially cardiovascular disease.13–16
To our knowledge, this is the first study to detect the correlation between HGI and NCV in patients with T2DM. The purpose of this study is to investigate whether HGI is an independent factor for NCV. In other words, this study is to investigate whether high HGI is a risk factor for NCV. Early identification of risk factors for NCV, and thus screening for at an early stage.
Materials and Methods
Study Design and Study Population
The study was conducted at the Department of Endocrinology, Hebei General Hospital, using a cross-sectional method. Participants were recruited between December 2018 and December 2019. This study followed the principles in the Declaration of Helsinki and was approved by the medical ethics committee of Hebei General Hospital (The number of ethics committee: NO.202027). All patients signed informed consent before enrollment. Inclusion criteria for the study: 1) Patients (aged > 18 years old) comply with the WHO diagnostic criteria for diabetes, 1999. 2) NCV tests were performed.
Exclusion criteria for the study: type 1 diabetes or other specific types of diabetes; pregnant or lactating women; severe physical disease; liver or kidney failure; diabetic foot complications; and diseases affecting nerve conduction velocity such as hereditary, demyelinating or multifocal neuropathy, radiculopathy, mononeuritis, and cerebrovascular disease.
Information and Biomarkers Collection
All participants completed a questionnaire to collect basic information, including gender, age and duration of disease. Height and weight were measured twice by professional physical examination, and the average value was recorded. Blood samples were collected from the patients after 8 hours of fasting. The study tested all blood indicators in the same laboratory. Total cholesterol, triglycerides, high-density lipoprotein cholesterol, low-density lipoprotein cholesterol, alanine aminotransferase, aspartate aminotransferase, urea nitrogen, creatinine, uric acid and FBG were measured by professionals using a fully automatic biochemical analyzer. Vitamin D and HbA1c were measured by the laboratory physician using an electrochemical luminescence method.
The Measurement of NCV
NCV was recorded using the Keypoint Myoelectric Evoked Potentiometer (Alpine Biomed ApS; Dantec, Denmark) under standard surface stimulation. During the measurement, the electrode was coated with conductive glue and fixed with tape. NCV was measured on both sides of the limbs. The tests were conducted at room temperature (20–25◦C), with a stimulation frequency of 1 Hz, a stimulation pulse width of 0.1 ms, and a sensitivity of 5 mV/lattice. The skin temperature of the patients was measured using an infrared thermal imager and controlled between 33 and 34°C. For the investigation of motor nerves, we selected the bilateral ulnar nerve, median nerve, and common peroneal nerve. We selected the bilateral ulnar nerve, median nerve, and superficial peroneal nerve for the investigation of sensory nerves.
Hemoglobin Glycation Index
HGI was calculated using the formula:
HGI = measured HbA1c value - predicted HbA1c value.
The study adopted linear regression to analyze the correlation between HbA1c and FBG, the HbA1c–FBG regression equation was developed based on data obtained from all the study subjects. The predicted HbA1c value was calculated by inserting FBG value into the linear regression equation: Predicted HbA1c level = 0.325 × FBG (mmol/L)+5.724 (r =0.592, P<0.001).
Participant Groupings
Our study included two groupings. First, the patients were divided into two groups according to the nerve conduction velocity (NCV) (normal value, the specific normal value is shown in the Table 1): normal nerve conduction group and abnormal nerve conduction group.
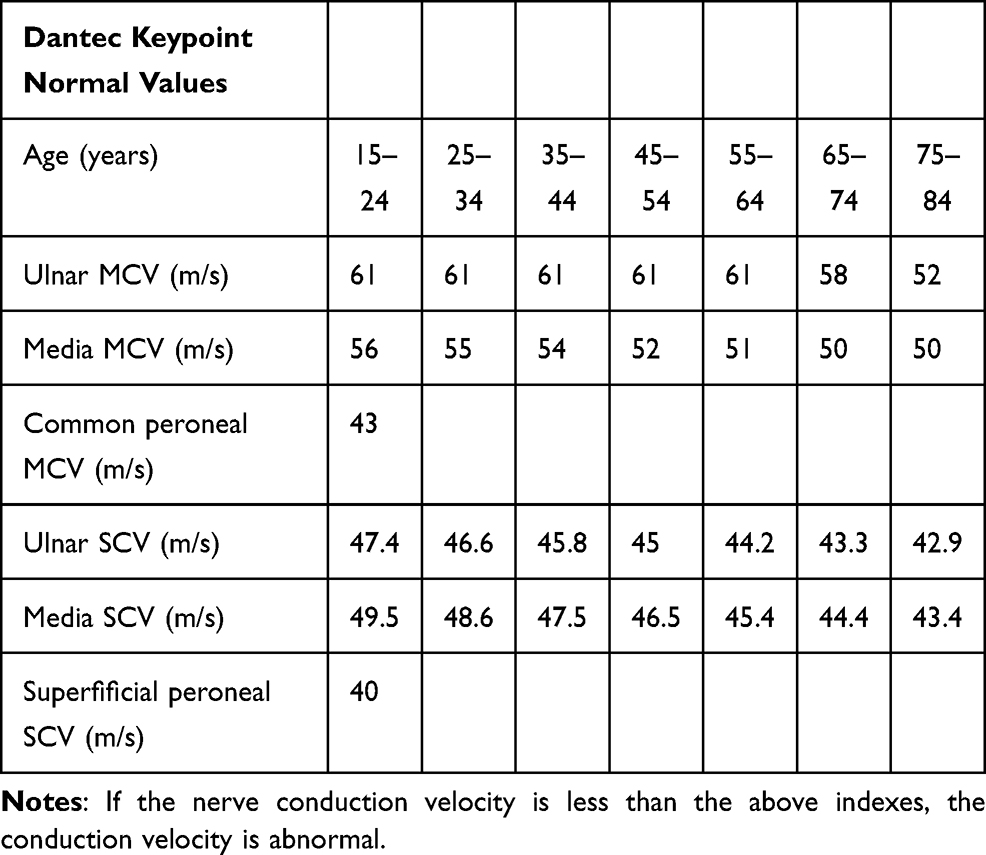 |
Table 1 The Specific Normal Value of the Nerve Conduction Velocity |
Second, the patients were divided into the high HGI group (HGI≥-0.32) and the low HGI group (HGI <-0.32).
Statistical Analysis
All analyses were conducted using Statistical Product and Service Solutions 25.0 (SPSS 25.0). The study tested the distribution normality using the Kolmogorov–Smirnov test. If the data conformed to the normal distribution, it was presented as mean ± standard deviation and comparisons between groups were made using the Student t test. If the data did not conform to the normal distribution, it were presented as median (25th–75th interquartile range) and comparisons between groups were made using Mann–Whitney U analysis. The data were expressed as numbers (percentages) for categorical variables, and the chi-square test was used for comparisons between groups. The study conducted Logistic regression analysis to study whether HGI is a risk factor for abnormal peripheral nerve conduction group (NCVA) and adopted Spearman or Pearson correlation analysis to analyze the correlation between HGI and NCV. We investigated the independent correlation between HGI and NCV using multiple linear regression analysis. A P-value less than 0.05 was considered statistically significant.
Results
Clinical Characteristics of All Participants
This study included 324 T2DM patients (231 males and 93 females), and 150 patients (46.30%) constituted abnormal peripheral nerve conduction group (NCVA group). The median age of this study population was 56 years old and the mean duration of disease was 8 years. 162 patients had high HGI values, with a mean HGI level of −0.32 (Table 2).
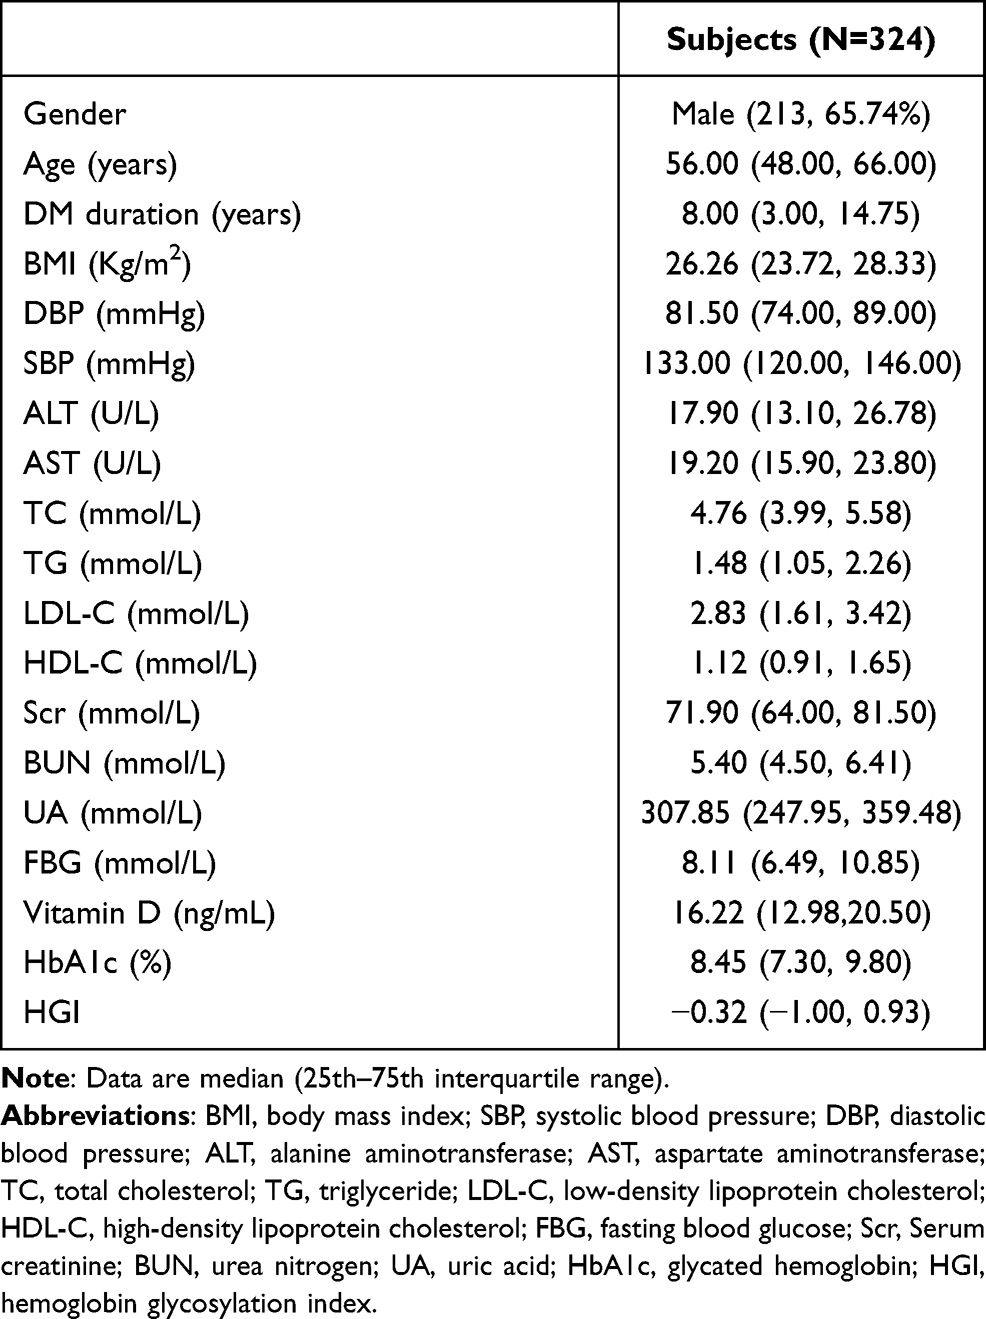 |
Table 2 Clinical Characteristics of All Participants |
Comparison of Basic Parameters Between the NCVN Group and NCVA Group
The HGI levels were significantly increased for patients in the NCVA group compared to patients in the NCVN group (P<0.001) (Figure 1). Compared to the NCVN group, the patients in the NCVA group had lower vitamin D levels, and had a longer disease duration (P=0.010, P=0.006, respectively). (Table 3).
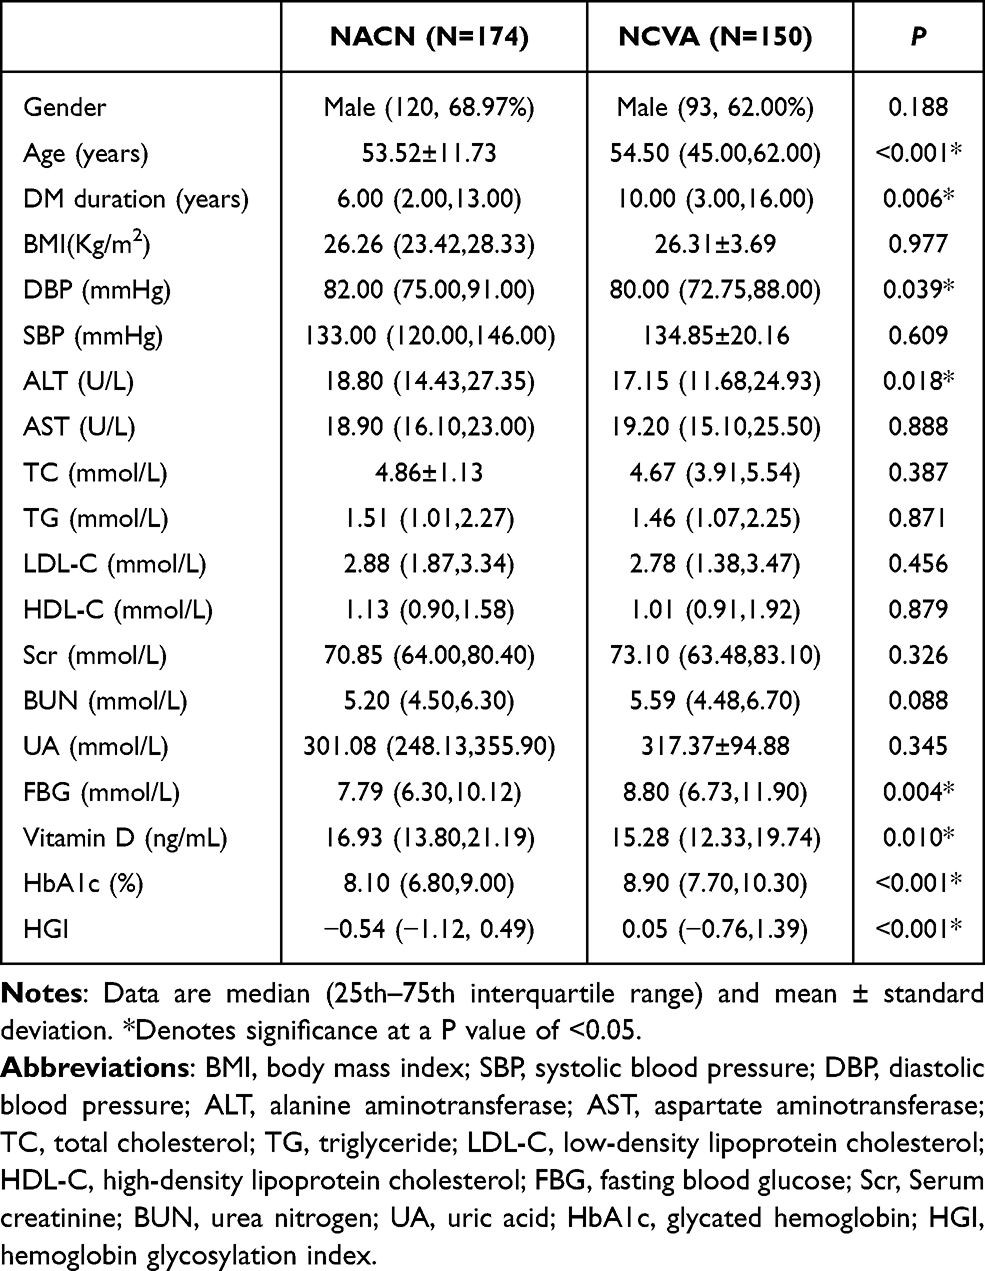 |
Table 3 Comparison of Indicators Between the NCVN and NCVA Groups |
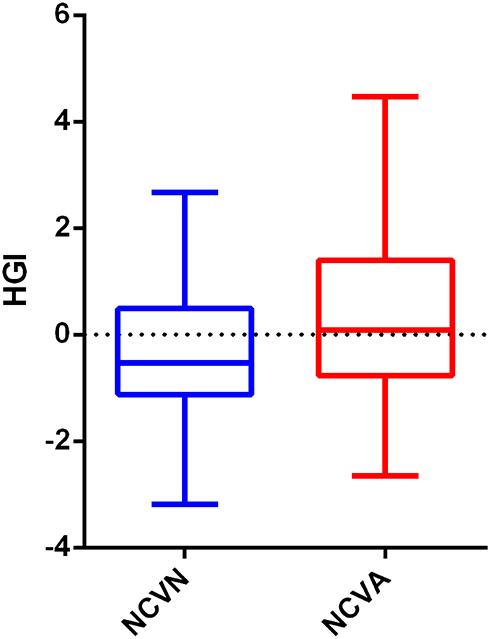 |
Figure 1 Comparisons of HGI levels in normal peripheral nerve conduction group and abnormal peripheral nerve conduction group in patients with type 2 diabetes mellitus. |
Comparison of Basic Parameters Between the High and Low HGI Groups
The prevalence of NCVA was higher in the high HGI group than in the low HGI groupb (P=0.004) (Figure 2). The high HGI group had higher HbA1c levels and lower vitamin D levels than the low HGI group (P<0.001, P=0.005, respectively) (Table 4).
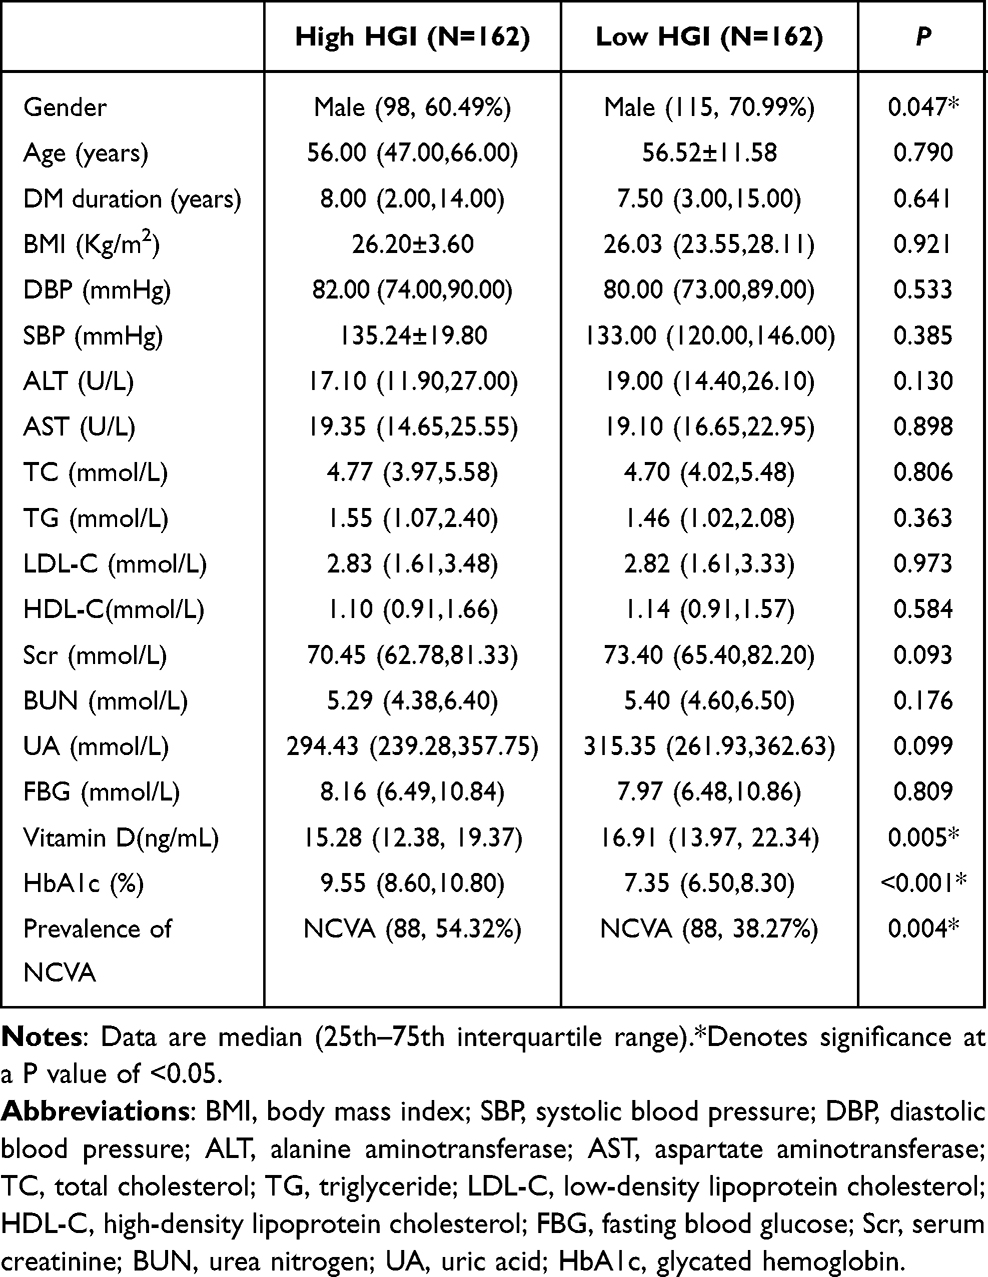 |
Table 4 Comparison of Indicators Between the High HGI and Low HGI Groups |
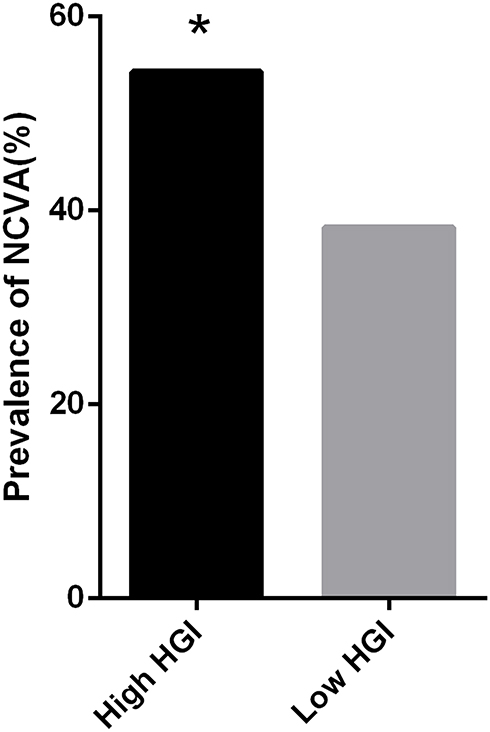 |
Figure 2 Comparisons of prevalence of abnormal peripheral nerve conduction in the High HGI group and Low HGI group for all participants. *Denotes significance at a P value of <0.05. |
Dichotomous Logistic Regression of Nerve Conduction Velocity and HGI
The study conducted a Dichotomous logistic regression analysis to analyze the correlation between HGI and NCV. Age, disease duration, diastolic blood pressure, glutamate transaminase, vitamin D level, the use of metformin, the use of insulin and HGI were included in this dichotomous logistic model. The result indicated that HGI was a risk factor for NCVA, where the incidence of NCVA increased 1.338-fold for each unit increase in HGI (P=0.004) (Table 5).
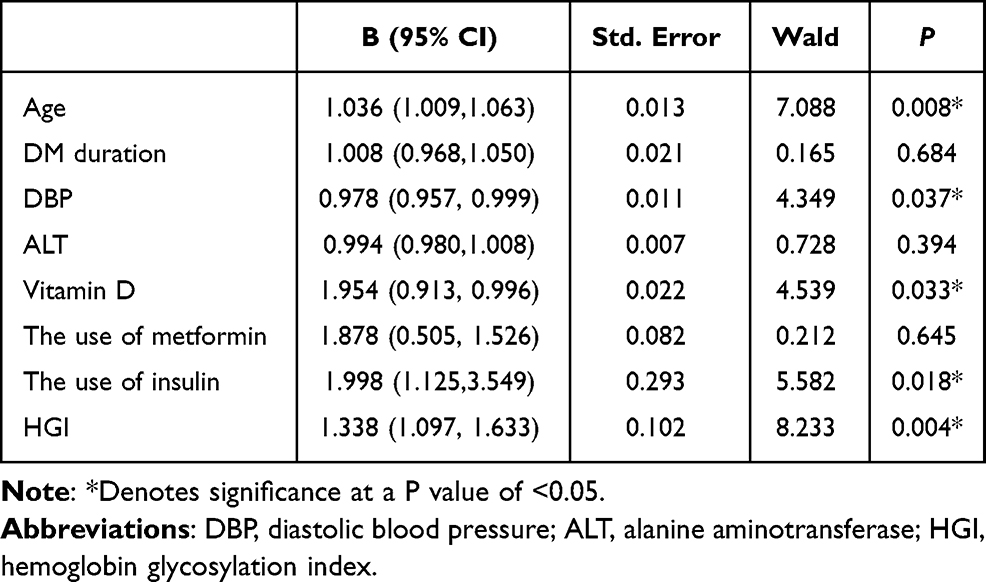 |
Table 5 Dichotomous Logistic Regression of Risk Factors for Abnormal Peripheral Nerve Conduction Velocity in T2DM Patients |
Correlation Analysis of HGI and NCV in Patients with T2DM
The correlation analysis revealed that HGI was negatively correlated with the bilateral ulnar nerve motor conduction velocities (MCV), median nerve MCV, common peroneal nerve MCV, bilateral median nerve sensory conduction velocities (SCV), and left superficial peroneal nerve SCV (Table 6).
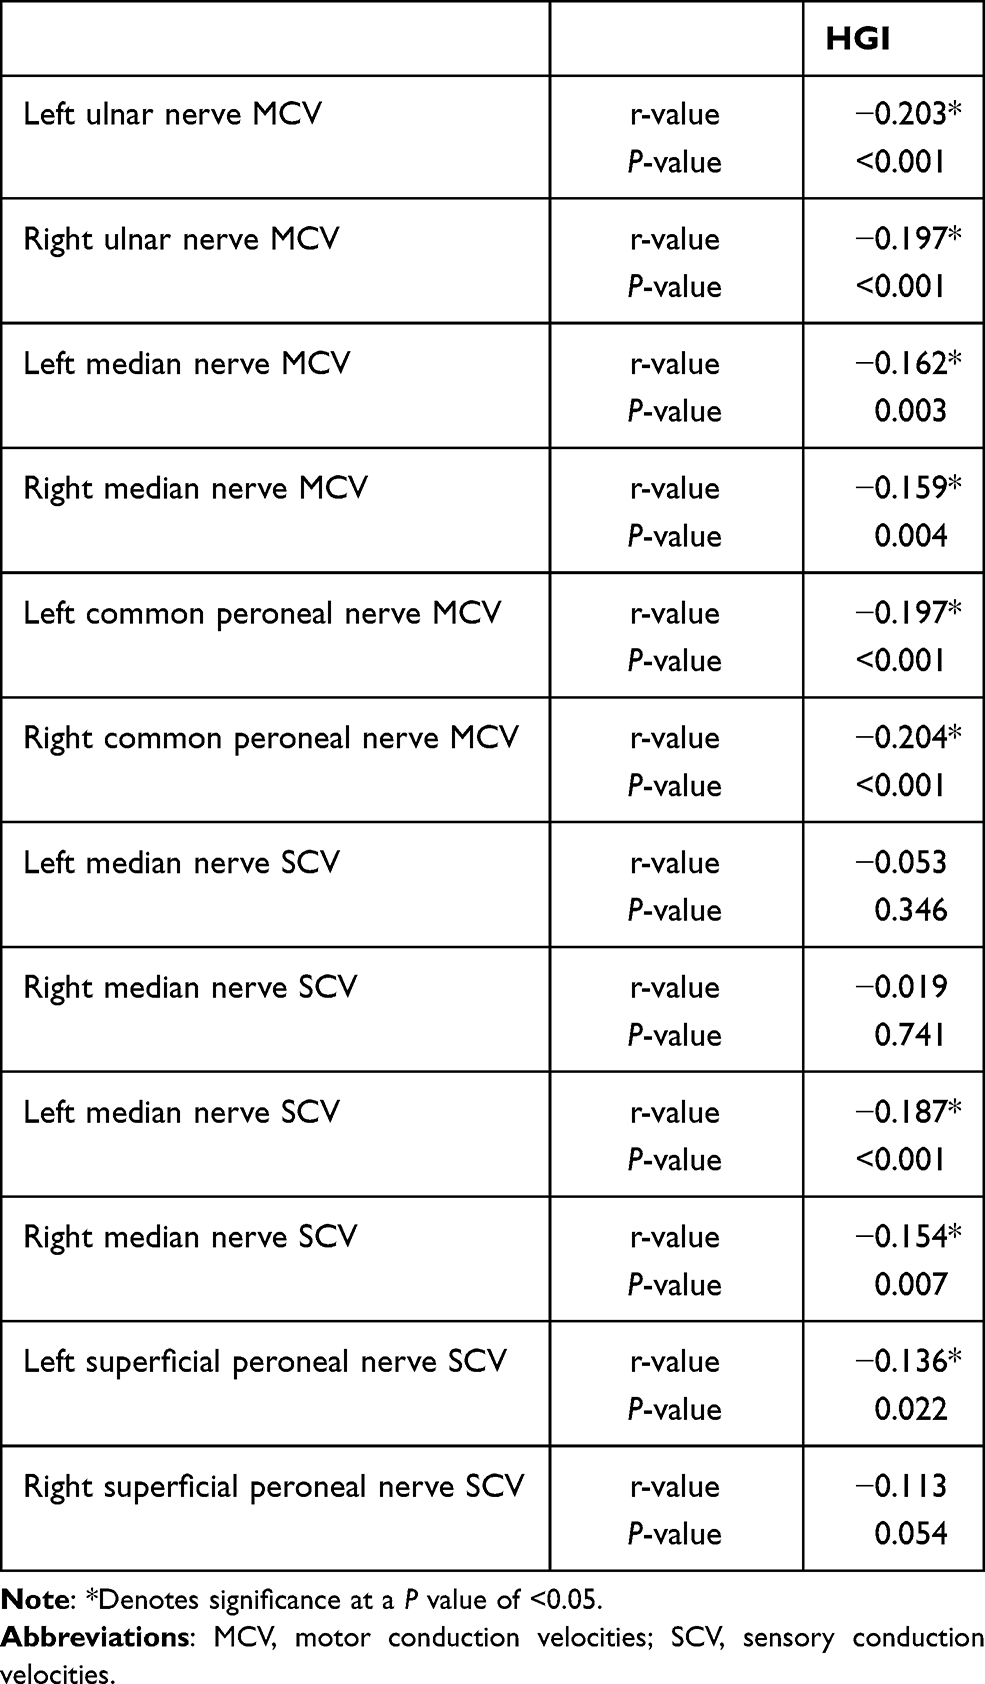 |
Table 6 The Correlation of HGI and NCV in Patients with T2DM |
However, there was no correlation between HGI and bilateral ulnar nerve SCV or right superficial peroneal nerve SCV (Table 6).
Multivariate Linear Correlation Analysis of NCV and HGI Levels in Patients with T2DM
For all participants, HGI was negatively correlated with the bilateral ulnar nerve MCV, median nerve NCV, common peroneal nerve MCV, bilateral median nerve SCV and left superficial peroneal nerve SCV in the crude model 1 (Table 7), model 2 (adjusted for age, BMI, disease duration, systolic blood pressure, diastolic blood pressure) (Table 8) and model 3 (adjusted for age, BMI, disease duration, systolic blood pressure, diastolic blood pressure, glutamate transaminase, glutathione transaminase) (Table 9).
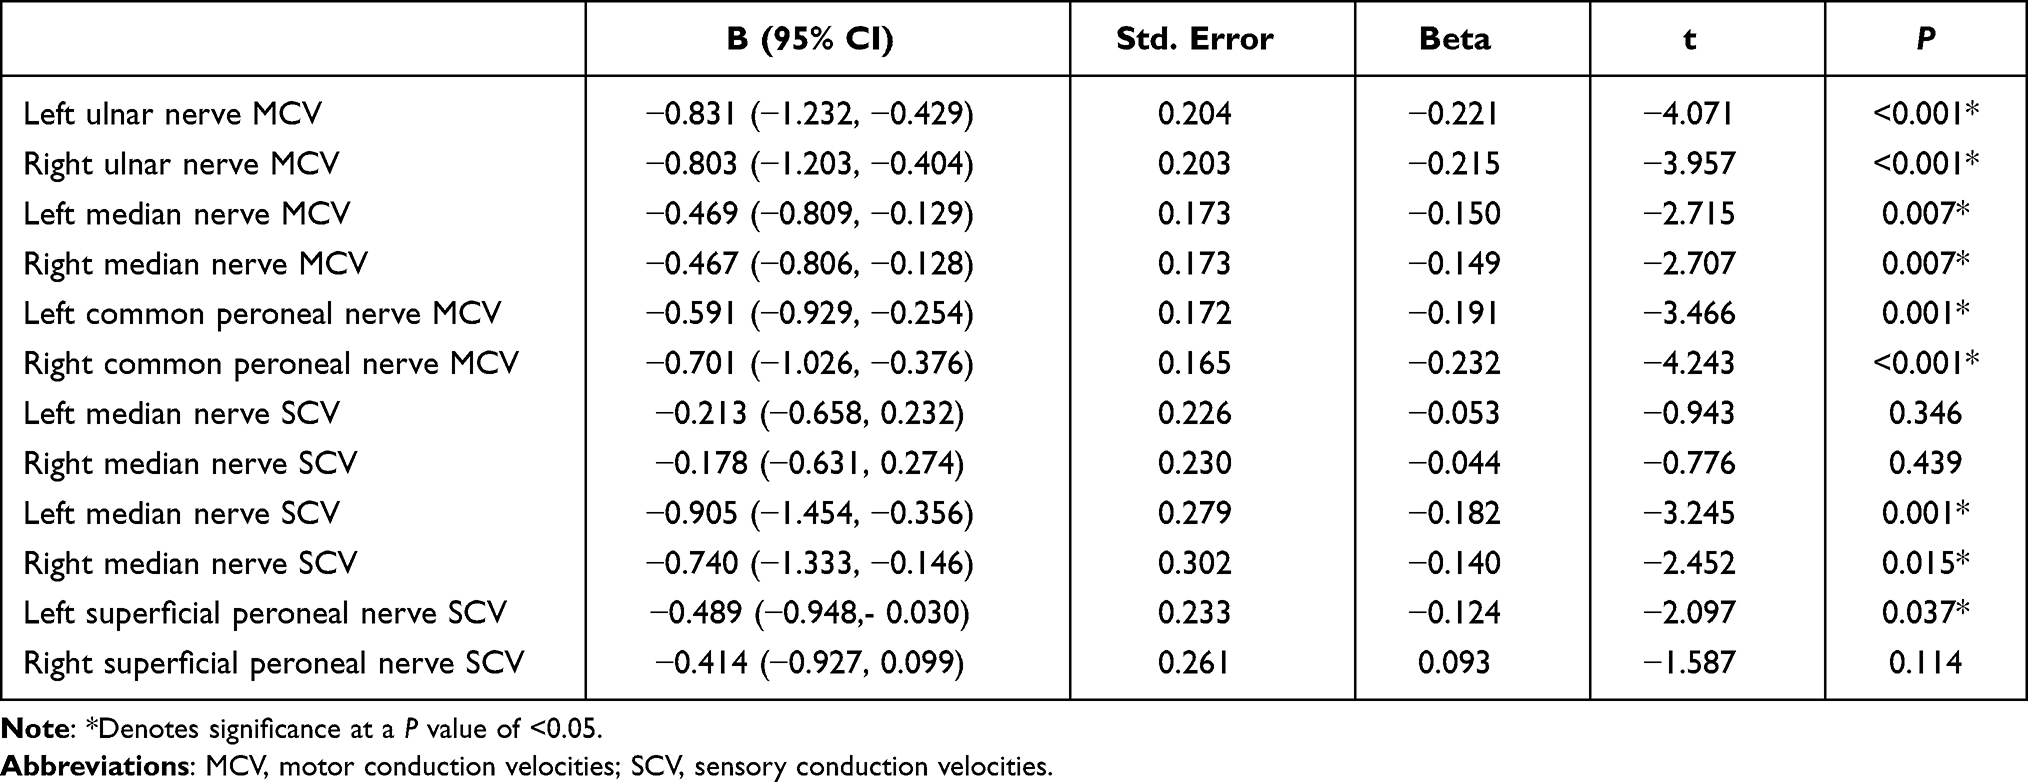 |
Table 7 Correlation of HGI with Different Nerve Conduction Velocities in Patients with T2DM in Model 1 |
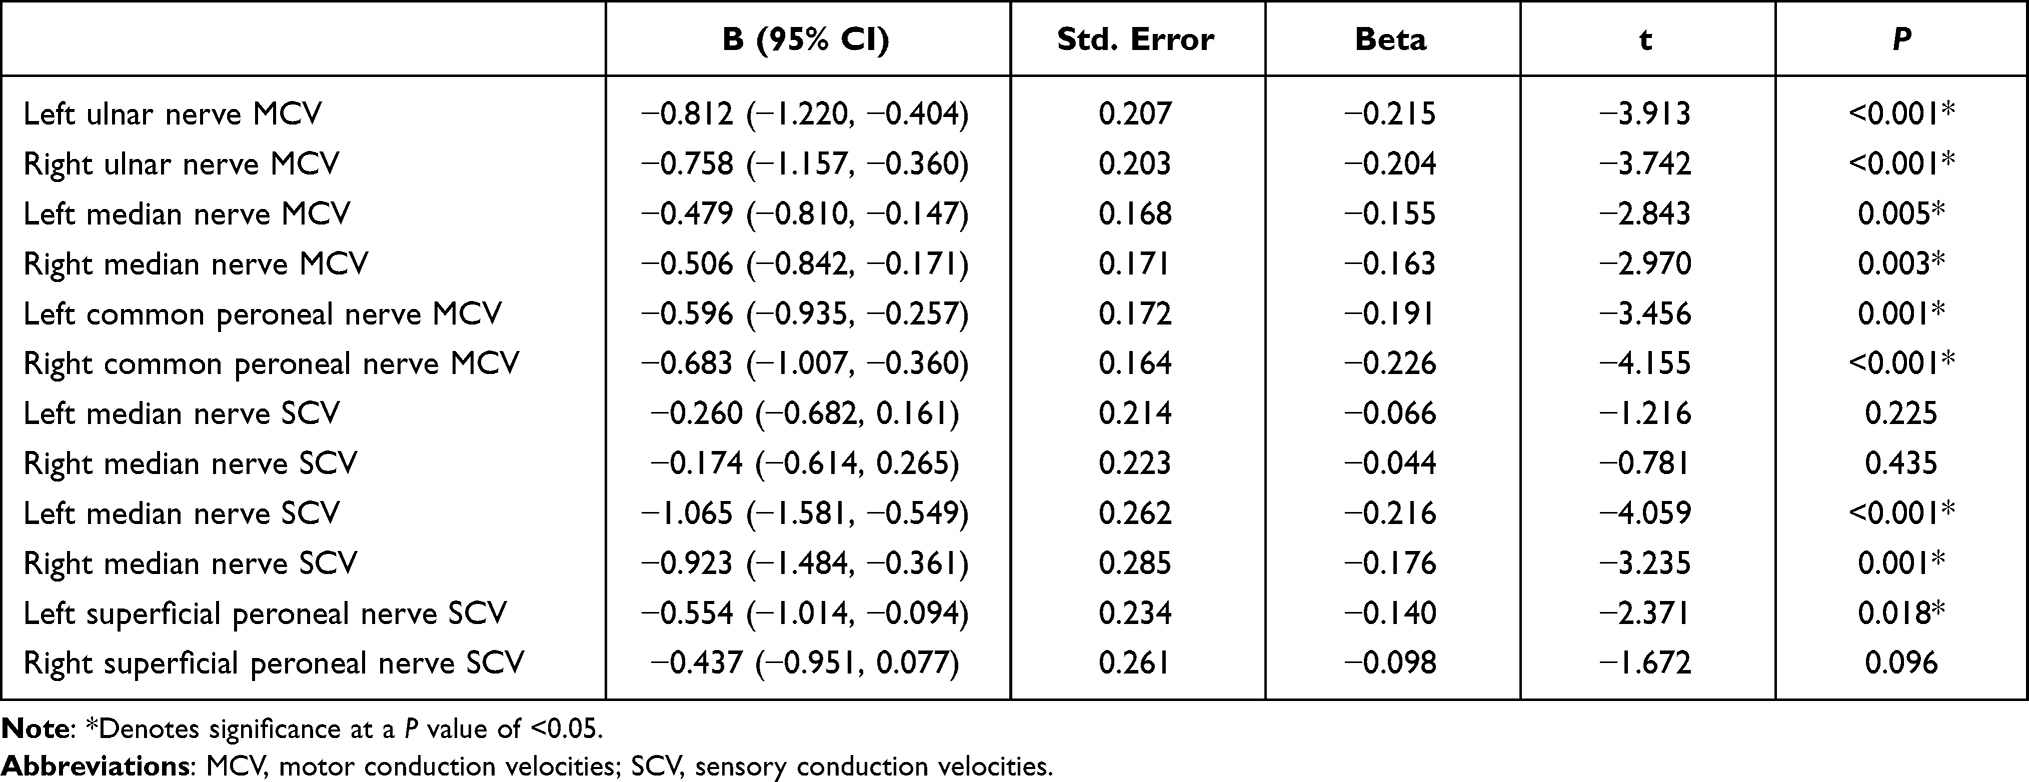 |
Table 8 Correlation of HGI with Different Nerve Conduction Velocities in Patients with T2DM in Model 2 |
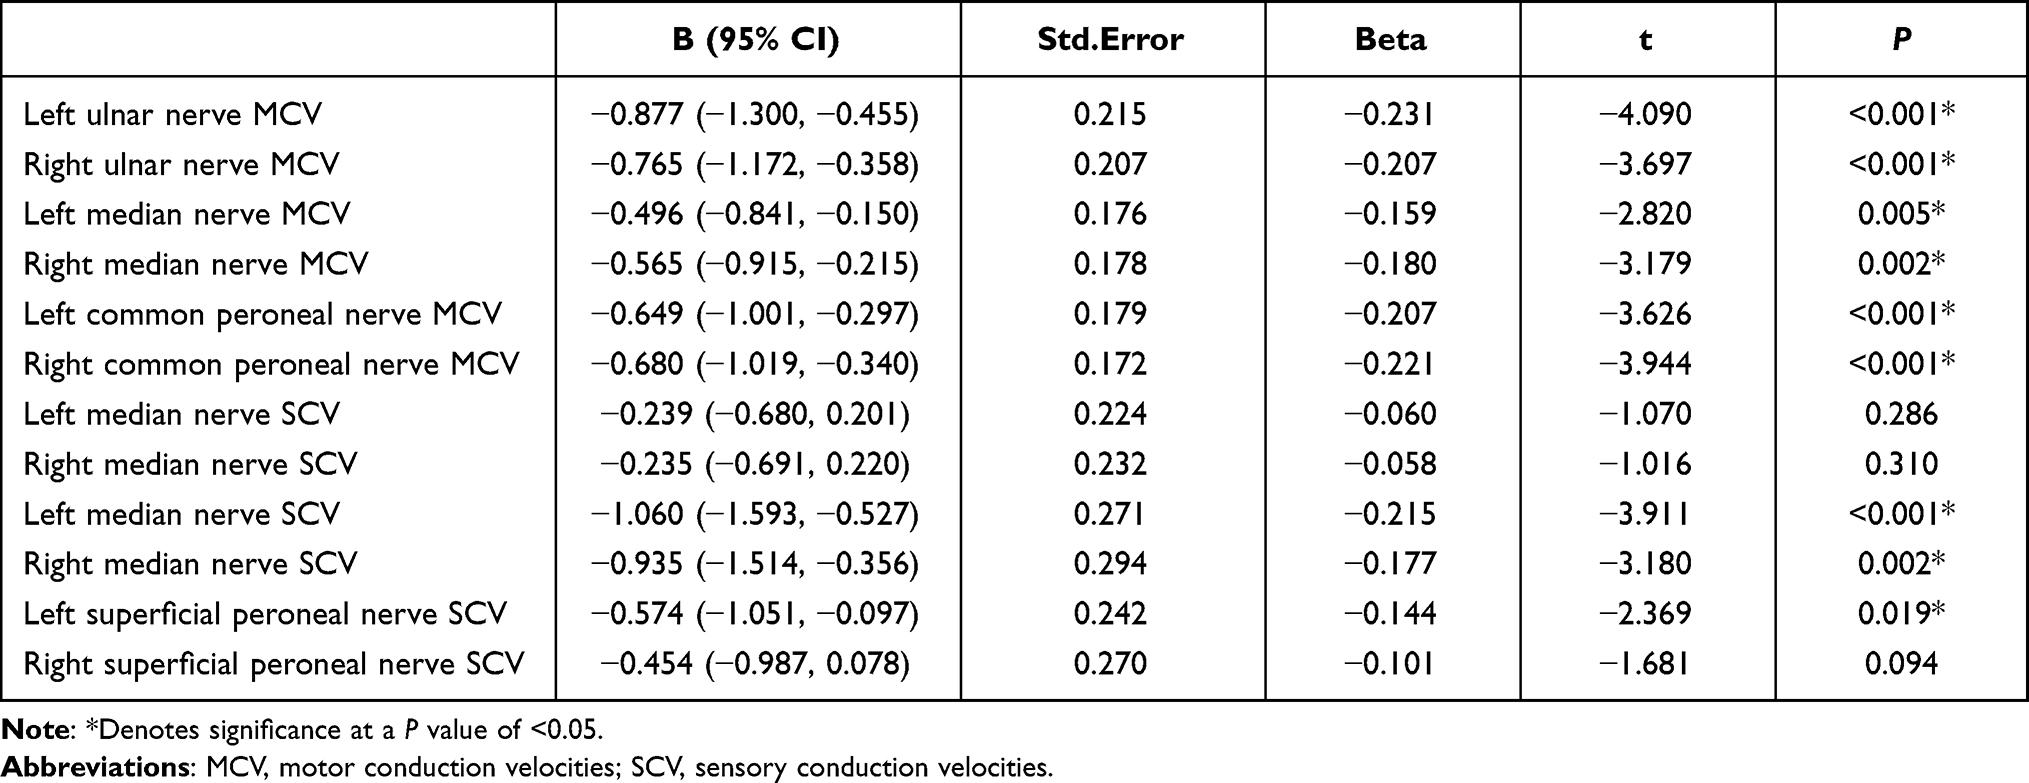 |
Table 9 Correlation of HGI with Different Nerve Conduction Velocities in Patients with T2DM in Model 3 |
However, there was no correlation between HGI and bilateral ulnar nerve SCV or right superficial peroneal nerve SCV, regardless of adjusted or non-adjusted confounding factors.
Discussion
HGI is another indicator of blood glucose, which reflects an individual’s tendency to glycosylate. Individuals with high HGI levels have higher HbA1c levels than expected.17 Previous studies mainly focused on the relationship between HGI and cardiovascular complications, diabetic nephropathy, diabetic retinopathy. To our knowledge, this is the first study to investigate the relationship between HGI and NCV in patients with T2DM.
DN is the most common complication of type 2 diabetes, and DPN is the most common type of DN. The occurrence and development of DN can be explained by various etiologies, including increased activity of polyols and hexose channels,1 oxidative stress, complex inflammatory processes, endothelial dysfunction, increased advanced glycation end products (AGEs), and vitamin D deficiency.9,18–20 This study found that T2DM patients with high HGI levels were more susceptible to NCVA and that HGI levels were independently negatively correlated with NCV. Therefore, we suggest that high HGI levels are a risk factor for DN. Following are some possible mechanisms.
First, HGI was proposed to identify glucose metabolism phenotypes, and patients with high HGI levels have a higher sensitivity to protein glycosylation and higher levels of AGEs in tissues.21 Previous studies showed that individuals with high HGI levels had higher concentrations of AGEs in many tissues, including the liver and skin.16,22 The accumulation of AGEs is an essential mechanism for the development of DN. I. Misur et al found that AGEs can be detected on the axons and myelin sheaths of peripheral nerves in patients with DN and that the level of AGEs was positively correlated with the severity of DN.23 The significant mechanisms of nerve damage caused by AGEs are cross-link formation and AGEs interaction with AGEs receptors.24 AGEs can form cross-links with proteins such as basement membrane, cell matrix, blood vessel wall components, and mitochondrial electron transport chain-related proteins. This kind of cross-link can affect the protein’s normal structure and function.25 Moreover, intracellular AGEs can induce DNA and nuclear protein alterations, further affecting protein transport and function.23 Interaction of AGEs with AGE receptors can alter intracellular signaling, including activation of protein kinase C (PKC) isoforms, induction of oxidative stress, activation of NF-KB signaling pathway, promotion of pro-inflammatory factor production and free radical release, and this alteration can ultimately lead to inflammation and apoptosis production.24,26,27 The combination of these mechanisms results in impaired blood flow to the peripheral nerves and impaired nutritional support.
The second possible mechanism is the high HGI levels can affect vitamin D levels, ultimately affecting NCV. Studies also found that vitamin D deficiency is involved in developing DN,28,29 and supplementation of Vitamin D can also improve DN.9,30 Previously, one of our studies found that T2DM patients with high HGI levels were more susceptible to vitamin D deficiency and that HGI levels were inversely associated with vitamin D levels.31 This study also found that the NCVN group had lower vitamin D levels and a higher prevalence of vitamin D deficiency than the NCVA group. Vitamin D is a potent neurotrophic factor, and it is involved in the formation of neurotransmitters.30 In addition, vitamin D can reduce insulin resistance by binding to the vitamin D receptor, and reducing the production of inflammatory factors, etc.32,33 Therefore, when vitamin D is deficient, it can diminish neurotrophic support, affect glucose metabolism, and ultimately lead to reduced NCV. Hence, we suggest that high HGI levels can affect NCV by affecting vitamin D levels.
In addition, HGI could reflect hyperglycemic fluctuations, and patients with high HGI levels have higher postprandial blood glucose levels.34 Postprandial glucose fluctuation can impair NCV by affecting endothelial function, increasing the inflammatory response and oxidative stress.35 Liu et al found that high HGI levels were associated with higher inflammatory markers,36 possibly causing DN.
This study has some limitations. First, the study adopted a cross-sectional method, and it cannot confirm the negative association between NCV and HGI. Second, this is a single-center clinical study. Moreover, there was no correlation between HGI and bilateral ulnar nerve SCV or right superficial peroneal nerve SCV. More extensive clinical and basic studies are required to clarify the specific relationship between HGI and differences in NCVs and the underlying mechanisms.
In conclusion, this study found that HGI was negatively correlated with the NCV, regardless of adjusted or non-adjusted confounding factors. The results indicate that high HGI is a risk factor for NCV in T2DM patients.
Disclosure
The authors report no conflicts of interest in this work.
References
1. Feldman EL, Callaghan BC, Pop-Busui R, et al. Diabetic neuropathy. Nat Rev Dis Prim. 2019;5(1):42.
2. Fitri A, Sjahrir H, Bachtiar A, Ichwan M, Fitri FI, Rambe AS. Predictive model of diabetic polyneuropathy severity based on Vitamin D level. Open Access Macedonian j Med Sci. 2019;7(16):2626–2629. doi:10.3889/oamjms.2019.454
3. Yokoyama H, Tsuji T, Hayashi S, Kabata D, Shintani A. Factors associated with diabetic polyneuropathy-related sensory symptoms and signs in patients with polyneuropathy: a cross-sectional Japanese study (JDDM 52) using a non-linear model. J Diabetes Investig. 2020;11(2):450–457. doi:10.1111/jdi.13117
4. Pop-Busui R, Boulton AJ, Feldman EL, et al. Diabetic neuropathy: a position statement by the American Diabetes Association. Diabetes Care. 2017;40(1):136–154. doi:10.2337/dc16-2042
5. Ponirakis G, Elhadd T, Chinnaiyan S, et al. Prevalence and risk factors for diabetic neuropathy and painful diabetic neuropathy in primary and secondary healthcare in Qatar. J Diabetes Invest. 2021;12(4):592–600. doi:10.1111/jdi.13388
6. Stino AM, Smith AG. Peripheral neuropathy in prediabetes and the metabolic syndrome. J Diabetes Investig. 2017;8(5):646–655. doi:10.1111/jdi.12650
7. Won JC, Park TS. Recent advances in diagnostic strategies for diabetic peripheral neuropathy. Endocrinol Metabol. 2016;31(2):230–238. doi:10.3803/EnM.2016.31.2.230
8. Sánchez-Pozos K, Monroy-Escutia J, Jaimes-Santoyo J, Granados-Silvestre M, Menjivar M, Ortiz-López MG. Risk factors associated with diabetic neuropathy in Mexican patients. Cir Cir. 2021;89(2):189–199. doi:10.24875/CIRU.20000243
9. Karonova T, Stepanova A. High-Dose Vitamin D supplementation improves microcirculation and reduces inflammation in diabetic neuropathy patients. Nutrients. 2020;12:9.
10. Esteghamati A, Fotouhi A, Faghihi-Kashani S, et al. Non-linear contribution of serum vitamin D to symptomatic diabetic neuropathy: a case-control study. Diabetes Res Clin Pract. 2016;111:44–50. doi:10.1016/j.diabres.2015.10.018
11. Chalew SA, McCarter RJ, Hempe JM. Biological variation and hemoglobin A1c: relevance to diabetes management and complications. Pediatr Diabetes. 2013;14(6):391–398. doi:10.1111/pedi.12055
12. Li K, Song WJ, Wu X, et al. Associations of serum glucagon levels with glycemic variability in type 1 diabetes with different disease durations. Endocrine. 2018;61(3):473–481. doi:10.1007/s12020-018-1641-1
13. Kim W, Go T, Kang DR, Lee EJ, Huh JH. Hemoglobin glycation index is associated with incident chronic kidney disease in subjects with impaired glucose metabolism: a 10-year longitudinal cohort study. J Diabetes Complications. 2021;35(1):107760. doi:10.1016/j.jdiacomp.2020.107760
14. van Steen SC, Woodward M, Chalmers J, et al. Haemoglobin glycation index and risk for diabetes-related complications in the Action in Diabetes and Vascular Disease: preterax and Diamicron Modified Release Controlled Evaluation (ADVANCE) trial. Diabetologia. 2018;61(4):780–789. doi:10.1007/s00125-017-4539-1
15. McCarter RJ, Hempe JM, Gomez R, Chalew SA. Biological variation in HbA1c predicts risk of retinopathy and nephropathy in type 1 diabetes. Diabetes Care. 2004;27(6):1259–1264. doi:10.2337/diacare.27.6.1259
16. Hempe JM, Liu S, Myers L, McCarter RJ, Buse JB, Fonseca V. The hemoglobin glycation index identifies subpopulations with harms or benefits from intensive treatment in the ACCORD trial. Diabetes Care. 2015;38(6):1067–1074. doi:10.2337/dc14-1844
17. Soros AA, Chalew SA, McCarter RJ, Shepard R, Hempe JM. Hemoglobin glycation index: a robust measure of hemoglobin A1c bias in pediatric type 1 diabetes patients. Pediatr Diabetes. 2010;11(7):455–461. doi:10.1111/j.1399-5448.2009.00630.x
18. Oates PJ. Aldose reductase, still a compelling target for diabetic neuropathy. Current Drug Targets Jan. 2008;9(1):14–36. doi:10.2174/138945008783431781
19. Van Dam PS, Cotter MA, Bravenboer B, Cameron NE. Pathogenesis of diabetic neuropathy: focus on neurovascular mechanisms. Eur J Pharmacol. 2013;719(1–3):180–186. doi:10.1016/j.ejphar.2013.07.017
20. Jende JME, Groener JB, Oikonomou D, et al. Diabetic neuropathy differs between type 1 and type 2 diabetes: insights from magnetic resonance neurography. Ann Neurol. 2018;83(3):588–598. doi:10.1002/ana.25182
21. Kim MK, Jeong JS, Yun JS, et al. Hemoglobin glycation index predicts cardiovascular disease in people with type 2 diabetes mellitus: a 10-year longitudinal cohort study. J Diabetes Complications. 2018;32(10):906–910. doi:10.1016/j.jdiacomp.2018.08.007
22. Felipe DL, Hempe JM, Liu S, et al. Skin intrinsic fluorescence is associated with hemoglobin A(1c)and hemoglobin glycation index but not mean blood glucose in children with type 1 diabetes. Diabetes Care. 2011;34(8):1816–1820. doi:10.2337/dc11-0049
23. Misur I, Zarković K, Barada A, Batelja L, Milicević Z, Turk Z. Advanced glycation endproducts in peripheral nerve in type 2 diabetes with neuropathy. Acta Diabetol. 2004;41(4):158–166. doi:10.1007/s00592-004-0160-0
24. Chilelli NC, Burlina S, Lapolla A. AGEs, rather than hyperglycemia, are responsible for microvascular complications in diabetes: a “glycoxidation-centric” point of view. Nutri Metabol Cardiovasc Dis. 2013;23(10):913–919. doi:10.1016/j.numecd.2013.04.004
25. Vincent AM, Calabek B, Roberts L, Feldman EL. Biology of diabetic neuropathy. Handb Clin Neurol. 2013;115:591–606.
26. Yeh CH, Sturgis L, Haidacher J, et al. Requirement for p38 and p44/p42 mitogen-activated protein kinases in RAGE-mediated nuclear factor-kappaB transcriptional activation and cytokine secretion. Diabetes. 2001;50(6):1495–1504. doi:10.2337/diabetes.50.6.1495
27. Yan SF, Ramasamy R, Naka Y, Schmidt AM. Glycation, inflammation, and RAGE: a scaffold for the macrovascular complications of diabetes and beyond. Circ Res. 2003;93(12):1159–1169. doi:10.1161/01.RES.0000103862.26506.3D
28. Shehab D, Al-Jarallah K, Mojiminiyi OA, Al Mohamedy H, Abdella NA. Does Vitamin D deficiency play a role in peripheral neuropathy in Type 2 diabetes?. Diabetic Med. 2012;29(1):43–49.
29. Soderstrom LH, Johnson SP, Diaz VA, Mainous AG
30. Ghadiri-Anari A, Mozafari Z, Gholami S, et al. Dose vitamin D supplementations improve peripheral diabetic neuropathy? A before-after clinical trial. Diabetes Metab Syndr. 2019;13(1):890–893. doi:10.1016/j.dsx.2018.12.014
31. Li Z, Wang F, Jia Y, Guo F, Chen S. The relationship between hemoglobin glycation variation index and Vitamin D in Type 2 diabetes mellitus. Diabetes Metabol Syndr Obes. 2021;14:1937–1948. doi:10.2147/DMSO.S310672
32. Bourlon PM, Billaudel B, Faure-Dussert A. Influence of vitamin D3 deficiency and 1,25 dihydroxyvitamin D3 on de novo insulin biosynthesis in the islets of the rat endocrine pancreas. J Endocrinol. 1999;160(1):87–95. doi:10.1677/joe.0.1600087
33. Zeitz U, Weber K, Soegiarto DW, Wolf E, Balling R, Erben RG. Impaired insulin secretory capacity in mice lacking a functional vitamin D receptor. FASEB J. 2003;17(3):509–511. doi:10.1096/fj.02-0424fje
34. Riddle MC, Gerstein HC, Hempe, et al. The hemoglobin glycation index identifies subpopulations with harms or benefits from intensive treatment in the ACCORD trial. Diabetes Care 2015;38:1067-1074. Diabetes Care. 2015;38(10):e170–171. doi:10.2337/dc15-1073
35. Pai YW, Lin CH, Lee IT, Chang MH. Variability of fasting plasma glucose and the risk of painful diabetic peripheral neuropathy in patients with type 2 diabetes. Diabetes Metab. 2018;44(2):129–134. doi:10.1016/j.diabet.2018.01.015
36. Liu S, Hempe JM, McCarter RJ, Li S, Fonseca VA. Association between inflammation and biological variation in hemoglobin A1c in U.S. nondiabetic adults. J Clin Endocrinol Metabol. 2015;100(6):2364–2371. doi:10.1210/jc.2014-4454
 © 2021 The Author(s). This work is published and licensed by Dove Medical Press Limited. The full terms of this license are available at https://www.dovepress.com/terms.php and incorporate the Creative Commons Attribution - Non Commercial (unported, v3.0) License.
By accessing the work you hereby accept the Terms. Non-commercial uses of the work are permitted without any further permission from Dove Medical Press Limited, provided the work is properly attributed. For permission for commercial use of this work, please see paragraphs 4.2 and 5 of our Terms.
© 2021 The Author(s). This work is published and licensed by Dove Medical Press Limited. The full terms of this license are available at https://www.dovepress.com/terms.php and incorporate the Creative Commons Attribution - Non Commercial (unported, v3.0) License.
By accessing the work you hereby accept the Terms. Non-commercial uses of the work are permitted without any further permission from Dove Medical Press Limited, provided the work is properly attributed. For permission for commercial use of this work, please see paragraphs 4.2 and 5 of our Terms.