")
Back to Journals » Hepatic Medicine: Evidence and Research » Volume 15
Confounders of Serum Phosphatidylethanol: Role of Red Blood Cell Turnover and Cirrhosis
Authors Bartel M , Hofmann V, Wang S, Mueller J , Sundermann TR, Mueller S
Received 21 June 2023
Accepted for publication 14 October 2023
Published 1 November 2023 Volume 2023:15 Pages 195—208
DOI https://doi.org/10.2147/HMER.S420732
Checked for plagiarism Yes
Review by Single anonymous peer review
Peer reviewer comments 3
Editor who approved publication: Dr Gerry Lake-Bakaar
Marc Bartel,1,* Vanessa Hofmann,1,* Shijin Wang,2,3 Johannes Mueller,2 Tom R Sundermann,1 Sebastian Mueller2
1Institute of Forensic and Traffic Medicine, Heidelberg University Hospital, Heidelberg, Germany; 2Center for Alcohol Research, University Hospital Heidelberg, Heidelberg, Germany; 3Department of Gastroenterology, The Affiliated Hospital of Qingdao University, Shandong, People’s Republic of China
*These authors contributed equally to this work
Correspondence: Sebastian Mueller, Center for Alcohol Research, University Hospital Heidelberg, Im Neuenheimer Feld 350, Heidelberg, 69120, Germany, Tel +49 (0) 6221 567121, Email [email protected]
Purpose: Ethyl glucuronide (EtG), ethyl sulfate (EtS) and phosphatidylethanol (PEth) are considered specific direct biomarkers for detecting alcohol consumption. However, PEth, which is produced in red blood cells (RBC), varies considerably between patients for unknown reasons. We here studied various confounders of PEth elimination including fibrosis after alcohol withdrawal.
Patients and Methods: EtG, EtS and PEth together with routine laboratory and clinical parameters were studied in 100 Caucasian heavy drinkers prior and after alcohol detoxification. In addition, fibrosis stage and degree of steatosis were assessed by transient elastography (Fibroscan, Echosens, Paris).
Results: All three biomarkers were highly correlated (0.61– 0.72) with initial serum alcohol levels, but only PEth correlated with daily alcohol consumption. After alcohol withdrawal, PEth significantly decreased within 6.1 days from 1708 to 810 ng/mL (half-life varied from 1.6 to 15.2 days). Both levels of serum alcohol but also EtG and EtS were higher in patients with liver cirrhosis as compared to patients without fibrosis despite comparable alcohol consumption suggesting a decreased alcohol elimination in patients with cirrhosis. PEth was also elevated in cirrhosis but not significantly. In contrast, PEth elimination rate was significantly higher in patients with enhanced RBC turnover and signs of alcohol-mediated hemolytic anemia with elevated ferritin, LDH and increased mean corpuscular volume (MCV).
Conclusion: We here demonstrate that alcohol elimination is decreased in patients with liver cirrhosis. In patients with cirrhosis, PEth levels are both affected in opposite directions by enhanced red blood cell turnover and elevated alcohol levels. Our data have important implications for the use and interpretation of PEth in the clinical setting.
Keywords: ethyl glucuronide, ethyl sulfate, alcohol-related liver disease, liver fibrosis, liver stiffness, alcohol consumption
Introduction
According to the WHO, alcohol consumption is a worldwide health problem both for the global years of life lost but also mortality.1 Chronic alcohol consumption is also the cause of alcohol-related liver disease (ALD), the most common liver disease worldwide accounting for more than half of all liver-related deaths.2 Alcohol-related liver cirrhosis is also a major risk factor for hepatocellular carcinoma and the third leading cause of cancer mortality worldwide.3 In addition, alcohol is also known to significantly contribute to a number of other cancer types including breast cancer and colon cancer.4,5
Despite the enormous impact of alcohol on health and disease, we still lack markers to accurately assess alcohol drinking behavior. This is not only a significant barrier for the diagnosis and treatment of alcohol abuse and related diseases but also for our deeper understanding of alcohol-related disease mechanisms and more specific management and decision-making eg in the context of organ distribution in the transplant setting or in forensic medicine. Although brief surveys such as AUDIT-C6 or CAGE7 are still considered the “gold standard” for assessing alcohol use patterns,8 they lack an objective and quantitative description of the drinking history.9 Moreover, quantifiable biomarkers to unequivocally assess alcohol consumption retrospectively across days or weeks have remained more elusive.10
In contrast to indirect markers such as mean corpuscular volume (MCV), carbohydrate-deficient transferrin (CDT) or γ-glutamyl transferase (GGT), so-called direct biomarkers such as ethyl glucuronide (EtG), ethyl sulfate (EtS) or the 16:0/18:1 phosphatidylethanol homologue (normally abbreviated as PEth) are ethanol-specific.11–14 While EtG and EtS can be detected in whole blood, serum, urine and hair (only EtG), PEth cannot be measured in urine and is usually measured in whole blood. A major limitation of EtG and EtS is that they have a rather short half-life in blood and urine of eg 2–3 hours in the case of EtG with a renal clearance of 8.3 liters per hour15,16 and 3.6 liters per hour for EtS.16 At rather high costs and with other limitations, EtG can be extracted from hair indicating chronic drinking over several months.17
Compared to EtG and EtS in urine, the detection window of PEth is enlarged rendering it an interesting candidate for long-term alcohol intake monitoring.12,18,19 While different PEth homologues were originally detected using high performance liquid chromatography and evaporative light scattering detection with detection limits of 0.22 µmol/L (approximately 154 ng/mL),20 individual PEth homologues are increasingly measured using liquid chromatography with tandem mass spectrometry.21 The most prevalent homologue is PEth 16:0/18:1 that accounts normally for about 40% of total PEth with a detection limit of approximately 5 ng/mL.21 The detection of the second most common PEth homologue, 16:0/18:2, improved PEth detection only by 1% as compared to PEth 16:0/18:1.22
One still unresolved challenge with PEth is the fact that formation and elimination seem to depend interindividually from still poorly understood conditions. PEth is normally formed in red blood cells (RBCs) with ethanol from phosphatidylcholine by a reaction catalyzed by phospholipase D (PLD).19,23–26 In fact, RBCs form the largest phospholipid pool in the blood. PEth has been detectable at high levels in whole blood in persons entering alcohol treatment/detoxification.27–29 In contrast, no PEth has been detectable in samples from persons in closed-ward facilities without access to alcohol.30 Consequently, the rate of PEth formation depends on PLD activity which can have large inter-individual variation19 and has been proposed to be useful for the normalization of PEth measurements.31
The average time in which PEth concentration is halved in the absence of new PEth formation (the PEth half-life) was reported to be approximately 4 days for combined PEth (16:0/18:1 plus 16:0/18:2), with half-lives up to 12 days and 7.8 days for PEth 16:0/18:1 in recent publications.22,32–34 The causes of variability in the PEth elimination are unknown35 but was recently related to levels of AST, GGT, ferritin or HDL-cholesterol.36 In drinking studies, a biphasic kinetic of PEth was observed with higher initial PEth elimination rates for higher blood alcohol levels and slower elimination rates once reaching lower blood alcohol levels so that a high initial elimination rate can be distinguished from a low terminal elimination rate.29,34 In addition to the poorly understood kinetics of PEth, there is insufficient knowledge about the status of liver fibrosis on the formation of direct alcohol biomarkers such as PEth.37 Moreover, even the metabolism of ethanol in patients with cirrhosis and its consequences on alcohol levels has only been occasionally addressed with a few patients.38–40
Therefore, we here aimed at systematically studying the direct biomarkers EtG, EtS, and PEth in heavy drinkers undergoing in-hospital alcohol detoxification. The study was triggered in particular by recent observations in our 15-year mortality study in heavy drinkers that hemolytic anemia and enhanced RBC turnover are critical for survival in ALD patients.41,42 The lifecycle and lifespan of RBCs has been studied for decades.43–46 These data also show that RBC turnover is not primarily due to deficiency eg of folic acid or vitamin B12 but rather to direct toxicity to RBCs and the bone marrow stem cell compartment of precursor cells.41,46 Moreover, enhanced alcohol-mediated RBC turnover can be evidenced by increased serum levels of the hemoglobin-haptoglobin scavenger receptor CD163 and by elevation of LDH, ferritin and MCV.46
In view of the recently identified RBC turnover in drinkers and the role of erythrocyte phospholipase D for PEth formation, the main objective of the present study was to identify confounding factors namely of the RBC compartment that affect the elimination rate of PEth. Furthermore, we aimed to study the role of fibrosis stage based on the newly introduced non-invasive transient elastography prior and after alcohol detoxification.
Patients and Methods
Patients and Study Design
We studied 100 Caucasian patients that were enrolled from 2017 to 2020 at Salem Medical Center Heidelberg, respectively. The study design is shown in Figure 1 and patient’s characteristics are shown in Table 1. All patients with ALD were heavy drinkers (>80 g per day in males and >60 g per day in females) with a mean alcohol consumption of 211 g/day. The study protocol conformed to the ethical guidelines of the 1975 Declaration of Helsinki and was reviewed and approved by the local Ethics Committee of the Medical Faculty of the University of Heidelberg (S150-15) and all patients gave written informed consent prior to inclusion. Routine laboratory markers, liver stiffness and direct ethanol biomarkers were studied in all patients upon alcohol detoxification over a mean detoxification period of 6.1 ± 2.4 days (3 to 21 days). All patients underwent careful clinical examination, standard serological testing (venous blood sampling), abdominal ultrasound and liver stiffness (LS) measurement by transient elastography (TE; Fibroscan, Echosens SA, Paris, France), respectively. At the beginning and end of their stay, blood samples were collected in EDTA tubes (Sarstedt AG & Co. KG, Numbrecht, Germany), within 15 min frozen down to −20°C. After 24 hours, samples were transferred to −80°C until further analysis. Hepatic fat content was further assessed with the Fibroscan device by measuring the controlled attenuation parameter (CAP).47 Other causes of liver diseases were ruled out in all patients serologically by screening for AMA, ANA, HBV, and HCV as described recently.48
 |
Table 1 Patient Characteristics |
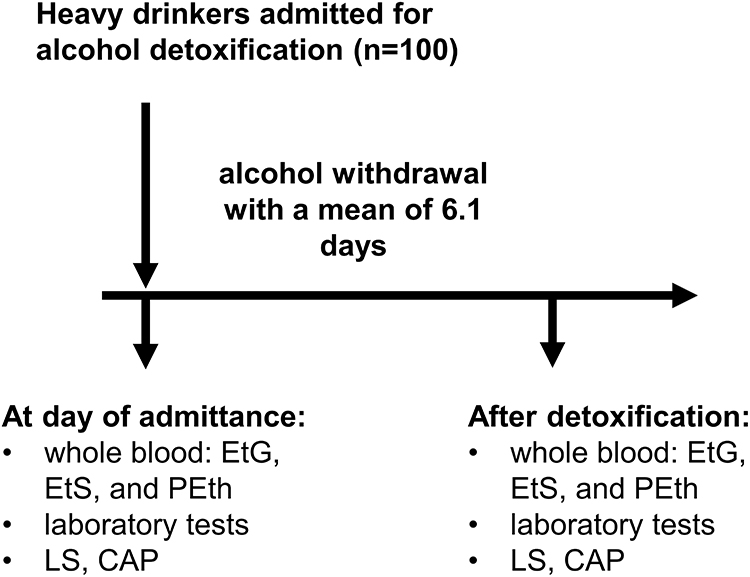 |
Figure 1 Study design. |
Transient Elastography and CAP
LS was measured by transient elastography (Fibroscan, Echosens, Paris, France). TE was performed by physicians with at least 12 months of experience in abdominal ultrasound and transient elastography on the right lobe of the liver in intercostal position according to established protocols.11 Fibrosis stages were determined using recently established algorithms including the consideration of transaminase levels.11,49 CAP was used to non-invasively assess steatosis on the Fibroscan platform.47 CAP values are expressed in dB/m and range from 100 to 400 dB/m. In addition, liver size, spleen size, ascites formation and semiquantitative liver steatosis (0–3) were assessed by abdominal ultrasound.
Reagents for Biomarker Measurements
16:0/18:1-phosphatidylethanol sodium salt was delivered by Sigma-Aldrich Chemie GmbH (Taufkirchen, Germany). Ethyl glucuronide and ethyl sulfate were obtained from Lipomed GmbH (Weil am Rhein, Germany). The internal standards ethyl glucuronide-d5, ethyl sulfate-d5 were purchased from Lipomed GmbH (Weil am Rhein, Germany) and 16:0/18:1-phosphatidylethanol-d5 from Echelon Biosciences Inc. (Salt Lake City, UT, USA). Methanol ROTISOLV® HPLC, ammonium formate (≥95%), acetonitrile ROTISOLV® HPLC, and 2-propanol ROTISOLV® LC-MS-grade (≥99%) were purchased from Carl Roth GmbH + Co KG (Karlsruhe, Germany). Pure water Ampuwa® was purchased from Fresenius Kabi (Bad Homburg, Germany). Human blood for calibration (free from ethanol, ethyl glucuronide, ethyl sulfate, and phosphatidylethanol) was donated voluntarily by a venous puncture at the Institute of Forensic and Traffic Medicine and stored in lithium heparin tubes (Sarstedt AG & Co. KG, Numbrecht, Germany).
Blood Levels of EtG, EtS and PEth
EtG, EtS and PEth were measured at the Institute of Forensic and Traffic Medicine, Heidelberg University Hospital, from frozen samples taken in patients at Salem Medical Center, Heidelberg, Germany. The sample preparation and mass spectrometric analysis were performed accordingly to the previously published method.50 In brief, 150 µL of whole blood were spiked with internal standard (each deuterated analyte). The protein precipitation was performed by adding 750 µL of MeOH and subsequently mixing of the sample. Afterwards, the sample was centrifuged for 10 min at 2.1×1000 g, the organic layer was transferred into a vial and dried under a gentle stream of nitrogen. Finally, the residue was resuspended, filtered through a micro-spin filter (Thermo Fisher Scientific Inc., Waltham, MA, USA) and subsequently centrifuged for 3 min. The analyses were performed using high-performance liquid chromatography and tandem mass spectrometry (HPLC-MS/MS). An HPLC (Agilent 1100 series, Agilent Technologies Inc., Santa Clara, CA, USA) was combined with an API 4000 tandem mass spectrometer equipped with a TurboIon Spray source (Applied Biosystems Sciex, Darmstadt, Germany). Standard calibration curves with sample concentrations between 10 and 1000 ng/mL were used for EtG, EtS and PEth. The measurement of samples with higher concentrations proofed that a determination up to 50.000 ng/mL for EtG and EtS and up to 10.000 ng/mL is possible with high accuracy. Quantification and evaluation of the results were performed with the Analyst Software 1.4 (Applied Biosystems Sciex) by integration of the chromatograms generated from the multiple reaction monitoring (MRM) mode.
Serum Levels of M30, M65 and CD163
CD163 was measured in serum by ELISA using Human CD163 DuoSet ELISA delivered by R&D Systems, Inc. (Minneapolis, USA) using standard protocols and as described recently.41 It is important to note that CD163 was only measured in a smaller group of patients (N=21). For liver apoptosis, the M30-Apoptosense ELISA according to the manufacturer’s instructions (Peviva, Bromma, Sweden) and the M65 ELISA (Peviva) were used to quantify both uncleaved and caspase-cleaved K18.48
Statistics
All statistics were performed using Excel (Microsoft) or SPSS 12 (IBM). For descriptive statistics, we calculated the mean and standard deviation for parametric distributed parameters or percentages or counts for ordinal/categorial parameters. For comparison of groups, we used the independent samples t-test and for follow-up data we used the paired-samples t-test. Results were considered significant for P-values <0.05. Correlation analysis was performed using Spearman’s rank order correlation coefficient. P values were also corrected for multiple comparisons using the Bonferroni method where the alcohol biomarkers were defined as in the same family, hemoglobin, erythrocyte count and hemoglobin were defined as in the same family and M65 and M30 were defined as in the same family. Significant results after correction for multiple comparisons are indicated with asterisks. For the decrease of PEth after alcohol detoxification we assumed an exponential decrease of PEth of the form PEthafter = PEthbefore * EXP(k * t1), t0 = 0, were PEthbefore are the PEth levels at the day of admission, PEthafter are the PEth levels after alcohol detoxification, k is the decay constant and t0 and t1 are the time points of admission and after detoxification, respectively. The decay constant k of the decrease of PEth can then be calculated by k = ln(PEthafter / PEthbefore) / t1. The half-life of the decrease was calculated according to t1/2 = ln(2) / k. Grouping of patients according to high/low hemoglobin (Hb) and serum ferritin levels was performed as already shown recently.48 Cutoffs used were 14 g/dL for Hb and 400 ng/mL for ferritin.
Results
Patient Characteristics
Patient characteristics are shown in Table 1. The study included 100 heavy drinkers primarily presenting for alcohol detoxification. The mean initial serum alcohol level was 1.02 g/L and after detoxification alcohol was not detectable in all patients. Mean daily alcohol consumption was 212-g alcohol over a mean heavy drinking period of 12.5 years. Furthermore, 72% of the patients were male. Levels of all direct alcohol biomarkers reflected heavy alcohol consumption before admittance. Mean levels at day of admission were 1233 ng/mL, 464 ng/mL and 1708 ng/mL for EtG, EtS and PEth, respectively. In-hospital detoxification time ranged from 2 to 21 days (mean 6.1±2.4 days). In abdominal ultrasound, 10.6% had sure signs of cirrhosis such as nodular aspect of the liver surface and 3.1% had manifest ascites. Based on transient elastography and using AST-adapted cutoff values,49,51 any fibrosis could be ruled out in half of all patients despite a mean liver stiffness of 14.1 kPa. In detail, fibrosis distribution for fibrosis stages F0, F1-2, F3 and F4 were 49%, 25%, 12% and 14%, respectively. The mean CAP values of 296.6 dB/m were clearly above the cutoff value of 280 dB/m to rule in any steatosis52 indicating pronounced steatosis. Remaining routine laboratory parameters showed typical profile of an alcohol cohort with AST levels greater than ALT levels, elevated levels of GGT, AP and ferritin.11 However, with a bilirubin of 1.15 mg/dL and an INR of 0.98, no severe liver synthesis impairment was noted.
EtG, EtS and PEth During Alcohol Withdrawal
The in-hospital detoxification with confirmed abstaining from alcohol allowed us to assess elimination of direct biomarkers during a mean of about a week of alcohol detoxification. The mean initial EtG and EtS serum levels were 1233 and 464 ng/mL, respectively, and both markers were not detectable after detoxification which could be expected due to the known short half-life in blood in the hour range of both markers.15,16 In contrast, PEth was still significantly elevated after alcohol withdrawal and decreased by 52.6% (range plus 3.8% to minus 95%) from an initial mean concentration of 1708 ng/mL (range 23.3 to 6490 ng/mL) to a mean concentration of 810 ng/mL after detoxification. Only in one patient no PEth was detectable after 21 days of alcohol withdrawal. In accordance with previous studies, PEth elimination varied considerably between all patients with a mean half-life of 7.1±5.9 days (range 1.6–15.2 days) and a mean exponential decay constant of 0.14±0.08 days−1.
Correlation Analysis of Direct Biomarkers
In comparison to routine laboratory parameters, the three direct ethanol biomarkers showed the highest correlation (r=0.61–0.72, P<0.0001) with initial serum alcohol levels (see Table 2), with EtS and EtG being slightly superior to PEth. However, PEth was best correlated with reported daily alcohol consumption (r=0.31, P<0.01) and almost no difference was seen with PEth levels before and about 1 week after the start of the alcohol detoxification. Of note, there were important differences between PEth and EtG/EtS. Thus, PEth was significantly higher associated with markers of liver damage and apoptosis such as AST, ALT, M30 and M65 and with steatosis as measured by CAP. Notably, PEth was significantly and positively associated with hemoglobin, LDH and HDL cholesterol. Although not significant, PEth was also positively associated with the erythrophagocytosis marker CD163. In contrast, a negative association was seen with EtG and EtS for CD163 and bilirubin levels. Finally, all three direct biomarkers were equally and significantly associated with ferritin and liver stiffness. In summary, we here provide the first evidence that, in contrast to EtG and EtS, PEth levels are highly associated with daily alcohol consumption. Moreover, PEth levels are associated with indirect signs of hemolysis which is increased during heavy alcohol consumption.41
 |
Table 2 Correlation of Direct Ethanol Biomarkers EtG, EtS and PEth with Routine Laboratory, Clinical Parameters, Liver Stiffness and Hepatic Steatosis (CAP) |
Effect of Liver Cirrhosis/Stiffness on PEth Elimination and Levels of Alcohol and Biomarkers
We next compared patients with no signs of cirrhosis and normal LS (F0, LS ≤ 6 kPa, n=49) with patients with F4 cirrhosis (LS ≥ 12.5 kPa, n=22).53 Major data are shown in Table 3. LS values differed significantly between both groups (4.6 vs 42.8 kPa, P<0.0001).
 |
Table 3 Comparison Between Patients with No Fibrosis and Cirrhosis. Fibrosis Stage Was Determined by Liver Stiffness Measurement Using a Cutoff Value of <6 kPa for No Fibrosis and >12.5 kPa for Cirrhosis. PEth1: PEth Levels Before Alcohol Detoxification, PEth2: PEth Levels After Alcohol Detoxification |
Surprisingly, initial serum alcohol levels were significantly elevated (0.6 vs 1.7 g/L, P<0.001) in patients with cirrhosis despite a comparable daily alcohol consumption (see Table 3). This strongly suggests that alcohol is accumulating in patients with liver cirrhosis. In line with this, levels of EtG, EtS and PEth were all elevated in the cirrhosis group. Of note, the short-term biomarkers EtG and EtS were statistically significant, while PEth only showed a tendency without statistical significance.
Table 3 further shows direct and indirect indications of enhanced RBC turnover in the cirrhosis group with decreased hemoglobin and haptoglobin, and elevated ferritin, MCV and LDH.
CD163 was also increased in patients with cirrhosis but did not reach levels of significance since serum for CD163 detection was only available in a smaller fraction of patients (LS ≤ 6 kPa: N=11, LS ≥ 12.5 kPa: N=2). On a final note, PEth elimination did not differ significantly between fibrosis stage (exponential decay constant: 0.14 vs 0.15) nor did the PEth half-life (7.6 vs 5.7 days) (not shown). In summary, these data suggest that patients with manifest cirrhosis have accumulating serum alcohol levels despite comparable daily alcohol consumption rates suggesting a decreased alcohol elimination in cirrhosis. In line with this, short-term direct biomarkers EtG and EtS were elevated but not the long-term biomarker PEth, most likely due to enhanced hemolysis and erythrophagocytosis in patients with cirrhosis.
Factors Modulating PEth Elimination
We next looked for patient-related parameters that are associated with the PEth elimination constant. Spearman rho correlation is shown in Table 4A sorted by the P value. Levels of significance (P<0.05) are marked in bold. First, Table 4A demonstrates an inverse correlation with erythrocyte count but positive correlation with levels of ferritin underlining the role of hemolysis for the PEth turnover. This is further underscored by the positive correlation with mean corpuscular volume (MCV), bilirubin, iron parameters such as transferrin saturation and serum iron or signs of liver damage such as elevated levels of M65. Accordingly, patients could also be split into fast and slow PEth eliminators (see Table 4B). Typical fast PEth eliminators had a low erythrocytes/hemoglobin and a high ferritin and MCV which is indicative of hemolytic anemia. In confirmation of the results above, fibrosis status or liver stiffness did not have any impact on PEth elimination. In conclusion, our data indicate that an elevated RBC turnover also causes rapid elimination of the RBC-bound PEth.
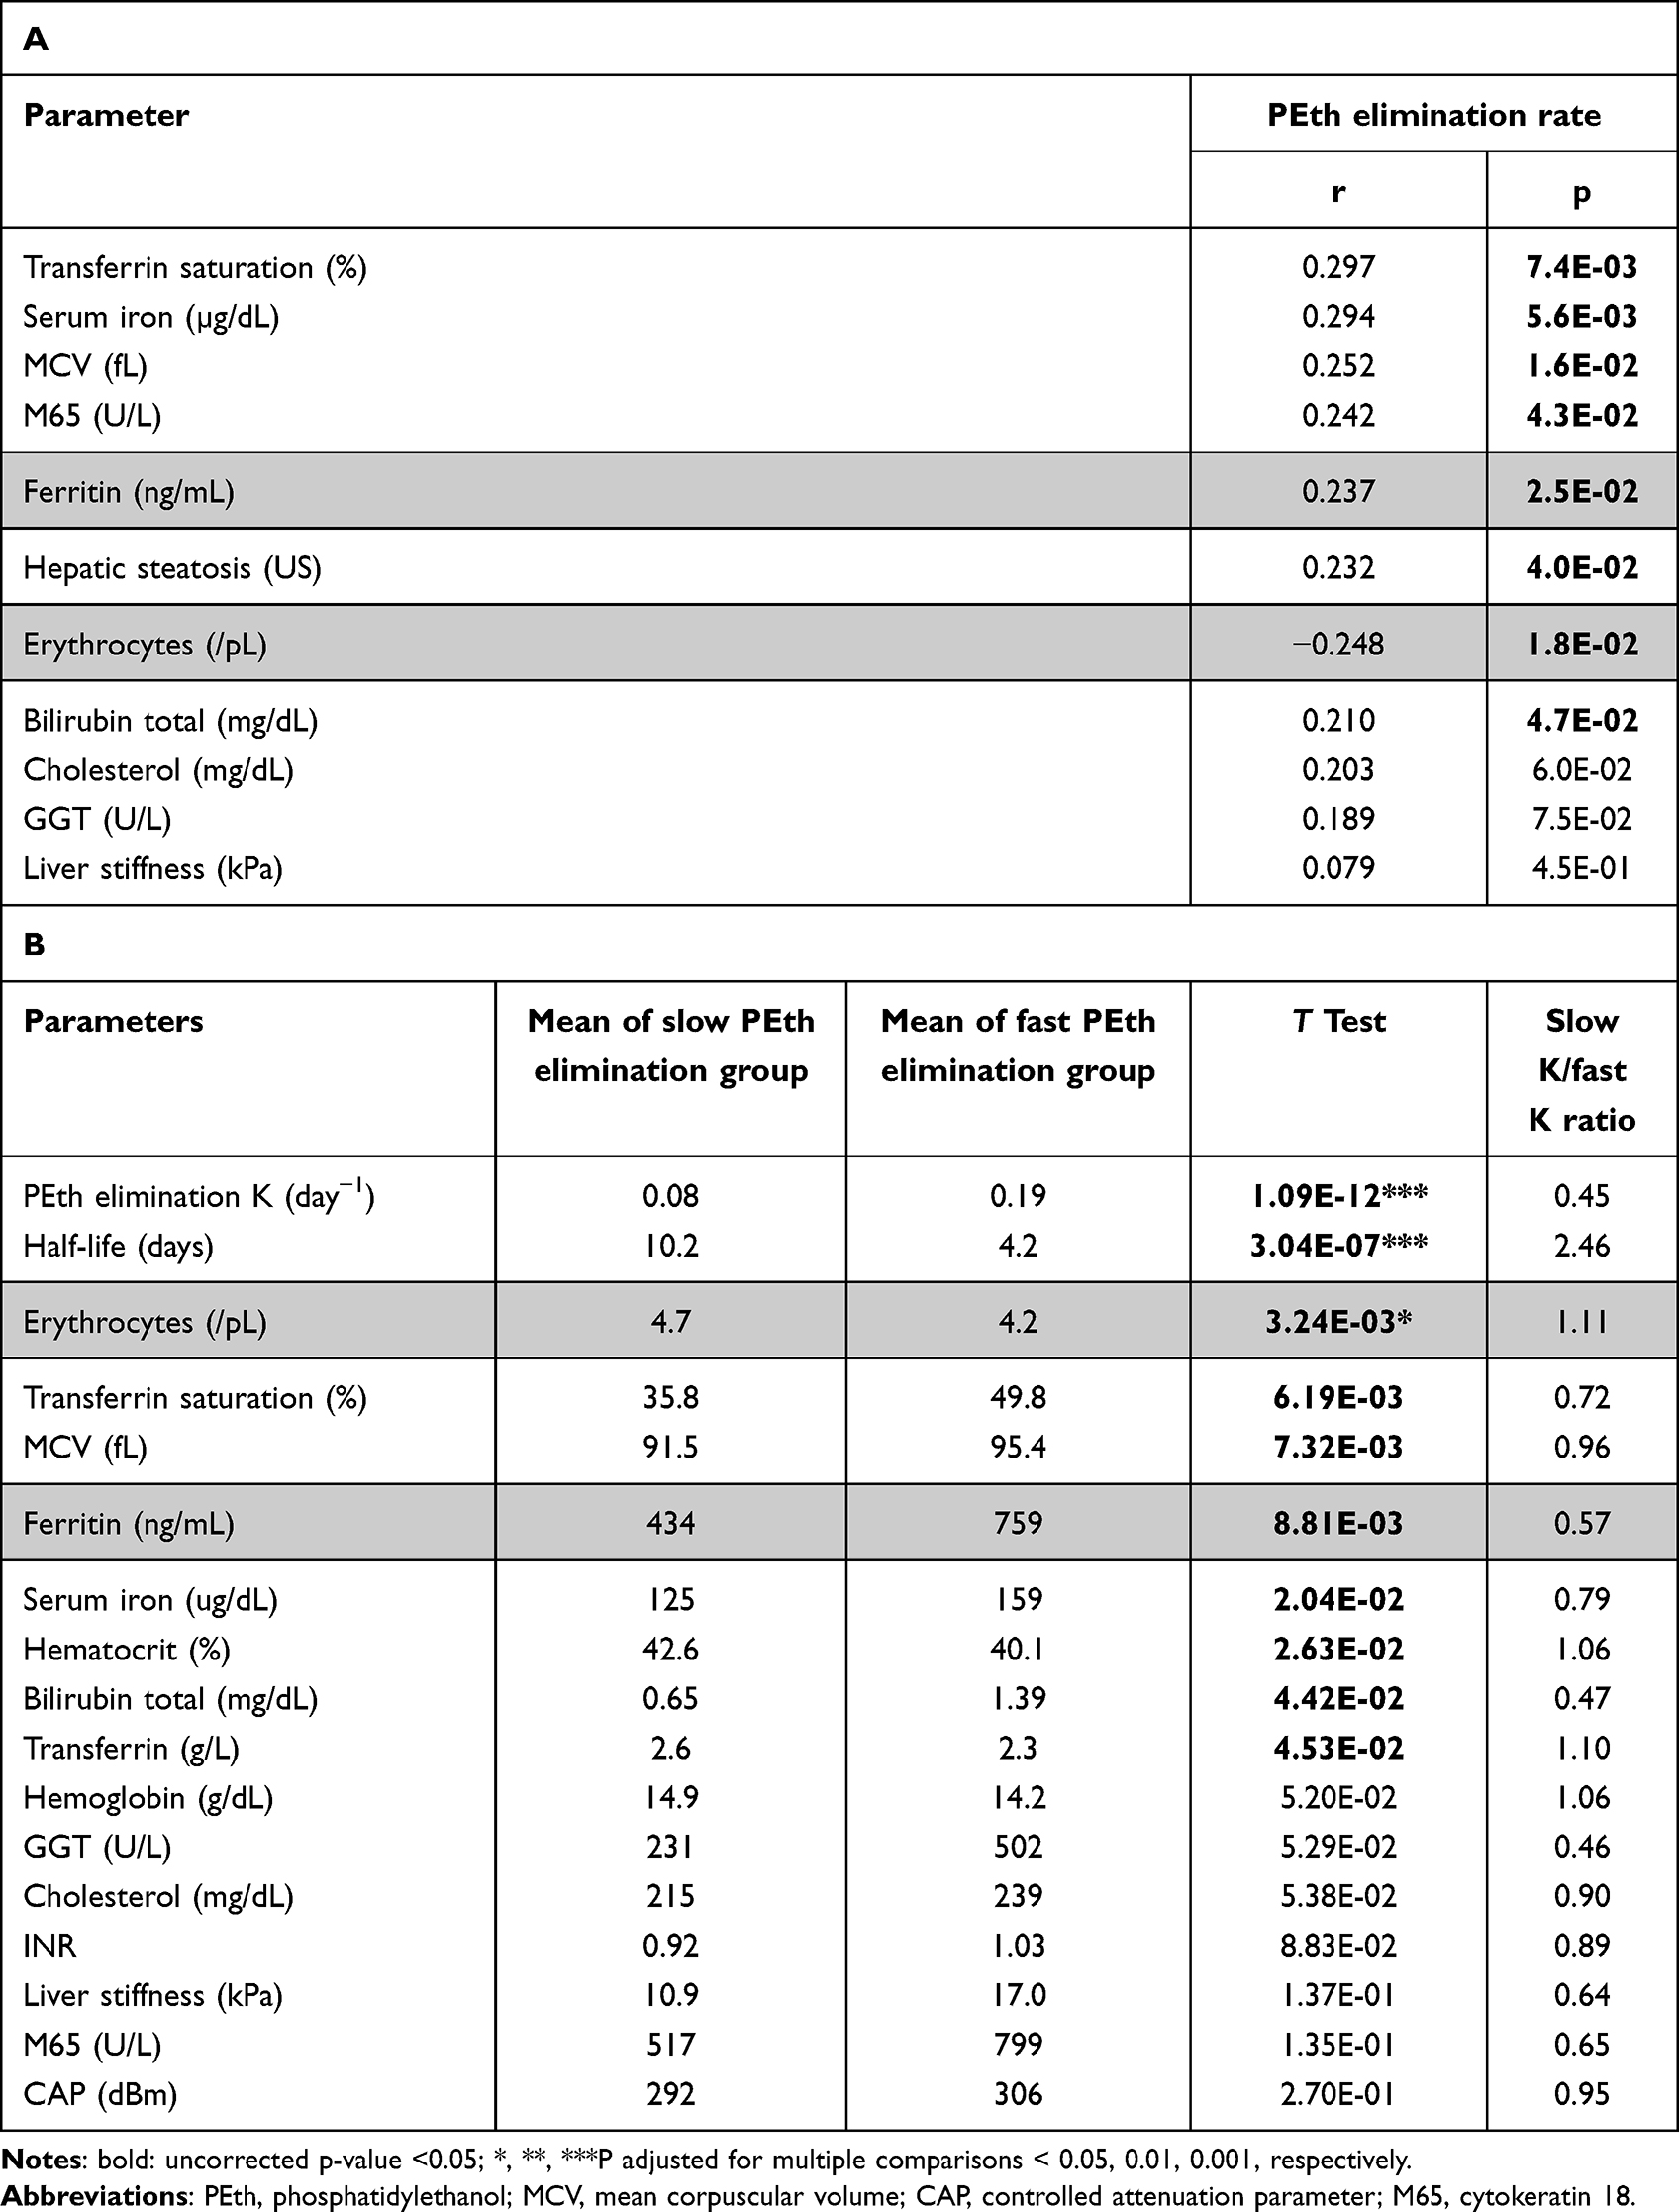 |
Table 4 (A) Correlation Analysis of PEth Elimination and (B) Discriminating Markers of Slow and Fast PEth Elimination. Patients with Fast and Slow PEth Elimination Were Divided at Median of K = 1.2 Day−1 or Half-Life = 5.8 Days |
Rapid PEth Elimination in Patients with Enhanced RBC Turnover
Consequently and following our previous report,41 we next grouped patients according to levels of hemoglobin (<14 g/dL) and ferritin (<400 mg/dL), the two major iron compartments accounting for 2.5 g and 1 g iron in humans, respectively. As shown previously,48 this will result into four groups: groups 1–2 with high Hb levels and groups 3–4 with low Hb levels (see Table 5). As shown in Table 5, patients of group 3 represent a subgroup with pronounced signs of hemolytic anemia indicated not only by the low Hb and high ferritin but also elevated LDH and MCV. The significantly elevated erythrophagocytosis marker CD163 also indicates that this group has an enhanced heme-turnover. However, in contrast to group 1 (high ferritin and high Hb), iron cannot be efficiently re-used for de novo erythropoiesis despite elevated erythropoietin levels (not shown) resulting in iron overload and anemia. Indeed, group 3 shows the highest PEth elimination rate, even higher than in group 1. Of note and in contrast to other reports, no differences were seen with regard to total cholesterol and HDL cholesterol. In summary, these data suggest that enhanced red blood cell turnover in a subfraction of heavy drinkers (25%) is highly associated with rapid PEth breakdown.
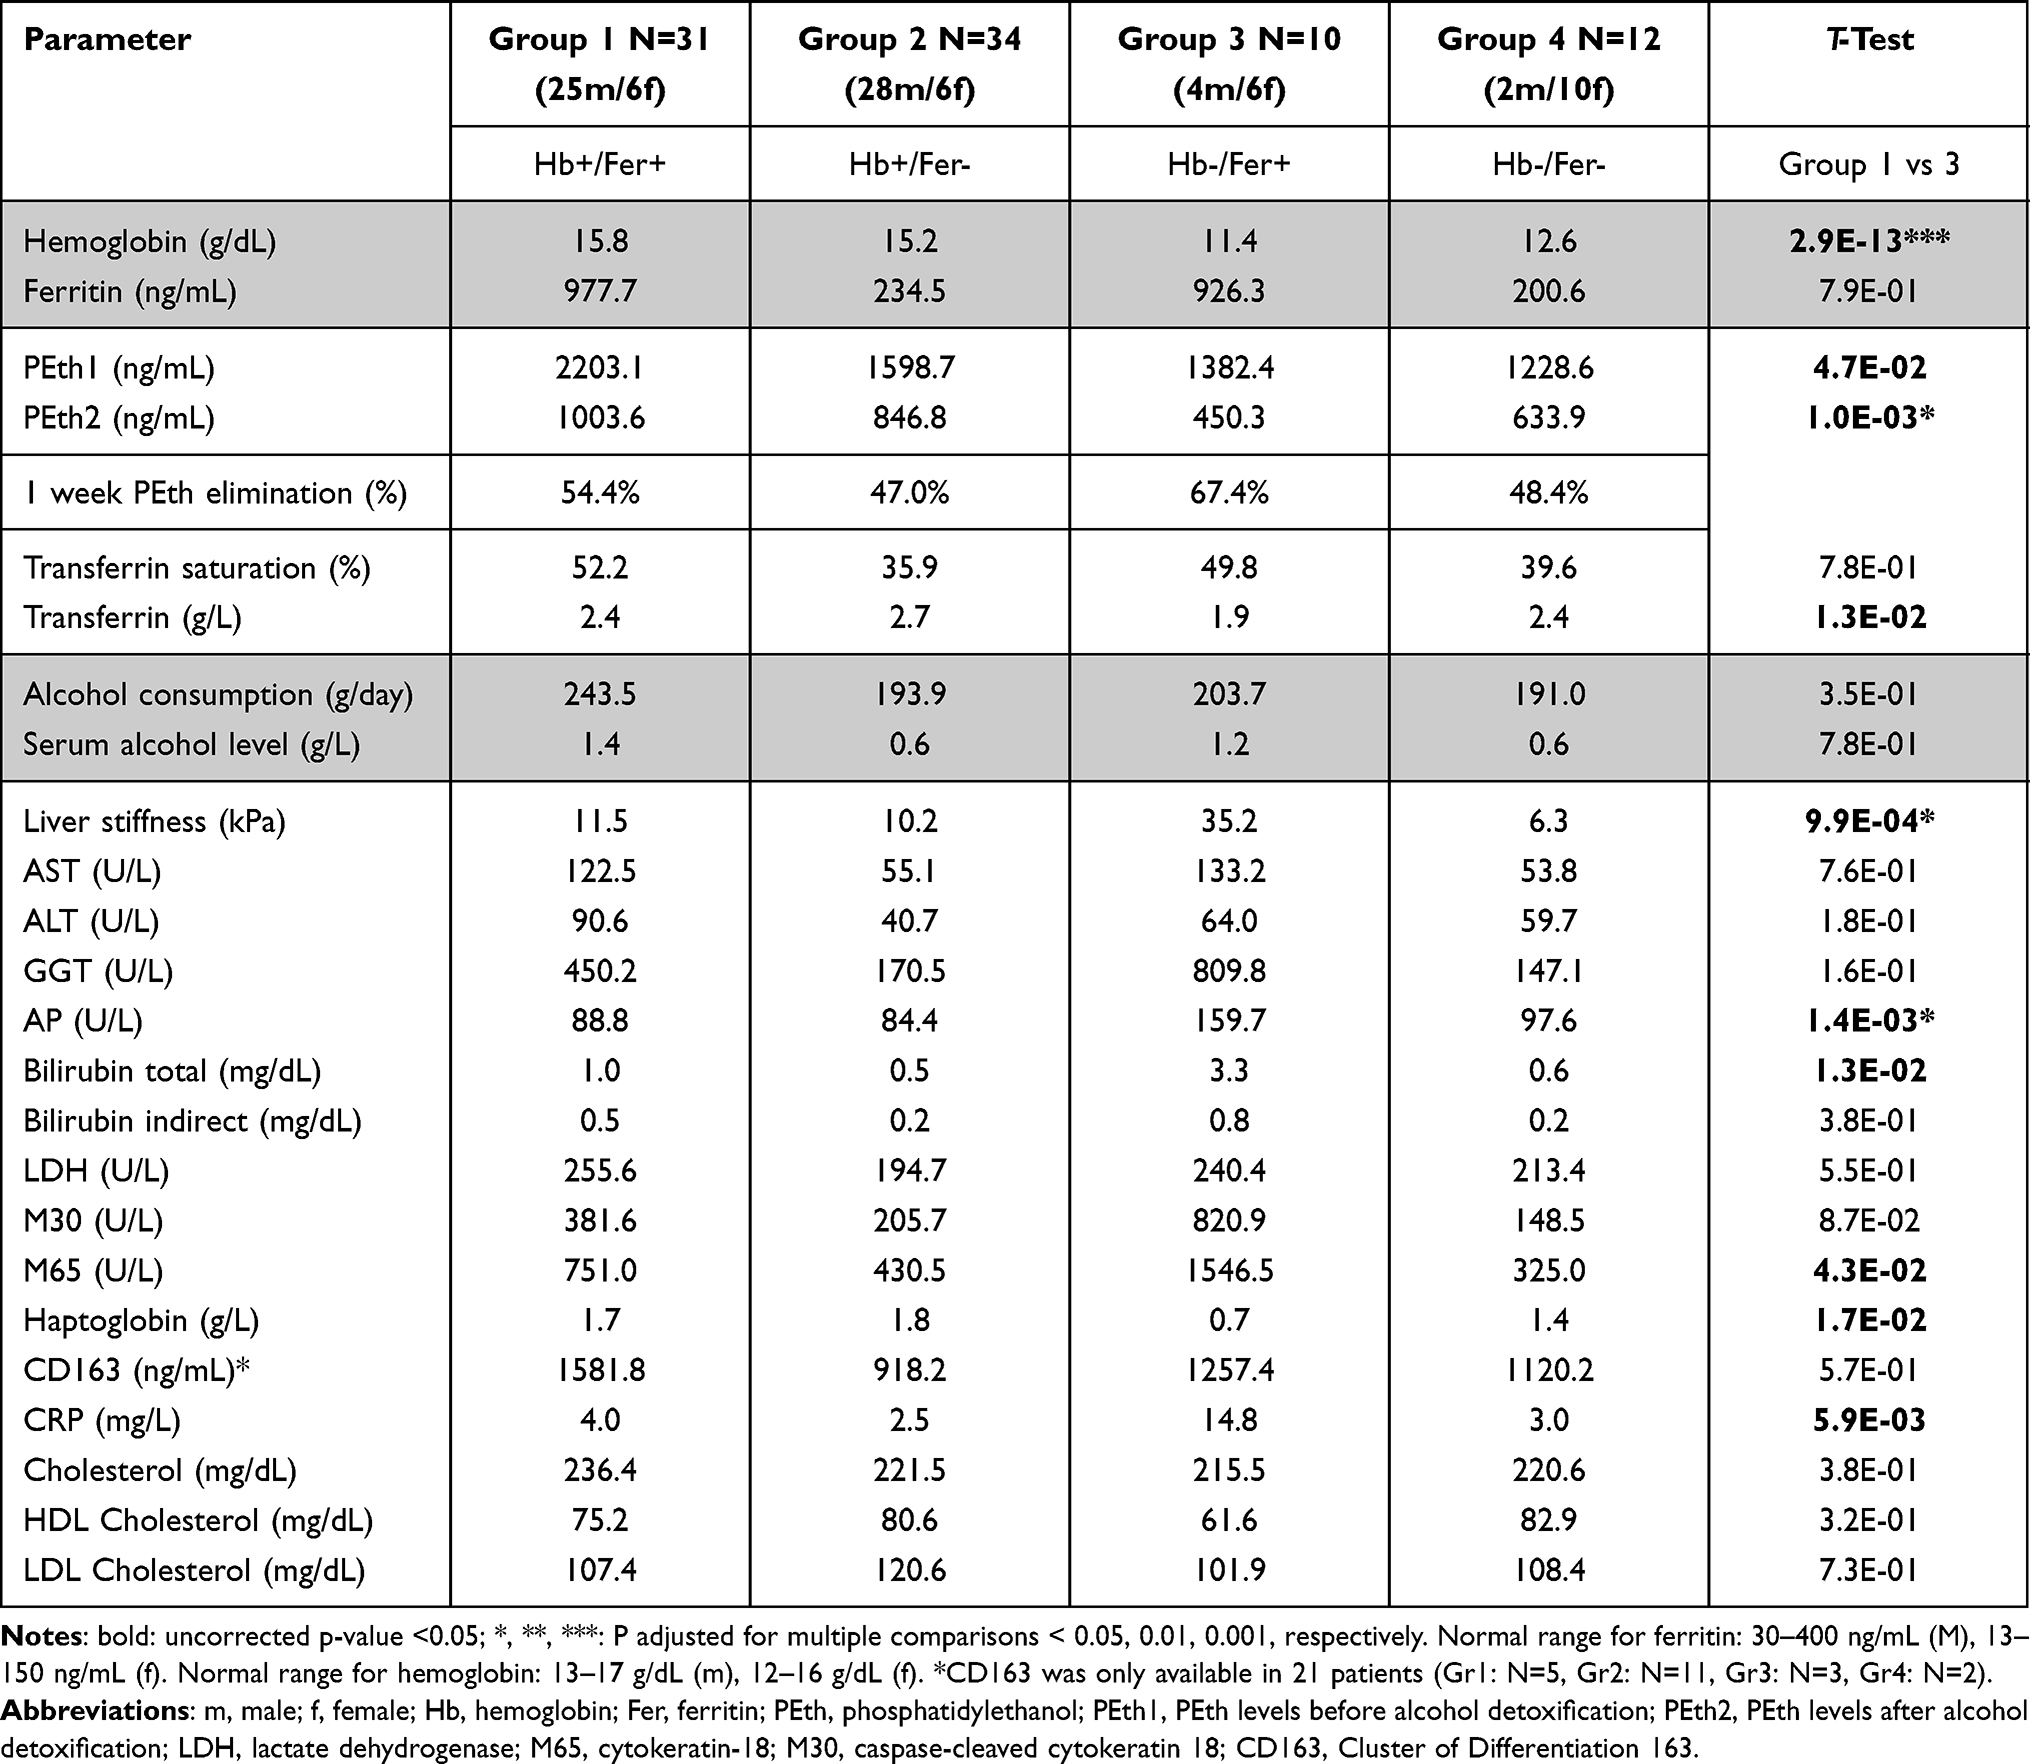 |
Table 5 Various Parameters and Percentage of PEth Elimination in Patients Stratified According to Levels of Hemoglobin (Hb, Cutoff 14 g/dL) and Ferritin (Fer, Cutoff 400 Ng/mL). Of Note, the Highest PEth Elimination Was Observed in Group 3 That Shows Signs of Hemolytic Anemia. (M: Male, F: Female) |
Discussion
We here demonstrate that elimination of PEth is independent of fibrosis stage but significantly depends on erythrocyte turnover in heavy drinkers undergoing in-hospital alcohol detoxification. Second, our data provide the first evidence that the presence of cirrhosis rather causes a slightly, but significantly reduced degradation of ethanol resulting in both higher levels of serum alcohol and all three examined biomarkers in whole blood. Third, among all direct biomarkers, PEth showed the highest correlation with reported daily alcohol consumption. These findings have important implications for the use and interpretation of these biomarkers in the clinical setting.
The in-hospital detoxification during a mean period of 1 week allowed for a controlled period of alcohol abstinence which was also documented not only by the absence of alcohol, but also by determination of EtS and EtG in the serum after detoxification. The absence of any detectable levels of EtS and EtG after 1 week of alcohol detoxification is also in line with the reported short half-life of these two markers in the range between 2 and 4 hours.15,16
In contrast, PEth levels were still detectable after the mean detoxification interval of 6.1 days decreasing down to a mean value of 46.2%. The individual half-life varied considerably between 1.6 and 15.2 days which is in line with earlier reports.22,32,33 This allowed us to study in detail potential factors that affect PEth elimination. A first focus was the role of fibrosis stage on PEth elimination. So far, the association of direct biomarkers and cirrhosis status has not been well studied, but ethanol biomarkers could be affected by multiple cirrhosis-associated conditions. The fibrosis stage might affect the formation and elimination of PEth and finally, various genetic and non-genetic conditions modulate ethanol metabolism that also might have an influence on PEth levels. In fact, the only occasional reports on few patients suggested so far that ethanol elimination is not different in patient with cirrhosis.37–39
Consequently, one of the first aims was to study in detail the effect of fibrosis stage on levels of alcohol and biomarkers. To our knowledge, this is the first study comparing alcohol biomarkers EtG, EtS and PEth with transient elastography that allowed us to assess fibrosis stage in all patients.53 Notably, all three biomarkers showed the highest correlation with serum alcohol levels. Moreover, they all correlated well with the reported daily alcohol consumption with PEth showing the best association. Therefore, we were surprised to learn that in patients with cirrhosis, not only serum alcohol levels but all direct biomarkers of alcohol were elevated, in the case of alcohol significantly and of EtG almost significantly. Of note, no effect of fibrosis was seen on PEth elimination. Due to the short half-life of EtG and EtS, our study design did not allow to study the effect of fibrosis stage on the elimination of these biomarkers.
In our opinion, however, these data clearly suggest that the presence of fibrosis/cirrhosis causes indeed a reduced elimination of alcohol resulting in elevated levels of alcohol and corresponding biomarkers. The fact that the effect of cirrhosis was smallest with respect to PEth is most likely due to several partially compensating conditions, namely, the more rapid elimination of RBCs. Consequently, it can be expected that patients with manifest cirrhosis require less alcohol to maintain equally high serum alcohol levels. The reported daily alcohol consumption of more than 1000 heavy drinkers at the Center for Alcohol Research in Heidelberg seems to support such a conclusion (data not shown).41
In a next step, we tried to identify factors that could be responsible for the observed variability of PEth elimination. A recent report in 2021 had shown a significant association of PEth levels with levels of ferritin, GGT, HDL and cholesterol.36 Since, we measured PEth prior and after alcohol detoxification, we calculated the exponential PEth elimination constant. While only a modest association with GGT and cholesterol was observed, we could confirm a high correlation with ferritin but even higher with parameters of the red blood cell compartment such as hemoglobin and the number of erythrocytes. Moreover, PEth was especially rapidly eliminated in patients with anemia and high ferritin and further analysis showed that these patients showed signs of hemolytic anemia with elevated LDH and MCV. No differences with regard to folic acid and vitamin B12 were observed in our cohort.41 We were also cautious in overinterpreting haptoglobin levels since it can be affected by fibrosis stage and inflammation in a complex manner. However, when we categorizing the ALD patients according the iron compartments using the levels of hemoglobin and ferritin,41 we could confirm that the highest PEth elimination was observed in patients with feature of hemolytic anemia (high ferritin and low hemoglobin) representing about 25% of the total population. The elevated erythrophagocytosis marker CD163 which is expressed in macrophages also indicates that these patients indeed have an enhanced heme turnover.41,46 In addition, despite elevated erythropoietin levels, these patients are not able to efficiently recycle iron into the normal erythropoiesis. We think that this is also in line with the fact that PEth is primarily formed by phospholipids of the erythrocyte membrane, which also represent the largest cholesterol compartment in the blood.54
What are the implications of PEth interpretation? First, we think that RBC turnover should be used to interpret PEth levels and patients with enhanced heme turnover had actually the lowest PEth levels after alcohol detoxification. Consequently, in such patients, alcohol consumption could be underestimated if solely based on PEth levels. On the other side, since PEth elimination seems to be independent of fibrosis stage, additional PEth determinations after a period of time could help to determine the rate of PEth elimination, and therefore allow better assessment of the actual alcohol consumption.
Second and in line with earlier reports, PEth levels might still be detectable even 3 weeks after the start of the alcohol detoxification. In the situation of a continuous alcohol consumption, PEth levels may significantly correlate with the drinking level. However, due to varying PEth elimination and under conditions of occasional alcohol consumption, clear information about past alcohol consumption remains vague. At least in our cohort of heavy drinkers with continued and normally constant drinking behavior, PEth seems to be specific and could provide a simple method to rule out any alcohol in the last 3 weeks as compared to hair EtG levels or urinary EtG. The only patient with no detectable PEth after alcohol withdrawal showed the longest in-hospital stay of 21 days and had initial PEth levels lower than 100 ng/mL.
Third, it remains to be studied why PEth levels best reflect daily alcohol consumption despite the strong modulative effects of RBC turnover but less absolute levels of serum alcohol. This is especially surprising as we here show that levels of both alcohol or specific biomarkers such as EtG or EtS are elevated in drinkers with cirrhosis. One still speculative explanation could be that enhanced hemolysis not only predicts mortality but also fibrosis in heavy drinkers.41,42 Although not reaching levels of significance due to a limited number of patients, we could show that drinkers with manifest cirrhosis seem to have higher levels of hemolysis and RBC turnover as evidenced by elevated CD163 or LDH, ferritin and anemia. Consequently, despite accumulating alcohol levels in patients with cirrhosis, enhanced hemolysis and PEth elimination eventually results in PEth levels that more reflect daily alcohol consumption than alcohol levels.
We are aware that the determined PEth concentrations in the drawn sample prior detoxification exhibit some limitations. Due to the present alcohol, a maximum PEth level might have not been reached and only a mean and not a terminal elimination rate can be assumed. Therefore, in patients with a low initial PEth level or a short detoxification period the calculated elimination rates might be imprecise. However, our findings could be still confirmed after excluding patients with initial PEth levels <1000 ng/mL and detoxification periods of <7 days.
Conclusion
In summary, our study provides a novel rationale on the high variability of PEth elimination in drinkers, which seems to be linked to increased RBC turnover. Consequently, laboratory indicators of hemolytic anemia should prompt to avoid underestimation of ethanol abuse. On the other side, due to its long half-life, PEth could be highly useful in the transplant context to monitor alcohol abuse of candidates from the transplant list. Our data also indicate that subsequent measurement of PEth after alcohol withdrawal could be useful to estimate RBC turnover in such patients. Finally, our data provide the first evidence that the presence of cirrhosis slightly but significantly decreases ethanol elimination. It consequently results in both higher levels of serum alcohol and all three explored ethanol biomarkers. These findings have important implications for the use and interpretation of these biomarkers in the clinical setting.
Abbreviations
ALD, alcoholic liver disease; ALT, alanine aminotransferase; AST, asparagine aminotransferase; CAP, controlled attenuation parameter (hepatic steatosis measured by TE); CDT, carbohydrate-deficient transferrin; GGT, γ-glutamyl transferase; EtG, ethyl glucuronide; EtS, ethyl sulfate; Hb, hemoglobin; LS, liver stiffness; MCV, mean corpuscular volume; PEth, phosphatidylethanol; PLD, phospholipase D; RBC, red blood cell; TE, transient elastography.
Ethics Approval Statement
The study protocol was reviewed and approved by the local Ethics Committee (S150-15).
Acknowledgment
This project was in part supported by a grant (SM) from the Deutsche Forschungsgemeinschaft (RA 2677/1-2). For the publication fee, we acknowledge financial support by Deutsche Forschungsgemeinschaft within the funding programme “Open Access Publikationskosten” as well as by Heidelberg University.
Disclosure
The authors report no conflicts of interest in this work.
References
1. World Health Organization. Global Status Report on Alcohol and Health 2014. Geneva, Switzerland: World Health Organization; 2014.
2. Mortality GBD, Causes of Death C. Global, regional, and national life expectancy, all-cause mortality, and cause-specific mortality for 249 causes of death, 1980–2015: a systematic analysis for the global burden of disease study 2015. Lancet. 2016;388(10053):1459–1544.
3. Ganne-Carrie N, Nahon P. Hepatocellular carcinoma in the setting of alcohol-related liver disease. J Hepatol. 2019;70(2):284–293. doi:10.1016/j.jhep.2018.10.008
4. World Health Organization. WHO global coordination mechanism on the prevention and control of NCDs: NCD and the sustainable development goals; 2018. Available from: http://www.who.int/global-coordination-mechanism/ncd-themes/sustainable-development-goals/en/.
5. International Agency for Research on Cancer. IARC Monographs on the Evaluation of Carcinogenic Risks to Humans: Volume 96 - Alcohol Consumption and Ethyl Carbamate. Lyon, France: International Agency for Research on Cancer; 2010.
6. Bradley KA, DeBenedetti AF, Volk RJ, Williams EC, Frank D, Kivlahan DR. AUDIT-C as a brief screen for alcohol misuse in primary care. Alcohol Clin Exp Res. 2007;31(7):1208–1217. doi:10.1111/j.1530-0277.2007.00403.x
7. Ewing JA. Detecting alcoholism. The CAGE questionnaire. JAMA. 1984;252(14):1905–1907. doi:10.1001/jama.1984.03350140051025
8. Anton RF. Editorial commentary: alcohol biomarker papers. Alcohol Clin Exp Res. 2010;34(6):939–940. doi:10.1111/j.1530-0277.2010.01167.x
9. Torrente MP, Freeman WM, Vrana KE. Protein biomarkers of alcohol abuse. Expert Rev Proteomics. 2012;9(4):425–436. doi:10.1586/epr.12.38
10. Freeman WM, Vrana KE. Future prospects for biomarkers of alcohol consumption and alcohol-induced disorders. Alcohol Clin Exp Res. 2010;34(6):946–954. doi:10.1111/j.1530-0277.2010.01169.x
11. Mueller S, Seitz HK, Rausch V. Non-invasive diagnosis of alcoholic liver disease. World J Gastroenterol. 2014;20(40):14626–14641. doi:10.3748/wjg.v20.i40.14626
12. Andresen-Streichert H, Muller A, Glahn A, Skopp G, Sterneck M. Alcohol biomarkers in clinical and forensic contexts. Dtsch Arztebl Int. 2018;115(18):309–315. doi:10.3238/arztebl.2018.0309
13. Strimbu K, Tavel JA. What are biomarkers? Curr Opin HIV AIDS. 2010;5(6):463–466. doi:10.1097/COH.0b013e32833ed177
14. Cabezas J, Lucey MR, Bataller R. Biomarkers for monitoring alcohol use. Clin Liver Dis. 2016;8(3):59–63. doi:10.1002/cld.571
15. Hoiseth G, Bernard JP, Karinen R, et al. A pharmacokinetic study of ethyl glucuronide in blood and urine: applications to forensic toxicology. Forensic Sci Int. 2007;172(2–3):119–124. doi:10.1016/j.forsciint.2007.01.005
16. Hoiseth G, Morini L, Polettini A, Christophersen A, Morland J. Blood kinetics of ethyl glucuronide and ethyl sulphate in heavy drinkers during alcohol detoxification. Forensic Sci Int. 2009;188(1–3):52–56. doi:10.1016/j.forsciint.2009.03.017
17. Crunelle CL, Yegles M, van Nuijs ALN, et al. Hair ethyl glucuronide levels as a marker for alcohol use and abuse: a review of the current state of the art. Drug Alcohol Depend. 2014;134:1–11. doi:10.1016/j.drugalcdep.2013.10.008
18. Halter CC, Dresen S, Auwaerter V, Wurst FM, Weinmann W. Kinetics in serum and urinary excretion of ethyl sulfate and ethyl glucuronide after medium dose ethanol intake. Int J Legal Med. 2008;122(2):123–128. doi:10.1007/s00414-007-0180-8
19. Aradóttir S, Moller K, Alling C. Phosphatidylethanol formation and degradation in human and rat blood. Alcoh Alcohol. 2004;39(1):8–13. doi:10.1093/alcalc/agh003
20. Wurst FM, Thon N, Yegles M, Schrueck A, Preuss UW, Weinmann W. Ethanol metabolites: their role in the assessment of alcohol intake. Alcoholism. 2015;39(11):2060–2072. doi:10.1111/acer.12851
21. Helander A, Zheng YF. Molecular species of the alcohol biomarker phosphatidylethanol in human blood measured by LC-MS. Clin Chem. 2009;55(7):1395–1405. doi:10.1373/clinchem.2008.120923
22. Javors MA, Hill-Kapturczak N, Roache JD, Karns-Wright TE, Dougherty DM. Characterization of the pharmacokinetics of phosphatidylethanol 16:0/18:1 and 16:0/18:2 in human whole blood after alcohol consumption in a clinical laboratory study. Alcoholism. 2016;40(6):1228–1234. doi:10.1111/acer.13062
23. Kobayashi M, Kanfer JN. Phosphatidylethanol formation via transphosphatidylation by rat brain synaptosomal phospholipase D. J Neurochem. 1987;48(5):1597–1603. doi:10.1111/j.1471-4159.1987.tb05707.x
24. Gustavsson L, Alling C. Formation of phosphatidylethanol in rat brain by phospholipase D. Biochem Biophys Res Commun. 1987;142(3):958–963. doi:10.1016/0006-291X(87)91507-5
25. Alling C, Gustavsson L, Anggård E. An abnormal phospholipid in rat organs after ethanol treatment. FEBS Lett. 1983;152(1):24–28. doi:10.1016/0014-5793(83)80474-8
26. Varga A, Alling C. Formation of phosphatidylethanol in vitro in red blood cells from healthy volunteers and chronic alcoholics. J Lab Clin Med. 2002;140(2):79–83. doi:10.1016/S0022-2143(02)00021-5
27. Aradottir S, Asanovska G, Gjerss S, Hansson P, Alling C. Phosphatidylethanol (PEth) concentrations in blood are correlated to reported alcohol intake in alcohol-dependent patients. Alcohol Alcohol. 2006;41(4):431–437. doi:10.1093/alcalc/agl027
28. Wurst FM, Thon N, Aradottir S, et al. Phosphatidylethanol: normalization during detoxification, gender aspects and correlation with other biomarkers and self-reports. Addict Biol. 2010;15(1):88–95. doi:10.1111/j.1369-1600.2009.00185.x
29. Winkler M, Skopp G, Alt A, et al. Comparison of direct and indirect alcohol markers with PEth in blood and urine in alcohol dependent inpatients during detoxication. Int J Legal Med. 2013;127(4):761–768. doi:10.1007/s00414-012-0812-5
30. Hartmann S, Aradottir S, Graf M, et al. Phosphatidylethanol as a sensitive and specific biomarker-comparison with gamma-glutamyl transpeptidase, mean corpuscular volume and carbohydrate-deficient transferrin. Addict Biol. 2007;12(1):81–84. doi:10.1111/j.1369-1600.2006.00040.x
31. Weinmann W, Schrock A, Wurst FM. Commentary on the Paper of Walther L. etal.: phosphatidylethanol Is Superior to CDT and GGT as an alcohol marker and is a reliable estimate of alcohol consumption level. Alcoholism. 2016;40(2):260–262. doi:10.1111/acer.12946
32. Gnann H, Weinmann W, Thierauf A. Formation of phosphatidylethanol and its subsequent elimination during an extensive drinking experiment over 5 days. Alcoholism. 2012;36(9):1507–1511. doi:10.1111/j.1530-0277.2012.01768.x
33. Helander A, Bottcher M, Dahmen N, Beck O. Elimination characteristics of the alcohol biomarker phosphatidylethanol (PEth) in blood during alcohol detoxification. Alcoh Alcohol. 2019;54(3):251–257. doi:10.1093/alcalc/agz027
34. Hill-Kapturczak N, Dougherty DM, Roache JD, Karns-Wright TE, Javors MA. Differences in the synthesis and elimination of phosphatidylethanol 16:0/18:1 and 16:0/18:2 after acute doses of alcohol. Alcohol Clin Exp Res. 2018;42(5):851–860. doi:10.1111/acer.13620
35. Hahn JA, Anton RF, Javors MA. The formation, elimination, interpretation, and future research needs of phosphatidylethanol for research studies and clinical practice. Alcoholism. 2016;40(11):2292–2295. doi:10.1111/acer.13213
36. Hoiseth G, Hilberg T, Trydal T, Husa A, Vindenes V, Bogstrand ST. The alcohol marker phosphatidylethanol is closely related to AST, GGT, ferritin and HDL-C. Basic Clin Pharmacol Toxicol. 2022;130(1):182–190. doi:10.1111/bcpt.13662
37. Niemelä O, Alatalo P. Biomarkers of alcohol consumption and related liver disease. Scand J Clin Lab Invest. 2010;70(5):305–312. doi:10.3109/00365513.2010.486442
38. Jones AW. Ethanol metabolism in patients with liver cirrhosis. J Clin Forensic Med. 2000;7(1):48–51. doi:10.1054/jcfm.2000.0363
39. Winkler K, Lundquist F, Tygstrup N. The metabolism of ethanol in normal man and in patients with cirrhosis of the liver. Scand J Clin Lab Invest Suppl. 1966;18:78.
40. Winkler K, Lundquist F, Tygstrup N. The hepatic metabolism of ethanol in patients with cirrhosis of the liver. Scand J Clin Lab Invest. 1969;23(1):59–69. doi:10.3109/00365516909078087
41. Mueller S, Chen C, Mueller J, Wang S. Novel insights into alcoholic liver disease: iron overload, iron sensing and hemolysis. J Transl Int Med. 2022;10(2):92–124. doi:10.2478/jtim-2021-0056
42. Mueller S, Mueller J. Alcohol and mortality: first preliminary lessons from a prospective 15 year follow-up study. In: Mueller S, Heilig M, editors. Alcohol and Alcohol-Related Diseases. Cham: Springer Nature; 2023. doi:10.1007/978-3-031-32483-3_7
43. Borun ER, Figueroa WG, Perry SM. The distribution of Fe59 tagged human erythrocytes in centrifuged specimens as a function of cell age. J Clin Invest. 1957;36(5):676–679. doi:10.1172/JCI103468
44. Beutler E. Biphasic loss of red cell enzyme activity during in vivo aging. Prog Clin Biol Res. 1985;195:317–333.
45. Clark MR. Senescence of red blood cells: progress and problems. Physiol Rev. 1988;68(2):503–554. doi:10.1152/physrev.1988.68.2.503
46. Mueller S, Scheller M. Ethanol-mediated bone marrow toxicity and impaired erythropoiesis: implications for alcohol-related liver disease. In: Mueller S, Heilig M, editors. Alcohol and Alcohol-Related Diseases. Cham: Springer Nature; 2023. doi:10.1007/978-3-031-32483-3_58
47. Sasso M, Miette V, Sandrin L, Beaugrand M. The controlled attenuation parameter (CAP): a novel tool for the non-invasive evaluation of steatosis using Fibroscan. Clin Res Hepatol Gastroenterol. 2012;36(1):13–20. doi:10.1016/j.clinre.2011.08.001
48. Mueller S, Nahon P, Rausch V, et al. Caspase‐cleaved keratin‐18 fragments increase during alcohol withdrawal and predict liver‐related death in patients with alcoholic liver disease. Hepatology. 2017;66(1):96–107. doi:10.1002/hep.29099
49. Mueller S, Englert S, Seitz HK, et al. Inflammation-adapted liver stiffness values for improved fibrosis staging in patients with hepatitis C virus and alcoholic liver disease. Liver Int. 2015;35(12):2514–2521. doi:10.1111/liv.12904
50. Hofmann V, Sundermann TR, Schmitt G, Bartel M. Development and validation of an analytical method for the simultaneous determination of the alcohol biomarkers ethyl glucuronide, ethyl sulfate, N-acetyltaurine, and 16:0/18:1-phosphatidylethanol in human blood. Drug Test Anal. 2022;14(1):92–100. doi:10.1002/dta.3147
51. Moreno C, Mueller S, Szabo G. Non-invasive diagnosis and biomarkers in alcohol-related liver disease. J Hepatol. 2019;70(2):273–283. doi:10.1016/j.jhep.2018.11.025
52. Thiele M, Rausch V, Fluhr G, et al. Controlled attenuation parameter and alcoholic hepatic steatosis: diagnostic accuracy and role of alcohol detoxification. J Hepatol. 2018;68(5):1025–1032. doi:10.1016/j.jhep.2017.12.029
53. Mueller S. Liver Elastography: Clinical Use and Interpretation. Springer International Publishing; 2020.
54. Gnann H, Engelmann C, Skopp G, et al. Identification of 48 homologues of phosphatidylethanol in blood by LC-ESI-MS/MS. Anal Bioanal Chem. 2010;396(7):2415–2423. doi:10.1007/s00216-010-3458-5
 © 2023 The Author(s). This work is published and licensed by Dove Medical Press Limited. The full terms of this license are available at https://www.dovepress.com/terms.php and incorporate the Creative Commons Attribution - Non Commercial (unported, v3.0) License.
By accessing the work you hereby accept the Terms. Non-commercial uses of the work are permitted without any further permission from Dove Medical Press Limited, provided the work is properly attributed. For permission for commercial use of this work, please see paragraphs 4.2 and 5 of our Terms.
© 2023 The Author(s). This work is published and licensed by Dove Medical Press Limited. The full terms of this license are available at https://www.dovepress.com/terms.php and incorporate the Creative Commons Attribution - Non Commercial (unported, v3.0) License.
By accessing the work you hereby accept the Terms. Non-commercial uses of the work are permitted without any further permission from Dove Medical Press Limited, provided the work is properly attributed. For permission for commercial use of this work, please see paragraphs 4.2 and 5 of our Terms.