")
Back to Journals » Open Access Journal of Sports Medicine » Volume 12
Comparison of Different Functional Tests for Leg Power and Normative Bilateral Asymmetry Index in Healthy Collegiate Athletes
Authors Sullivan SW , Fleet NA, Brooks VA, Bido J, Nwachukwu BU, Brubaker PH
Received 10 April 2021
Accepted for publication 13 July 2021
Published 6 August 2021 Volume 2021:12 Pages 119—128
DOI https://doi.org/10.2147/OAJSM.S315162
Checked for plagiarism Yes
Review by Single anonymous peer review
Peer reviewer comments 2
Editor who approved publication: Prof. Dr. Andreas Imhoff
Spencer W Sullivan,1,2 Niles A Fleet,3 Vanessa A Brooks,3 Jennifer Bido,2 Benedict U Nwachukwu,2 Peter H Brubaker1
1Department of Health and Exercise Science, Wake Forest University, Winston-Salem, NC, 27106, USA; 2Sports Medicine and Shoulder Service, Hospital for Special Surgery, New York, NY, 10021, USA; 3Department of Sports Medicine, Wake Forest University, Winston-Salem, NC, 27106, USA
Correspondence: Spencer W Sullivan 1109 Crowne Oaks Circle, Winston Salem, NC, 27106, USA
Tel +1 317 775 2626
Fax +1 646 885 8252
Email [email protected]
Background: Bilateral leg power is being increasingly investigated as a proxy for the recovery of muscle performance after injury. Functional tests like the single leg hop for distance (SLHD) and single leg vertical jump (SLVJ) are often used to determine symmetry and return to play (RTP) readiness. As an injury predictor, leg power is accurately measured with the Keiser Air420 seated leg press.
Purpose: To measure and analyze lower leg asymmetry in healthy collegiate athletes across each test battery.
Methods: Eighty-eight healthy student-athletes (44 males, 44 females) across 14 varsity teams at Wake Forest University performed the SLHD, SLVJ, and the Keiser. Horizontal and vertical displacement were measured via the SLHD and SLVJ, respectively. Peak power was recorded via the Keiser Air420 leg press. Pearson correlations and repeated measures ANOVA were used to calculate associations and compare bilateral asymmetry indices (BAI) and raw scores.
Results: There was a significant effect on each test’s raw BAI (P < 0.01). The mean absolute BAI were 5.42 ± 4.9%, 6.64 ± 4.9% and 5.36 ± 4.7% for the SLHD, SLVJ and Keiser, respectively. The SLVJ and Keiser (dominant leg r = 0.832, nondominant leg r = 0.826) were more highly correlated than the SLHD and Keiser (dominant leg r = 0.645, nondominant leg r = 0.687), all of which were statistically significant (P < 0.01).
Conclusion: At the 90th percentile, healthy collegiate athletes attained < 15% BAI. We recommend the implementation of a battery of tests to determine normative lower limb asymmetry. A battery of functional tests may present different asymmetry indices as opposed the 10% reference asymmetry.
Keywords: lower leg, power testing, functional testing, limb symmetry, athlete, return to play
Introduction
It is common knowledge that sports injuries occur in all levels of athletics resulting in athletes losing time from sport participation. For the collegiate level, there are more than 478,000 NCAA athletes competing and practicing each season.1 According to the NCAA Injury Surveillance Program (NCAA-ISP) during the academic years of 2009–2014, there is an estimated 176.7 million athlete exposures to injury for a given athlete participating in at least one practice or competition.1 In a professional setting, there is also a high prevalence based on an increased frequency of practice and competitions that may increase an athlete’s exposure to injury.2 How an athlete returns to their sport and how soon they participate following an injury can vary between clinician, setting, and circumstances as well as type and severity of injury.3 Clinicians may use a variety of criteria, which may include achieving limb symmetry via strength, power, and flexibility tests.4–6 To date, there is still not one set of return-to-play (RTP) criteria universally practiced in sports medicine to safely integrate these athletes back to their similar pre-injured level of participation.5,7
Limb symmetry index (LSI) is defined as a bilateral comparison, in this case a ratio between the injured limb and non-injured limb, to quantify any discrepancy in the variable (power, strength, etc.) studies; an interchangeable measure to LSI, Dai et al describe bilateral asymmetry indices (BAI) to measure the percent difference between the right and left lower extremity.6,8 Achieving 100% limb symmetry is ideal considering the association between increased asymmetry and prevalence of injury, but not always realistic as acceptable asymmetry discrepancies range from 10% to 20%.6,8 High symmetry discrepancies are red flags to future injury to the lower limb.6,8 To measure lower extremity asymmetry, different functional tests are used based upon cost and time effectiveness. Although isokinetic testing is used in many clinics as an accurate functional test for lower leg strength and power, it is much more expensive than simplified test batteries.9 For this reason, cost-effective single leg jumping tests are commonly used to estimate lower limb symmetry quickly and effectively.10,11 These simple jump tests have previously been correlated to each other, demonstrating a association between jumping functional tests.10,11 Despite strong correlation, these studies did not compare the association of these test batteries with a test of peak lower extremity power (measured in Watts). These jumping tests also use different muscle groups which may reflect differences in lower extremity asymmetry. Additionally, Dai et al8 outlined two simple test batteries for lower extremity measurements of strength and flexibility: the countermovement jump and lower extremity reach test, respectively. Similar to the muscle group activation between the jumping tests, it is important to consider variability across a battery of tests rather than relying on the results of one functional test. Within the literature, there is no functional testing gold standard to determine if an athlete is ready to return to play (RTP) following a lower limb injury.7 Therefore, it is also important to compare the efficacy of using each test as an indicator for asymmetry and power estimates.
To determine discrepancies between functional tests and identify normative asymmetry indices in a collegiate, athletic population, it is important to compare a battery of tests. In this study, the single leg hop for distance (SLHD), the single leg vertical jump (SLVJ) and the Keiser Air420 seated leg press power test will be performed on each athlete to evaluate power and calculate limb symmetry. The objectives of this study are: (1) to determine a reference BAI value for the healthy Division I (DI) collegiate student-athlete population, (2) to compare asymmetry in the SLHD, SLVJ, and the Keiser Air420 leg press tests and (3) to determine if these functional tests are correlated with one another. We hypothesize that average, normative BAI will be less than 10% asymmetry in a healthy athletic population with strong correlation between the test batteries; however, there may be differences between the test batteries’ estimates of asymmetry.
Methods
Participants
Participants were recruited through the Sports Medicine Facility at Wake Forest University between June 2018 and March 2019. Participants must have met the following criteria in order to participate in this study: enrolled as a current DI student-athlete at Wake Forest University, had no current injury inhibiting their ability to participate in their given sport, were deemed healthy and active for their respective sport by their athletic trainer, and were over the age of 18. Those that did not meet these inclusion criteria were excluded from the study. A total of 88 student-athletes met the inclusion criteria and participated in this study. Prior to testing, each participant provided informed consent which was approved and performed in accordance with the ethical standards of the Reynolda Campus Institutional Review Board. This study was conducted in accordance with the Declaration of Helsinki.
Instrumentation
The Just Jump mat (Power Systems, Knoxville, TN), a contact platform, was used to quantify vertical displacement of the participant. Good correlations have been found between electronic jump mats and force plates, ensuring its validity.12 The Just Jump mat recorded time from takeoff to landing, and converted time of flight into vertical displacement in inches through a built-in algorithm. The Keiser Air420 seated leg press (Keiser Corporation, Fresno, CA) with right and left pedals that move independently of one another was used to quantify peak power in every repetition. The Keiser Air420 used a pneumatic air system through pistons to generate resistance and the respective software to measure power to the nearest half Watt with very strong validity.13
Single Leg Hop for Distance (SLHD)
The goal of the SLHD was to jump as far as possible on one foot while sticking the landing on the same foot.10,11 The participant was told they could swing their arms freely, but the trial would not count if they did not stick the landing, defined as losing balance or hopping after initial contact with the ground. Once balanced, horizontal displacement from their heel was recorded (Figure 1). The participant was given three practice jumps on each leg before beginning the test. During the data collection, the participant decided which leg to start with and three trials were completed on one leg, then three on the other leg. Unsuccessful jumps counted as one trial as each participant achieved at least one successful attempt. They could take as long as they needed between trials. After completion, the longest, successful jump on each leg was measured and recorded to the nearest fourth of an inch and then converted to centimeters.14
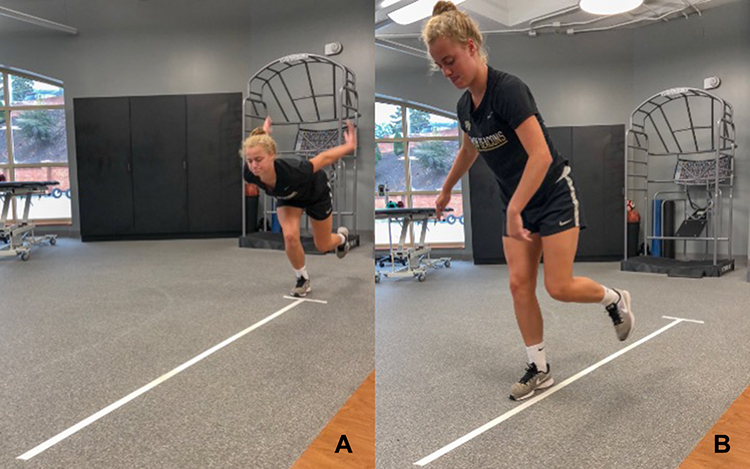 |
Figure 1 A Wake Forest student-athlete (A) prepares for and (B) completes one single leg hop for distance. |
Single Leg Vertical Jump (SLVJ)
The goal of the SLVJ was to jump from one foot as high as possible and land on the Just Jump Mat with the same foot.15 Prior to starting, the Just Jump mat was positioned on the ground, and the participant was instructed to stand on the Just Jump mat, jump from one leg, and land on the mat with the same leg (Figure 2). Balance was not necessary for this test, and they were told they could swing their arms freely as each jump was recorded. The participant was given one practice jump on each leg before beginning the test. During the data collection, the participant decided which leg to start with and three trials were completed on one leg, then three on the other leg. They were told they could take as long as they needed between jumps. Each trial was recorded to the nearest tenth of an inch, and the final score was calculated as the average of the three trials on each leg then converted to centimeters.
 |
Figure 2 A Wake Forest student-athlete (A) prepares for and (B) completes one single leg vertical jump. |
Keiser Air420 Leg Press
The goal of the Keiser Air420 was to push the pedals of the machine as fast and hard as possible with both legs. Prior to starting, each participant’s height (cm), weight (kg), and age were recorded into the Keiser interface, and the participant was then instructed on how to operate the Keiser leg press. The seat was positioned so that 90° knee flexion was obtained. Before the test, the maximum resistance of each participant was estimated and recorded based on three to four practice reps, increasing resistance to a point where the participant could barely push the pedals or not complete the leg press. This estimated, maximum resistance was recorded into a 10-rep test in accordance with the Keiser Testing Manual. The participant was informed that the test could extend past 10 reps if the maximum resistance was underestimated. Extra reps were performed when power output had not significantly dropped during the 10th rep.
During the data collection of the Keiser Air420, the participant was told to push both pedals of the leg press machine as fast and hard as possible with every repetition (Figure 3). Each repetition incrementally increased resistance until the estimated maximum resistance was reached at the 10th rep. If more reps were needed to be completed, the participant performed another rep until data was sufficiently collected. The data collection began with the first repetition at low weight decided by the Keiser software which was dependent on the participant’s maximum resistance. The test was completed when the participant could no longer complete a rep either before or after the 10th rep. After completion of the test, the top four peak power reps from both legs combined were averaged. The power score on each leg independently was then recorded from these four peak reps. This power score for each leg was normalized for the participant’s body weight: power in watts divided by the weight in kilograms.
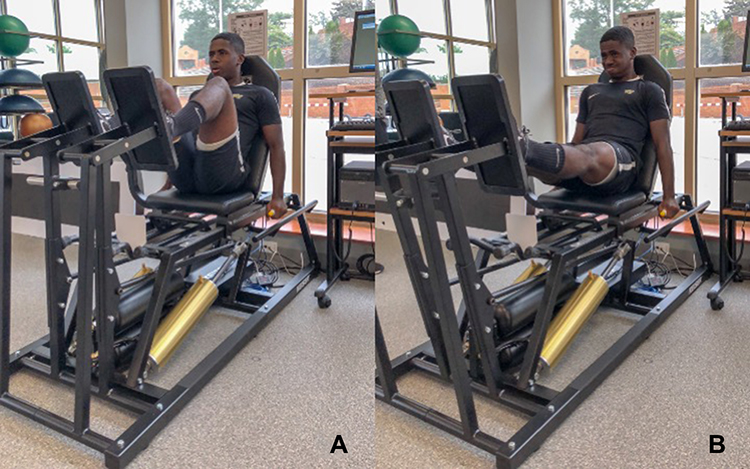 |
Figure 3 A Wake Forest student-athlete (A) prepares for and (B) completes one repetition of the Keiser Air420 seated leg press. |
Protocol
Before performing the three tests, each participant was assigned an identification number. Sex, height, weight, age, and sport in which they participated were recorded. All information, scores, and any notes were recorded on each participant’s data collection sheet. All participants performed the SLHD, SLVJ, and the Keiser Air420 leg press in random order as determined by a random sequence generator. Each participant was directed to warm up on a stationary exercise bike with minimal resistance for 5 minutes prior to testing. After warm-up, the first test was performed with 5 minutes between the end of one test and the beginning of the next (Figure 4). Before each new test, detailed instructions were explained to each participant. SWS conducted every test in this study to minimize variability in participant instruction.
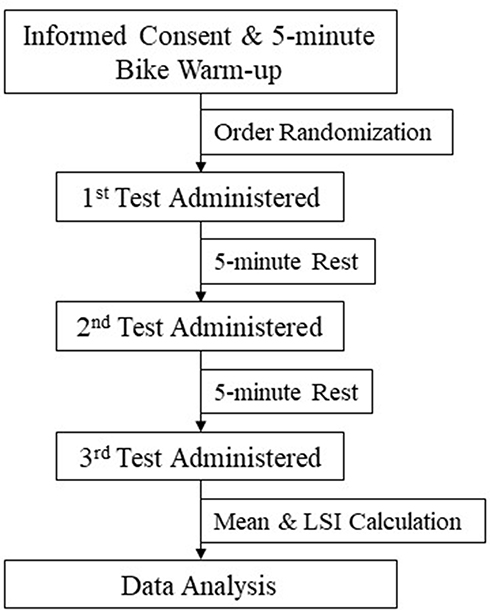 |
Figure 4 This flow chart outlines the protocol order for each individual athlete throughout the course of this study. Each test administered was randomized to eliminate the effects of order bias. |
Statistical Analysis
Descriptive data (means and standard deviations) were calculated for the SLHD, SLVJ, Keiser Air420, bilateral asymmetry index (BAI), age, weight (kg), and height (cm). The dominant leg was decided as the leg each athlete would use to kick a ball. BAI was calculated as a percentage: (dominant leg − nondominant leg)/(larger value of the two sides) multiplied by 100.8 Positive BAI indicated asymmetry favoring the dominant leg with negative BAI indicating asymmetry favoring the nondominant leg.8 All data were analyzed once normality was assumed using IBM SPSS Statistics 25 (IBM Corporation, Armonk, NY). Repeated measures ANOVA, with an alpha level of 0.05, was used to quantify differences between dependent means. Pearson Product-Moment correlation coefficients were calculated for each testing pair and on each leg (dominant and nondominant scores for the correlation between the SLHD, SLVJ and the Keiser). As criteria for a high positive correlation, a coefficient of 0.70 was established a priori.16
Results
Participant Characteristics
A total of 88 participants (44 males and 44 females) met the inclusion criteria and were enrolled in the study. The average age, height, and weight were 19.8 ± 1.2 years, 178.6 ± 4.0 cm, and 77.5 ± 16.3 kg. These participants were recruited from eight different sports, and 14 various DI athletic teams at Wake Forest University (Table 1). All participants completed each of the three functional tests: SLHD, SLVJ, and Keiser Air420 leg press (Table 2). On average, males significantly jumped further in the SLHD, jumped higher in the SLVJ, and produced greater power in the Keiser Air420 leg press than females (P < 0.01). While absolute scores were significantly different between males and females, there was no significant difference between males and females in terms of bilateral lower limb symmetry (Table 2).
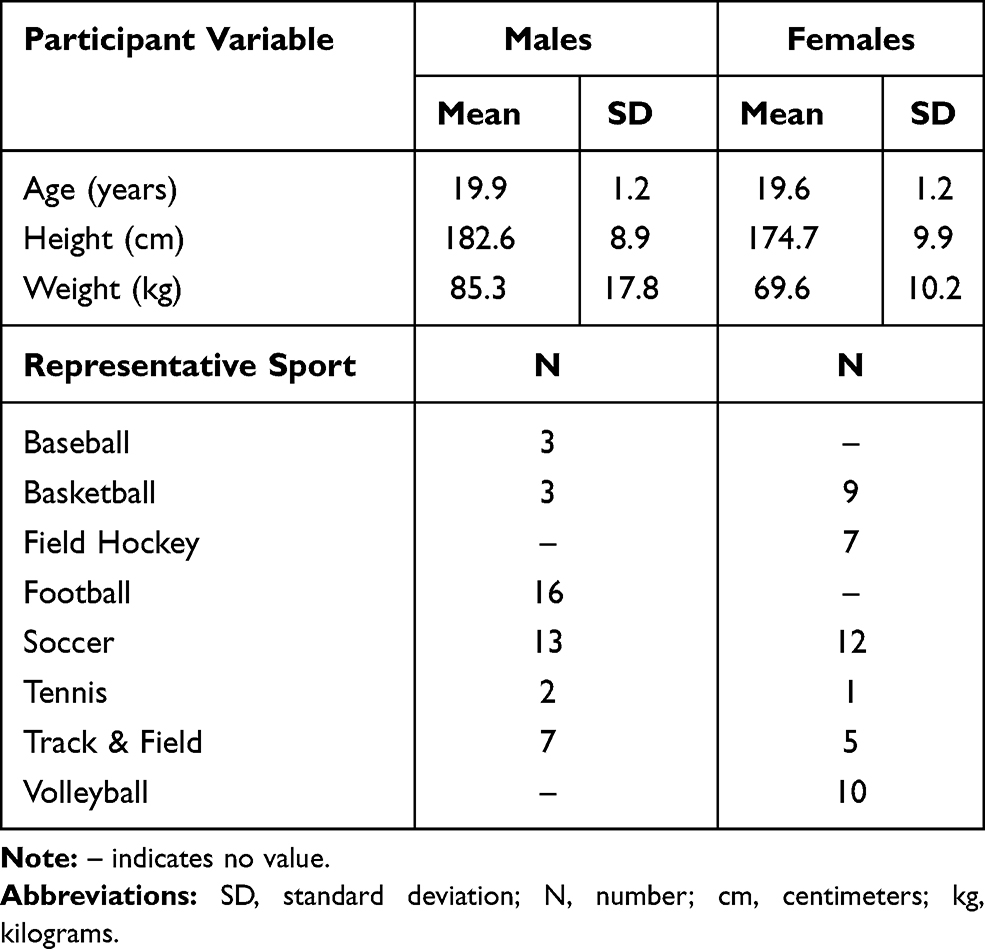 |
Table 1 Participant Demographics |
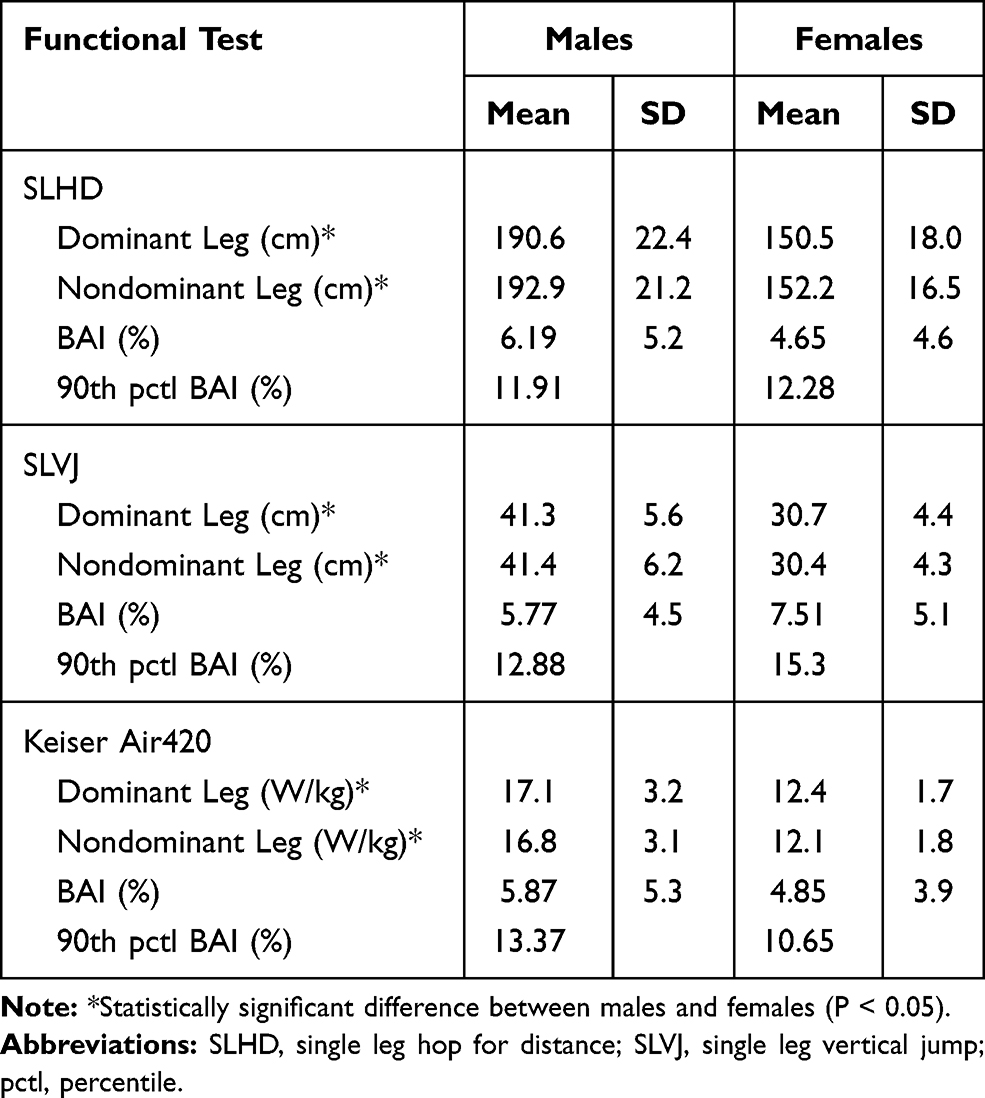 |
Table 2 Descriptive Measures for Each Functional Test |
Outcomes
BAI were calculated as a percentage between the dominant and nondominant leg for each functional test (Table 2). Figure 5 shows the distribution of asymmetry for the battery of tests, while the absolute values of BAI were greater than 10%, but less than 15% at the 90th percentile: 12.0, 14.6 and 12.0 for the SLHD, SLVJ and Keiser, respectively (Table 2). In the repeated measures ANOVA, there was a significant main effect of BAI between the SLHD, SLVJ and the Keiser Air420 (F(2,86) = 5.160, P = 0.007, ηp2= 0.056).
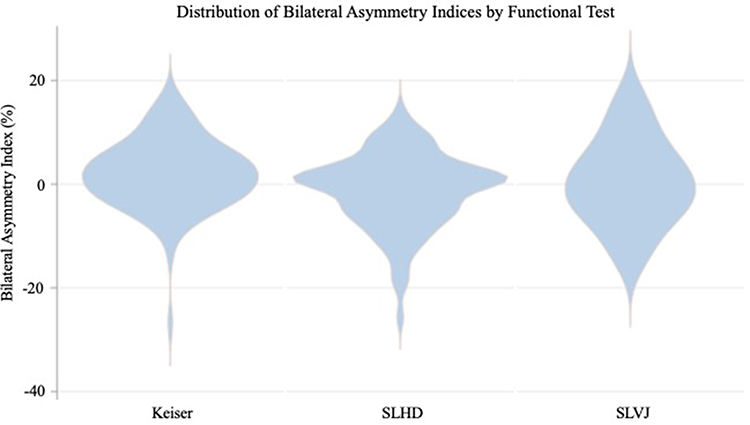 |
Figure 5 This violin plot demonstrates the distribution of BAI datapoints from the total 88 athletes for each test: the SLHD, SLVJ and Keiser Air420 seated leg press. |
Within the pairwise comparisons, the BAI between the SLHD and Keiser was significantly different (P < 0.01). Absolute scores of each participant, both dominant and non-dominant leg were compared between the Keiser Air420 leg press to the SLHD and the SLVJ, respectively. Based on prior established coefficients, there was a moderate positive correlation between the SLHD and Keiser (r = 0.645 and 0.687 for dominant and nondominant leg, respectively) compared to a high positive correlation between the SLVJ and Keiser (r = 0.832 and 0.826 for dominant and nondominant leg, respectively) and the SLVJ and SLHD (r = 0.745 and 0.834 for dominant and nondominant leg, respectively). Despite coefficient categorizations, the SLVJ and Keiser displayed a substantially higher correlation than the SLHD and Keiser association. Figure 6 shows a scatterplot of each pairwise correlation.
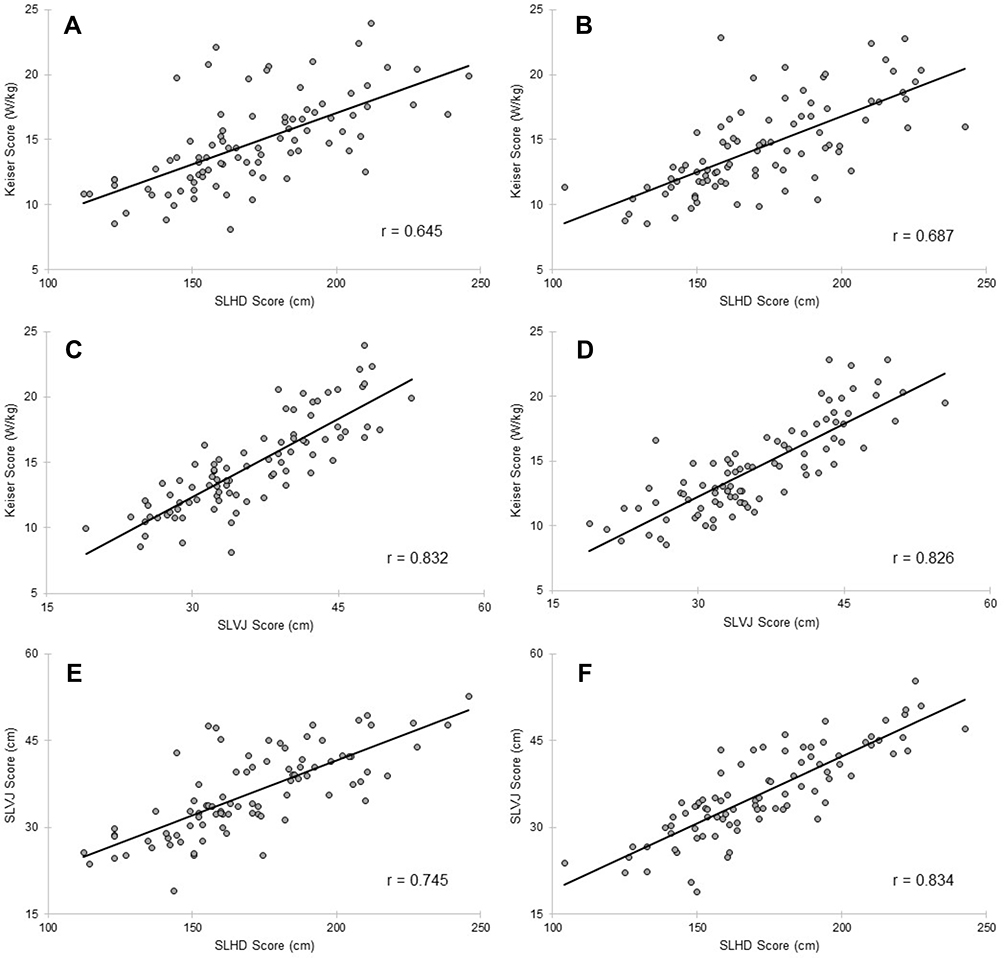 |
Figure 6 Pairwise associations between (A) the single leg hop for distance (SLHD) and the Keiser Air420 leg press (Keiser) for the dominant leg, (B) the SLHD and the Keiser for the non-dominant leg, (C) the single leg vertical jump (SLVJ) and the Keiser for the dominant leg, (D) the SLVJ and the Keiser for the non-dominant leg, (E) the SLHD and the SLVJ for the dominant leg, (F) and the SLHD and SLVJ for the non-dominant leg of each athlete. |
Discussion
The purpose of this study was to determine normative bilateral limb asymmetry values in healthy collegiate athletes through a battery of tests, SLHD, SLVJ, and Keiser Air420 seated leg press. These tests were compared to evaluate differences in BAI, and the associations between these tests were measured. For healthy D1 collegiate athletes the mean absolute BAI were 5.42 ± 4.9%, 6.64 ± 4.9% and 5.36 ± 4.7% for the SLHD, SLVJ and Keiser, respectively. At 90th percentile, an absolute value >10% asymmetry was concluded for healthy D1 collegiate athletes. Additionally, the correlation between the SLVJ and the Keiser was stronger with a high positive correlation (r > 0.8) compared to the SLHD with the Keiser with a moderate positive correlation (r < 0.7). Each association evaluated was statistically significant with a significant effect shown between the BAI reported by the battery of tests with a near-moderate effect size.
With significant correlations between each test battery, the SLVJ was found to have a higher, positive correlation with the Keiser Air 420. Specifically, the SLVJ requires vertical displacement, while the SLHD involves horizontal displacement along with an added center of mass (COM) component to the broad jump.10,11 Paired with the COM, precise neuromuscular control is needed to stop forward momentum of the broad jump in order for the athlete to stick the landing.17–19 It was assumed that SLHD and other similar field tests are useful in determining the functional movement component of an athlete’s recovery process, while SLVJ measures functional leg power. This could explain why the SLVJ had a stronger association with the Keiser Air 420 seated leg press. Without the horizontal movement of the athlete’s COM, extra neuromuscular control to retain balance is minimized as the athlete can focus on producing peak anaerobic power in the vertical jump.15,20,21 Resulting from this strong association of the SLVJ and the Keiser, the SLVJ can be used to estimate explosive leg power in a clinical setting. In fact, one study found police recruits with the lowest vertical jump in their cohort had a 37% absolute increase (or a three-fold relative increase) in risk of injury.22 While the SLVJ and the Keiser are capable of measuring explosive leg power, they are mechanistically different and do not produce identical BAI as shown in this study. Although correlation is high between the SLVJ and Keiser, these are not identical outcomes. Interestingly, there is greater variance between the two hop tests compared to each separate hop test for the Keiser. Due to the significant effect found between the Keiser, SLHD and SLVJ in this study, it exemplifies the importance of using a battery of tests to accurately reflect bilateral lower extremity asymmetry.
Within the literature, an optimal value for limb symmetry for a healthy athlete is <10% asymmetry.7,8,23 Within the current study, it was expected that the average BAI would be <10% in all of the functional tests that were measured. On average, BAI was found to fall closer to an absolute value of 5–7% average asymmetry, with the 90th percentile demonstrating >10% asymmetry in this study’s cohort, found in both male and female participants. However, this study’s normative results differ slightly from the 10% asymmetry as discussed by previous studies, while further studies describe limb symmetry values falling closer to 100%.6,24 This provides further support for the utilization of an arsenal of functional tests to define normative bilateral lower limb asymmetry: Dai et al8 found a 10% asymmetry in leg strength using the countermovement jump, while Onate et al4 concluded 94.5% as the normative limb symmetry index in the SLHD. This suggests that there should be a goal in place of improving an athlete’s limb symmetry to >90% before return to competition. However, it is important to note a number of athletes that achieved >10% BAI and yet are capable of playing in their given sport consistently. These results suggest more research should be conducted to further implement objective RTP criteria as recent criteria have been lacking significant association to recurrent ACL injury risk.7
While this study compared limb asymmetry through a battery of tests, it is important to additionally consider other functional testing methods to support normative symmetry values. A recent study considered an arsenal of testing to measure limb symmetry, including a unilateral leg press, single hop, triple hop and isokinetic dynamometry at 60, 180 and 300°/s.25 When comparing limb symmetry, Nagai et al25 concluded that limb symmetry values were inflated compared to isokinetic testing which resulted in average values of 72.8% to 84.8% symmetry. Another study analyzed limb symmetry with the countermovement jump, isokinetic press strength testing, one-leg stability testing and a speedy jump test among 3 age-related performance levels.26 This study found significant differences between performance groups in strength testing, which is supported by the current study.26 The association between various test batteries and differences in limb symmetry/asymmetry support the need to complete a variety of functional tests to obtain an accurate representation of normative limb symmetry. Additionally, it is important to consider the function of each battery (ie, functional movement, neuromuscular involvement, power output) to determine holistic, normative limb symmetry values for assessing RTP.
Outside of limb symmetry testing, we believe there are multiple other issues that need to be assessed in regard to RTP functional testing. First, sport-specific functional test batteries should be implemented in tandem with generic and objective criteria. In the literature, there are multiple, widely accepted test batteries, including the current study’s SLHD and SLVJ that have been used to allow an athlete to return to competition.27 However, most sports do not have specific functional tests that simulate everything an athlete must encounter in their given sport. Myers et al28 determined that a variety of sports must use a variety of test batteries rather than relying on normative values designed for a generic athlete. While the current study did not decipher asymmetric differences between sports, this issue should be discussed to determine accurate RTP criteria for specific athletes. Second, fear and anxiety have also been documented that play a significant role in an athlete’s RTP timeline.29 Concerning this issue, the Tampa Scale for Kinesiophobia (TSK) and its shortened version (TSK-11) have been developed to estimate the effects of fear and anxiety on injuries and rehabilitation.30 These factors should also be considered when discussing an athlete’s RTP and how the mind affects objective criteria. Finally, closed-chain strength assessments should also be considered in addition to open-chain assessments. While the SLHD and SLVJ are used in RTP criteria, minute changes in side-to-side joint movement and rotation should also be examined and controlled.21 These closed-chain assessments can also benefit RTP decisions by evaluating the functional capabilities of recuperating athletes.23
While the current study had certain strengths, such as a generalizable setting of research tests conducted, randomization of tests to control for order bias and reduced variability of each testing protocol with one researcher conducting all tests, there were also some limitations to note. First, all participants were considered healthy, DI collegiate athletes, which limits the scope of the results in a specific population. Second, previous injury was not recorded once a participant was recruited to the current study, which could have affected their ability to exert full effort on each test battery. However, each athlete was considered healthy and able to participate in their respective sport by each team’s athletic trainer at the time of this study. Additionally, there were no large cohorts representing each sport which limits the study’s ability to determine intersport variance between normative BAI values. Although preliminary analysis reflected few differences between sports, it is difficult to determine if this difference is due to low sample sizes or actual differences in the data. Thus, this study is not designed to determine sport-specific functional demands and objective RTP criteria, but aims to address overall normative symmetry values for healthy, collegiate athletes.
Clinical Messages
- Not every healthy athlete will attain <10% asymmetry as previously discussed in the literature and should not be a hard cut-off point.
- A battery of functional tests should be conducted to establish a normative asymmetry index due to variability among tests.
Acknowledgments
The authors would like to acknowledge Dr. Shannon Mihalko for critical review of the study throughout the writing process in addition to statistical guidance provided by Dr. Jason Fanning and Dr. Jeff Katula. We would also like to thank Michael White, Heather Holdson, Ada Weiss, Andrew Downing, Scott Spernoga, Don Steelman, Laura Reiner, Chris Hanks and David Chandler for the recruitment of the study participants from each respective varsity sport at Wake Forest University.
Author Contributions
All authors contributed to data analysis, drafting or revising the article, have agreed on the journal to which the article will be submitted, gave final approval of the version to be published, and agree to be accountable for all aspects of the work.
Funding
This project was funded by the URECA Center (Wake Forest Research Fellowship) and the Sports Medicine Facility at Wake Forest University in Winston-Salem, North Carolina.
Disclosure
B.U.N. reports ownership interest in BICMD, outside the submitted work. The other authors have no conflicts of interest to report.
References
1. Kerr ZY, Marshall SW, Dompier TP, Corlette J, Klossner DA, Gilchrist J. College sports-related injuries - United States, 2009–10 through 2013–14 academic years. MMWR Morb Mortal Wkly Rep. 2015;64(48):1330–1336. doi:10.15585/mmwr.mm6448a2
2. Williams S, Trewartha G, Kemp SPT, et al. How much rugby is too much? A seven-season prospective cohort study of match exposure and injury risk in professional rugby union players. Sports Med. 2017;47(11):2395–2402. doi:10.1007/s40279-017-0721-3
3. Prien A, Prinz B, Dvořák J, Junge A. Health problems in former elite female football players: prevalence and risk factors. Scand J Med Sci Sports. 2017;27(11):1404–1410. doi:10.1111/sms.12747
4. Onate JA, Starkel C, Clifton DR, et al. Normative functional performance values in high school athletes: the functional pre-participation evaluation project. J Athl Train. 2018;53(1):35–42. doi:10.4085/1062-6050-458.16
5. van der Horst N, van de Hoef S, Reurink G, Huisstede B, Backx F. Return to play after hamstring injuries: a qualitative systematic review of definitions and criteria. Sports Med. 2016;46(6):899–912. doi:10.1007/s40279-015-0468-7
6. Zwolski C, Schmitt LC, Thomas S, Hewett TE, Paterno MV. The utility of limb symmetry indices in return-to-sport assessment in patients with bilateral anterior cruciate ligament reconstruction. Am J Sports Med. 2016;44(8):2030–2038. doi:10.1177/0363546516645084
7. Losciale JM, Zdeb RM, Ledbetter L, Reiman MP, Sell TC. The association between passing return-to-sport criteria and second anterior cruciate ligament injury risk: a systematic review with meta-analysis. J Orthop Sports Phys Ther. 2019;49(2):43–54. doi:10.2519/jospt.2019.8190
8. Dai B, Layer J, Vertz C, et al. Baseline assessments of strength and balance performance and bilateral asymmetries in collegiate athletes. J Strength Cond Res. 2019;33(11):3015–3029. doi:10.1519/JSC.0000000000002687
9. Sueyoshi T, Nakahata A, Emoto G, Yuasa T. Single-leg hop test performance and isokinetic knee strength after anterior cruciate ligament reconstruction in athletes. Orthop J Sports Med. 2017;5(11):2325967117739811. doi:10.1177/2325967117739811
10. Shin S-H, Woo H. Correlation of single leg vertical jump, single leg hop, and single leg squat distances in healthy persons. Phys Ther Rehabil Sci. 2013;2(1):57–61.
11. Swearingen J, Lawrence E, Stevens J, Jackson C, Waggy C, Davis DS. Correlation of single leg vertical jump, single leg hop for distance, and single leg hop for time. Phys Ther Sport. 2011;12(4):194–198. doi:10.1016/j.ptsp.2011.06.001
12. Kenny IC, Cairealláin AÓ, Comyns TM. Validation of an electronic jump mat to assess stretch-shortening cycle function. J Strength Condition Res. 2012;26(6):1601–1608. doi:10.1519/JSC.0b013e318234ebb8
13. Redden J, Stokes K, Williams S. Establishing the reliability and limits of meaningful change of lower limb strength and power measures during seated leg press in elite soccer players. J Sports Sci Med. 2018;17(4):539–546.
14. Augustsson J, Thomeé R, Lindén C, Folkesson M, Tranberg R, Karlsson J. Single-leg hop testing following fatiguing exercise: reliability and biomechanical analysis. Scand J Med Sci Sports. 2006;16(2):111–120. doi:10.1111/j.1600-0838.2005.00446.x
15. Lee DW, Yang SJ, Cho SI, Lee JH, Kim JG. Single-leg vertical jump test as a functional test after anterior cruciate ligament reconstruction. Knee. 2018;25(6):1016–1026. doi:10.1016/j.knee.2018.07.014
16. Mukaka M. A guide to appropriate use of Correlation coefficient in medical research. Malawi Med J. 2012;24(3):69–71.
17. Bird SP, Markwick WJ. Musculoskeletal screening and functional testing: considerations for basketball athletes. Int J Sports Phys Ther. 2016;11(5):784–802.
18. Junge T, Wedderkopp N, Thorland JB, Søgaard K, Juul-Kristensen B. Altered knee joint neuromuscular control during landing from a jump in 10–15 year old children with Generalised Joint Hypermobility. A substudy of the CHAMPS-study Denmark. J Electromyogr Kinesiol. 2015;25(3):501–507. doi:10.1016/j.jelekin.2015.02.011
19. Manske R, Reiman M. Functional performance testing for power and return to sports. Sports Health. 2013;5(3):244–250. doi:10.1177/1941738113479925
20. Loturco I, Pereira LA, Moraes JE, et al. Jump-Squat and Half-Squat Exercises: selective Influences on Speed-Power Performance of Elite Rugby Sevens Players. PLoS One. 2017;12(1):e0170627. doi:10.1371/journal.pone.0170627
21. Peterson MD, Alvar BA, Rhea MR. The contribution of maximal force production to explosive movement among young collegiate athletes. J Strength Condition Res. 2006;20(4):867–873.
22. Orr R, Pope R, Peterson S, Hinton B, Stierli M. Leg power as an indicator of risk of injury or illness in police recruits. Int J Environ Res Public Health. 2016;13(2):237. doi:10.3390/ijerph13020237
23. Petschnig R, Baron R, Albrecht M. The relationship between isokinetic quadriceps strength test and hop tests for distance and one-legged vertical jump test following anterior cruciate ligament reconstruction. J Orthop Sports Phys Ther. 1998;28(1):23–31. doi:10.2519/jospt.1998.28.1.23
24. Ross MD, Langford B, Whelan PJ. Test-retest reliability of 4 single-leg horizontal hop tests. J Strength Cond Res. 2002;16(4):617–622.
25. Nagai T, Schilaty ND, Laskowski ER, Hewett TE. Hop tests can result in higher limb symmetry index values than isokinetic strength and leg press tests in patients following ACL reconstruction. Knee Surg Sports Traumatol Arthrosc. 2020;28(3):816–822. doi:10.1007/s00167-019-05513-3
26. Steidl-Müller L, Hildebrandt C, Müller E, Fink C, Raschner C. Limb symmetry index in competitive alpine ski racers: reference values and injury risk identification according to age-related performance levels. J Sport Health Sci. 2018;7(4):405–415. doi:10.1016/j.jshs.2018.09.002
27. Hildebrandt C, Müller L, Zisch B, Huber R, Fink C, Raschner C. Functional assessments for decision-making regarding return to sports following ACL reconstruction. Part I: development of a new test battery. Knee Surg Sports Traumatol Arthrosc. 2015;23(5):1273–1281. doi:10.1007/s00167-015-3529-4
28. Myers BA, Jenkins WL, Killian C, Rundquist P. Normative data for hop tests in high school and collegiate basketball and soccer players. Int J Sports Phys Ther. 2014;9(5):596–603.
29. Johnston LH, Carroll D. The psychological impact of injury: effects of prior sport and exercise involvement. Br J Sports Med. 2000;34(6):436–439. doi:10.1136/bjsm.34.6.436
30. Lentz TA, Zeppieri G, George SZ, et al. Comparison of physical impairment, functional, and psychosocial measures based on fear of reinjury/lack of confidence and return-to-sport status after ACL reconstruction. Am J Sports Med. 2015;43(2):345–353. doi:10.1177/0363546514559707
 © 2021 The Author(s). This work is published and licensed by Dove Medical Press Limited. The full terms of this license are available at https://www.dovepress.com/terms.php and incorporate the Creative Commons Attribution - Non Commercial (unported, v3.0) License.
By accessing the work you hereby accept the Terms. Non-commercial uses of the work are permitted without any further permission from Dove Medical Press Limited, provided the work is properly attributed. For permission for commercial use of this work, please see paragraphs 4.2 and 5 of our Terms.
© 2021 The Author(s). This work is published and licensed by Dove Medical Press Limited. The full terms of this license are available at https://www.dovepress.com/terms.php and incorporate the Creative Commons Attribution - Non Commercial (unported, v3.0) License.
By accessing the work you hereby accept the Terms. Non-commercial uses of the work are permitted without any further permission from Dove Medical Press Limited, provided the work is properly attributed. For permission for commercial use of this work, please see paragraphs 4.2 and 5 of our Terms.