")
Back to Journals » Drug Design, Development and Therapy » Volume 12
Comparison of biosimilar filgrastim with a reference product: pharmacokinetics, pharmacodynamics, and safety profiles in healthy volunteers
Authors Choi C, Yoo BW , Kim CO, Hong T, Jin BH , Seo KS, Jang JY, Park MS
Received 28 November 2017
Accepted for publication 3 May 2018
Published 1 August 2018 Volume 2018:12 Pages 2381—2387
DOI https://doi.org/10.2147/DDDT.S158277
Checked for plagiarism Yes
Review by Single anonymous peer review
Peer reviewer comments 4
Editor who approved publication: Dr Tuo Deng
Chungam Choi,1 Byung Won Yoo,2 Choon Ok Kim,2 Taegon Hong,2 Byung Hak Jin,2 Kwang-Seok Seo,3 Ja Yun Jang,4 Min Soo Park2
1Department of Nuclear Medicine, Severance Hospital, Yonsei University Health System, Seoul, Republic of Korea; 2Department of Clinical Pharmacology, Severance Hospital, Yonsei University Health System, Seoul, Republic of Korea; 3Biopharmaceutical Research Laboratories, Dong-A Socio R&D Center, Yongin-si, Republic of Korea; 4Product Development Division, Dong-A ST Co., Ltd, Seoul, Republic of Korea
Purpose: Filgrastim, a granulocyte-colony stimulating factor, is used to treat patients with neutropenia, including neutropenic fever. Leucostim® is a recombinant filgrastim product tested for biosimilarity with its reference product, Neupogen®. We conducted a comparative clinical trial of the 2 products.
Patients and methods: A randomized, open-label, 2-way crossover, single-dose Phase I study was conducted for 56 healthy subjects. After a 5 and 10 μg/kg single subcutaneous administration of test and reference product, pharmacokinetic and pharmacodynamic parameters (absolute neutrophil count and CD34+ cell count) were compared. During the study, safety tests and adverse event monitoring were performed.
Results: The test and the reference products had a comparable pharmacokinetic, pharmacodynamic, and safety profile. In both 5 and 10 μg/kg dosing, the 90% CIs of the test to reference ratio for primary parameters (peak plasma concentration and area under the plasma concentration vs time curve from time 0 extrapolated to the infinite time for plasma filgrastim concentration; maximal effect and area under the time-effect curve from time 0 to time of the last quantifiable effect for absolute neutrophil count) were within the 0.8–1.25 range. In addition, safety profiles between the 2 products were similar without any serious adverse events.
Conclusion: This study has provided firm clinical evidence that the test filgrastim product is similar to its reference filgrastim product.
Keywords: bioequivalence, biosimilar, G-CSF, biologics
Introduction
Intensive chemotherapy in cancer patients can cause neutropenic fever and infection, which delays chemotherapy cycles and increases mortality and morbidity of chemotherapy-treated patients.1 Granulocyte-colony stimulating factors (G-CSFs), which stimulate and control the proliferation and differentiation of leukocytes, neutrophils, and macrophages, help prevent bone marrow suppression and reduce the incidence of neutropenic fever.2,3 In addition, use of G-CSFs on febrile neutropenia is related to reduced infection-related death and all-cause mortality.4,5 Thus, prophylactic use of G-CSFs in patients at high risk (>20%) of fever and neutropenia is recommended.2
Neupogen® is the first commercial pharmaceutical analog of G-CSF from Amgen Inc. (Thousand Oaks, CA, USA), which was manufactured using recombinant Escherichia coli bacteria with human G-CSF gene. It has similarities to endogenous G-CSF in terms of structure (except for the addition of an N-terminal methionine), efficacy, and safety profile. It has been a great success since its first approval in 1998 and is still among the top 15 best-selling drugs of 2016.6
Several filgrastim products have been developed since the approval of the original product. In the European Union, starting from 2008, 9 filgrastim biosimilars were approved and 7 products are currently in use.7 In the USA, Sandoz Inc. (Princeton, NJ, USA) got approval of Zarxio®, which was the first biosimilar product passed through the US Food and Drug Administration (FDA) biosimilar approval pathway.8 In 2017, it is still the only biosimilar filgrastim product available in USA.
In Korea, Dong-A ST (Seoul, Korea) developed a recombinant human G-CSF, Leucostim®. It is synthesized by recombinant protein expression in E. coli and is activated by a refolding process. In the biochemical testing, it has been shown that the biological efficacy was equivalent to the endogenous G-CSF. The formulation is identical to the original product except addition of D-mannitol as an excipient.
It is essential to determine similarity between the biosimilar and the reference product. Tests should be done with regard to physicochemical characteristics (structure), biological activity/potency (function), safety, and efficacy profiles.9,10 In the process of biosimilar development, clinical pharmacology plays a critical part as it provides evidence that there are no clinically meaningful differences in terms of pharmacokinetics (PKs) and pharmacodynamics (PDs).11 To prove biosimilarity between the test filgrastim product and its reference filgrastim product, we conducted a comparative clinical trial of the 2 products.
Patients and methods
Study design
This study was conducted in accordance with the ethical principles of Good Clinical Practice and to the latest Declaration of Helsinki amendment. It was reviewed and approved by Severance Hospital Institutional Review Board, and the study information was registered on ClinicalTrials.gov (NCT02725086). This was a randomized, open-label, 2-way crossover, single-dose study with a washout period of 28 days. There were 2 dosing parts (5 and 10 μg/kg) in this study, with 2 sequences in them. In each sequence, 14 healthy subjects were assigned to either the test drug or the reference drug in a crossover manner. All the subjects received information on the details of the study and gave written informed consent. According to sequence and period, subjects received either a subcutaneous injection of the test product or the reference product. The overall study scheme is shown in Figure 1. The primary objective was to compare PK parameters (peak plasma concentration [Cmax] and area under the time-concentration curve from time 0 to infinity [AUCinf]) and PD parameters (maximal effect [Emax] and area under the time-effect curve from time 0 to 120 h [AUEC0–120 h] of absolute neutrophil count [ANC]) between the test product and the reference product.
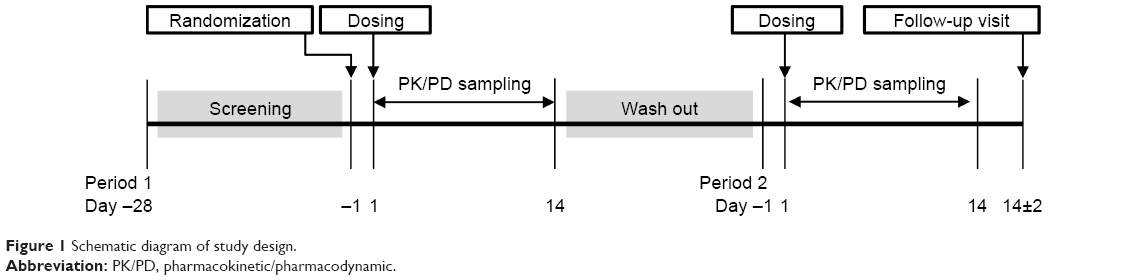 | Figure 1 Schematic diagram of study design. |
Subjects
Healthy male subjects aged 19–45 years volunteered for this study. Body mass index of the subjects had to be 18.5 kg/m2 or greater but <25.0 kg/m2, with a minimum weight of 60 kg. Subjects with histories of receiving recombinant G-CSF were excluded, and the ANC had to be between 2×10³/μL and 7×10³/μL. In the screening process, vital signs (blood pressure, pulse rate, and body temperature), laboratory analyses (hematology, blood chemistry, coagulation, urinalysis), 12-lead electrocardiogram (ECG), urine drug screening, and serology testing were performed. Fifty-six eligible subjects participated in the study. They had no clinically significant screening results and had no relevant medical or medication histories.
Procedures
After providing written informed consent, the subjects attended an initial screening visit to undergo screening procedures between 2 and 28 days prior to the first dosing. On Day -1, eligible subjects were admitted to the clinical trials center at Severance Hospital and randomized. After an overnight fast, subjects were administered a single dose of filgrastim on the early morning of Day 1. Either the test or reference drug was administered by the pre-assigned sequence. Blood was drawn for PK and PD evaluation at prespecified time points. On Day 3, the subjects had 48-hour PK/PD samples drawn, underwent a repeated safety assessment, and were discharged from the site. PD sampling after discharge was performed via subsequent visits according to a predetermined time schedule. After a 28-day washout period, period 2 was conducted in a crossover manner. On Day 14±2 of period 2, subjects underwent a follow-up visit for final safety assessments. During the hospital stay and at follow-up, adverse event (AE) monitoring, concomitant medication recording, laboratory analyses (hematology, blood chemistry, coagulation, urinalysis), physical examination, vital signs (blood pressure, pulse rate, and body temperature), and 12-lead ECG were also performed. To examine drug immunogenicity, anti-filgrastim antibodies test was performed at each admission and follow-up.
From 2 days prior to the first study drug administration, the subjects were prohibited from consuming excessive alcohol (>210 g/week) or caffeine. No alcohol, smoking, or xanthine beverage (coffee, coke, or tea) was allowed within 2 days prior to admission of each period. Drugs including ethical/over-the-counter drugs, vitamins, oriental medicines, and functional foods were restricted. Subjects received standard meals during hospital stay, and food or drink brought from outside was not allowed.
Drug assay and cell counting
For PK sampling, 8 mL blood sample was collected into an EDTA Vacutainer® based on the PK sampling schedule: at pre-dose (0 hours), and 1, 2, 3, 4, 5, 6, 8, 12, 16, 24, 36, and 48 hours post-dose. Within 60 minutes of blood draw, the blood sample was centrifuged (1,800 g, 4°C, 8 minutes to separate the plasma) and stored at −70°C or below until analysis. Plasma filgrastim concentrations were measured using a solid phase enzyme-linked immunosorbent assay (Quantikine® Human G-CSF Immunoassay; R&D Systems, Inc., Minneapolis, MN, USA). The range of calibration curve was set at 0–625 pg/mL and the lower limit of quantification was 5.05 pg/mL. The curves were determined to be linear with all coefficient values over 0.99. The accuracy was within 80%–120% and all quality control samples were within the pre-defined quality control range.
For analysis of ANC and CD34+ cell count, 3 mL of blood was collected into EDTA tubes. ANC sampling was performed at pre-dose (0 hours), and 2, 4, 8, 12, 16, 20, 24, 28, 36, 48, 72, 96, and 120 hours post-dose; and CD34+ cell count sampling was performed at pre-dose (0 hours), and 24, 48, 72, 96, 120, 168, 240, and 312 hours post-dose. PD samples were stored at ambient temperature prior to analysis. The ANC was measured using XN-series (Sysmex, Kobe, Japan). The CD34+ cell count was measured using a flow cytometer (BD™ FACSVerse™; BD Bioscience, San Jose, CA, USA) and enumeration kits for CD34+ cell (BD Stem Cell Enumeration Kit and BD Stem Cell Control Kit; BD Bioscience).
PK and PD analyses
The plasma concentration data of filgrastim, ANC, and CD34+ cell count was analyzed using non-compartmental analysis engine of Phoenix® WinNonlin® (version 6.4; Pharsight, CA, USA). The Cmax, Emax, and time to Cmax or Emax (tmax) were directly obtained from the raw data. The terminal slope of plasma filgrastim (λz) was calculated using the automated method, which is based on the maximum best-adjusted coefficient of determination (R2) with at least 3 points. The terminal half-life of plasma filgrastim (t1/2) was calculated as follows: t1/2 = ln2/λz. The area under the time-concentration curve (AUC0–last: from time 0 to time of the last quantifiable concentration; AUC0–∞: from time 0 extrapolated to infinity) and the area under the time-effect curve from time 0 to time of the last quantifiable effect (AUEC0–last) were calculated using the linear trapezoidal method.
Statistical analysis of PK and PD
The sample size was calculated by examining other products of rhG-CSF. From reviews of recently developed rhG-CSF products,12–14 the intra-subject coefficients of variations (CVw) of AUCinf and Cmax of filgrastim were 15.6%–20.29% and 13.64%–23.94%, respectively. Based on the data, using the greatest CVw, 23.94%, at a significance level of 0.05 with 80% power, the required sample size was calculated to be 11 subjects/group using a modified Hauschke’s equation.15 Using an assumption of a 20% dropout rate, the required sample size was 28 subjects/dosing part, to give 56 subjects in total.
The PK and PD population were defined as those who received the scheduled doses and PK and PD sampling schedules, respectively, according to the protocol. Descriptive statistics for PK and PD parameters were provided with the ranges of SDs except tmax (presented as median [min, max]). The primary PK (Cmax and AUC0–∞) and PD (Emax and AUEC0–last) parameters were log-transformed and determined whether the 90% CI of the test to reference ratio fell within the range of 0.8–1.25. For the test, a linear mixed effect analysis was performed using the bioequivalence engine in Phoenix WinNonlin (version 6.4). The model included sequence, subjects nested in sequences, period, and treatment.
Results
Fifty-six subjects were enrolled, and all subjects were administered the study drug at least once. Among them, 54 and 53 subjects who underwent the study schedule and had complete PK and PD study results were included in the PK analysis and PD analysis, respectively.
PKs
The plasma filgrastim concentrations, ANC, and CD34+ cell counts over time are shown in Figure 2 and PK parameters are provided in Table 1. For both the test and reference products, plasma concentrations of filgrastim started to increase from the time of subcutaneous administration and reached Cmax at 6 hours in both 5 and 10 μg/kg dose groups. After tmax, the concentrations decreased and reached nearly zero at 36 hours, with half-lives about 7 hours. In the PK analysis, primary assessment parameters (90% CIs of the ratios between the log-transformed Cmax and AUC0–∞ of the test and reference products) were within 0.8–1.25 (Table 1).
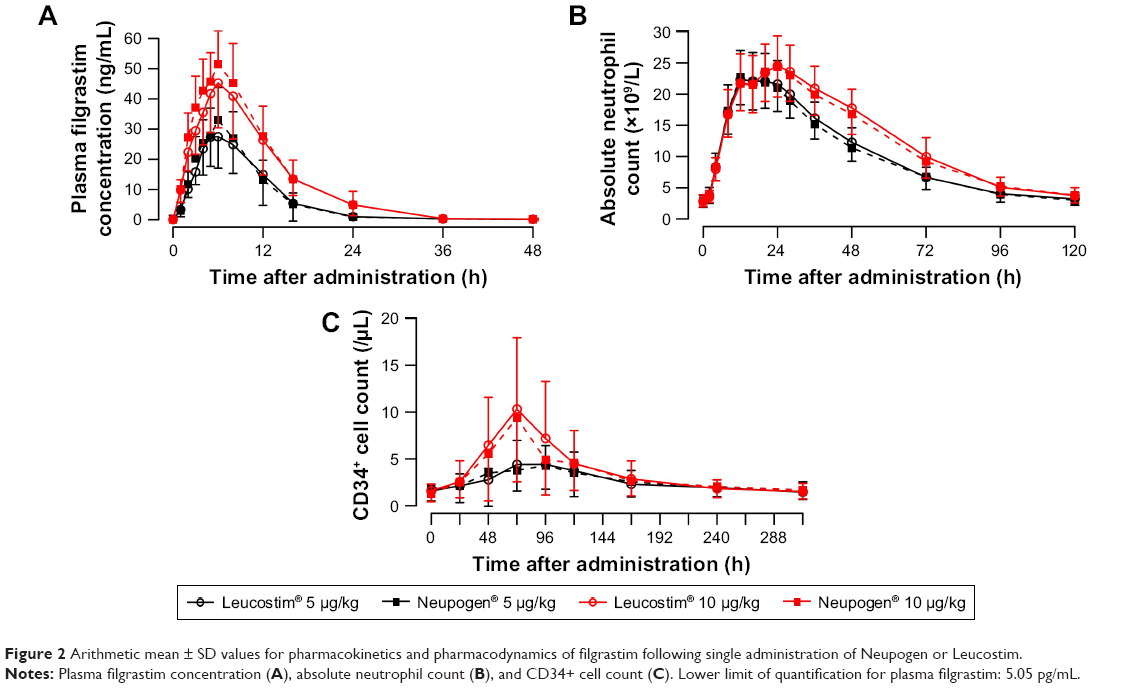 | Figure 2 Arithmetic mean ± SD values for pharmacokinetics and pharmacodynamics of filgrastim following single administration of Neupogen or Leucostim. |
 | Table 1 Pharmacokinetic and pharmacodynamic parameters for administration of Neupogen® or Leucostim® |
PDs
At the dose of 5 μg/kg, ANC showed median tmax values of 18 and 12 hours for the test and reference drug, respectively; while the median tmax values were identical at 24 hours at 10 μg/kg dose. For doses of 5 and 10 μg/kg, CD34+ cell counts reached tmax at 96 and 72 hours, respectively, regardless of study drug. The primary assessment parameters for PD, Emax and AUEC0–last for ANC, and the 90% CIs of the ratios of the log-transformed values of the test to reference products were within 0.8–1.25 (Table 1).
Safety
During the study, 29 subjects reported 60 AEs related to the study drug (Table 2). Most AEs were related to pain and blood disorders, including back pain, neutropenia, and leukopenia. All AEs were mild in severity and none serious. At post-study period, subjects with AEs were followed up and all contactable subjects were confirmed to have fully recovered. In addition, no subjects in this study developed anti-filgrastim antibodies during hospital stay and at follow-up.
 | Table 2 Summary of adverse events by system organ class |
Discussion
The purpose of this study was to compare PK, PD, and safety between a biosimilar filgrastim product and the reference product following a single subcutaneous injection. According to the FDA biosimilar guidance, the dose selected should be one most likely to provide clinically meaningful and interpretable data.11 Because the development plan aimed to use the test product for the indications of the reference product at doses of 5 and 10 μg/kg, this study was conducted with the 2 dosing parts (5 and 10 μg/kg). The sampling schedule were set based on PK data of the reference product14,16–18 and the in-house test product data. The sampling intervals were appropriately set to observe the profiles of PK and PD, and the last time points were set sufficiently long for all measurements to return to the baselines.
To prove biosimilarity between the 2 filgrastim products, ANC and CD34+ cell counts were evaluated as well as plasma drug concentration measurements.14,19 On PK evaluation, the 90% CIs of the test to reference ratios for the primary assessment parameters (Cmax and AUC0–∞) were within 80%–125%, suggesting that a sufficient similarity exists between the 2 products. In PD evaluation, Emax and AUEC0–last for ANC were primary assessment parameters, and the 90% CIs were also within 0.8–1.25 range. Although one of the secondary assessment parameters of PD, the 90% CI for Emax of CD34+ cell counts, at 5 μg/kg dose fell outside 0.8–1.25 range, the other CIs were within the ranges that satisfy biosimilarity. The overall effect-time profiles between the 2 products could be considered comparable.
Regarding the safety, occurrence of AEs for the 2 products appeared to be similar (Table 2). The most frequent AE was pain, which was consistent with the pivotal clinical trial that showed around 20% of patients with mild-to-moderate bone pain.20 Regardless of product, pain seems to occur depending on dose. Almost double the subjects suffered from pain when the dose doubled. In other biosimilar filgrastim products, pain-related disorders were also the major AEs and, generally, the safety profile was comparable.14,16,17,21–25 Disorders related to laboratory results such as neutropenia or “blood creatinine phosphokinase increased” were only observed in this study. Nevertheless, it is unlikely that the AEs are product-specific, and it is possibly attributed to the AE collection method because the AEs were observed both in the test and the reference.
Conclusion
A clinical study with a filgrastim biosimilar product, and its reference product was conducted to evaluate biosimilarity between the 2 products in terms of PKs, PDs, and safety. The analyses of primary PK and PD parameters showed sufficient biosimilarity between the 2 products, and the safety profiles were comparable.
Acknowledgment
This study was supported by the Global Center of Excellence in Clinical Trials (HI14C1062), Yonsei University Health System funded by Ministry of Health and Welfare, Korea.
Author contributions
CC contributed to study design, trial operation, data analyses, and manuscript review. BWY contributed to study design, trial operation. COK contributed to study design and trial operation. TH contributed to study design and trial operation. BHJ contributed to study design and trial operation. KSS contributed to study design and manuscript review. JYJ contributed to study design and manuscript review. MSP contributed to study design, trial operation, and manuscript review. All authors contributed toward data analysis, drafting and revising the paper and agree to be accountable for all aspects of the work.
Disclosure
The authors report no conflicts of interest in this work.
References
Crawford J, Dale DC, Lyman GH. Chemotherapy-induced neutropenia: risks, consequences, and new directions for its management. Cancer. 2004;100(2):228–237. | ||
Freifeld AG, Bow EJ, Sepkowitz KA, et al. Clinical practice guideline for the use of antimicrobial agents in neutropenic patients with cancer: 2010 update by the infectious diseases society of america. Clin Infect Dis. 2011;52(4):e56–e93. | ||
Gomez Raposo C, Pinto Marin A, Gonzalez Baron M. Colony-stimulating factors: clinical evidence for treatment and prophylaxis of chemotherapy-induced febrile neutropenia. Clin Transl Oncol. 2006;8(10):729–734. | ||
Pinto L, Liu Z, Doan Q, Bernal M, Dubois R, Lyman G. Comparison of pegfilgrastim with filgrastim on febrile neutropenia, grade IV neutropenia and bone pain: a meta-analysis of randomized controlled trials. Curr Med Res Opin. 2007;23(9):2283–2295. | ||
Kuderer NM, Dale DC, Crawford J, Lyman GH. Impact of primary prophylaxis with granulocyte colony-stimulating factor on febrile neutropenia and mortality in adult cancer patients receiving chemotherapy: a systematic review. J Clin Oncol. 2007;25(21):3158–3167. | ||
Philippidis A. The top 15 best-selling drugs of 2016 – prospect of price curbs may dent future results for blockbusters. The Lists. 2017; Available from: http://www.genengnews.com/the-lists/the-top-15-best-selling-drugs-of-2016/77900868. Accessed July 13, 2017. | ||
European public assessment reports. EMEA; 2017. Available from: http://www.ema.europa.eu/ema/index.jsp?curl=pages/medicines/landing/epar_search.jsp&mid=WC0b01ac058001d124&searchTab=searchByKey&keyword=filgrastim&searchType=inn&alreadyLoaded=true&status=Authorised&status=Withdrawn&status=Suspended&status=Refused&jsenabled=false&searchGenericType=generics&orderBy=authDate&pageNo=1. Accessed Jun 16, 2017. | ||
FDA approves first biosimilar product Zarxio. FDA News Relase. 2015; Available from: https://www.fda.gov/newsevents/newsroom/pressannouncements/ucm436648.htm. Accessed July 16, 2017. | ||
Guideline on similar biological medicinal products. 2014. Available from: http://www.ema.europa.eu/docs/en_GB/document_library/Scientific_guideline/2014/10/WC500176768.pdf. Accessed June 26, 2018. | ||
Scientific considerations in demonstrating biosimilarity to a reference product. 2015. Available from: https://www.fda.gov/downloads/Drugs/GuidanceComplianceRegulatoryInformation/Guidances/UCM291128.pdf. Accessed June 26, 2018. | ||
Clinical pharmacology data to support a demonstration of biosimilarity to a reference product. 2016. Available from: https://www.fda.gov/downloads/Drugs/GuidanceComplianceRegulatoryInformation/Guidances/UCM397017.pdf. Accessed June 26, 2018. | ||
CHMP assessment report for Zarzio. London, UK: EMEA; 2008. EMEA/CHMP/651339/2008. | ||
CHMP assessment report: Nivestim. London, UK: CHMP; 2010. EMA/262762/2010. | ||
Sorgel F, Schwebig A, Holzmann J, Prasch S, Singh P, Kinzig M. Comparability of biosimilar filgrastim with originator filgrastim: protein characterization, pharmacodynamics, and pharmacokinetics. BioDrugs. 2015;29(2):123–131. | ||
Hauschke D, Steinijans VW, Diletti E, Burke M. Sample size determination for bioequivalence assessment using a multiplicative model. J Pharmacokinet Biopharm. 1992;20(5):557–561. | ||
Waller CF, Bronchud M, Mair S, Challand R. Pharmacokinetic profiles of a biosimilar filgrastim and Amgen filgrastim: results from a randomized, phase I trial. Ann Hematol. 2010;89(9):927–933. | ||
Waller CF, Bronchud M, Mair S, Challand R. Comparison of the pharmacodynamic profiles of a biosimilar filgrastim and Amgen filgrastim: results from a randomized, phase I trial. Ann Hematol. 2010;89(10):971–978. | ||
Lubenau H, Bias P, Maly AK, Siegler KE, Mehltretter K. Pharmacokinetic and pharmacodynamic profile of new biosimilar filgrastim XM02 equivalent to marketed filgrastim Neupogen: single-blind, randomized, crossover trial. BioDrugs. 2009;23(1):43–51. | ||
Guidance on similar medicinal products containing recombinant granulocyte-colony stimulating factor. 2006. Available from: http://www.ema.europa.eu/docs/en_GB/document_library/Scientific_guideline/2009/09/WC500003955.pdf. Accessed June 26, 2018. | ||
Crawford J, Ozer H, Stoller R, et al. Reduction by granulocyte colony-stimulating factor of fever and neutropenia induced by chemotherapy in patients with small-cell lung cancer. N Engl J Med. 1991;325(3):164–170. | ||
Lubenau H, Sveikata A, Gumbrevicius G, et al. Bioequivalence of two recombinant granulocyte colony-stimulating factor products after subcutaneous injection in healthy volunteers. Int J Clin Pharmacol Ther. 2009;47:275–282. | ||
Abraham I, Tharmarajah S, MacDonald K. Clinical safety of biosimilar recombinant human granulocyte colony-stimulating factors. Expert Opin Drug Saf. 2013;12:235–246. | ||
Matsuguma K, Matsuki S, Sakamoto K, et al. A comparative pharmacokinetic and pharmacodynamic study of FSK0808 versus reference filgrastim after repeated subcutaneous administration in healthy Japanese men. Clin Pharmacol Drug Dev. 2015;4:99–104. | ||
Gascon P, Fuhr U, Sorgel F, et al. Development of a new G-CSF product based on biosimilarity assessment. Ann Oncol. 2010;21:1419–1429. | ||
Lubenau H, Bias P, Maly AK, Siegler KE, Mehltretter K. Pharmacokinetic and pharmacodynamic profile of new biosimilar filgrastim XM02 equivalent to marketed filgrastim Neupogen: single-blind, randomized, crossover trial. BioDrugs. 2009;23:43–51. |
 © 2018 The Author(s). This work is published and licensed by Dove Medical Press Limited. The full terms of this license are available at https://www.dovepress.com/terms.php and incorporate the Creative Commons Attribution - Non Commercial (unported, v3.0) License.
By accessing the work you hereby accept the Terms. Non-commercial uses of the work are permitted without any further permission from Dove Medical Press Limited, provided the work is properly attributed. For permission for commercial use of this work, please see paragraphs 4.2 and 5 of our Terms.
© 2018 The Author(s). This work is published and licensed by Dove Medical Press Limited. The full terms of this license are available at https://www.dovepress.com/terms.php and incorporate the Creative Commons Attribution - Non Commercial (unported, v3.0) License.
By accessing the work you hereby accept the Terms. Non-commercial uses of the work are permitted without any further permission from Dove Medical Press Limited, provided the work is properly attributed. For permission for commercial use of this work, please see paragraphs 4.2 and 5 of our Terms.