")
Back to Journals » Journal of Multidisciplinary Healthcare » Volume 17
Classification of Chest CT Lung Nodules Using Collaborative Deep Learning Model
Authors Alshamrani K , Alshamrani HA
Received 21 December 2023
Accepted for publication 8 March 2024
Published 4 April 2024 Volume 2024:17 Pages 1459—1472
DOI https://doi.org/10.2147/JMDH.S456167
Checked for plagiarism Yes
Review by Single anonymous peer review
Peer reviewer comments 2
Editor who approved publication: Dr Scott Fraser
Khalaf Alshamrani,1,2 Hassan A Alshamrani1
1Radiological Sciences Department, Najran University, Najran, Saudi Arabia; 2Department of Oncology and Metabolism, University of Sheffield, Sheffield, UK
Correspondence: Khalaf Alshamrani, Department of Oncology and Metabolism, University of Sheffield, Sheffield, UK, Email [email protected]; [email protected]
Background: Early detection of lung cancer through accurate diagnosis of malignant lung nodules using chest CT scans offers patients the highest chance of successful treatment and survival. Despite advancements in computer vision through deep learning algorithms, the detection of malignant nodules faces significant challenges due to insufficient training datasets.
Methods: This study introduces a model based on collaborative deep learning (CDL) to differentiate between cancerous and non-cancerous nodules in chest CT scans with limited available data. The model dissects a nodule into its constituent parts using six characteristics, allowing it to learn detailed features of lung nodules. It utilizes a CDL submodel that incorporates six types of feature patches to fine-tune a network previously trained with ResNet-50. An adaptive weighting method learned through error backpropagation enhances the process of identifying lung nodules, incorporating these CDL submodels for improved accuracy.
Results: The CDL model demonstrated a high level of performance in classifying lung nodules, achieving an accuracy of 93.24%. This represents a significant improvement over current state-of-the-art methods, indicating the effectiveness of the proposed approach.
Conclusion: The findings suggest that the CDL model, with its unique structure and adaptive weighting method, offers a promising solution to the challenge of accurately detecting malignant lung nodules with limited data. This approach not only improves diagnostic accuracy but also contributes to the early detection and treatment of lung cancer, potentially saving lives.
Keywords: CT images, lung cancer, nodules, logistic regression, collaborative deep learning, standard deviation, radial length
Introduction
According to the 2015 Global Cancer Statistics, 13% of 14.1 million new cancer diagnoses and 19.5% of cancer deaths are lung cancer.1 Radiologist workload may be eased by advanced cancer patients’ five-year survival rate. Multi-categorizing different replies may alleviate this problem. Recent photo categorization algorithms include K-Mean, K-NN, deep neural networks, SVM, and others. Artificial neural networks are used for pattern categorization. Recently, academics have focused on the convolutional neural network (CNN), often called as.1 It provides accurate results in picture classification, recognition, language translation, medical diagnostics, and other domains. Also used in other areas.
This research uses a convolutional neural network model called Multi-CNNs. This research gives model component output synthesis. We found a Multi-CNNs model workable in 96% of our x-ray picture dataset. Analyzing images led to these results.
Deep learning dominates machine learning research.2 Deep learning has improved audio recognition, social network filtering, computer translation, and biology. Programs provide accurate outcomes.
Many pattern recognition issues have been solved using CNN since its inception. These topics include computer vision, voice recognition, picture classification, identification, language translation, medical diagnostics, and others. CNNs filter and compress data into layers for clarity and use. These filters automatically update to extract the most important information without feature selection using learning parameters (the kernel) in these neural layers.
CNN employs images better than others. Pictures are hard to classify using standard neural networks.
Imaging anomalies are a major challenge for doctors when diagnosing disorders. A precise detection method helps doctors diagnose and treat patients. Deep learning for medical picture anomaly detection is attracting researchers.
In,3 use digital image processing technology and radiologists’ advice to create a simple preparation pipeline; use all three neural network topologies shown to be beneficial in classification; and use neural network visualisation technology to learn what our model values most.4 The study categorizes cancer-prone lung nodules using deep learning, a revolutionary image recognition method.5 The study suggests a novel CT scan image division method to locate all nodules. For method, see publishing. Then, an SVM classifies candidates by image moment and texture. Some nodule candidates are recorded, while others rejected.
We compared the suggested method to nearest neighbor categorization. Much improved nearest neighbor classifier performance. Proof showed that SVM performance never changed. Despite misidentifying eight nodules, their method detected all fifty in all fifty pictures. Additionally, this method matches these qualities to give a visually comparable output.
Early lung cancer diagnosis is critical for treatment. Early detection by CT screening decreases lung cancer fatalities by 20%, according to the National Lung Screening Trial.5,6 Nodules, or “spots on the lung” on chest CTs, may be benign or malignant.7 Small tumors cause most lung malignancies. Two factors make benign and malignant nodule chest CT imaging challenging to interpret. Lung nodules have several shapes and textures, making them challenging to recognize. This hinders diagnosis. Secondary reason: malignant and benign nodules appear same. Non-specialists may have problems distinguishing them.
Pulmonary CADs isolate nodules from the background, segment them, extract characteristics, and train a classifier to identify whether they are benign or cancerous. Basic nodule segmentation starts with lung segmentation. Second, discover and segment the nodule’s ROI. Nodule tip segments. Morphological,8,9 geographical,10,11 energy,11,12 or statistical learning13,14 are examples. This was achieved by correcting nodule segmentation. These extras are shown below. Only 5% of stage IV lung cancer patients benefit from this treatment, although 60% of early-diagnosed patients with tiny original tumors do.6 Early lung cancer identification when curable is key.
To recognize lung nodules,15 used a trainable multi-view convolutional neural network (MV-CNN). It was done to boost their prospects.16 proposed multi-scale CNN for lung nodule tissue heterogeneity. This is done by mining unique alternating layer characteristics. They autonomously extracted nodule data using a multi-crop CNN.16 This improved model accuracy. This was accomplished via the above action.17 CNN design options are evaluated utilizing three key elements of using deep convolutional neural networks to computer-aided detection. Unknown characteristics.
Modeling methods have helped cancer researchers understand the complex dynamics of cancer development and medication response. According to current research,18 continuous models reflect nonstop biological processes associated to cancer growth mathematically. Modeling cancer cell gene and protein regulation networks using boolean models is simple yet effective. This method can model and predict cancer activity in diverse genetic and environmental circumstances. Randomness and variability in cancer development may be included in stochastic Markov chain models to investigate mutation events and therapeutic outcomes.19,20
These modeling methods in cancer research show how complex the disease is and how many ways it may be treated. These models enhance cancer biology knowledge and aid diagnostic and therapeutic development. This publication emphasizes chest CT lung nodule classification. By using these modeling tools, we may better analyze and comprehend imaging data and determine if lung nodules are cancerous or benign.
Here, a deep neural network-based method analyzes chest CT scan data to identify benign and malignant lung nodules. This cooperative deep learning model categorizes. Understanding lung nodules’ six features helps you comprehend their behavior. Use image patches to create CDL submodels. This optimizes networks. Error back propagation teaches nine simultaneous CDL submodels an adaptive weighting strategy to categorize nodules. Comprehensive CDL model training is possible. The whole CDL model may be taught in one operation. In the CDL model, a penalty loss function controls false positive and false negative rates. The objective is to decrease false positives and negatives.
Contribution
It is feasible to train the complete model in an end-to-end way by fusing numerous feature submodels at the decision level. This makes it possible to train the entire model. This not only enhances the accuracy of classification but also removes the necessity for the laborious adjustment of weighting parameters.
The findings indicate that our approach results in a substantial improvement in performance, which lends credence to the notion that our model might be implemented into a conventional clinical workflow. The fact that our approach results in a significant improvement in performance demonstrates this point.
Proposed Method
The methodology section of the manuscript outlines a comprehensive approach to classifying lung nodules using a Collaborative Deep Learning (CDL) model. Initially, mathematical formulas are applied for feature extraction from tumor shapes, essential for distinguishing between malignant and benign nodules. Subsequently, logistic regression analysis is employed to explore the relationship between these features and nodule malignancy, aiding in the selection of relevant features. The CDL model is then developed by processing lung nodule slices, extracting feature patches with a UNet network, and training CDL submodels using pre-trained ResNet-50 networks. Finally, the model’s accuracy is validated through cross-validation and testing on separate datasets, ensuring its applicability and reliability in clinical settings. This methodology provides a detailed and logical framework for lung nodule classification, emphasizing the importance of each step in achieving accurate and reliable results.
Tumor Shape Based Features Extraction
Tumour shape-based feature extraction is a technique that may be used to extract characteristics about a tumour, which can then be put to use in classification. This approach may be used to, for example, extract features about different types of tumours. The process of extracting characteristics from the forms of tumours is referred to as “feature extraction based on tumour form”. When attempting to define the shape of a tumour, one could utilise a variety of distinct qualities. This group is classified by area, perimeter, symmetry, roundness, and compactness. Segmenting an image means separating its parts. “Image segmentation” may also refer to the task’s result. Systematic image segmentation is possible. After segmenting the tumour from its surrounding tissue, form aspects may be studied. Contour analysis uses edge contours to assess an object’s shape. The tumor’s contour may determine its shape. This technique is cheaper and non-invasive. It classifies tumour data from several imaging modalities. It has been shown to be effective in classifying a variety of cancers, which is information that is crucial for the field of medicine. It’s conceivable that it’s too sensitive to the surrounding noise. There is a possibility that it will not be able to classify tumours that are either very small or have an irregular appearance. In order to properly train with it, a significant amount of data is required.
Tumour geometry G, normalised radial length lradial, standard deviation of the normalised radial length SDradial, entropy of the radial length histogram E, area ratio Rarea, and boundary roughness Brough were the tumour shape describing parameters that were used in this paper. The following formula was used to get the normalised radial length from the center of the tumour to the edge of the full boundary:
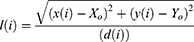
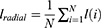
Where x(i), y(i) are the coordinates of the center and border pixel, respectively. The average radial length after normalisation was found to be
The formula for determining the geometry of a tumour was as follows

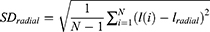
where P is the perimeter of the tumour and a is its area. Following is the calculation that was used to get the standard deviation of the normalised radial length
The roundness and roughness of the histogram of normalised radial length is represented by the entropy, denoted by E.
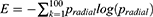
Pradial was the probability that the radial length falls inside each segment of the radial length. The area ratio, denoted by the letter A, was used to determine the proportion of the tumour that was located outside the normalised radial length circle,
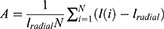
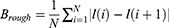
where  The boundary roughness index, denoted by the symbol Brough, was determined for each individual segment using the following formula:
Logistic Regression Based Analysis
In the study that was based on logistic regression, the six predictor variables that were employed were the geometry of the tumour, the mean of the normalised radial length, the standard deviation of the normalised radial length, the entropy of the radial length histogram, the area ratio, and the border roughness. Additionally, the tumor’s geometry was one of the predictor variables. The selection of the independent variables was carried out using a method that moved ahead step by step. The significant level of a variable’s statistical score was evaluated, and the variable was included to the model if it had a level of significance that was lower than 0.05. Estimating an individual’s likelihood of developing a malignant breast tumour required applying the regression equation that was obtained from each of the training subsets to the cross-validation subset that had just been removed from the dataset. The formula for calculating this probability, Pradial, is as follows:
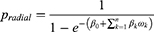
where, β0 is tumor geometry intercept, βk are coefficients calculated from the region, and ωk is the regression threshold that is being used to predict the outcome whose value is taken as 0.4 for reference. If this value is above 0.4 then the regression results have less probability so the outcome is weak and vice-versa.
The Proposed Collaborative Deep Learning (CDL) Model
The CDL model in the study utilizes recent advancements in lung nodule categorization using creative methods. The CDL model combines the results of several deep learning models to collectively leverage their strengths, with the goal of achieving increased accuracy in the classification of lung nodules from chest CT images. This integration showcases the use of advanced deep learning methods in the particular area of lung nodule classification, which is a refined application within the field of medical imaging. The approach focuses on using sophisticated feature extraction methods, utilizing a UNet network to extract feature patches from 2D lung nodule slices, and training CDL submodels with pre-trained ResNet-50 networks. This guide outlines a thorough method for feature extraction and model training, using convolutional neural networks and collaborative learning to enhance the accuracy of lung nodule classification. This method enhances diagnosis accuracy in medical imaging and demonstrates the use of collaborative deep learning in tackling difficulties related to lung cancer detection and treatment planning.
Collaborative deep learning, or CDL, is a machine learning approach that integrates many deep learning models to enhance overall performance. CDL may be used in lung tumor classification to combine information from many deep learning models to identify malignant nodules more accurately. Deep learning techniques are used to extract characteristics from chest CT images. A feature vector is generated by combining all properties acquired by the model. This is achieved by calculating a weighted average, where the weights are determined based on the performance of each model on a validation set. A logistic regression model is used to the fused feature vector to classify the nodule as benign or malignant. CDL combines several deep learning models to enhance accuracy in identifying lung nodules. Despite a small training dataset, CDL may still be used to classify lung nodules. Since CDL is a relatively new technique, there is definitely room for further advancement. CDL may be computationally demanding.
The proposed collaborative deep learning (CDL) approach comprises four essential steps:
2D Lung Nodule Extraction
It is assumed that lung nodules had been identified, and as a result, the focus of our research is restricted to the classification lung nodules. The position of a nodule is defined as the midpoint of the nodule’s centres that were supplied by the radiologists. This helped us avoid the error that was created by the process of nodule detection. After that, the 2D nodule slice is extracted.
Extraction of Feature Patches
In order to successfully remove patches from the lung, it is required to first segment the lung nodules that are present on each slice. This is done so that the patches may be correctly classified according to the tumour geometry G, the normalised radial length lradial, the standard deviation of the normalised radial length SDradial, the entropy of the radial length histogram E, the area ratio Rarea, and the boundary roughness Brough. In order to specifically distinguish the lung nodule, and made use of a fully convolutional network (FCN) model that is referred to as the UNet network.21 The conventional method of implementing convolutional neural networks is known as the collapsing pathway. It is made up of two padded 3×3 convolutional layers, and the ReLU function is placed in the very last position after those layers. In this article, the fundamental structure of a convolutional neural network is broken down into its component parts. The final feature maps are downsampled by employing maximum pooling layers, and each of these layers is a square with a stride of two and has a dimension of two by two. Upsampling the feature maps is the first step in the procedure for the expanding path, which is followed by a 2×2 convolutional layer, a concatenation with the corresponding feature map from the contracting path, two 3×3 convolutional layers, and finally the ReLU function. The upsampling of the feature maps at the beginning of this procedure is the first step. After the conclusion of each expansion phase, there will be a concatenation with the feature map corresponding to the prior period of contraction. The last stage of the route extension process is referred to as “concatenation”, and it entails integrating all of the feature maps into a single complete document.
Each 32-component feature vector is transformed into the input number of classes by the last layer, a 1×1 convolutional layer. The model’s results are generated in this layer.
U-Net is employed as a tool for doing data analysis, and supplemented it with 10-fold cross validation. After the first nine folds, you will find a total of 195 nodules; however, by the time you reach the tenth fold, that number will have decreased to 190. The remaining nodules were utilised to train the U-Net after a random selection of some nodules was performed at the beginning of each iteration for the purpose of participating in the testing procedure. This suggests that the testing set has in no way, shape, or form been used in the learning process associated with the U-Net. When fully training the network, each of the training photographs and the segmentation maps that related to them were employed. This ensured that the network received a comprehensive education. Because of this, there was a decrease in the total amount of cross entropy loss that took place during the operation. This was a direct result of what took place. The overlap of the highlighted areas that were created by the radiologists is what is meant to be considered a segmentation map. This is how it should be interpreted, after all. Mini-batch stochastic gradient descent techniques with a batch size of 32 were shown to be the most effective approach to finding a solution. This came to light after intensive research. To get the highest possible level of performance, increase the maximum number of iterations to 100 and decreased the learning rate to 0.001%. An arbitrary way is used to choose 10% of the training patches as a validation set. Our method was put to the test with this data set. Training is halt before the maximum number of epochs is reached if the error rate on the validation set stops reducing while it continues to decrease on the remaining 90% of the training patches. Because of this, the training algorithm will be able to provide the highest quality of outcomes that it is capable of. This is the outcome that would occur in the event if the error rate in the validation set remained same while it decreased in the remaining 90% of the training patches. That is to say, if progress towards lowering the error rate on the validation set stalls, this will happen. The trained U-Net was utilised to perform slice-by-slice nodule segmentation during the testing phase.
As a result of the segmentation of the nodule, a patch that consisted of a square ROI that fully surrounded the nodule on each slice was identified as being appropriate. This patch was used to illustrate the overarching appearance of the lung nodule. These patches, which were produced on the different slices, may be found in sizes ranging from very small to quite large. In order to determine the severity of the nodule, the value of each voxel inside the patch that did not include a nodule was set to 0. In addition, if this patch was larger than 16 voxels by 16 voxels, which is the standard size for patches in general, then a patch consisting of 16 voxels by 16 voxels was extracted from the larger patch. This extracted patch included the greatest number of nodule voxels.
Because data augmentation stops deep learning models from becoming overly specific by adding new variables to the dataset,22 made the decision to generate four sets of augmented data for each training patch by randomly translating, rotating, and flipping either the horizontal or the vertical components of the picture.16 After that, the measurements of each feature patch were reworked to be exactly 224 pixels on each side.
CDL Submodel
In order to train a CDL submodel that consists of three pre-trained ResNet-50 networks,23 all of the patches that were obtained from 6 characteristics were used, in addition to the updated data. This was done in order to ensure that the best results were achieved. The patches were grouped together according to the underlying model that was used. The ResNet-50 network was used so that the objectives of this experiment could be successfully completed. It is constructed up of fifty learnable layers, some of which include a 7×7 convolutional layer that generates sixty-four feature maps, a 3×3 max pooling layer, four bottleneck designs, an average pooling layer, and an FC layer that consists of one thousand neurons. In addition to that, it features a pooling layer that is around average. The bottleneck designs all have either an 11, 33, or 11-square-meter map size for each of the three convolutional layers that make up the design. As the layer increases deeper, the feature map channel gets larger for the first through fourth bottleneck layers. On the other hand, the feature map size, which is often also referred to as the output size, gets less and smaller as time goes on.
Through training using the ImageNet dataset,23,24 the parameters that are necessary to initialise each ResNet-50 network have been brought closer together. This was done in order to define lung nodules using the image representation skill that was gained by working with large-scale picture databases. As a consequence of this, the capacity to correctly depict pictures has been successfully conveyed. To begin the process of customising the ResNet-50 network to solve our challenge of distinguishing between benign and malignant nodules, and is started by removing the network’s last completely linked layer. This allowed us to better tailor the network to our situation. Following that, three more completely linked layers are added, with a total of 2048, 1024, and 2, respectively, in each of those levels’ respective neuronal populations, accordingly. In the end, a solution is found by classifying the nodules as either benign or cancerous. It was chosen to utilise the sigmoid function as the activation function for the final layer, and the Xaiver method was used in order to obtain random starting weights for each of these three layers that are completely linked. The sigmoid function will be used as the activation function for the final layer. After then, the updated ResNet-50 network was fine-tuned using a procedure that included refining each layer in the network one at a time, beginning with the very top layer and working down through the network until all of the layers had been improved.
The patches be designated by for the kth CDL submodel. After that, the output of the CDL submodel may be determined by performing a summation over all patches. The weights were constructed between the ResNet-50 networks’ final output layers and their final output layers of the kth CDL submodel. This can be done by using the formula summing over all patches using the assemble of weights. In each ResNet-50 network, the neuron that corresponds to the value i in the parameter iϵ{1,2} is the ith output layer neuron. The term “summation over patches” refers to the process of calculating the weighted sum of all of the outputs from each ResNet-50 network. In each CDL submodel, the jth neuron of the output layer is indicated by the parameter jϵ{1,2}.
CDL Based Classification
The prediction that was made by the CDL model is what was produced by this classification layer as its output. In situations when there has been a misclassification, the cross-entropy loss is often indifferent to the determination of the category to which it should have been assigned.25 However, erroneously diagnosing a malignant nodule as benign (also known as a false negative) may have a higher financial effect than incorrectly classifying a benign nodule as malignant (also known as a false positive). This is because incorrectly classifying a benign nodule as malignant results in a false positive. This is due to the fact that the clinical practises may get erroneous reassurance that the nodule is benign, and as a consequence, they may pass up the chance to treat an early lung malignancy in an efficient way.
Evaluation
Before the CDL model was placed through the 10-fold cross validation technique, it was applied to the Kaggle dataset26 five times in a way that was completely independent of one another from the previous application.27,28 The precision of our model is proof that our method is effective in determining whether or not nodules include cancerous cells. This may be determined by looking at the nodules. The percentage of malignant and benign nodules that are accurately detected may be determined by using the sensitivity and specificity of a test. The term “precision” refers to the ratio of the number of “true positive” instances that are returned to the total number of “positive” cases in a sample. The F-score is an assessment of the accuracy of an exam, and it takes both recall and precision into account when calculating the final result. Any unequal treatment given to the various groups is taken into consideration by the AUC. The CDL model is examined against lung nodule categorization strategies. Detailed explanations of these procedures may be found in the introductory section.
Results and Discussion
There are 175 clinical chest CT images with lung nodules included in the Kaggle dataset.26
In this investigation, only nodules that were larger than 3 millimetres in diameter are examined since, according to the most recent screening guidelines,15–17 nodules smaller than 3 millimetres were not deemed to be clinically significant.
Each lesion is examined by using a scale with five points that ranged from benign to malignant to determine whether or not the tumour was cancerous. These procedures were based on the procedures that were used in previous studies.15–17
The qualitative results are shown in Figures 1–3. The calculated values for the six feature variables  are shown in Table 1 under each tumour class. Table 2 displays tumour categorization. The results of the regression analysis are summarised in Table 2, which gives an accessible format. Following completion of the logistic regression analysis, it was discovered that the geometry of the tumour, the standard deviation of the normalised radial length, and the roughness index were the three parameters that caused the most significant correlation between the two variables. The performance of the regression analysis is listed in Table 2 with a Pradial value of 0.1 to 1.
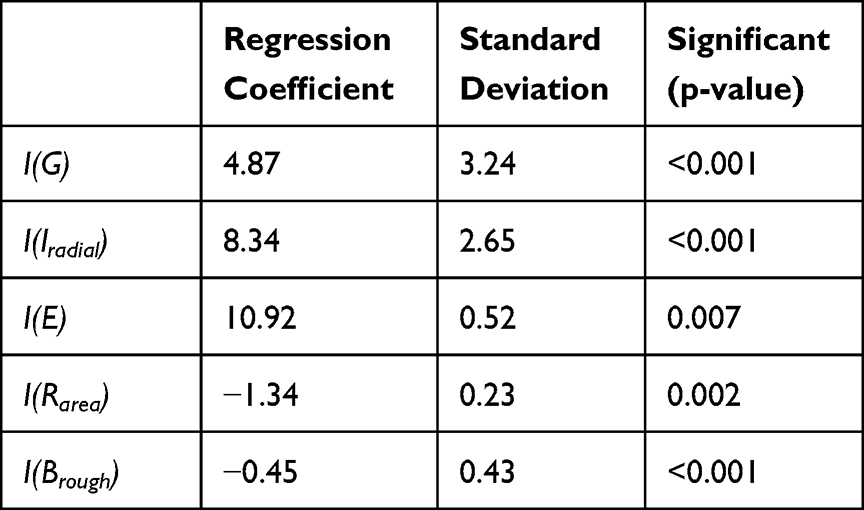 |
Table 1 Feature Selection Results from Logistic Regression |
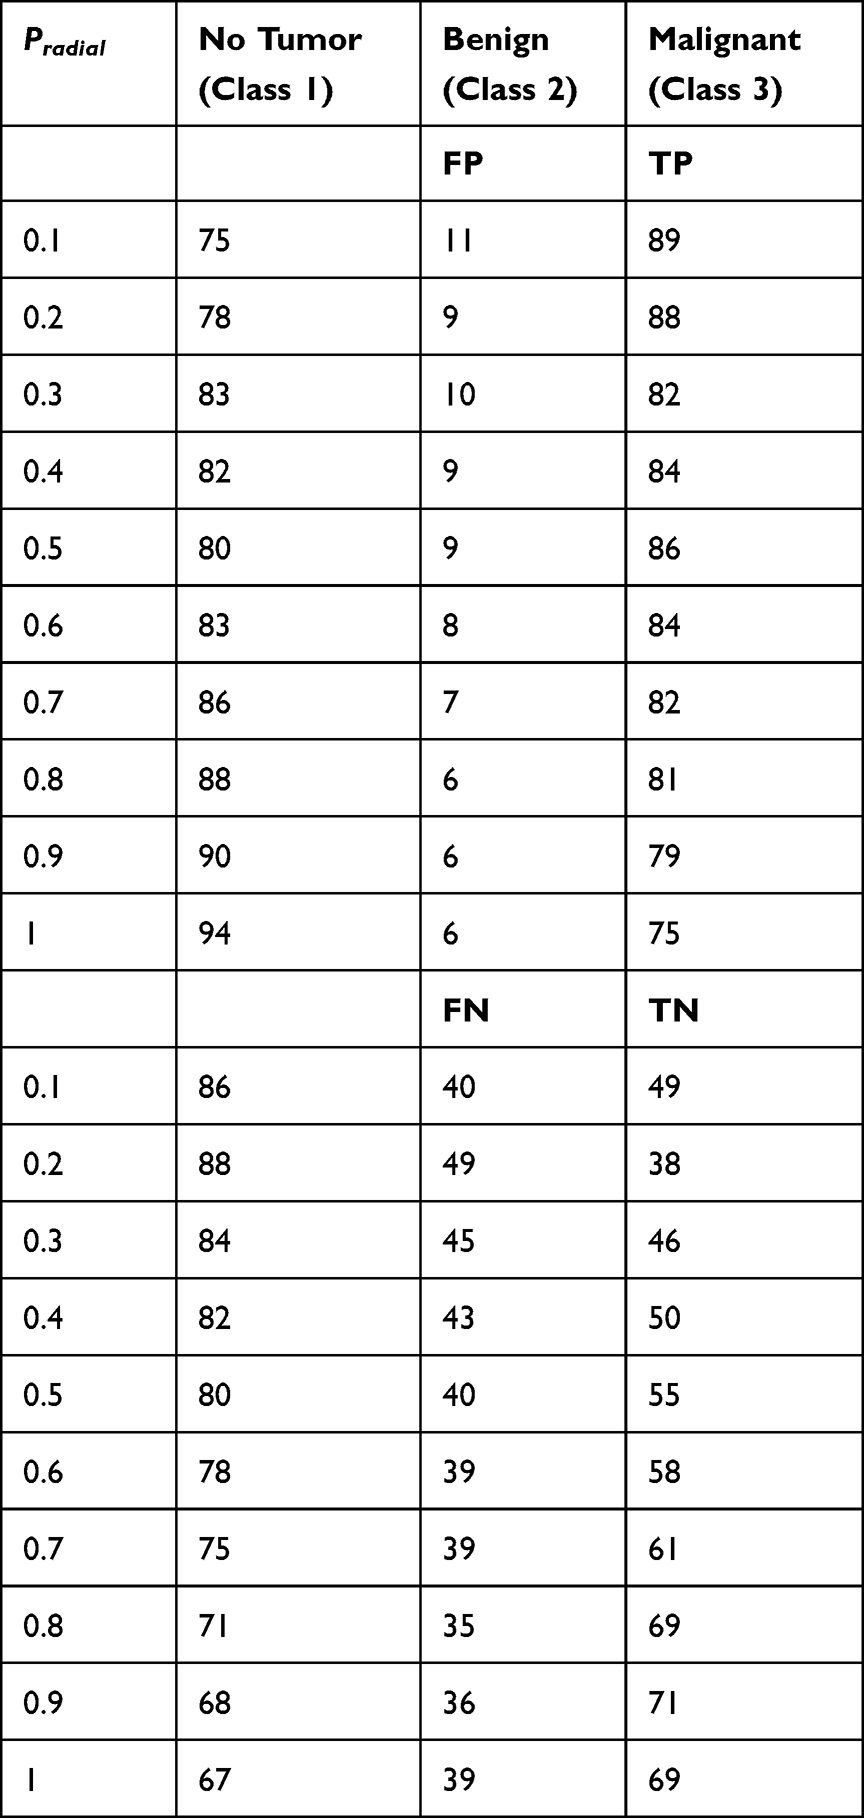 |
Table 2 Performance Results for Tumor Classification |
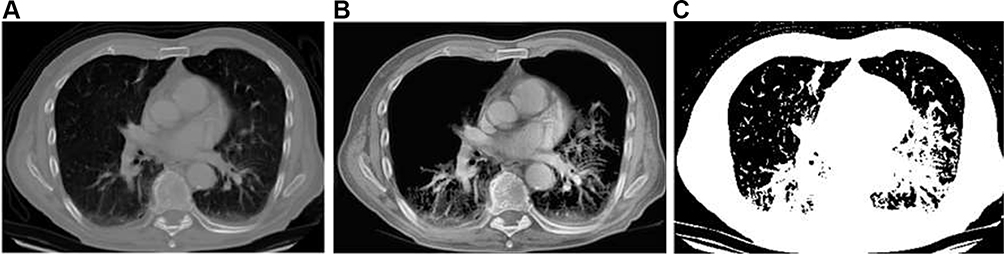 |
Figure 1 Visual image results for entropy of the radial length (A) Input Image (B) High entropy result (C) Low entropy result. |
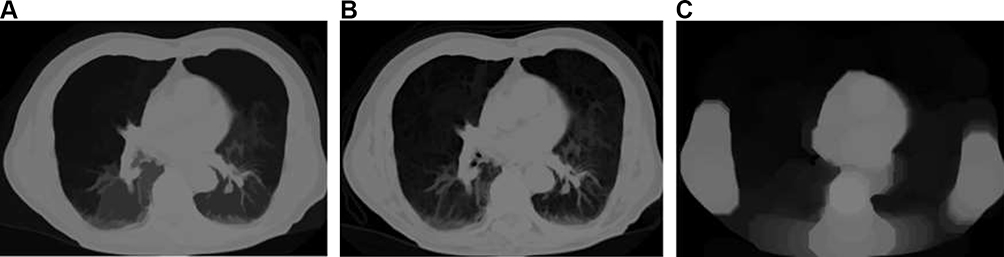 |
Figure 2 Visual image results for normalised radial length (A) Before radial length normalisation (B) After radial length normalisation (C) Geometry identified. |
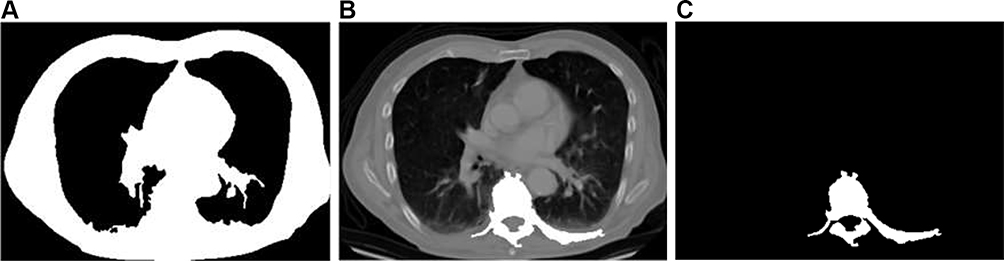 |
Figure 3 Visual image results for tumour shape describing feature (A) Background (B) Overlap (C) Tumor region extracted. |
The ROC curve for the tumor categorization of benign, malignant, no tumor is shown as a plot in Figure 4. Figure 5 shows the validation performance graph for test, training and validation set. Figure 6 presents the confusion matrix.
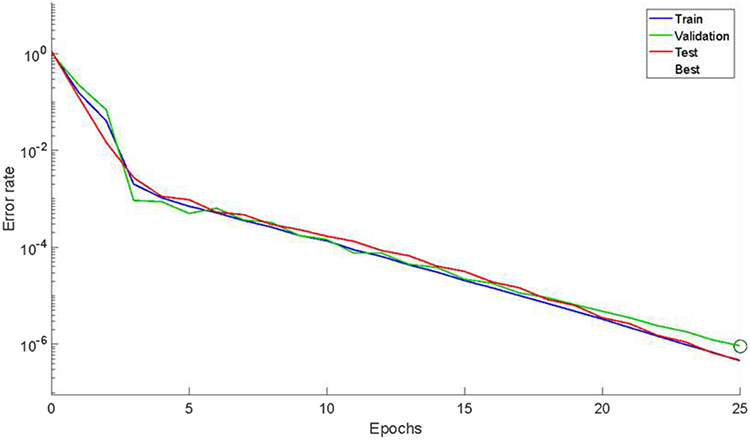 |
Figure 4 The validation performance graph. |
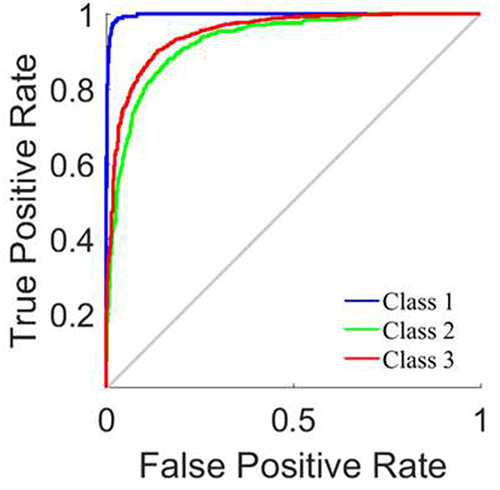 |
Figure 5 ROC curve. |
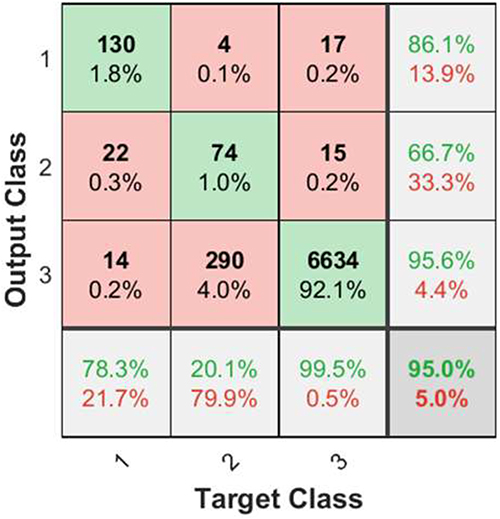 |
Figure 6 Confusion matrix. |
Six features were retrieved with predicted radial lengths of tumour geometry produced by reference CT images. These features were used to help outline the boundaries of the tumour. A forward stepwise technique is used to identify relevant characteristics, and then a logistic regression model is run on the six features that were generated as a consequence of that process to predict whether a tumour was benign or malignant. Our model produced a very high sensitivity of 91.92%, Specificity 91.37% accuracy 93.24% and AUC of 90.14%, despite the fact that the disparity might be explained to the limits of manually geometry sketching the data.
The findings of this research offer an excellent approach to integrate complicated contour information into an efficient system for ultrasonic differential detection of lung cancer. This conclusion was reached as a direct consequence of the findings of the investigation. Through study of these three important contour traits, benign and malignant tumours may be differentiated from one another. By offering a reliable second reading, it may be possible to cut down on the amount of incorrect diagnoses and the subsequent unnecessary benign biopsies that result from them. Our model attained a pretty high level of accuracy and an impressively high negative predictive value.
The suggested CDL model, along with six features for lung nodule classification techniques, are compared in Table 3. Table 4 shows the performance results based on neural network model. Table 5 presents the comparison with existing state-of-art methods.
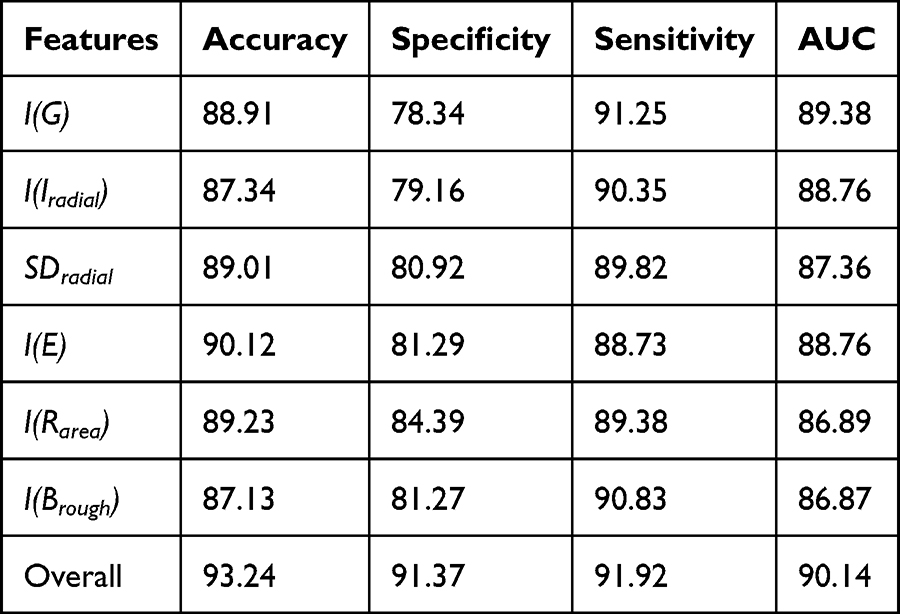 |
Table 3 Performance Results Based on Features |
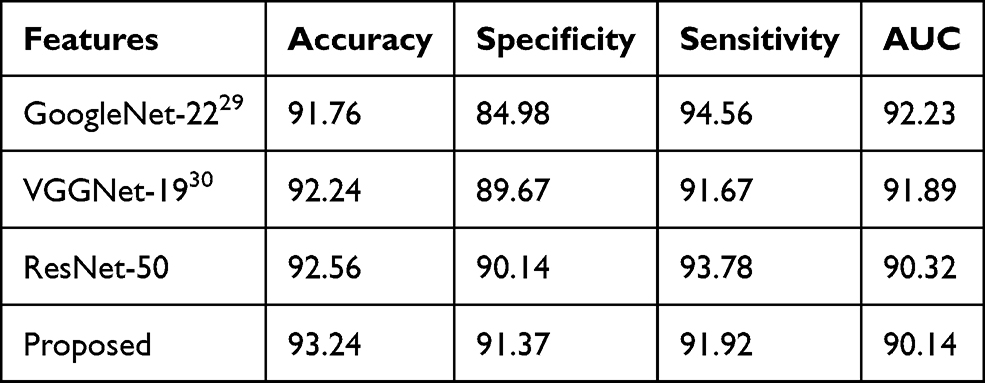 |
Table 4 Performance Results Based on Neural Network Model |
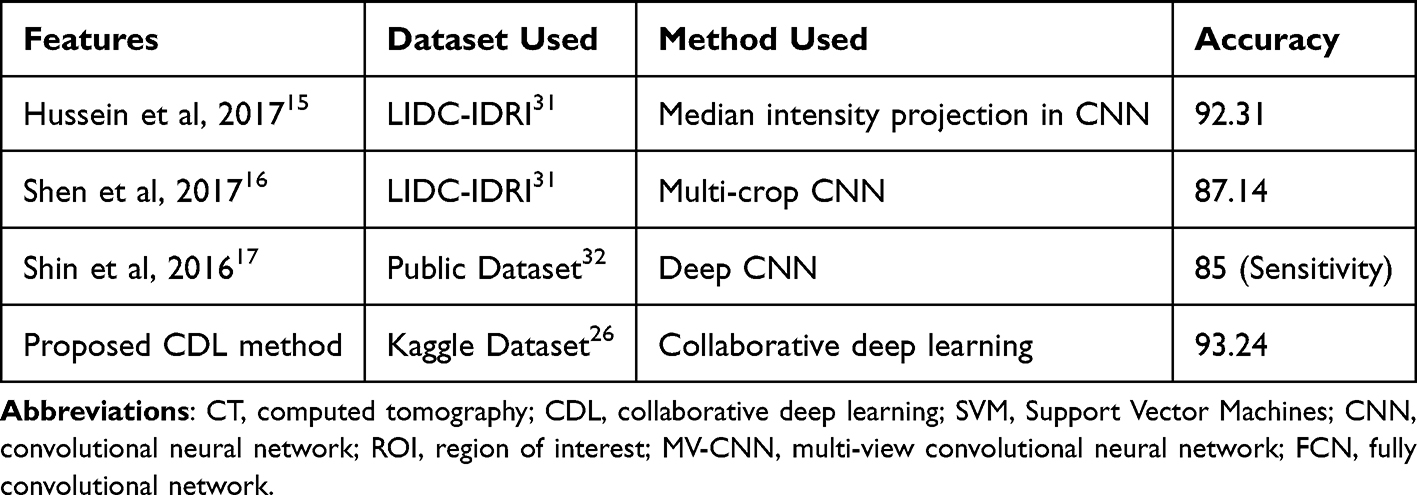 |
Table 5 Comparison with Existing State-of-Art Methods |
In addition, the performance of the proposed model is compared with other methods.15–17 ResNet-50 network based model that had been pre-trained and fine-tuned is employed in the work.
The extracted features for lung nodule are being characterised to avoid the negative effects of having an inadequate amount of training data and improperly handcrafted characteristics and flaws. Therefore, it has the potential to boost a comparison of the performance of the lung nodule categorization to the approaches.15–17 Despite the fact that the level of specificity is somewhat reduced, the proposed CDL model is capable of attaining greater levels of accuracy and sensitivity and AUC, which suggests that the proposed CDL model is more appropriate.
The proposed model can provide a more accurate description of feature based extraction for lung nodules segmentation in terms of its effectiveness. The proposed a deep-learning-based reveals that by combining feature extraction and classification model training into a single unified frameworks, have the potential to increase the implementation of a categorization system. Nevertheless, it demonstrates that, despite the fact that there are some benign nodules seem similar to cancerous ones, the proposed CDLC model is still able to distinguish between the two types in order to split them apart. These data clearly illustrate the fact that our CDL model has higher capacity to distinguish malignant from benign nodules. The underlying explanation may be that, because of the possibility of a false negative scenario may result in much greater costs than a false positive case. As a direct consequence of this, the majority of those unsure nodules are quite harmless. Therefore, putting them into categories identifying benign nodules as such leads to increased classification accuracy instead of classifying them as being cancerous ones.
According to the findings of the categorization, the performance of a technique for the interpretation is dependent on the accuracy of the image annotation. In addition to the additional expense, it would continue to investigate the opportunities presented by semi-supervised learning in order to take use of the nodules’ ambiguous annotations. This would be done while paying close attention to the quality of the data that was being obtained.
Within the confines of our research, the ensemble is carried out with a hierarchical strategy that is split between two distinct decision stages. Then, connect the softmax function to the layer that was generated by the use of the two neurons. When individuals refer to a CDL submodel, what they are referring to is an ensemble of three ResNet-50 networks, like as the one that can be seen above. Secondly, continue by connecting the output layer of each CDL submodel, which consists of two neurons, to a layer consisting of a single neuron, which is then followed by the sigmoid function. This ensemble is a representation of the CDL model that is discussed in a previous section.
The CDL model that is used based on very naïve networks. Because of this, it is proven that transfer learning had the potential to increase the accuracy of lung nodule categorization. Both of these ideas are supported by the ResNet-50 network design, which acts as their basis. It is feasible to raise the characterization of lung nodules and obtain an additional performance improvement using pre-trained ResNet-50 networks. This may be done to improve overall performance. It’s possible that doing this will result in an increase in the model’s level of accuracy. This is still the case in spite of the fact that the model with scratch ResNet-50 networks performed quite well. Despite this, the model built from scratch making use of ResNet-50 networks nevertheless reaches a level of performance that is regarded as being rather exceptional.
The study explores the use of a Collaborative Deep Learning (CDL) model to categorize lung nodules in chest CT images, with a specific emphasis on differentiating between malignant and benign nodules. The CDL model utilizes many deep learning algorithms to improve detection accuracy when data is scarce. The system includes adjustable weighting acquired by error backpropagation to enhance nodule recognition. The CDL model shows high accuracy and is advancement in diagnostic methods. Potential limitations include the computational requirements, the necessity for extensive and varied training datasets for generalization, and the model’s reliance solely on image features without incorporating clinical data. These factors may influence the model’s suitability in real-world clinical environments and its effectiveness with various patient groups. Future study might focus on incorporating clinical data with picture attributes and investigating the scalability and efficiency of the model.
Conclusion and Future Work
Early lung cancer identification using chest CT is essential for survival and therapy. Due to a shortage of training datasets, finding malignant nodules remains challenging despite deep learning computer vision breakthroughs. A collaborative deep learning (CDL) model can detect malignant from benign nodules in chest CT data. Our approach breaks lung nodule attributes into six components. This model’s six feature pathways fine-tune one of three pre-trained ResNet-50 networks. CDL submodels with error back propagation-learned adaptive weighting identify lung nodules. End-to-end CDL model training is helpful. Our technique was compared to cutting-edge classification algorithms on the usual Kaggle dataset. KDL classified lung nodules with 93.24% accuracy in our research. Current lung nodule classification methods are trained on a few thousand pictures. Lung cancer is uncommon, hence these statistics may not reflect lung nodule variety. Larger lung nodule datasets might increase model accuracy. Lung nodule classification models solely employ image characteristics. Clinical information including the patient’s age, smoking history, and lung cancer family history may also aid diagnosis. Integrating clinical data with visual attributes might increase model accuracy as a future work.
Data Sharing Statement
The data used to support the findings of this study are included in the article.
Acknowledgment
The authors are thankful to the Deanship of Scientific Research at Najran University for funding this work under the Distinguished Research Funding Program grant code (NU/DRP/MRC/12/18). For the purpose of open access, the authors have applied a Creative Common Attribution (CC BY) licence to any Author Accepted Manuscript version arising, the authors are thankful to the University of Sheffield Instituational Open Access Fund.
Disclosure
The authors declare that there are no conflicts of interest in this work.
References
1. Rizzatto G, Chersevani R. Breast ultrasound and new technologies. Eur J Radiol. 1998;27(Suppl 2):242–249. doi:10.1016/S0720-048X(98)00070-9
2. Chen DR, Chang RF, Huang YL. Computer-aided diagnosis applied to US of solid breast nodules by using neural networks. Radiology. 1999;213:407–412. doi:10.1148/radiology.213.2.r99nv13407
3. Pishvaian MJ, Feltes CM, Thompson P, Bussemakers MJ, Schalken JA, Byers SW. Cadherin-11 is expressed in invasive breast cancer cell lines. Cancer Res. 1999;59:947–952.
4. Skaane P, Engedal K. Analysis of sonographic features in the differentiation of fibroadenoma and invasive ductal carcinoma. AJR Am J Roentgenol. 1998;170(1):109–114. doi:10.2214/ajr.170.1.9423610
5. Wu GX, Raz DJ, Brown L, et al. Psychological burden associated with lung cancer screening: a systematic review. Clin Lung Cancer. 2016;17(5):315–324. doi:10.1016/j.cllc.2016.03.007
6. Wu GX, Raz DJ. Lung cancer screening. Lung Cancer. 2016;170:1–23.
7. American Thoracic Society. what is a Lung Nodule? Am J Respir Crit Care Med. 2016;193:11–12. doi:10.1164/rccm.1937P11
8. Diciotti S, Lombardo S, Falchini M, et al. Automated segmentation refinement of small lung nodules in CT scans by local shape analysis. IEEE Trans Biomed Eng. 2011;58(12):3418–3428. doi:10.1109/TBME.2011.2167621
9. Soliman A, Khalifa F, Elnakib A, et al. Accurate lungs segmentation on CT chest images by adaptive appearance-guided shape modeling. IEEE Trans Med Imag. 2017;36(1):263–276. doi:10.1109/TMI.2016.2606370
10. Song J, Yang C, Fan L, et al. Lung lesion extraction using a toboggan based growing automatic segmentation approach. IEEE Trans Med Imag. 2016;35(1):337–353.
11. Farag AA, Munim HEAE, Graham JH, Farag AA. A novel approach for lung nodules segmentation in chest CT using level sets. IEEE Trans Imag Process. 2013;22(12):5202–5213. doi:10.1109/TIP.2013.2282899
12. Lassen BC, Jacobs C, Kuhnigk JM, et al. Robust semi-automatic segmentation of pulmonary subsolid nodules in chest computed tomography scans. Phys Med Biol. 2015;60(3):1307–1323. doi:10.1088/0031-9155/60/3/1307
13. Wu D, Lu L, Bi J, et al. Stratified learning of local anatomical context for lung nodules in CT images Proc IEEE CVPR. 2010;2010:2791–2798.
14. Tao Y, Lu L, Dewan M, et al. Multi-level ground glass nodule detection and segmentation in CT lung images. Proc MICCAI. 2009;2009:715–723.
15. Hussein S, Gillies R, Cao K, Song Q, Bagci U. TumorNet: lung nodule characterization using multi-view convolutional neural network with gaussian process. Proc ISBI. 2017;2017:1007–1010.
16. Shen W, Zhou M, Yang F, et al. Multi-crop convolutional neural networks for lung nodule malignancy suspiciousness classification. Pattern Recogn. 2017;61:663–673. doi:10.1016/j.patcog.2016.05.029
17. Shin HC, Roth HR, Gao M, Lu L. Deep convolutional neural networks for computer-aided detection: CNN architectures, dataset characteristics and transfer learning. IEEE Trans Med Imag. 2016;35(5):1285–1298. doi:10.1109/TMI.2016.2528162
18. Amilo D, Kaymakamzade B, Hincal E. A fractional-order mathematical model for lung cancer incorporating integrated therapeutic approaches. Sci Rep. 2023;13(1):12426. doi:10.1038/s41598-023-38814-2
19. Gupta S, Panda PK, Hashimoto RF, et al. Dynamical modeling of miR-34a, miR-449a, and miR-16 reveals numerous DDR signaling pathways regulating senescence, autophagy, and apoptosis in HeLa cells. Sci Rep. 2022;12(1):4911. doi:10.1038/s41598-022-08900-y
20. Newton PK, Mason J, Bethel K, Bazhenova LA, Nieva J, Kuhn P. A stochastic Markov chain model to describe lung cancer growth and metastasis. PLoS One. 2012;7(4):e34637. doi:10.1371/journal.pone.0034637
21. Ronneberger O, Fischer P, Brox T. U-Net: convolutional networks for biomedical image segmentation. Proc MICCAI. 2015;2015:234.
22. Setio AA, Ciompi F, Litjens G, et al. Pulmonary nodule detection in CT images: false positive reduction using multi-view convolutional networks. IEEE Trans Med Imag. 2016;35(5):1160–1169. doi:10.1109/TMI.2016.2536809
23. He K, Zhang X, Ren S, Sun J. Deep residual learning for image recognition. Proc IEEE CVPR. 2016;2016:770–778.
24. Deng J, Dong W, Socher R, et al. ImageNet: a large-scale hierarchical image database. Proc IEEE CVPR. 2009;2009:248–255.
25. Rojas R. The backpropagation algorithm. In: Neural Networks. Berlin, Heidelberg: Springer; 1996.
26. Dataset online link. Available from: https://www.kaggle.com/datasets/mohamedhanyyy/chest-ctscan-images.
27. Nielsen M. How the backpropagation algorithm works; 2017. Available from: http://neuralnetworksanddeeplearning.com/chap2.html.
28. Resheff YS, Mandelbaum A, Weinshall D. Every untrue label is untrue in its own way: controlling error type with the log bilinear loss. arXiv e-prints; 2017. Available from: https://arxiv.org/abs/1704.06062.
29. Szegedy C, Wei L, Yangqing J, et al. Going deeper with convolutions. Proc IEEE CVPR. 2016;2016:1–9.
30. Simonyan K, Zisserman A. Very deep convolutional networks for large-scale image recognition. arXiv e-prints; 2015. Available from: https://arxiv.org/abs/1409.1556.
31. Armato III SG, McLennan G, Bidaut L, et al. The lung image database consortium (lidc) and image database resource initiative (idri): a completed reference database of lung nodules on ct scans. Med Phys. 2011;38(2):915–931. doi:10.1118/1.3528204
32. Depeursinge A, Vargas A, Platon A, et al. Building a reference multimedia database for interstitial lung diseases. Computerized Med Imag Graphics. 2012;36(3):227–238. doi:10.1016/j.compmedimag.2011.07.003
 © 2024 The Author(s). This work is published and licensed by Dove Medical Press Limited. The full terms of this license are available at https://www.dovepress.com/terms.php and incorporate the Creative Commons Attribution - Non Commercial (unported, v3.0) License.
By accessing the work you hereby accept the Terms. Non-commercial uses of the work are permitted without any further permission from Dove Medical Press Limited, provided the work is properly attributed. For permission for commercial use of this work, please see paragraphs 4.2 and 5 of our Terms.
© 2024 The Author(s). This work is published and licensed by Dove Medical Press Limited. The full terms of this license are available at https://www.dovepress.com/terms.php and incorporate the Creative Commons Attribution - Non Commercial (unported, v3.0) License.
By accessing the work you hereby accept the Terms. Non-commercial uses of the work are permitted without any further permission from Dove Medical Press Limited, provided the work is properly attributed. For permission for commercial use of this work, please see paragraphs 4.2 and 5 of our Terms.