")
Back to Journals » International Journal of Nanomedicine » Volume 9 » Issue 1
Atomic force microscopy fishing and mass spectrometry identification of gp120 on immobilized aptamers
Authors Ivanov YD, Bukharina N, Pleshakova TO, Frantsuzov P, Andreeva E, Kaysheva A, Zgoda V, Izotov A, Pavlova T, Ziborov V, Radko S, Moshkovskii S, Archakov A
Received 29 April 2014
Accepted for publication 23 June 2014
Published 3 October 2014 Volume 2014:9(1) Pages 4659—4670
DOI https://doi.org/10.2147/IJN.S66946
Checked for plagiarism Yes
Review by Single anonymous peer review
Peer reviewer comments 4
Yuri D Ivanov,1 Natalia S Bukharina,1 Tatyana O Pleshakova,1 Pavel A Frantsuzov,1 Elena Yu Andreeva,1 Anna L Kaysheva,1,2 Victor G Zgoda,1 Alexander A Izotov,1 Tatyana I Pavlova,1 Vadim S Ziborov,1 Sergey P Radko,1 Sergei A Moshkovskii,1 Alexander I Archakov1
1Department of Personalized Medicine, Orekhovich Institute of Biomedical Chemistry of the Russian Academy of Medical Sciences, Moscow, Russia; 2PostgenTech Ltd., Moscow, Russia
Abstract: Atomic force microscopy (AFM) was applied to carry out direct and label-free detection of gp120 human immunodeficiency virus type 1 envelope glycoprotein as a target protein. This approach was based on the AFM fishing of gp120 from the analyte solution using anti-gp120 aptamers immobilized on the AFM chip to count gp120/aptamer complexes that were formed on the chip surface. The comparison of image contrasts of fished gp120 against the background of immobilized aptamers and anti-gp120 antibodies on the AFM images was conducted. It was shown that an image contrast of the protein/aptamer complexes was two-fold higher than the contrast of the protein/antibody complexes. Mass spectrometry identification provided an additional confirmation of the target protein presence on the AFM chips after biospecific fishing to avoid any artifacts.
Keywords: gp120 HIV-1 envelope glycoprotein, aptamer, atomic force microscopy, mass spectrometry
Introduction
It is well established that 20%–80% of people worldwide who have human immunodeficiency virus (HIV) infection do not know their HIV status.1 There are two types of tests in clinical practice to confirm HIV infection. Of them, HIV enzyme-linked immunosorbent assay (ELISA) and Western blot are designed to react in the presence of HIV antibodies in biomaterial (plasma/serum or saliva). A current list of HIV diagnostic tests approved by the US Food and Drug Administration includes 12 ELISA assays that detect antibodies to HIV types 1 and 2 (September 2013, http://www.fda.gov/BiologicsBloodVaccines/BloodBloodProducts/ApprovedProducts/LicensedProductsBLAs/BloodDonorScreening/InfectiousDisease/UCM080466).
Usually, measurable levels of HIV antibodies are developed within 30 days of infection, although sometimes this rise in level may take longer and lasts up to 3 months. Thus, during the first weeks after infection, there is a window period when antibody levels are too low to be detected reliably. During this time, an infected person can pass HIV to others, but he or she still has a negative result for the antibody test.2
ELISA tests have limitations besides inefficiency for early diagnosis due to false positive and negative results. Major causes of false positive HIV ELISA are provided by antibodies to human leukocyte antigens, multiple transfusions, recent influenza immunization, and improper specimen handling. False negative HIV ELISA results are caused by recent infection (window period), hypogammaglobulinemia, advanced HIV infection, and unusual HIV-1 serotype (group O).3 It is therefore important to develop biosensors for direct detection of infection to confirm the presence of HIV antigens in biomaterial to test recently infected people, who are unaware of their infection.
Accordingly, the development of lab-on-a-chip devices with a wide range of time-stable molecular probes for high-sensitivity analysis and early detection of the infection presents one of the major challenges in clinical proteomics and diagnostics.4 Analyzers in the recording part of these devices can be optical,5 electrical,6,7 or even nanomechanical, such as atomic force microscopy (AFM).8 To perform a biospecific direct detection of proteins in this case, it is necessary to use molecular probes (antibodies or aptamers) covalently immobilized on the chip surface. Implementation of these chips for detection of proteins in the analyte is restrained by a limited variety of commonly used molecular probes such as antibodies.
Deoxyribonucleic acid (DNA) aptamers offer an attractive alternative to antibodies as affinity reagents for protein detection. Aptamers are single-stranded DNA or ribonucleic acid structures generated via systematic evolution of ligands by exponential enrichment in vitro from a large library of randomized oligonucleotide sequences (>1013).9,10 While aptamers are analogous to antibodies in their range of target recognition and variety of applications, they possess several key advantages over their protein counterparts.11 Thus, they are self-refolding, single-chain, and redox insensitive; tolerate pH and heating levels that proteins do not; are easier and more economical to produce; are capable of having greater specificity and affinity than antibodies;12 and are much more stable at ambient temperature than antibodies, yielding a much higher shelf-life. They can also tolerate transportation without any special requirements for cooling, eliminating the need for a continuous cold chain.13
Usability of aptamers as affinity reagents was demonstrated in recent papers14–18 where fluorescent14–16 and electrochemical analyses17 as well as surface plasmon resonance with interferometry18 were used, and data were obtained by measurement of properties of a molecular ensemble. In our study, AFM was used as a detector. It allows registration of single biomolecules on the AFM chip surface. Therefore, the sensitivity of analysis with an AFM-based molecular detector will not be limited by the sensitivity of the analyzer. AFM is broadly used due to its wide capabilities for determination of the interaction force between the tip-tethered aptamer and a protein immobilized on the substrate surface,19–21 and also for biospecific recognition of protein on the surface.22,23 The most popular object of aptamer-based applications in molecular research is detection of thrombin.24–27 The goal of our research was to highlight the advantages of aptamers as molecular probes for biospecific fishing of gp120 HIV protein from the solution on the AFM chip surface. The aptamer-based approach is promising for development of high-sensitivity detection methods in proteomics and diagnostics. To demonstrate the potential of this approach, the following experiments were conducted: 1) aptamers were covalently immobilized on the AFM chip; 2) immobilized aptamers were visualized by AFM in a standard tapping mode and in a topography and recognition (TREC) mode; 3) AFM-biospecific fishing of the target protein was carried out using two types of AFM chips with different molecular probes, such as immobilized aptamers and immobilized antibodies; 4) the values of image contrast of protein/aptamer and protein/antibody complexes on the AFM images were estimated and compared; and 5) mass spectrometry (MS) identification of protein, fished out from the analyte solution onto the two types of immobilized molecular probes, was performed.
Anti-gp120 aptamers were used as molecular probes immobilized on the AFM chip. Gp120 was selected because it is the HIV-1 envelope protein and a biomarker in a medical diagnosis.28 It was shown that AFM chips with immobilized anti-gp120 aptamers can be used to fish out gp120 from solution, and also to visualize and count its molecules, while a combination of AFM with MS allows identification of the protein fished out onto the AFM chip.
Materials and methods
Materials
Modified Dulbecco’s phosphate buffer (PBSD, 10 mM, pH 7.4), dithiobis-(succinimidyl propionate) (DSP) crosslinker, acetonitrile, trifluoroacetic acid (TFA), and ammonium bicarbonate were purchased from Pierce (USA). 3-aminopropyltriethoxysilane (APTES) and dimethyl sulfoxide were purchased from Sigma-Aldrich Co. (St Louis, MO, USA). α-cyano-4-hydroxycinnamic acid (HCCA) and dihydroxybenzoic acid were purchased from Acros (USA). Ultrapure water was obtained using a Milli-Q system (Millipore, USA).
Recombinant protein HIV-1 gp120 (Mw ≈115 kDa), produced in a Baculovirus expression system, and murine anti-gp120 HIV-1 monoclonal antibodies (mAb gp120, Mw ≈150 kDa), which bind to the V3 loop of HIV-1 gp120, were purchased from Immuno Diagnostics, Inc. (USA). Protein Calibration Standard I was purchased from Bruker Daltonik GmbH (Germany), and trypsin was purchased from Promega (USA).
Anti-gp120 amino-modified biotinylated DNA aptamer (anti-gp120 aptamer, Mw ≈23 kDa) was provided by Dr S P Radko (the Orekhovich Institute of Biomedical Chemistry of the Russian Academy of Medical Sciences, Moscow, Russia). Anti-gp120 amino-modified biotinylated DNA aptamer (anti-gp120 aptamer, Mw ≈23 kDa) used in our study was previously selected by Smith et al.29 It was synthesized in house on an automated DNA synthesizer, ASM-800 (Biosset, Novosibirsk, Russia), according to manufacturer instructions, and purified by polyacrylamide gel electrophoresis. Its sequence is shown as follows, with X representing 5-bromo-2′-deoxyuridines (BrdUrds) and Y representing ten nucleotide spacers T: 5′-biotin-GGG AGG ACG ATG CGG AAX GCG CGA GCX XCC GAA AAG GAA AXX ACG CAG ACG ACG AGC GGG A-Y-NH2-3′. Ten thymine nucleotides were added to facilitate both the aptamer immobilization on the chip surface and its interaction with the target protein.
AFM chip preparation
Amino-functionalization of mica substrate (SPI, Inc., USA), later used as an AFM chip, was carried out by a vapor deposition method using APTES.30,31 The APTES layer thus formed had a definite thickness (<0.7 nm).
There were two areas on the surface of an AFM chip: the area with immobilized molecular probes and the control zone without molecular probes. For covalent immobilization of molecular probes, an area of the silanized AFM chip was activated by 0.12 mM DSP solution in 10 mM PBSD, pH 7.4, for 10 minutes and rinsed with solution (H2O:C2H5OH=1:1, v/v) for 10 minutes, then dried in a nitrogen flow and immediately used for the immobilization. AFM chips with different molecular probes such as aptamers and antibodies were prepared.
Two microliters of 3 μM anti-gp120 aptamer solution in 10 mM PBSD, pH 7.4, was heated at 95°C for 5 minutes and cooled on ice for 3 minutes. After that, it was deposited onto the activated area of an AFM chip and left for 4 minutes. Then, the AFM chip was washed in ultrapure water for 25 minutes and dried in a nitrogen flow for the AFM visualization and further experiments.
One microliter of 1 μM gp120 antibody solution in 10 mM PBSD, pH 7.4, was deposited onto the activated area of an AFM chip and left for 30 minutes. Then, the AFM chip was washed in ultrapure water for 25 minutes and dried in a nitrogen flow for the AFM visualization and further experiments.
Biospecific fishing of gp120 on the AFM chip
To conduct biospecific fishing of gp120, the AFM chip with covalently immobilized antibodies or aptamers against gp120 was incubated in 1 mL of gp120 solution in 10 mM PBSD in a shaker (850 ppm, Thermomixer comfort, Eppendorf) for 30 minutes at 25°C, washed with water three times for 30 minutes at 37°C, and dried in a nitrogen flow. Gp120 solutions 0.8×10⁻⁹ M and 0.8×10⁻¹¹ M were used in the fishing experiments with aptamer as a molecular probe, and gp120 concentration in analyte solution was 1.0×10⁻⁸ M in the fishing experiments with antibody as a molecular probe.
The activated area of the AFM chip with immobilized molecular probes and the nonactivated control area without molecular probes were both visualized after biospecific fishing by AFM. Each experiment was repeated not less than three times.
AFM measurements in a tapping mode
AFM measurements were carried out in a tapping mode on the Agilent 5500 AFM (USA) and NTEGRA Prima AFM (NT-MDT, Russia) in air using standard probes PPP-NCH (Nanosensors, Switzerland) with the force constant about 42 Nm−1 and the radius of curvature 10 nm. Scan rate was 1 Hz. At least ten frames of 1÷25 μm2 were obtained in each experiment.
Gp120 functionalized tip for AFM measurements in a PicoTREC mode
DNP-S10 cantilevers (the force constant was 0.32–0.58 Nm−1, and the radius of curvature was 10–20 nm, Bruker) were used in PicoTREC experiments, and their tips were functionalized with gp120 in several steps. The cantilever was first treated in an ozonator for 60 minutes. After that, it was silanized and activated by DSP the same way as the AFM chip. For the gp120 immobilization, the activated tip was incubated in 10−10 M gp120 solution for 10 minutes at room temperature. After being rinsed with PBSD for 20 minutes, a functionalized cantilever was placed in an AFM holder in a liquid cell to conduct AFM measurements in PicoTREC mode.
AFM measurements in a PicoTREC mode
TREC was also carried out using Agilent 5500 AFM (USA) in a PicoTREC mode that allows detection and mapping of molecular binding events while simultaneously generating topographic images.32 PicoTREC mode combines “topography” imaging of the surface and “recognition” imaging of the same part of the surface. Therefore, there will be a correlation between objects on the surface and events on the recognition image, which reflects their force interaction with a tip.
In our case, gp120 protein was attached to the AFM tip, and anti-gp120 aptamers were immobilized on the AFM chip. Then, aptamer/protein interaction was registered in a PicoTREC mode, and a molecular binding map was obtained. When AFM tip-tethered protein interacts with an aptamer immobilized on the surface, there is a transient reduction in the oscillation amplitude of the tip. The imaging servo restores the signal amplitude, but with the peak signal shifted downward, and this peak shift provides the recognition signal for a specific aptamer/protein recognition event.32,33 So a molecular binding map is a “map” of the change in a peak signal where binding events appear as black spots.
To conduct AFM measurements in a PicoTREC mode, an AFM chip with immobilized anti-gp120 aptamers was placed into a liquid cell of a microscope. AFM imaging was carried out by gp120 functionalized cantilever in a tapping mode with set-point amplitude A~5–8 nm ~95%–97% A0. Scan rate was 1 Hz. In this experiment, at least five frames were obtained, whose sizes were 9 μm2. Each experiment was repeated not less than three times.
AFM measurements: control experiments
Control experiments were carried out by AFM imaging of the control area of the AFM chip in a tapping mode after immobilization of molecular probes and biospecific fishing of protein from solution. The size of the nonspecific objects on the AFM chip was <0.7 nm in these control experiments.
Analysis of AFM images
The heights of aptamers, antibodies, proteins, and their complexes on the AFM images were calculated in automatic mode using AFM-dtpr software (http://ibmcsoft.ru, IBMC RAMS, Russia).
As was previously shown,34–37 a standard AFM probe allows object height to be obtained with 0.1 nm resolution. In this case, the density of object distribution with height ρ(h) was calculated as:
| (1) |

where Nh is a number of visualized objects with height h, while N is the total number of visualized objects. This experimental distribution (1) was approximated by Gaussian function:
| (2) |

where A, hmax, W A, hmax, and W are approximation parameters; hmax is a maximum height; W is a value of full width at half maximum; and a number of terms i was determined based on χ2 criterion.36,37
Image contrast of fished protein against the background of immobilized aptamers on the AFM image (ICprotein/apt) as well as image contrast of fished protein against the background of immobilized antibodies on the AFM image (ICprotein/ab) were estimated as:
| (3) |

| (4) |

where hprotein/apt and hprotein/ab are the height maximums of aptamer/protein and antibody/protein complexes on the AFM chips, respectively; hapt and hab are the height maximums of aptamers and antibodies before protein fishing, respectively. Height maximums were obtained from Equation 2.
MS analysis of proteins on the AFM chip surface
Proteolysis on the AFM chip surface
Trypsinolysis of biospecifically fished proteins was done directly on the AFM chip according to the standard procedure at 42°C and at ~100% relative humidity.30 Incubating solution for trypsinolysis contained 100 mM bicarbonate buffer (pH 7.4), 10% of acetonitrile, 1% of glycerol, and porcine trypsin (Promega Trypsin Gold, USA) in the ratio of 1:50 to target protein. After trypsinolysis, the tryptic mixture with peptide fragments was applied to the mass analyzer to carry out a protein identification.
Matrix-assisted laser desorption-ionization time-of-flight mass spectrometry (MALDI-TOF-MS) analysis
Protein identification was performed on a TOF-MS Autoflex III MALDI-TOF/TOF (Bruker, Germany) equipped with a nitrogen laser (λ=337 nm). The MS calibration was performed with a peptide calibration standard for positive ions in a reflector mode (the reflector voltage was 5 kV), the range of detectable masses was 800–3,000 m/z, and the pulse delay time was 200 ns. The peptide calibration standard included the following peptides: bradykinin (monoisotopic ion mass was 757.3992 Da), angiotensin II (1,046.5420 Da), angiotensin I (1,296.6853 Da), peptide P (1,347.7361 Da), bombesin (1,619.8230 Da), renin (1,758.9326 Da), adrenocorticotropic hormone (ACTH) fragment 1–17 (2,093.0868 Da), ACTH fragment 18–39 (2,465.1990 Da), and somatostatin (3,147.4714 Da). The peaks of matrix (HCCA in 50% acetonitrile and 0.7% TFA) and trypsin autolysis were ignored in the spectral analysis. The mass spectrum was obtained in an automatic mode with the ion accumulation from 10,000 shots. To obtain the mass spectra of samples, the tryptic mixture was mixed in a ratio from 1:1,000 to 1:10,000 with an excess of matrix, and then this mixture was applied to MTP AnchorChip 384 target.
Mass spectra were analyzed with FlexAnalysis software 2.0 (Bruker, Germany). Protein identification was performed with Mascot software 2.2.04 (http://www.matrixscience.com) using the National Center for Biotechnology Information data library of protein sequences. The following search parameters were chosen: one missing hydrolysis site, monoisotopic mass determination accuracy was <100 ppm, and the oxidized methionine was mentioned as possible modification.
Results
AFM imaging of anti-gp120 aptamer in a tapping mode
Preparation of the AFM chip with the covalently immobilized aptamers against gp120 was described in the “Materials and methods” section.
Figure 1A represents an AFM image of anti-gp120 aptamers covalently immobilized on the AFM chip. This image was obtained by nonmodified cantilever in a standard tapping mode in air (see “Materials and methods”).
 | Figure 1 Atomic force microscopy (AFM) images of aptamer chip surface with immobilized aptamers (A) and image of the control area without aptamers before biospecific fishing of gp120. (B) Density of visualized object distribution with heights ρ(h) over the area with immobilized anti-gp120 aptamers. (C) Density of visualized object distribution. |
AFM imaging showed that there were objects with height ~1 nm on the chip surface, which can be identified as aptamers, because there were no such objects in the control area of the AFM chip (Figure 1B). The respective density of anti-gp120 aptamer distribution with heights ρ(h) was obtained from AFM data processing (Figure 1C). Approximation of experimental density distribution of AFM visualized aptamers with heights ρ(h) (1) was carried out using function (2). It was obtained from this approximation that visualized objects form a group of objects with the maximum height hmax(apt)=(0.9±0.1) nm, and a full width at half maximum was W=(0.5±0.1) nm.
AFM imaging of anti-gp120 aptamer in a PicoTREC mode
In order to prove that visualized objects, which were described in the previous section, are anti-gp120 aptamers, AFM imaging of these objects was conducted in a PicoTREC mode. In this mode, a surface topography and a molecular binding map are obtained simultaneously. The principle of the TREC method is summarized in the literature37 and briefly described in the “Materials and methods” section.
Figure 2 represents AFM images of the surface topography and molecular binding map, which were obtained by gp120 functionalized cantilever in a PicoTREC mode in buffer. Objects with heights up to 10 nm were visualized on the surface topography image (Figure 2A). These objects are higher than ones on the topography image obtained by standard cantilever in a tapping mode in air (see the previous section), because AFM visualization in a PicoTREC mode was conducted by a modified cantilever.
 | Figure 2 Atomic force microscopy (AFM) topography image (A) and recognition image (B) of the chip surface with immobilized anti-gp120 aptamers before biospecific fishing of gp120. |
First, interaction of a tip-tethered protein with the surface and immobilized objects leads to distortion of the heights of visualized objects. Secondly, tip functionalization leads to significant enlargement of its radius of curvature, and visualized objects have distorted lateral dimensions as a result. Therefore, information obtained from AFM measurements of topography in a PicoTREC mode can be only qualitative, and density of objects distribution with heights will also be inaccurate.
Recognition events were visualized on the molecular binding map or recognition image (Figure 2B) as dark spots, due to reduction of the oscillation amplitude on binding anti-gp120 aptamer on the surface and tip-tethered gp120. Dark spots on the recognition image generally coincide with objects on the topography image (Figure 2A and B examples are indicated by circles).
Biospecific fishing of gp120 on the AFM chip with immobilized aptamers
Figure 3A and B represents AFM images of the AFM chip surface with immobilized anti-gp120 aptamers after incubation in 0.8×10⁻⁹ M and 0.8×10⁻¹¹ M gp120 solution in 10 mM PBSD, respectively. As is seen from the Figures, the objects with heights from 1 nm to 5 nm were visualized on the surface after incubation. Since there were no such objects with height h>1 nm in the control area of the AFM chip without immobilized molecular probes (Figures 3C), then visualized objects can be identified as the gp120/aptamer complexes that were formed during the fishing of gp120 on the AFM chip surface.
 | Figure 3 Atomic force microscopy (AFM) images of aptamer chip surface after biospecific fishing of gp120. |
After AFM data processing, the respective densities of object distribution with heights were obtained (Figure 3D). Approximation of experimental density distribution of complexes with heights ρ(h) (1) was carried out using function (2). As a result, maximum heights of the visualized complexes were 1) hmax(protein/apt)=(1.6±0.1) nm after incubation in 0.8×10⁻⁹ M gp120 solution and 2) hmax(protein/apt)=(1.4±0.1) nm after incubation in 0.8×10⁻¹¹ M gp120 solution.
Using Equation 3, an image contrast of fished protein against the background of immobilized aptamers on the AFM image was estimated to be 0.8, where height of the immobilized aptamers was hapt=hmax(apt) and height of the gp120/aptamer complexes was hgp120/apt=hmax(protein/apt).
Biospecific fishing of gp120 on the AFM chip with immobilized antibodies
Figure 4A represents an AFM image of the AFM chip surface with immobilized gp120 antibodies before incubation in gp120 solution. Antibodies were visualized as the objects with heights from 1.2 nm to 2.5 nm. Maximum height from the density of distribution of antibodies with heights ρ(h) (Figure 4C) was hmax(ab)=(1.8±0.1) nm, which corresponds to the height of the immobilized antibodies of immunoglobulin G class.8,9,39,40
 | Figure 4 Atomic force microscopy (AFM) images of antibody chip surface after biospecific fishing of gp120. |
Images of the chip surface with immobilized antibodies and without antibodies after incubation in 10−8 M gp120 solution are presented in Figure 4B and C. The objects with heights from 1.2 nm to 4 nm were visualized on the AFM chip surface with immobilized antibodies after incubation (Figure 4B). The respective densities of object distribution with heights ρ(h) are on the Figure 4C. Approximation of experimental density distribution with heights ρ(h) (1) was carried out using function (2) and lets visualized objects be divided into two groups with the following maximum heights: hmax1=(1.8±0.1) nm (W1=(0.8±0.1) nm, share of objects was 47%) and hmax2=(2.5±0.2) nm (W2=(1.3±0.3) nm, share of objects was 53%).
Maximum height from the first group corresponds to the maximum height of the immobilized antibodies hmax(ab). Visualized objects from the second group are higher than immobilized antibodies, and also there were no similar objects in the control area of the AFM chip without immobilized molecular probes (Figure 4C). Therefore, the objects from the second group can be identified as the gp120/antibody complexes that were formed during the fishing of protein on the AFM chip surface.
To estimate the image contrast of fished protein against the background of immobilized antibodies on the AFM image, the following parameters were used: height of the immobilized antibodies hab=hmax1 and height of the gp120/antibody complexes hgp120/ab=hmax2. Using Equation 3, image contrast ICgp120/ab was calculated to be 0.4.
MS identification of gp120 after biospecific fishing on the AFM chip
Figure 5A and B illustrates the typical MALDI-TOF-MS control spectra of the samples obtained from AFM chips’ surface before their incubation in a gp120 solution. The spectrum obtained in the AFM experiments with aptamers as molecular probes (Figure 5A) contains a small amount of peaks in the peptide region, which correspond to autolysis peaks of trypsin with m/z values 842.509, 1,045.569, and 2,211.104. The control spectrum obtained in the AFM experiments with antibodies as molecular probes (Figure 5B) contains the peaks corresponding to anti-gp120 antibodies along with the trypsin autolysis peaks. Peptide fragments of gp120 were not observed in the control spectra (Figure 5A and B).
 | Figure 5 Mass spectra of objects on the atomic force microscopy (AFM) chips with molecular probes before and after biospecific fishing of gp120: before fishing on the AFM chip with immobilized aptamers (A) and antibodies (B); after fishing on the AFM chip with immobilized aptamers (C) and antibodies (D). |
Figure 5C and D illustrates the typical MALDI-TOF-MS spectra of the samples obtained from AFM chip surface after biospecific fishing of gp120 on the AFM chips. The spectrum obtained from the AFM chips with immobilized aptamers (Figure 5C) contains two groups of peaks. One of them corresponds to autolysis peaks of trypsin and another one corresponds to the peptide fragments of gp120. The spectrum obtained from the AFM chips with immobilized antibodies (Figure 5D) contains the third group of the peaks: trypsin, gp120, and anti-gp120 antibodies.
Thus, an MS analysis provided an identification of gp120 as a target protein that was fished out on the AFM chip with immobilized molecular probes.
Discussion
In this study, AFM was used as a molecular detector to visualize and count gp120 protein that was fished out from the solution by the AFM chip with immobilized anti-gp120 aptamers. Aptamers immobilized on the AFM chip were visualized by AFM in a PicoTREC mode. As a result of TREC experiments, it was shown that immobilized aptamers retain their affinity and demonstrate their biospecific interaction with tip-tethered gp120.
It was shown that it is possible to use aptamers as immobilized molecular probes. Thus, gp120/aptamer complexes were formed on the AFM chip surface as a result of a biospecific fishing of gp120 from solution (gp120 concentrations were 0.8×10⁻⁹ M and 0.8×10⁻¹¹ M) and were visualized by AFM (Figure 3A and B). Protein that was biospecifically fished out on this AFM chip was identified by MS analysis.
AFM measurements also showed that using aptamers as molecular probes allows obtaining a good image contrast of fished protein against the background of immobilized aptamers on the AFM image. This value was estimated from the experimental data to be ICgp120/apt=0.8, which is two-fold higher than the same value against the background of immobilized antibodies (ICgp120/ab~0.4).
Such an increase in the image contrast is expected and results from the fact that the molecular weight ratio of gp120 to aptamer is larger than molecular weight ratio of gp120 to antibody and image heights as a consequence. The value of AFM image contrast is affected by the height of immobilized probe molecules. If aptamers are used, the probe height is much smaller than in the case of antibodies. Thus, the height of an AFM image of an aptamer (~1 nm) is comparable with noise level, which is determined by silanized mica surface roughness. Therefore, the contrast of an AFM image of a protein against a background of an aptamer is better.
Let us estimate the theoretically expected image contrast of fished protein against the background of immobilized aptamers and antibodies on AFM images. According to common knowledge, the height of the globular protein varies directly as  , where M is a molecular weight of globular protein in kDa.41 In the context of this assumption, Equations 3 and 4 simplify to:
| (5) |
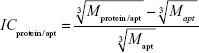
| (6) |

where Mprotein/apt and Mprotein/ab are the weights of protein/aptamer and protein/antibody complexes, respectively, and Mapt and Mab are the weights of aptamer and antibody, respectively.
Since Mapt=23 kDa, Mab~150 kDa, and Mgp120=115 kDa, then the ICgp120/apt/ICgp120/ab ratio will be equal to 4. Theoretically expected image contrast of fished protein against the background of immobilized aptamers has to be four-fold higher than the contrast against the background of immobilized antibodies on the AFM images.
One can see that the theoretical image contrast for protein/aptamer complexes is several-fold higher than the contrast for protein/antibody complexes. This estimate corresponds with the experimental results.
Conclusion
Biospecific AFM fishing allows direct, label-free detection and counting of target proteins, and MS analysis provides an additional proof of the target protein presence to avoid any artifacts. It was shown that aptamers can be used as molecular probes on AFM chips for biospecific fishing of the proteins from analyte solution. In this case, the image contrast of fished protein against the background of immobilized aptamers is higher than against the background of immobilized antibodies on the AFM images. Another advantage of using aptamers on the AFM chip is an absence of contribution of the immobilized aptamers to the mass spectrum of protein peptide fragments (including gp120) in contrast to the possible contribution of antibody peptide fragments. In the case of gp120, it was shown that AFM in combination with an aptamer-based approach can be a follow-on technology for development of lab-on-a-chip diagnostics. Furthermore, using a high-speed AFM with a scan rate more than ten-fold higher than conventional AFM could provide the background for future applications of point-of-care diagnostics.
Author contributions
The authors contributed equally to this paper.
Disclosure
The authors report no conflicts of interest in this work.
References
Marks G, Crepaz N, Senterfitt JW, Janssen RS. Meta-analysis of high-risk sexual behavior in persons aware and unaware they are infected with HIV in the United States: implications for HIV prevention programs. J Acquir Immune Defic Syndr. 2005;39(4):446–453. | ||
Ridderhof JC, van Deun A, Kam KM, Narayanan PR, Aziz MA. Roles of laboratories and laboratory systems in effective tuberculosis programmes. Bull World Health Organ. 2007;85(5):354–359. | ||
Arens M. Human immunodeficiency virus (HIV) and other human retroviruses. In: Essentials of Diagnostic Virology. Storch GA, editor. London, UK: Churchill Livingstone; 2000:249–270. | ||
Zichi D, Eaton B, Singer B, Gold L. Proteomics and diagnostics: let’s get specific, again. Curr Opin Chem Biol. 2008;12(1):78–85. | ||
Kim SH, Iwai S, Araki S, Sakakihara S, Iino R, Noji H. Large-scale femtoliter droplet array for digital counting of single biomolecules. Lab Chip. 2012;12(23):4986–4991. | ||
Hahm JI, Lieber CM. Direct ultrasensitive electrical detection of DNA and DNA sequence variations using nanowire nanosensors. Nano Lett. 2004;4(1):51–54. | ||
Ivanov YD, Pleshakova TO, Kozlov AF, et al. SOI nanowire for the high-sensitive detection of HBsAg and α-fetoprotein. Lab Chip. 2012; 12(23):5104–5111. | ||
Archakov AI, Ivanov YD, Lisitsa AV, Zgoda VG. Biospecific irreversible fishing coupled with atomic force microscopy for detection of extremely low-abundant proteins. Proteomics. 2009;9(5):1326–1343. | ||
Tuerk C, Gold L. Systematic evolution of ligands by exponential enrichment: RNA ligands to bacteriophage T4 DNA polymerase. Science. 1990;249(4968):505–510. | ||
Stoltenburg R, Reinemann C, Strehlitz B. SELEX–a (r)evolutionary method to generate high-affinity nucleic acid ligands. Biomol Eng. 2007;24(4):381–403. | ||
Jayasena SD. Aptamers: an emerging class of molecules that rival antibodies in diagnostics. Clin Chem. 1999;45(9):1628–1650. | ||
Yoshida Y, Waga Y, Horii K. Quantitative and sensitive protein detection strategies based on aptamers. Proteomics Clin Appl. 2012;6(11–12): 574–580. | ||
Wang W, Chen C, Qian M, Zhao XS. Aptamer biosensor for protein detection using gold nanoparticles. Ana Biochem. 2008;373(2):213–219. | ||
Zeng X, Zhang X, Yang W, Jia H, Li Y. Fluorescence detection of adenosine triphosphate through an aptamer-molecular beacon multiple probe. Anal Biochem. 2012;424(1):8–11. | ||
Huang DW, Niu CG, Qin PZ, Ruan M, Zeng GM. Time-resolved fluorescence aptamer-based sandwich assay for thrombin detection. Talanta. 2010;83(1):185–189. | ||
Wu ZS, Zheng F, Shen GL, Yu RQ. A hairpin aptamer-based electrochemical biosensing platform for the sensitive detection of proteins. Biomaterials. 2009;30(15):2950–2955. | ||
Kim DK, Kerman K, Hiep HM, et al. Label-free optical detection of aptamer-protein interactions using gold-capped oxide nanostructures. Anal Biochem. 2008;379(1):1–7. | ||
Jiang Y, Zhu C, Ling L, Wan L, Fang X, Bai C. Specific aptamer-protein interaction studied by atomic force microscopy. Anal Chem. 2003;75(9): 2112–2116. | ||
Zhang X, Yadavalli VK. Surface immobilization of DNA aptamers for biosensing and protein interaction analysis. Biosens Bioelectron. 2011; 26(7):3142–3147. | ||
Miyachi Yu, Ogino Ch, Amino T, Kondo A, Development of a novel aptamer-based sensing system using atomic force microscopy. J Biosci Bioeng. 2011;112(5):511–514. | ||
Lin L, Wang H, Liu Y, Yan H, Lindsay S. Recognition imaging with a DNA aptamer. Biophys J. 2006;90(1):4236–4238. | ||
Lin L1 Fu Q, Williams BA, Azzaz AM, Shogren-Knaak MA, Chaput JC, Lindsay S. Recognition imaging of acetylated chromatin using a DNA aptamer. Biophys J. 2009;97(6):1804–1807. | ||
Neundlinger I, Poturnayova A, Karpisova I, et al. Characterization of enhanced monovalent and bivalent thrombin DNA aptamer binding using single molecule force spectroscopy. Biophys J. 2011;101(7): 1781–1787. | ||
Ge L, Jin G, Fang X. Investigation of the interaction between a bivalent aptamer and thrombin by AFM. Langmuir. 2012;28(1):707–713. | ||
Jiao F, Fan H, Yang G, Zhang F, He P. Directly investigating the interaction between aptamers and thrombin by atomic force microscopy. J Mol Recognit. 2013;26(12):672–678. | ||
Miyachi Y, Shimizu N, Ogino C, Kondo A. Selection of DNA aptamers using atomic force microscopy. Nucleic Acids Res. 2010;38(4):e21. | ||
Yamada K, Yoshii S, Kumagai S, et al. Surface selective adsorption of protein–nanoparticle complexes by controlling electrostatic interaction. Jpn J App Phys. 2006;45:4259–4264. | ||
Kaysheva AL, Ivanov YD, Zgoda VG, et al. Visualization and identification of hepatitis C viral particles by atomic force microscopy combined with MS/MS analysis. Biomed Khim. 2010;4(1):16–25. | ||
Smith D, Collins BD, Heil J, Koch TH. Sensitivity and specificity of photoaptamer probes. Mol Cell Proteomics. 2003;2(1):11–18. | ||
Ivanov YD, Danichev VV, Pleshakova TO, et al. Irreversible chemical AFM-fishing for the detection of low-copied proteins. Biomed Khim. 2013;7(1):46–61. | ||
Kada G, Kienberger F, Hinterdorfer P. Atomic force microscopy in bionanotechnology. Nano Today. 2008;3(1–2):12–19. | ||
Stroh C, Wang H, Bash R, et al. Single-molecule recognition imaging microscopy. Proc Natl Acad Sci U S A. 2004;101(34):12503–12507. | ||
Thomson NH. Imaging the substructure of antibodies with tapping-mode AFM in air: the importance of a water layer on mica. J Microsc. 2005;217(Pt 3):193–199. | ||
Muller DJ, Engel A. Atomic force microscopy and spectroscopy of native membrane proteins. Nat Protoc. 2007;2(9):2191–2197. | ||
Ivanov YD, Frantsuzov P, Bykov V, Besedin S, Hui Bon Hoa G, Archakov A. Comparative investigation of PdR by usual and ultrafine atomic force microscopy. Anal Methods. 2010;2:688–693. | ||
Ivanov YD, Bukharina NS, Frantsuzov PA, et al. AFM study of cytochrome CYP102A1 oligomeric state. Soft Matter. 2012;8:4602–4608. | ||
www.agilent.com [homepage on the internet]. Agilent Technologies. Accessed August 19, 2014. | ||
Archakov AI, Ivanov YD, Lisitsa AV, Zgoda VG. AFM fishing nanotechnology is the way to reverse the Avogadro number in proteomics. Proteomics. 2007;7(1):4–9. | ||
Ivanov YD, Frantsuzov PA, Pleshakova TO, et al. Atomic force microscopy detection of serological markers of viral hepatitis B and C. Biomed Khim. 2010;4(2):117–122. | ||
Ivanov YD, Bukharina NS, Frantsuzov PA, Pleshakova TO, Kanashenko SL, Archakov AI. Oligomeric state investigation of flavocytochrome CYP102A1 using AFM with standard and supersharp probes. Biomed Khim. 2012;6(3):218–224. | ||
Hagel L. Gel filtration. In: Protein Purification: Principles, High-resolution Methods, and Applications. 2nd ed. Janson JC, editor. New Jersey: Wiley; 2011:51–91. |
 © 2014 The Author(s). This work is published and licensed by Dove Medical Press Limited. The full terms of this license are available at https://www.dovepress.com/terms.php and incorporate the Creative Commons Attribution - Non Commercial (unported, v3.0) License.
By accessing the work you hereby accept the Terms. Non-commercial uses of the work are permitted without any further permission from Dove Medical Press Limited, provided the work is properly attributed. For permission for commercial use of this work, please see paragraphs 4.2 and 5 of our Terms.
© 2014 The Author(s). This work is published and licensed by Dove Medical Press Limited. The full terms of this license are available at https://www.dovepress.com/terms.php and incorporate the Creative Commons Attribution - Non Commercial (unported, v3.0) License.
By accessing the work you hereby accept the Terms. Non-commercial uses of the work are permitted without any further permission from Dove Medical Press Limited, provided the work is properly attributed. For permission for commercial use of this work, please see paragraphs 4.2 and 5 of our Terms.