")
Back to Journals » Diabetes, Metabolic Syndrome and Obesity » Volume 14
Associations Between Serum Free Fatty Acid Levels and Incident Diabetes in a 3-Year Cohort Study
Authors Li Q, Zhao M, Wang Y, Zhong F, Liu J, Gao L, Zhao J
Received 19 January 2021
Accepted for publication 17 April 2021
Published 17 June 2021 Volume 2021:14 Pages 2743—2751
DOI https://doi.org/10.2147/DMSO.S302681
Checked for plagiarism Yes
Review by Single anonymous peer review
Peer reviewer comments 2
Editor who approved publication: Prof. Dr. Antonio Brunetti
Qihang Li,1– 3 Meng Zhao,2– 4 Yupeng Wang,1– 3 Fang Zhong,1– 3 Jing Liu,2– 4 Ling Gao,1– 3,5 Jiajun Zhao1– 4
1Department of Endocrinology, Shandong Provincial Hospital, Cheeloo College of Medicine, Shandong University, Jinan, Shandong, People’s Republic of China; 2Shandong Clinical Medical Center of Endocrinology and Metabolism, Jinan, Shandong, People’s Republic of China; 3Institute of Endocrinology and Metabolism, Shandong Academy of Clinical Medicine, Jinan, Shandong, People’s Republic of China; 4Department of Endocrinology, Shandong Provincial Hospital Affiliated to Shandong First Medical University, Jinan, Shandong, People’s Republic of China; 5Department of Scientific Center, Shandong Provincial Hospital Affiliated to Shandong First Medical University, Jinan, Shandong, People’s Republic of China
Correspondence: Jiajun Zhao Tel +86 15168889899
Email [email protected]
Purpose: High circulating free fatty acid (FFA) is associated with the development of diabetes. This study was designed to evaluate longitudinal associations between FFA levels, changes in FFA levels, and mean FFA levels and incident diabetes.
Participants and Methods: This 3-year cohort study was conducted in Ningyang between 2011 and 2014. Serum FFA, fasting blood glucose (FPG), 2-hour postprandial blood glucose (2hPG), and glycosylated hemoglobin (HbA1c) levels were measured at baseline and at the end of follow-up. A multivariate stepwise logistic regression model was used to evaluate associations between serum FFA levels in various groups and the risk of incident diabetes.
Results: Of the 2905 individuals without baseline diabetes, 290 developed diabetes by the 3-year follow-up. With increasing baseline FFA levels, the mean FPG, 2hPG, and HbA1c levels, and the prevalence of diabetes at the end of follow-up increased. The trend of FPG and HbA1c increase was not statistically significant. Higher baseline FFA levels were not significantly associated with greater risk of incident diabetes. However, longitudinal changes in serum FFA levels showed that individuals with serum FFA levels from normal to high (OR = 2.956, 95% CI: 2.089– 4.184) or from high to high (OR = 3.343, 95% CI: 2.300– 4.857) had greater risk of incident diabetes compared with those with normal to normal FFA levels. Similarly, individuals with ΔFFA ≥ 0 mmol/L (OR = 1.762, 95% CI: 1.373– 2.262) or high mean serum FFA levels (OR = 2.120, 95% CI: 1.620– 2.775) were at higher risk of incident diabetes than those with ΔFFA < 0 mmol/L or normal mean serum FFA levels.
Conclusion: The longitudinal status of serum FFA levels, including chronic increases and sustained high levels, was more closely associated with high risk of incident diabetes than was high baseline FFA levels.
Keywords: free fatty acid, diabetes, longitudinal, insulin resistance, lipotoxicity
Introduction
Diabetes is a major medical problem in China and worldwide due to its increasing incidence and prevalence. Hundreds of million individuals suffer from diabetes (type-1 or type-2 diabetes mellitus) and its various cardiovascular complications, causing a heavy health burden worldwide.1,2 In 2017, the International Diabetes Federation revealed that approximately 425 million individuals had diabetes worldwide and this number is predicted to increase to 629 million by 2045.3 In China, the prevalence of diabetes and prediabetes in adults were estimated at 11.6% and 50.1%, respectively. These figures equate to approximately 113.9 and 493.4 million Chinese adults with diabetes and prediabetes, respectively.1 Therefore, it is necessary to understand the pathogenesis of diabetes and identify factors with causal roles in the etiology of diabetes.
There is an extensive body of basic science and animal research that has explored the role of free fatty acid (FFA) in glucose intolerance or the development of diabetes.4–7 Chronically increased serum FFA or sustained hyper-free fatty acidemia induce hepatic and muscle insulin resistance and impair insulin secretion referred to as lipotoxicity,4–6 which are considered the two main pathological mechanisms of diabetes.4,7 However, relatively few longitudinal epidemiologic studies have investigated the associations between serum FFA levels and incident diabetes.2
Previous cross-sectional studies have examined the relationship between fasting circulating FFA concentrations and diabetes and draw a common conclusion that individuals with diabetes have higher circulating FFA concentrations compared with normal individuals.2,8–11 However, the results of longitudinal cohort studies assessing whether baseline levels of circulating FFA can predict the risk of developing diabetes remain controversial.11–15 The majority of prospective epidemiological studies reported that high FFA levels predict the development of diabetes after adjustment for potential confounders such as obesity.12–15 By contrast, another study reported no relationship between baseline FFA levels and the development of Type 2 diabetes, even showing that baseline FFA levels were slightly lower in those who progressed to diabetes than with those who did not.11 The differences in study populations may at least partially explain the variation in results observed across previous studies. However, the effect of FFA on glucose metabolism is a chronic and long-term process. To the best of our knowledge, no investigation has evaluated the associations between longitudinal changes in serum FFA or mean serum FFA levels and incident diabetes. Therefore, in this study, we investigated the associations between baseline serum FFA levels and incident diabetes. Further, we explored the risk associated with the longitudinal statuses of serum FFA across the incident diabetes follow-up.
Materials and Methods
Study Design and Participants
This retrospective cohort study was derived from a noninterventional epidemiological investigation titled Risk Evaluation of cAncers in Chinese diabeTic Individuals: A longitudinal (REACTION) study in Shanghai Jiao Tong University School of Medicine (clinical trial number: NCT01506869).16 The REACTION study enrolled 259,657 Chinese people (≥40 years of age) from 25 communities in mainland China between 2011 and 2012 with follow-ups planned at 3-, 5-, and 10-years.
The data included in the present study were from study participants from Ningyang County, Shandong Province. The 3-year follow-up visits were conducted from 2011 to 2014. Of the overall recruited population, 6,060 subjects participated in the baseline survey and accepted the follow-up visits after 3 years. Individuals who met the following criteria were included in this retrospective cohort study: (1) individuals with non-diabetes (normal or prediabetes) at baseline; (2) blood samples were examined at baseline and at follow-up to acquire available serum indices, including serum lipid profiles such as serum triglyceride (TG), total cholesterol (TC), low-density lipoprotein cholesterol (LDL-C), high-density lipoprotein cholesterol (HDL-C), FFA, fasting blood glucose (FPG), 2-hour postprandial blood glucose (2hPG), and glycosylated hemoglobin (HbA1c) levels; (3) no missing information of key covariates including age, body mass index (BMI), waist circumference (WC), family history of diabetes, and history of smoking and drinking; (4) no use of medications affecting glucose and lipid metabolism, including metformin, insulin, statins and fibrates three months before recruitment and during the follow-up period; and (5) no disease affecting glucose and lipid metabolism including malignant tumors, severe hepatic and renal insufficiency, and thyroid dysfunction three months before recruitment and during the follow-up. Ultimately, 2905 individuals were enrolled in this study.
This study conducted in Ningyang County was a branch of the REACTION study and shared a common ethics approval by the Ruijin Hospital Ethics Committee of Shanghai JiaoTong University School of Medicine. Informed consent was obtained from each participant after receiving a detailed explanation of the purpose and nature of all procedures used. This study was conducted in accordance with the Declaration of Helsinki.
Definition of Groupings and Outcomes
Serum FFA levels at baseline or the end of follow-up were classified as: normal (FFA < 0.9 mmol/L) or high (FFA ≥ 0.9 mmol/L) according to the normal reference ranges (0.1–0.9 mmol/L) in Department of Laboratory Medicine, Shandong Provincial Hospital. Longitudinal changes in FFA levels from the baseline to the end of follow-up were categorized as: from normal to normal; from normal to high; from high to normal; and from high to high. Additionally, mean serum FFA and ΔFFA levels from the baseline to the end of follow-up were calculated using the following formulas: mean FFA level = (FFA concentration at baseline + FFA concentration at end of follow-up)/2, and ΔFFA level = FFA concentration at end of follow-up – FFA concentration at baseline.
The glucose metabolic status of participants at baseline and at the 3-year follow-up included normal, prediabetes, and diabetes, defined based on the ADA 2017 criteria.17 Criteria for the diagnosis of diabetes were: FPG ≥ 126 mg/dL (7.0 mmol/L) or 2hPG ≥ 200 mg/dL (11.1 mmol/L) after an oral glucose tolerance test (OGTT) or HbA1c ≥ 6.5% (48 mmol/mol). Criteria for the diagnosis of prediabetes were FPG, 100 mg/dL (5.6 mmol/L) to 125 mg/dL (6.9 mmol/L) (IFG) or 2hPG after an OGTT, 140 mg/dL (7.8 mmol/L) to 199 mg/dL (11.0 mmol/L) (IGT) or HbA1c, 5.7–6.4% (39–47 mmol/mol). The OGTT should be performed as described by the WHO, using a glucose load containing the equivalent of 75 g anhydrous glucose dissolved in water.
Data Collection
All investigators completed a standardized training program to minimize inter-rater variability. All blood samples were collected between 8:00 and 10:00 AM after overnight fasting and were immediately preserved at −80°C until required for analysis. Blood glucose levels were examined within 2 h. Serum lipid profiles including FFA, glucose metabolic indices including FPG and 2hPG, HbA1c, and indices of hepatic and renal function were examined using a Beckman AU5800 chemistry analyzer system (Beckman Coulter, Tokyo, Japan). For laboratory investigation, at least 1 mL of serum was taken to run above lab tests and the response rate of participants towards blood sampling was more than 90%. For each of the above parameters, intra- and inter-assay coefficients of variation were always below 5%. Blood pressure was measured three times at 3-min intervals for each participant between 8:00 AM and 10:00 AM in sitting position using an electronic sphygmomanometer (HEM-7117; Omron, Kyoto, Japan) and the mean value was calculated. WC was measured in centimeters. Weight and height were measured in kilograms and centimeters, respectively. BMI was calculated by dividing the weight (kilograms) by the square of the height (square meters). Family history of diabetes, and history of smoking and drinking were based on the results of self-reported questionnaires.
Statistical Analysis
Statistical analyses were performed using IBM SPSS Statistics for Windows, version 25.0. The means ± standard deviation and medians (interquartile range) were used to describe continuous variables with normal and skewed distributions, respectively. Categorical variables are presented as numbers (percentages). Continuous variables with normal distribution were compared using a t-test. Continuous variables with skewed distribution were compared by Mann−Whitney U-test. Categorical variables were compared by chi-square test. With increasing FFA quartiles, ANOVA trend tests and Cochran–Armitage chi-squared tests for trend were used to assess the trends of continuous and categorical variables, respectively. A multivariate logistic (stepwise) regression model adjusted for age, sex, family history of diabetes, BMI, WC, FPG, TC, TG, LDL, HDL, and smoking and drinking levels was used to assess the risk correlation between FFA and incident diabetes. Logistic regression analysis outcomes are presented as regression coefficients (B), adjusted odds ratio (OR) values, and 95% confidence intervals (CIs). All calculated p values were two-sided, and p < 0.05 was considered statistically significant.
Results
Baseline Characteristics of the Study Population According to FFA Levels
The basic clinical characteristics of the study population according to FFA levels are summarized in Table 1. Compared with individuals with normal FFA levels, the mean age and indices of glucose metabolism such as FPG and 2hPG were significantly increased in individuals with high FFA levels, while the mean HbA1c between the two groups did not statistically differ (p > 0.05). The prevalence of prediabetes was significantly higher among individuals with high FFA levels than among individuals with normal FFA levels (85.7% vs 80.8%, p < 0.05). The proportion of family history of diabetes was significantly greater among individuals with normal FFA levels than among participants with high FFA levels (2.5% vs 1.3%, p < 0.05). Additionally, individuals with high FFA levels had higher TC, TG, and HDL-C levels. For obesity indices, individuals with high FFA levels had lower BMI and WC, while there was no statistically significant difference (both p > 0.05). Finally, renal function in individuals with high FFA levels was slightly lower. Among the baseline population, a total of 290 of 2905 participants developed diabetes by the 3-year follow-up. Baseline characteristics of the study population according to glucose metabolic status was shown in Supplementary Table 1.
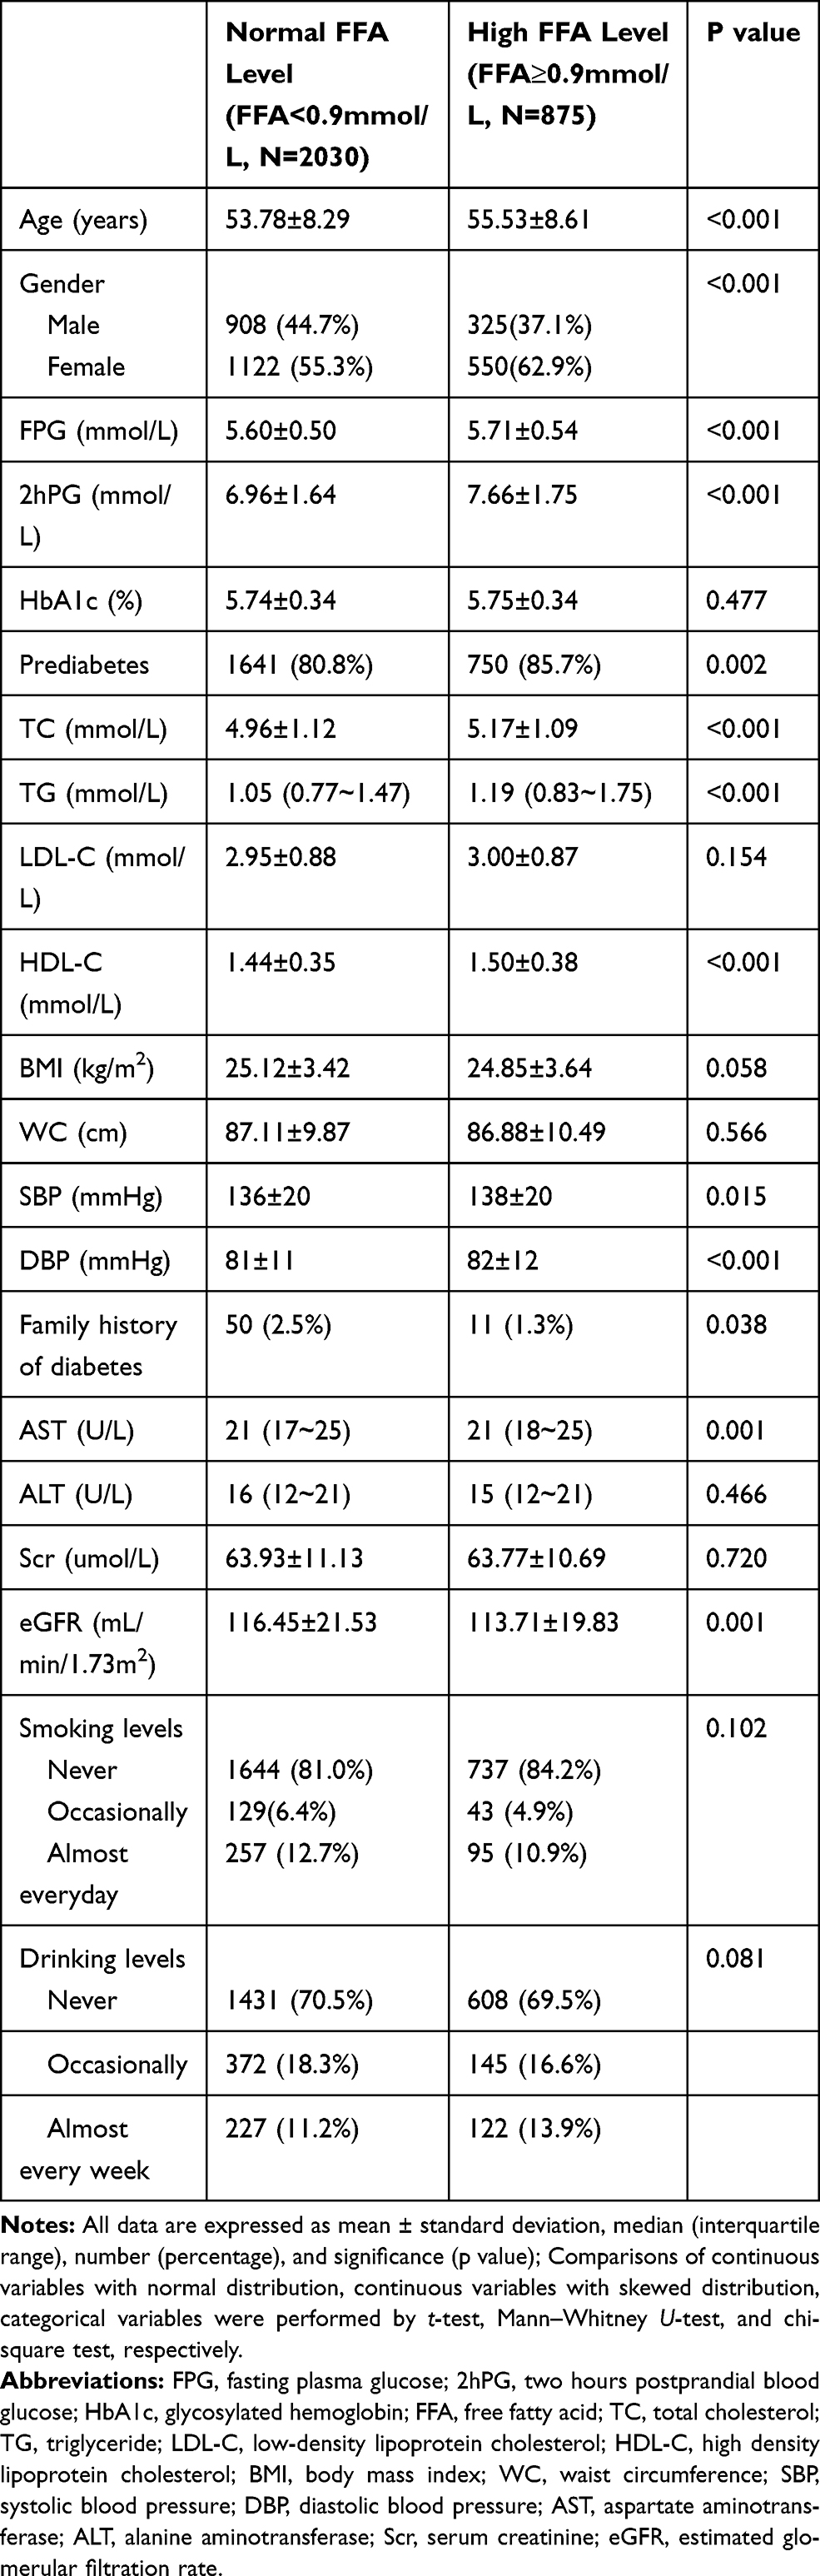 |
Table 1 Baseline Characteristics of the Study Population According to FFA Levels |
Associations of FFA Levels at Baseline with Various Indices of Glucose Metabolism and Risk of Incident Diabetes at End of Follow-Up
The pooled population were divided by baseline FFA levels. Compared with individuals with normal baseline FFA levels, individuals with high baseline FFA levels had higher FPG, 2hPG, HbA1c levels and a higher proportion of diabetes at the end of follow-up. However, the mean FPG and HbA1c in groups with normal and high baseline FFA levels did not statistically differ (both p > 0.05). The pooled population was then divided into quartiles based on baseline FFA levels as follows: quartile 1: FFA ≤ 0.48, quartile 2: 0.48 < FFA ≤ 0.63, quartile 3: 0.63 < FFA ≤ 0.81, and quartile 4: FFA > 0.81 (mmol/L). With increasing FFA quartiles, the mean levels of FPG, 2hPG, and HbA1c, and the proportion of diabetes at the end of follow-up increased in a stepwise manner. The trends of increased FPG and HbA1c were not statistically significant (Table 2).
 |
Table 2 Comparison of Glucose Metabolic Indices at the End of Follow-Up in Groups Based on Baseline FFA Levels |
To further evaluate whether baseline FFA levels were independently associated with incident diabetes, we conducted multivariate logistic stepwise regression analyses. After adjusting for vital confounders such as age, sex, BMI, WC, family history of diabetes, FPG, TG, TC, LDL-C, HDL-C, and smoking and drinking levels, all adjusted ORs for incident diabetes showed no statistical significance irrespective of how baseline FFA levels were modeled (normal/high FFA, FFA quartiles, or continuous variable) (Table 3).
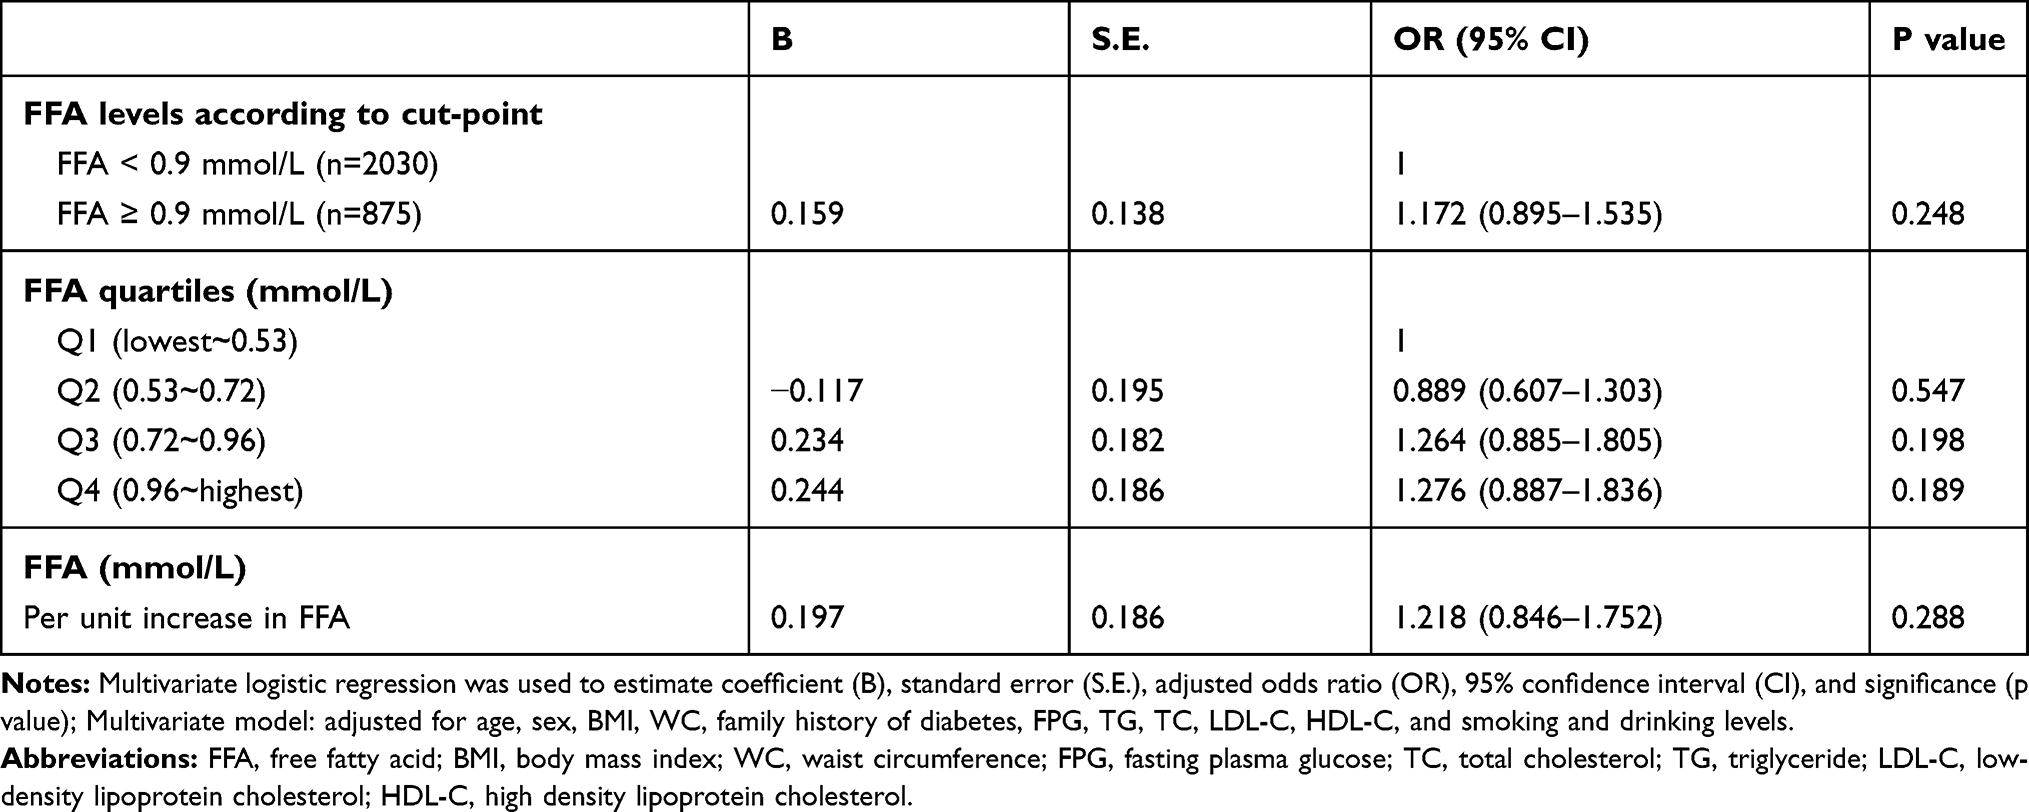 |
Table 3 Multivariate Logistic Regression of Different Baseline FFA Levels for Incident Diabetes |
Longitudinal Increase and Sustained High Level Status of Serum FFA Levels are Associated with Higher Risk of Incident Diabetes
Longitudinal changes of FFA levels from the baseline to the end of follow-up were categorized into four types: from normal to normal; from normal to high; from high to normal; and from high to high. Furthermore, levels of mean serum FFA and ΔFFA from baseline to the end of follow-up were calculated. After adjusting for confounding factors such as age, sex, BMI, WC, family history of diabetes, FPG, TG, TC, LDL-C, HDL-C, and smoking and drinking levels, individuals with the serum FFA levels from normal to high (OR = 2.956, 95% CI: 2.089–4.184) and from high to high (OR = 3.343, 95% CI: 2.300–4.857) were associated with higher risk for incident diabetes than were individuals with the serum FFA levels from normal to normal. The OR and 95% CI of normal to high and high to high (p < 0.001) compared with high to normal was shown in Supplementary Table 2. Individuals with ΔFFA ≥ 0 mmol/L had a higher risk of incident diabetes (OR = 1.762, 95% CI: 1.373–2.262, p < 0.001) compared with the individuals with ΔFFA < 0 mmol/L. When individuals were divided by mean FFA exposure, the risk for incident diabetes (OR = 2.120, 95% CI: 1.620–2.775) increased approximately twofold among individuals with mean FFA ≥ 0.9 mmol/L compared with that among individuals with mean FFA < 0.9 mmol/L (Table 4).
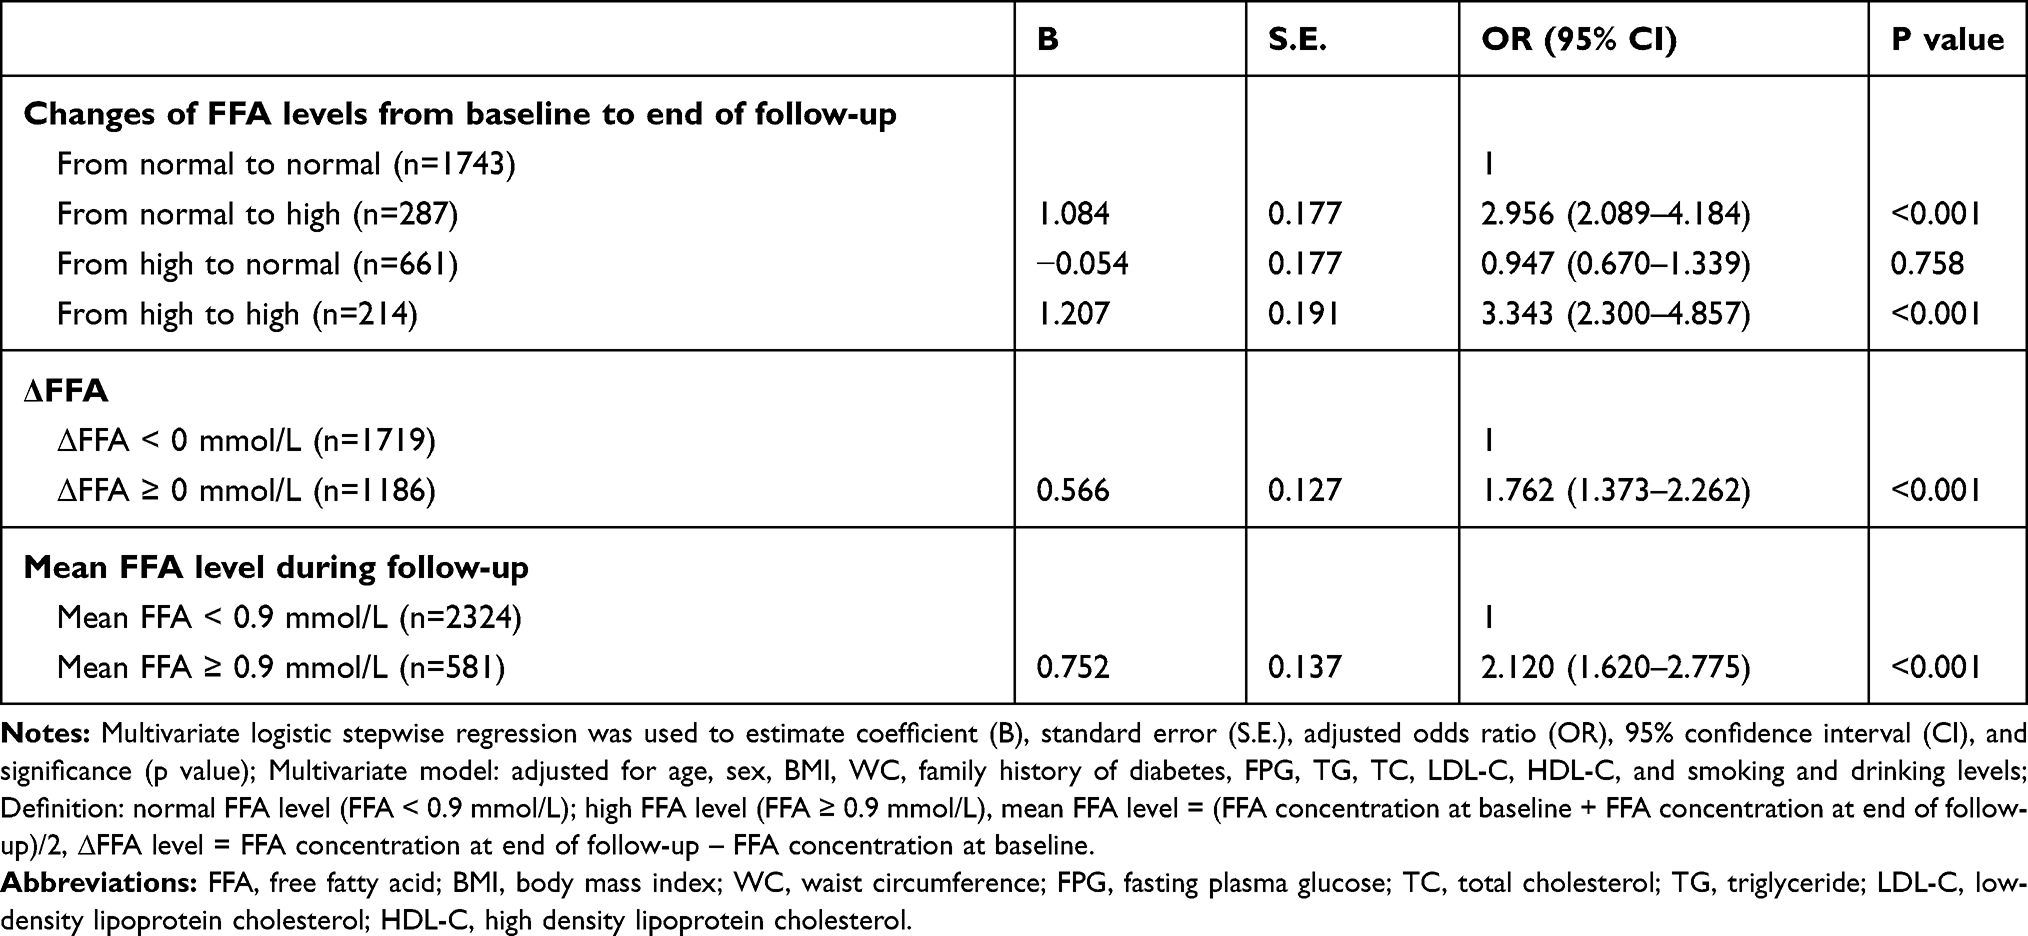 |
Table 4 Multivariate Stepwise Logistic Regression of Longitudinal Statuses of FFA Levels for Incident Diabetes |
Discussion
In this longitudinal cohort study, we explored the associations between serum FFA levels and incident diabetes. The results demonstrated that higher baseline FFA levels are not significantly associated with greater risk of incident diabetes, and do not support the notion that high FFA levels are a predictor of increased risk for incident diabetes. Longitudinal changes in serum FFA levels from normal to high or from high to high were associated with greater risks of incident diabetes compared normal to normal serum FFA. Similarly, individuals with ΔFFA ≥ 0 mmol/L or high mean levels of serum FFA were at higher risk of incident diabetes compared with those with ΔFFA < 0 mmol/L or normal mean serum FFA levels, respectively.
Circulating FFA primarily come from the processes of digestion, during which triglyceride (TAG) are hydrolyzed into mono- or diglycerides and FFA, and endogenous synthesis from superfluous carbohydrates termed de novo lipogenesis.18–20 In healthy individuals, FFA levels are tightly balanced and physiological FFA concentration constitutes an important energy source in many body tissues, serving as the primary oxidative fuel for myocardium, liver, renal cortex, and skeletal muscle and enhancing basal and glucose-stimulated insulin secretion.21 However, in vitro and in vivo experiments have shown that chronically increased FFA levels lead to glucose homeostasis disturbances by causing insulin resistance in liver and skeletal muscle, and impaired pancreatic β-cell function.6,15,21–23 It is likely that higher FFA levels cause insulin resistance by interfering with insulin signaling and inhibiting insulin-stimulated glucose uptake, oxidation, and glycogen synthesis in liver and skeletal muscle.14,15,24,25 The deleterious effects of chronically elevated FFA levels on β-cell function are referred to as lipotoxicity, and involve underlying mechanisms of inflammation, oxidative stress, endoplasmic reticulum stress, mitochondrial dysfunction, and impaired autophagy.6,10
FFA may play an intermediary role in the association of factors with an established risk of diabetes. For example, the relationship between obesity and diabetes has been known for decades,4,5,7,15,21 and obesity is a critical risk factor for the development of diabetes.6 The deleterious role of FFA in type 2 diabetes is most evident in obese patients because obesity is associated with elevated levels of circulating FFA, due to expanded adipose tissue mass and decreased FFA clearance.6,26,27 It is widely accepted that elevated circulating FFA levels in obesity contribute to insulin resistance by competitive inhibition of glucose metabolism and β-cell damage by lipotoxicity.4,5,7,10,26,28 Therefore, FFA is often considered a mechanistic link between obesity and diabetes onset. Additionally, the increased risk of diabetes in patients with autonomic nervous system dysfunction may be attributed to excessive FFA release caused by higher circulating catecholamine levels.29 Finally, elevated FFA levels may contribute to chronic, low-grade systemic inflammation associated with diabetes.30,31
Previous cross-sectional studies have investigated the relationship between circulating FFA levels and diabetes, and the common conclusions indicate that high FFA levels are associated with the presence of diabetes.8–10 However, few prospective or retrospective cohort studies have evaluated the longitudinal association between circulating FFA levels and incident diabetes. Most conclusions support the notion that higher baseline FFA levels are an independent risk factor for the development of diabetes, suggesting that baseline FFA levels can be used to predict the risk of incident diabetes.8,12–15,32 Contrary to these conclusions, the Ely Study found that baseline FFA levels do not predict the future development of diabetes.11 The disparity in results may be attributed to differences in the characteristics of the study participants, which may have obscured the relationship. These disparities may have been further confounded by the instability of circulating FFA and the methods of detection used. Moreover, the Ely Study only included 345 participants, potentially leading to weak statistical power.
Our results show no relationship between baseline FFA levels and incident diabetes and are consistent with those of the Ely Study. Furthermore, to the best of our knowledge, this is the first investigation to evaluate the associations between the longitudinal statuses of serum FFA, including the changes in serum FFA levels or mean levels of serum FFA across the follow-up, and incident diabetes. Our results demonstrate that individuals with chronically increased FFA, represented by serum FFA levels changing from normal to high or ΔFFA ≥ 0 mmol/L across the follow-up, and those with sustained hyper-FFA (represented by serum FFA levels from high to high or high mean levels of serum FFA across the follow-up), had a higher risk of incident diabetes than did individuals with consistently normal FFA levels. Lipotoxicity is a long-term chronic process that leads to tissue damage. Therefore, although baseline FFA levels may have some significance for disease prevention, it is not completely reasonable to use this parameter to predict the future occurrence of diabetes. Our results suggested that the longitudinal levels of FFA are stronger predictors of diabetes onset, and highlight the importance of long-term FFA control.
However, our study had some limitations. For example, blood samples were only examined at baseline and end of follow-up and data from the middle of follow-up were not obtainable. Examinations of serum FFA levels at more time points across the follow-up period are necessary because they will provide more detail about the longitudinal status of serum FFA levels. A 3-year follow-up is also insufficient compared to the chronic development of diabetes. Therefore, a longer longitudinal study with a longer follow-up period with sampling throughout is more likely to reflect the associations between serum FFA levels and incident diabetes. Additionally, almost 80% of participants were prediabetic at baseline, possibly due to the older age of the participants selected at the time of recruitment. This cohort is less likely to be representative of the general population. Therefore, caution is required when generalizing these results.
Conclusion
In conclusion, the longitudinal status of serum FFA levels, including chronic increases and sustained high levels, is more closely associated with high risk of incident diabetes than is high baseline FFA levels. Thus, a reduction in elevated circulating FFA should be an important target when attempting to postpone or prevent the occurrence and development of diabetes. More emphatically, the longitudinal long-term control of circulating FFA level, such as weight loss and some pharmacological interventions, is helpful to prevent the occurrence of diabetes.
Data Sharing Statement
The data presented in this article are not readily available because the data are not publicly available due to privacy or ethical restrictions.
Ethics Approval
The study was approved by Ruijin Hospital Ethics Committee of Shanghai JiaoTong University School of Medicine.
Consent to Participate
Informed consent was obtained from each participant after detailed explanation of the purpose and nature of all procedures used.
Acknowledgments
We appreciate all of the participants included in our study for providing their informed consent and all authors for their dedication in analyzing data and writing the article.
Funding
This work was supported by the National Key Research and Development Program of China (2017YFC1309800, 2017YFC0909600), the National Natural Science Foundation (91957209, 81430020).
Disclosure
The authors have no conflicts of interest to declare.
References
1. Xu Y, Wang L, He J, et al. Prevalence and control of diabetes in Chinese adults. JAMA. 2013;310(9):948–959. doi:10.1001/jama.2013.168118
2. IS Sobczak A, A Blindauer C, J Stewart A. Changes in plasma free fatty acids associated with type-2 diabetes. Nutrients. 2019;11(9):2022.
3. Carracher AM, Marathe PH, Close KL. International diabetes federation 2017. J Diabetes. 2018;10(5):353–356. doi:10.1111/1753-0407.12644
4. DeFronzo RA. Dysfunctional fat cells, lipotoxicity and type 2 diabetes. Int J Clin Pract Suppl. 2004;58(4):9–21. doi:10.1111/j.1368-504X.2004.00389.x
5. Csala M. [Hyper-free fatty acidemia - insulin resistance and beta-cell death]. Orv Hetil. 2016;157(19):733–739. Hungarian. doi:10.1556/650.2016.30439
6. Lytrivi M, Castell AL, Poitout V, Cnop M. Recent insights into mechanisms of β-cell lipo- and glucolipotoxicity in type 2 diabetes. J Mol Biol. 2020;432(5):1514–1534. doi:10.1016/j.jmb.2019.09.016
7. Felber JP, Golay A. Pathways from obesity to diabetes. Int J Obes Relat Metab Disord. 2002;26(Suppl 2):S39–45. doi:10.1038/sj.ijo.0802126
8. Mahendran Y, Cederberg H, Vangipurapu J, et al. Glycerol and fatty acids in serum predict the development of hyperglycemia and type 2 diabetes in Finnish men. Diabetes Care. 2013;36(11):3732–3738. doi:10.2337/dc13-0800
9. Huang X, Yan D, Xu M, et al. Interactive association of lipopolysaccharide and free fatty acid with the prevalence of type 2 diabetes: a community-based cross-sectional study. J Diabetes Investig. 2019;10(6):1438–1446. doi:10.1111/jdi.13056
10. Spiller S, Bluher M, Hoffmann R. Plasma levels of free fatty acids correlate with type 2 diabetes mellitus. Diabetes Obes Metab. 2018;20(11):2661–2669. doi:10.1111/dom.13449
11. Byrne CD, Maison P, Halsall D, Martensz N, Hales CN, Wareham NJ. Cross-sectional but not longitudinal associations between non-esterified fatty acid levels and glucose intolerance and other features of the metabolic syndrome. Diabet Med. 1999;16(12):1007–1015. doi:10.1046/j.1464-5491.1999.00184.x
12. Paolisso G, Tataranni PA, Foley JE, Bogardus C, Howard BV, Ravussin E. A high concentration of fasting plasma non-esterified fatty acids is a risk factor for the development of NIDDM. Diabetologia. 1995;38(10):1213–1217. doi:10.1007/BF00422371
13. Pankow JS, Duncan BB, Schmidt MI, et al. Fasting plasma free fatty acids and risk of type 2 diabetes: the atherosclerosis risk in communities study. Diabetes Care. 2004;27(1):77–82. doi:10.2337/diacare.27.1.77
14. Charles MA, Eschwege E, Thibult N, et al. The role of non-esterified fatty acids in the deterioration of glucose tolerance in Caucasian subjects: results of the Paris prospective study. Diabetologia. 1997;40(9):1101–1106. doi:10.1007/s001250050793
15. Wilding JP. The importance of free fatty acids in the development of type 2 diabetes. Diabet Med. 2007;24(9):934–945. doi:10.1111/j.1464-5491.2007.02186.x
16. Ning G; Reaction Study G. Risk Evaluation of cAncers in Chinese diabeTic Individuals: a lONgitudinal (REACTION) study. J Diabetes. 2012;4(2):172–173. doi:10.1111/j.1753-0407.2012.00182.x
17. American Diabetes Association. Classification and diagnosis of diabetes. Diabetes Care. 2017;40(Suppl 1):S11–S24. doi:10.2337/dc17-S005
18. Ramirez M, Amate L, Gil A. Absorption and distribution of dietary fatty acids from different sources. Early Hum Dev. 2001;65(Suppl):S95–S101. doi:10.1016/S0378-3782(01)00211-0
19. Rui L. Energy metabolism in the liver. Compr Physiol. 2014;4(1):177–197.
20. Large V, Peroni O, Letexier D, Ray H, Beylot M. Metabolism of lipids in human white adipocyte. Diabetes Metab. 2004;30(4):294–309. doi:10.1016/S1262-3636(07)70121-0
21. Boden G, Shulman GI. Free fatty acids in obesity and type 2 diabetes: defining their role in the development of insulin resistance and beta-cell dysfunction. Eur J Clin Invest. 2002;32(Suppl 3):14–23. doi:10.1046/j.1365-2362.32.s3.3.x
22. McGarry JD. Banting lecture 2001: dysregulation of fatty acid metabolism in the etiology of type 2 diabetes. Diabetes. 2002;51(1):7–18. doi:10.2337/diabetes.51.1.7
23. Kashyap S, Belfort R, Gastaldelli A, et al. A sustained increase in plasma free fatty acids impairs insulin secretion in nondiabetic subjects genetically predisposed to develop type 2 diabetes. Diabetes. 2003;52(10):2461–2474. doi:10.2337/diabetes.52.10.2461
24. Boden G. Effects of free fatty acids (FFA) on glucose metabolism: significance for insulin resistance and type 2 diabetes. Exp Clin Endocrinol Diabetes. 2003;111(3):121–124. doi:10.1055/s-2003-39781
25. Griffin ME, Marcucci MJ, Cline GW, et al. Free fatty acid-induced insulin resistance is associated with activation of protein kinase C theta and alterations in the insulin signaling cascade. Diabetes. 1999;48(6):1270–1274. doi:10.2337/diabetes.48.6.1270
26. Arner P. Insulin resistance in type 2 diabetes: role of fatty acids. Diabetes Metab Res Rev. 2002;18(Suppl 2):S5–9. doi:10.1002/dmrr.254
27. Boden G. Obesity and free fatty acids. Endocrinol Metab Clin North Am. 2008;37(3):
28. Boden G. Free fatty acids, insulin resistance, and type 2 diabetes mellitus. Proc Assoc Am Physicians. 1999;111(3):241–248. doi:10.1046/j.1525-1381.1999.99220.x
29. Nonogaki K. New insights into sympathetic regulation of glucose and fat metabolism. Diabetologia. 2000;43(5):533–549. doi:10.1007/s001250051341
30. Fernandez-Real JM, Broch M, Vendrell J, Richart C, Ricart W. Interleukin-6 gene polymorphism and lipid abnormalities in healthy subjects. J Clin Endocrinol Metab. 2000;85(3):1334–1339. doi:10.1210/jcem.85.3.6555
31. Maeda N, Shimomura I, Kishida K, et al. Diet-induced insulin resistance in mice lacking adiponectin/ACRP30. Nat Med. 2002;8(7):731–737. doi:10.1038/nm724
32. Salgin B, Ong KK, Thankamony A, Emmett P, Wareham NJ, Dunger DB. Higher fasting plasma free fatty acid levels are associated with lower insulin secretion in children and adults and a higher incidence of type 2 diabetes. J Clin Endocrinol Metab. 2012;97(9):3302–3309. doi:10.1210/jc.2012-1428
 © 2021 The Author(s). This work is published and licensed by Dove Medical Press Limited. The full terms of this license are available at https://www.dovepress.com/terms.php and incorporate the Creative Commons Attribution - Non Commercial (unported, v3.0) License.
By accessing the work you hereby accept the Terms. Non-commercial uses of the work are permitted without any further permission from Dove Medical Press Limited, provided the work is properly attributed. For permission for commercial use of this work, please see paragraphs 4.2 and 5 of our Terms.
© 2021 The Author(s). This work is published and licensed by Dove Medical Press Limited. The full terms of this license are available at https://www.dovepress.com/terms.php and incorporate the Creative Commons Attribution - Non Commercial (unported, v3.0) License.
By accessing the work you hereby accept the Terms. Non-commercial uses of the work are permitted without any further permission from Dove Medical Press Limited, provided the work is properly attributed. For permission for commercial use of this work, please see paragraphs 4.2 and 5 of our Terms.