")
Back to Journals » Diabetes, Metabolic Syndrome and Obesity » Volume 12
Association between metabolic syndrome and limb muscle quantity and quality in older adults: a pilot ultrasound study
Authors Chang KV , Yang KC , Wu WT, Huang KC , Han DS
Received 16 June 2019
Accepted for publication 30 August 2019
Published 11 September 2019 Volume 2019:12 Pages 1821—1830
DOI https://doi.org/10.2147/DMSO.S219649
Checked for plagiarism Yes
Review by Single anonymous peer review
Peer reviewer comments 2
Editor who approved publication: Prof. Dr. Juei-Tang Cheng
Ke-Vin Chang,1,2 Kuen-Cheh Yang,3–5 Wei-Ting Wu,1,2 Kuo-Chin Huang,3–5 Der-Sheng Han1,2,5
1Department of Physical Medicine and Rehabilitation, National Taiwan University Hospital, Bei-Hu Branch, Taipei, Taiwan; 2Department of Physical Medicine and Rehabilitation, National Taiwan University College of Medicine, Taipei, Taiwan; 3Department of Family Medicine, National Taiwan University Hospital, Bei-Hu Branch, Taipei, Taiwan; 4Department of Family Medicine, National Taiwan University College of Medicine, Taipei, Taiwan; 5Health Science and Wellness Center, National Taiwan University, Taipei, Taiwan
Correspondence: Der-Sheng Han
Department of Physical Medicine and Rehabilitation, National Taiwan University Hospital, BeiHu Branch, No. 87, Nei-Jiang Road, Wan-Hwa District, Taipei 108, Taiwan
Tel +886 223 717 101 5001
Email [email protected]
Purpose: Limited imaging studies have investigated whether limb muscle quantity and quality change after metabolic syndrome (MetS) development. This pilot study examined MetS influence on limb muscle characteristics in older adults.
Methods: Participants were recruited from annual health examinations; their right biceps brachii, triceps brachii, rectus femoris, and gastrocnemius muscles were measured by ultrasound. Anthropometric parameters, blood biochemistry, and physical performance (handgrip strength and gait speed) were also examined.
Results: Overall, 129 participants were enrolled, including 26 with MetS. Although handgrip strength was lower in MetS patients, there were no significant between-group differences considering thickness and mean echogenicity of the four muscles. Handgrip strength was positively correlated with the thickness of biceps brachii, triceps brachii, and rectus femoris but was negatively associated with their echogenicity. On multivariate analysis, triceps muscle echogenicity was trivially associated (odds ratio, 0.93; 95% confidence interval, 0.86–0.99) with MetS, possibly due to multicollinearity with grip strength.
Conclusion: No significant difference was recognized in limb muscle thickness and echogenicity in the geriatric population with MetS compared with healthy controls by ultrasound imaging. However, the finding might be caused by the small sample size of our participants. Future large-scale studies should explore the influence of separated risk factors of MetS on limb muscle echotexture and examine whether manifestation differs in different age populations.
Keywords: metabolic syndrome, sarcopenia, sonography, nutrition, obesity
Introduction
Abdominal obesity, hyperglycemia, hypertension, and dyslipidemia are hallmarks of metabolic syndrome (MetS), which is strongly related to insulin resistance.1 Aging aggravates the severity of insulin resistance, contributing to high prevalence of MetS in the geriatric population.2 Moreover, MetS is a well-established risk factor for developing type II diabetes mellitus, cardiovascular diseases, and stroke, imposing a substantial burden on the global medical and socioeconomic systems. In addition to old age, physical inactivity, higher intake of dietary carbohydrate, and lower education status are also attributing factors of MetS.3 In recent years, loss of muscle mass and function, known as sarcopenia, has been found to be linked to MetS.4
Sarcopenia is a known risk that increases mortality in different diseased populations5 in addition to incidences of cognitive impairment,6 depression,7 and fractures.8 A Korean cross-sectional study indicated that patients with low appendicular lean mass and high visceral fat, known as sarcopenic obesity, were eight-times more likely to develop MetS compared with those with obesity or sarcopenia alone.9 A computed tomography study found a negative correlation between waist circumference and muscle density of the forearm and calf in a cohort of patients with MetS.4 Furthermore, several recent studies demonstrated an inverse association between handgrip strength and prevalence of MetS.10–12 The negative association between handgrip strength and MetS may be mediated by insulin resistance, which leads to impairment of skeletal muscle glycogen synthesis.13 In addition, patients with MetS tend to have an elevated level of inflammatory markers, such as interleukin-6 and tumor necrosis factor-α, which also cause muscle dysfunction.13 Although it seems evident that MetS poses a detrimental influence on skeletal muscles, there are a limited number of imaging studies investigating whether limb muscle quantity and quality changes after development of MetS.
High-resolution ultrasound has been widely used in assessing musculoskeletal disorders.14–16 It has advantages of lower cost and portability compared with magnetic resonance imaging and computed tomography and is suitable for evaluation of extremity muscles in community-based services. Muscle fibers and intramuscular connective tissues can be well delineated using ultrasound, thus, enabling assessment of muscle quantity and quality.15 In a cohort study of 347 community-dwelling adults,17 participants with sarcopenia were found to have lower thickness and higher echo intensity of thigh muscles than those without sarcopenia. As sarcopenia shares several common risk factors with MetS, such as aging and physical inactivity, it would be of clinical interest to determine whether both medical conditions have similar manifestations on limb muscles. Therefore, the present study aimed to examine the influence of MetS on limb muscle characteristics in the geriatric population.
Materials and methods
Participants
The participants recruited in the study were the elderly who attended the annual health examination in 2016. Ageing is a known risk for sarcopenia.18 As the present study aimed to investigate whether MetS could aggravate muscle volume loss in the geriatric population, only people older than 65 years were included. In addition, not all the participants were recruited from the geriatric clinic. A comprehensive geriatric assessment was lacking in some participants. The inclusion criterion was older adults who had normal cognition to fill out the questionnaires and walked without using an assisting device in order to measure the gait speed. The exclusion criteria were the elderly with (1) atrial fibrillation/flutter, ventricular bigeminy, using cardiac pacemakers, (2) malignancy, (3) severe infection, (4) hematological disorder, and (5) known uncontrolled medical conditions. They were required to provide written informed consent before enrollment. The present study was approved by the institutional review board of National Taiwan University Hospital (201601091RIND) and was conducted in accordance with Declaration of Helsinki.
Anthropometric and biochemistry measurements and diagnosis of MetS
The body mass index (BMI) was obtained by dividing the participants’ weight (kg) by the square of their height (m). A standard height–weight meter was used to measure body weight (accuracy of 100 g) and height (accuracy of 1 mm). Waist circumference was determined in the standing position at the umbilicus level using a measuring tape. A standard sphygmomanometer was employed to measure systolic and diastolic blood pressure after the participants had been seated for more than 10 min. An auto-analyzer (Hitachi 7250 Special, Hitachi, Tokyo, Japan) was used to examine the levels of glucose, total cholesterol, low-density lipoprotein cholesterol, high-density lipoprotein cholesterol, and triglycerides in venous blood after fasting overnight. The modified National Cholesterol Education Program Adult Treatment Panel III (NCEP ATP III) criterion with Asian cutoff of waist girth was adopted in this study.19 The diagnosis of MetS was based on the presence of at least three of the following five conditions: (1) waist circumference of >90 cm in males and >80 cm in females, (2) blood pressure over 130/85 mmHg, (3) high-density lipoprotein cholesterol level of <40 mg/dL (men) or <50 mg/dL (women), (4) Impaired fasting glucose: fasting glucose higher than 100 mg/dL, or previously diagnosed type 2 diabetes, and (5) triglyceride level of >150 mg/dL.20,21
Measurement of physical performance
Handgrip strength was measured by employing a hand-held dynamometer. Participants were seated with elbows slightly flexed and were then asked to forcefully grasp the dynamometer three times using their right hands. The interval between each test was more than 1 min to prevent muscle fatigue. The maximal value was used to represent handgrip strength.22
Gait speed was measured by the 5-m walking test. Four indicators were marked at the origin, 1 m, 6 m, and the end along a straight 7-m line on the ground. The speed was determined by dividing 5 m by the time (in seconds) taken to reach from the 1-m to 6-m points. The participants were encouraged to walk in a comfortable manner.22,23
Ultrasound measurement protocol
The participants lay supine for measurements of the biceps brachii and rectus femoris muscles and were positioned prone for measurements of the triceps brachii and medial gastrocnemius muscles. The elbow, hip, and knee joints were maintained extended. The biceps brachii muscle was measured at the mid-point between the coracoid process and elbow crease (Figure 1A), whereas the triceps brachii muscle was evaluated at the mid-point between the posterior glenohumeral joint and olecranon of the ulna bone (Figure 1B). Likewise, the mid-points between the anterior superior iliac spine and patella and between the popliteal fossa and insertion of the Achilles tendon were used for assessment of the rectus femoris (Figure 1C) and medial gastrocnemius muscles (Figure 1D), respectively. All muscles on the right limbs were assessed in the short-axis view. Light contact of the transducer with the skin was allowed. All the ultrasound images were obtained by using a multi-frequency (5–14 MHz) transducer (UP 200, BenQ Medical Technology Corporation, Taipei, Taiwan). The gain, focus, and dynamic range of the ultrasound machine were maintained to be constant between one examination and another for the same muscle group. The thickness and echogenicity of the target muscles were measured using the ImageJ software (National Institutes of Health, Rockville Pike, Bethesda, MD). The region of interest was selected by demarcating the inner border of the superficial and deep muscle fascia. The left and right edges of the scan view would be treated as the lateral borders of the region of interest if the whole muscle cannot be captured inside one scan view. The thickness was determined by the maximal vertical length from the superficial to deep epimysium (Figure 2A), and echogenicity was estimated by the mean pixel intensity inside the region of interest (Figure 2B).15 Echogenicity indicates the physical property that a structure reacts to an ultrasound beam, which is reflected by or passes the target.24 An increase in echogenicity refers to more echo signals returning to the transducer.24 Higher echogenicity of muscles is related to muscle weakness and atrophy.25 Before the start of the present study, a pilot study was conducted to examine the reliability of ultrasound muscle measurement on five healthy volunteers. The inter-rater and intra-rater reliabilities expressed as intra-class correlation were 0.751 [95% confidence interval (CI), 0.472–0.894] and 0.835 (95% CI, 0.630–0.931), respectively. Our reliability was similar to a previous study also using the ImageJ software to quantify muscle volume, whose intra-class correlations ranged between 0.80 and 0.99.26
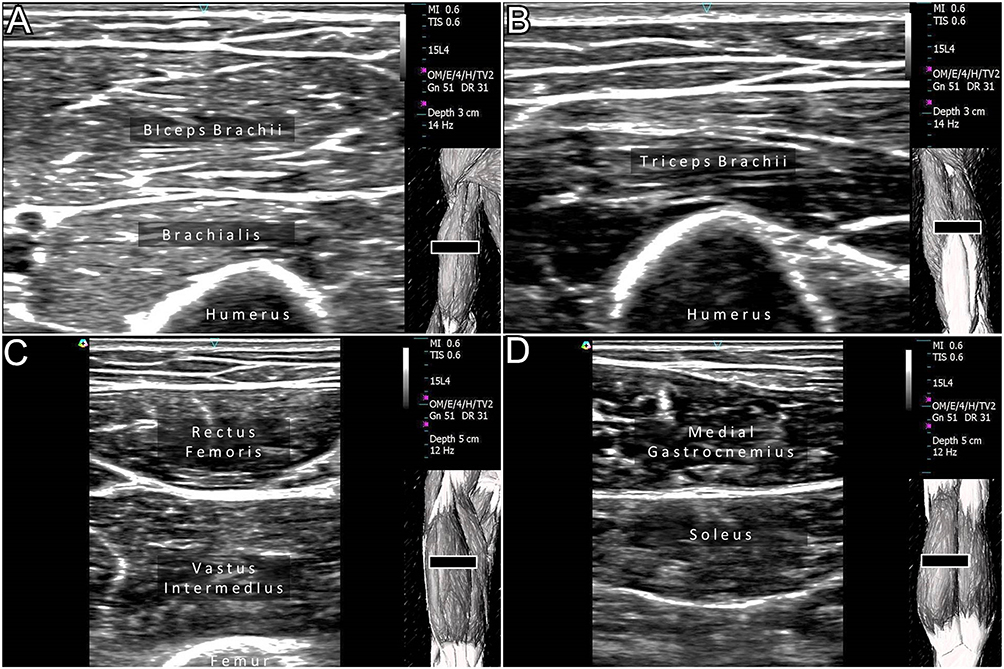 |
Figure 1 Ultrasound measurements of the biceps brachii (A), triceps brachii (B), rectus femoris (C), and medial gastrocnemius (D) muscles. The black square indicates ultrasound transducers. |
 |
Figure 2 Measurement of the muscle thickness (arrow) (A) and mean echogenicity (arrowhead) (B) of the target muscles using the ImageJ software. |
Statistical analysis
The sample size was estimated based on the ultrasound measurements of limb muscle thickness from a previous study.15 We assumed that the mean thickness of the biceps brachii muscle was 2.0 mm with a standard deviation of 0.3 mm in healthy participants and decreased by 10% in patients with MetS. The sample ratio of patients with MetS vs health participants was set at 0.25. Using an alpha value of 0.05 and a power of 80%, 110 people were needed.
Continuous variables were presented as mean ± standard deviation and were compared by employing independent t-test (in case of normal distribution) or Mann Whitney U test (in case of lacking normal distribution). Categorical data were shown in portions and were compared by the chi-square test. Logistic regression was used to elaborate the association of MetS [expressed by odds ratio (OR) and its 95% CI] with measurements of basic demographics, anthropometric assessment, physical performance, and muscle ultrasound indicators. The selection of variables in the multivariate analysis was based on a previous similar study investigating peripheral muscle quality and quantity in the geriatric population.15 The variables chosen are factors that may confound muscle volume measurements. All analyses were conducted using MedCalc for Windows, version 15.0 (MedCalc Software, Ostend, Belgium) and a p-value of <0.05 was considered statistically significant.
Results
The present study included 129 participants, of which 26 presented MetS. A higher number of patients (p=0.072) with MetS were males. Patients with MetS also had significantly higher values of waist circumference, systolic blood pressure, blood sugar, and triglyceride and lower values of high-density lipoprotein and handgrip strength. There were no significant between-group differences with regard to thickness (Table 1 and Figure 3A–D) and mean echogenicity of the four target muscles (Table 1 and Figure 4A–D).
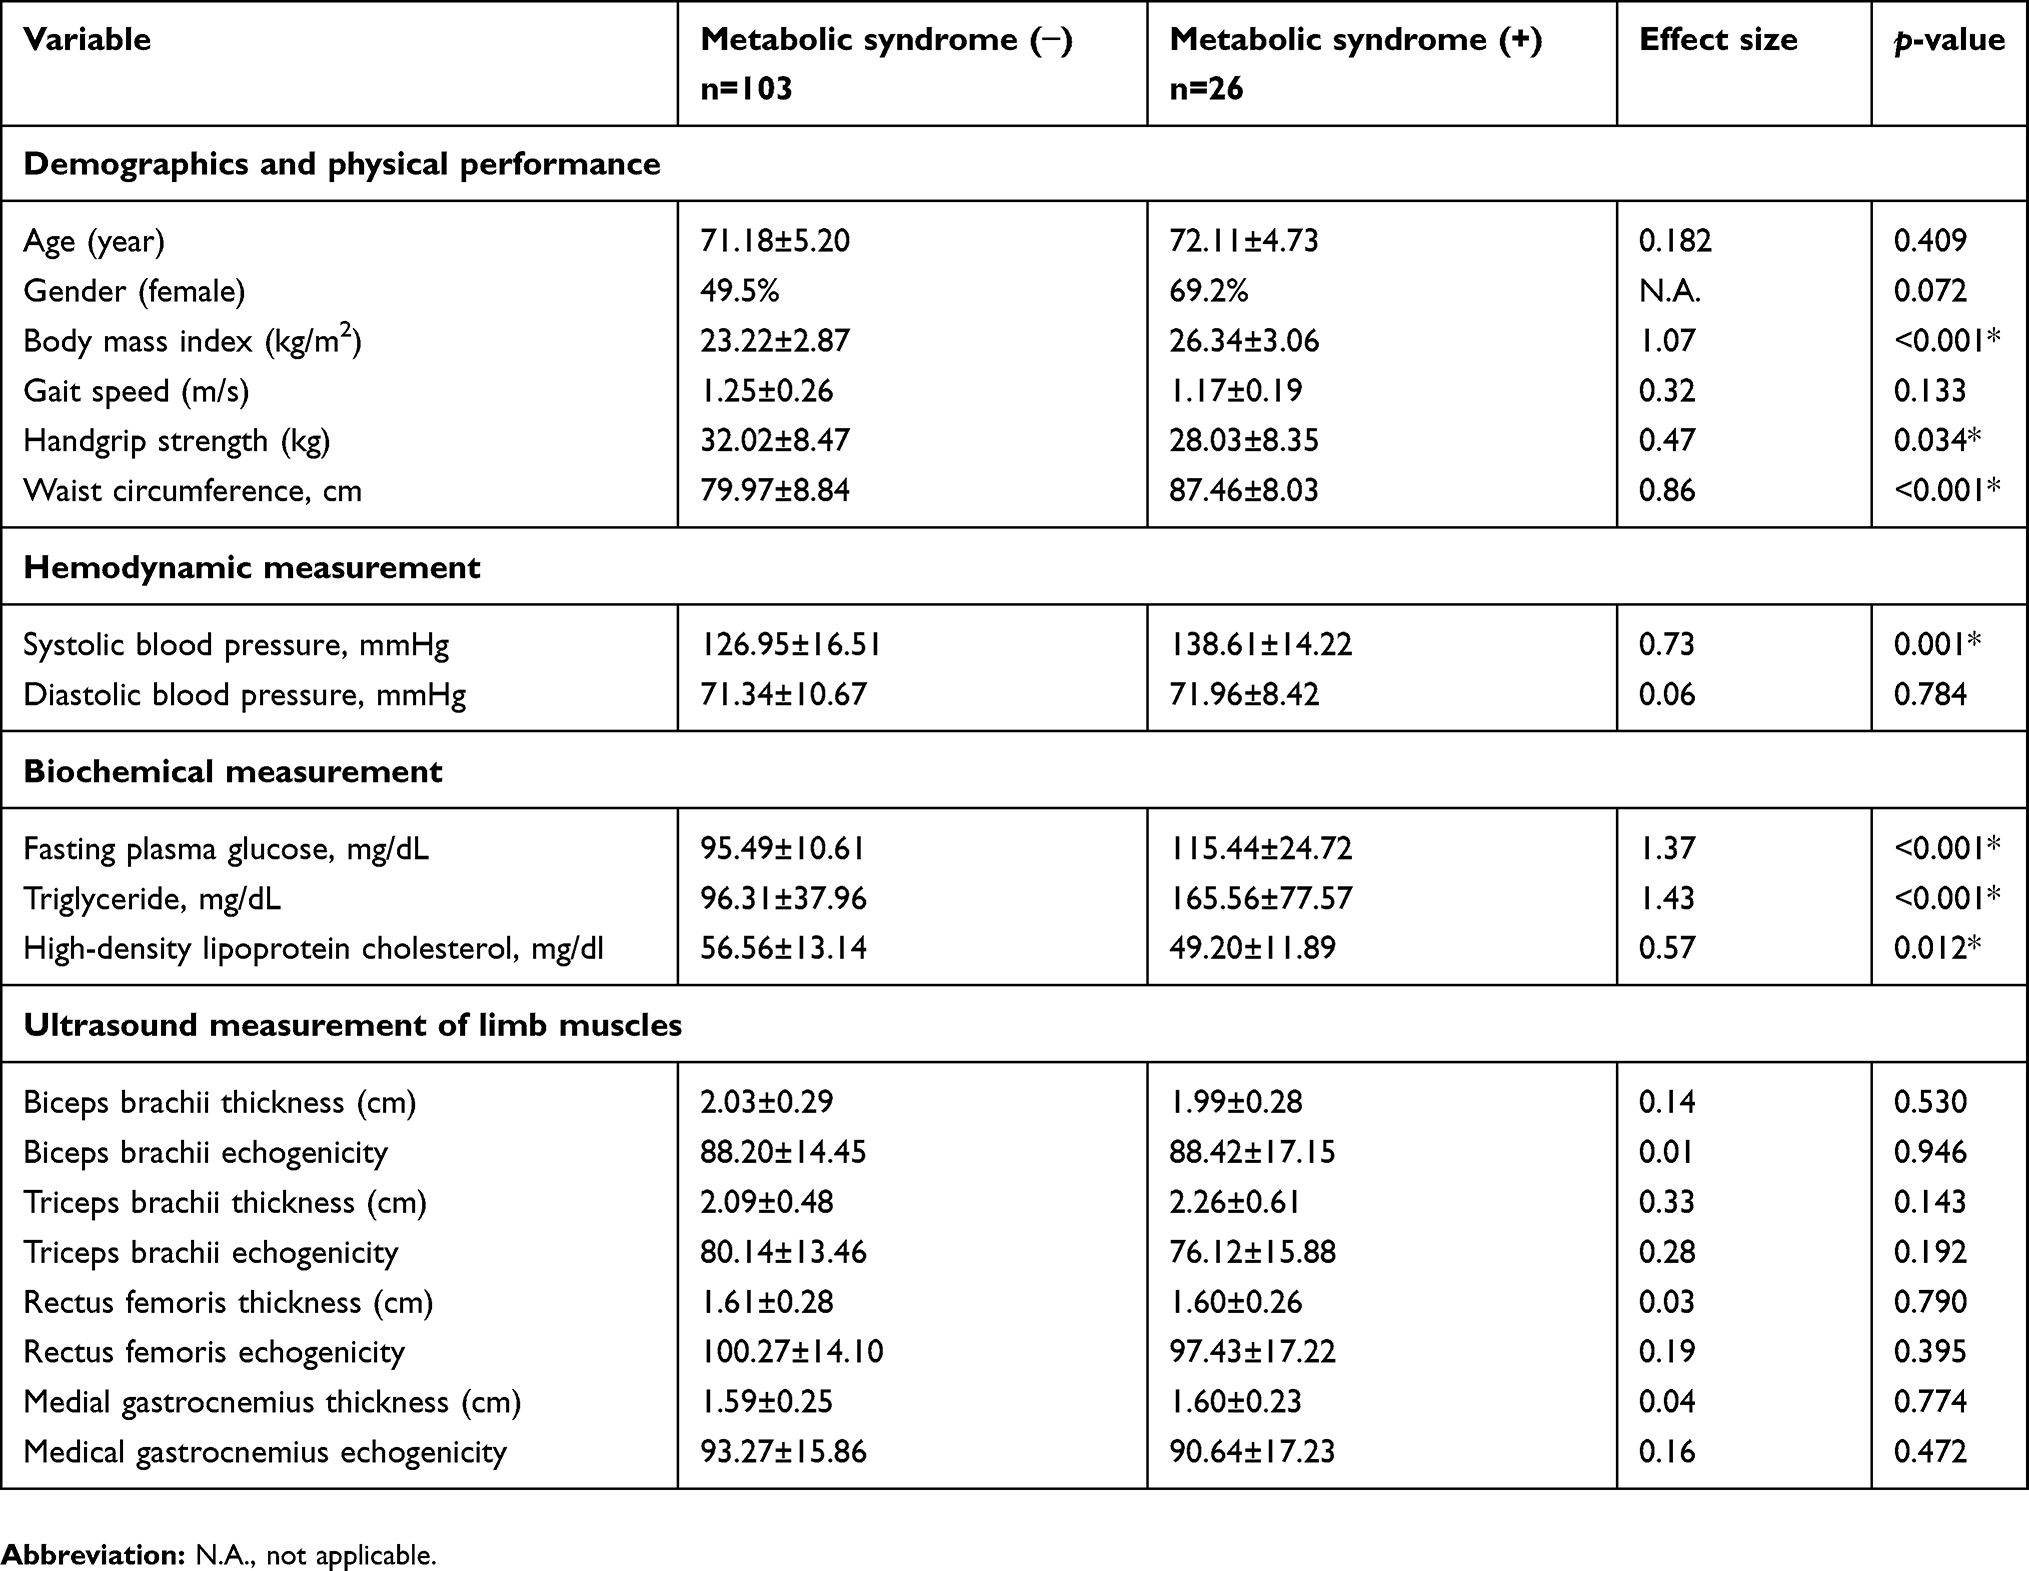 |
Table 1 Baseline characteristics and ultrasound measurement of limb muscles in elderly adults with or without metabolic syndrome |
 |
Figure 3 Univariate comparisons of the thickness of the biceps brachii (A) and triceps brachii (B) muscles and mean echogenicity of the biceps brachii (C) and triceps brachii (D) muscles between participants with and without metabolic syndrome (MetS). The columns labelled 0 indicate those without MetS, whereas the column labelled 1 indicate those with MetS. |
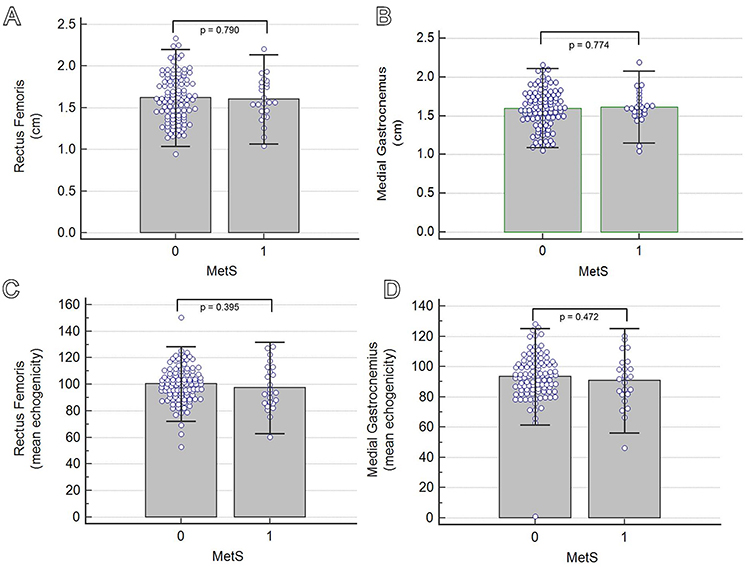 |
Figure 4 Univariate comparisons of the thickness of the rectus femoris (A) and medial gastrocnemius (B) muscles and mean echogenicity of the rectus femoris (C) and medial grastrocnemius (D) muscles between participants with and without metabolic syndrome (MetS). The columns labelled 0 indicate those without MetS, whereas the column labelled 1 indicate those with MetS. |
On univariate logistic regression analysis, the presence of MetS was associated with an increase in BMI (OR, 1.40; 95% CI, 1.19–1.65) and a decrease in handgrip strength (OR, 0.94; 95% CI, 0.89–0.99). Regarding multivariate logistic regression analysis, an increased risk of MetS was observed in participants with older age (OR, 1.15; 95% CI, 1.01–1.32), higher BMI (OR, 1.48; 95% CI, 1.18–1.85), and decreased echogenicity of triceps brachii muscle (OR, 0.93; 95% CI, 0.86–0.99) (Table 2). No significant association was identified between MetS and muscle ultrasound indicators of the other three muscles.
 |
Table 2 Association of metabolic syndrome and ultrasound measurements of limb muscles |
In terms of correlation analyses between ultrasound muscle indicators and parameters of body composition and physical performance, BMI was positively correlated with the thickness of the biceps brachii (r=0.310), triceps brachii (r=0.312), and rectus femoris (r=0.180) muscles. Gait speed was negatively correlated with mean echogenicity of the rectus femoris muscle (r=−0.178). Handgrip strength was positively correlated with the thickness of the biceps brachii (r=0.503), triceps brachii (r=0.204), and rectus femoris (r=0.323) muscles and was negatively associated with echogenicity of the three aforementioned muscles (Table 3).
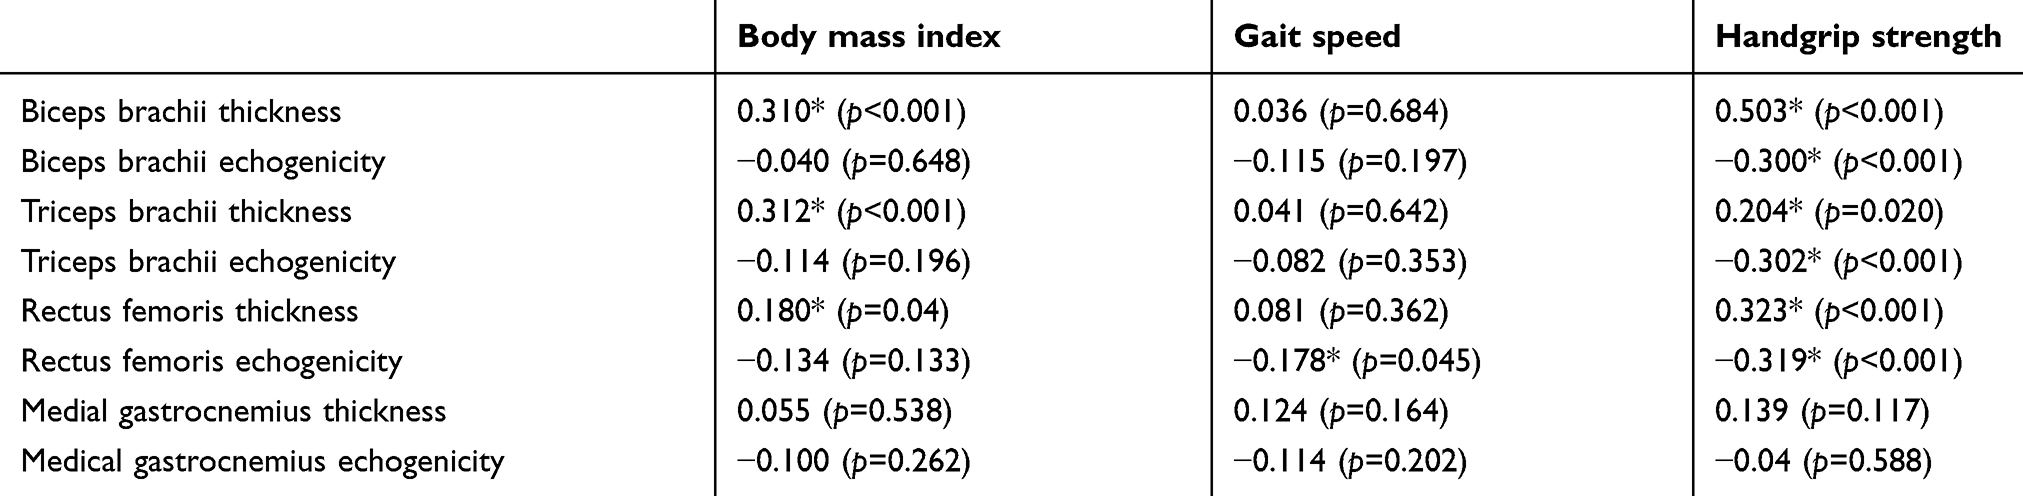 |
Table 3 Correlation coefficients of ultrasound muscle indicators with body mass index, gait speed and handgrip strength |
Discussion
The present study intended to explore limb muscle quantity and quality in participants with MetS. Although patients with MetS had higher BMI and lower handgrip strength, the difference in ultrasound muscle indicators was minimal compared to that in the controls. Despite a significant association between MetS and triceps muscle echogenicity on multivariable logistic analysis, the magnitude of interrelation was weak and could be mediated through the correlation of handgrip strength with most of the muscle ultrasound indicators.
The relationship between MetS and muscle volume loss has been elucidated in recent years. Kang et al investigated 4183 postmenopausal women by dual energy X-ray absorptiometry and found that sarcopenia obesity was associated with MetS.27 Ou et al conducted an anthropometric survey on 400 community-dwelling residents by employing bioelectrical impedance analysis and revealed an inverse association between MetS and muscle volume both in males and females.28 Ramírez-Vélez et al examined muscle fitness and anthropometry by using handgrip dynamometers and bioelectrical impedance analysis and showed that a lower muscle fitness to visceral fat ratio was related to an increased prevalence of MetS.29 Although high-resolution ultrasound is a valid imaging tool to assess the musculoskeletal system, whether it can identify any changes in limb muscles in patients with MetS would be of clinical interest. Furthermore, compared with dual energy X-ray absorptiometry and bioelectrical impedance analysis, ultrasound can be used to estimate the muscle volume by measurement of thickness and to evaluate its quality by quantification of echogenicity. In ultrasound imaging, healthy muscles have a hypoechoic background, whereas atrophic or fibrotic muscles appear as hyperechoic due to dehydration, fat infiltration, and increased connective tissues.30 Although magnetic resonance imaging is also capable of quantifying muscle mass and delineating their texture changes, the cost and portability are never comparable to those of ultrasound imaging.
Compared with healthy controls, patients with MetS did not have significant differences in limb muscle thickness and echogenicity in our study. In 2017, Choi et al used computed tomography to investigate the rectus abdominis muscle thickness in 798 males who attended health screening.31 They found that participants with MetS had thinner rectus abdominis muscles than those without MetS. As central obesity is a predominant feature of MetS,32 we speculated that trunk muscles would be affected more than extremity muscles, which led to an insignificant result in our observation.
Our finding of limb muscle quality could be also explained by a magnetic resonance imaging study that explored thigh muscles in 166 middle-aged and older adults.33 Bang et al found that intramuscular adipose tissue is associated with a higher risk of developing MetS, such as abdominal obesity and hyperglycemia but not hypertension and dyslipidemia.33 Therefore, the specific pattern of determining MetS in the patients may influence the outcome of limb muscle measurements, meaning that if the population has more patients diagnosed as having MetS based on hypertension and dyslipidemia rather than abdominal obesity and hyperglycemia, the analysis may yield a negative association between MetS and limb muscle assessment.
Our study also revealed that patients with MetS had lower grip strength than those without MetS. Our finding is consistent with a recent large-scale study that surveyed 17,703 people older than 40 years.10 Wu et al revealed an inverse association between hand grip strength and MetS as well as its separated components.10 The association remained significant after adjustment for sociodemographic variables, lifestyle factors, total energy intake, and family history of disease. A proposed mechanism is that neuroendocrine dysfunction affects skeletal muscles in patients with MetS, which leads to a decrease in strength and insulin metabolism.34 In terms of the relationship between grip strength and muscle ultrasound measurements, our analysis revealed that handgrip strength was positively correlated with thickness and negatively correlated with echogenicity of the biceps brachii, triceps brachii, and rectus femoris muscles. This finding indicates that handgrip strength as an assessment of muscle performance is for the whole body instead of upper extremities only. Our result also revealed that although limb muscle exhibited concomitant volume and texture changes with decreased handgrip strength, the difference between patients with MetS and those without MetS was still challenging to be recognized by ultrasound imaging.
A trivial association between MetS and triceps muscle echogenicity was identified by multivariate logistic regression analysis (Table 2). The association may be attributed to the multicollinearity of muscle ultrasound indicators with handgrip strength. As the association was insignificant by crude logistic regression analysis, we believed that the finding was not of clinical importance. Another tricky point is that triceps muscle echo intensity seemed to be inversely associated with MetS (adjusted OR: 0.93), which was against the current understanding of muscle echogenicity in patients with sarcopenia.17 A possible explanation would be a dilemma of echogenicity measurement in patients with obesity. An increase in subcutaneous fat,29 a typical presentation of MetS, causes substantial attenuation of ultrasound energy. Therefore, the underlying muscles may appear more hypoechoic than they actually are in patients with MetS.
Several limitations needed to be acknowledged in this study. First, there were few patients with MetS (n=26) in the present cohort. The number was too small to conduct separated analyses based on each risk component of MetS. Besides, there might be lack of statistical powers to examine the between-group difference of ultrasound muscle measurements. However, we partially compensate this by presenting the measurement of the effect size. Even a significant difference existed regarding ultrasound muscle measurement, the magnitude of differences was also small (all the effect size values were less than 0.5 in the study). Second, our study employed a cross-sectional design, which was not able to analyze whether the muscle ultrasound indicators changed as the disease severity progressed. Third, the present research targeted adults aged >65 years, and our results may not be applicable on young or middle-aged population. The insignificant result of our research could be due to the population we explored. The younger population may have different outcome. Fourth, regarding assessment of limb muscle quality, we did not use the ratio of echogenicity of the target muscle vs subcutaneous tissues. The main reason is that light contact with the skin was allowed in our study to ensure clear visualization of underlying muscles, which also caused deformation of the subcutaneous tissues. Fifth, we estimated the participants’ physical performance by measuring their gait speed and handgrip strength. However, we did not use a validated questionnaire to detail their activity profile, which should be included in future similar studies.
Conclusion
Muscle function decline was observed in older patients with MetS, shown as a decline in grip strength. Compared with healthy controls, no significant difference was recognized in limb muscle thickness and echogenicity by ultrasound imaging. However, the finding might be caused by the small sample size of our participants. Future large-scale studies should be conducted to explore the influence of separated risk factors of MetS on limb muscle echotexture as well as to examine whether the manifestation differs in a different age population.
Acknowledgment
We are grateful for the great efforts from Mrs. Shuling Liang for sorting the data of patients’ characteristics and ultrasound images. The study was made possible by (1) the research funding of National Taiwan University Hospital, Bei-Hu Branch (2) Taiwan Society of Ultrasound in Medicine and (3) Ministry of Science and Technology (MOST 107-2314-B-002 −047 -MY3, MOST 108-2321-B-001 −028 -MY2, MOST 108-2321-B-001 −005).
Disclosure
The authors report no conflicts of interest in this work.
References
1. Zafar U, Khaliq S, Ahmad HU, Manzoor S, Lone KP. Metabolic syndrome: an update on diagnostic criteria, pathogenesis, and genetic links. Hormones. 2018;17(3):299–313. doi:10.1007/s42000-018-0051-3
2. Lechleitner M. Obesity and the metabolic syndrome in the elderly–a mini-review. Gerontology. 2008;54(5):253–259. doi:10.1159/000161734
3. Carnethon MR, Loria CM, Hill JO, et al. Risk factors for the metabolic syndrome: the Coronary Artery Risk Development in Young Adults (CARDIA) study, 1985–2001. Diabetes Care. 2004;27(11):2707–2715. doi:10.2337/diacare.27.11.2707
4. Mesinovic J, McMillan LB, Shore-Lorenti C, De Courten B, Ebeling PR, Scott D. Metabolic syndrome and its associations with components of sarcopenia in overweight and obese older adults. J Clin Med. 2019;8(2):145. doi:10.3390/jcm8020145
5. Chang KV, Chen JD, Wu WT, Huang KC, Hsu CT, Han DS. Association between loss of skeletal muscle mass and mortality and tumor recurrence in hepatocellular carcinoma: a systematic review and meta-analysis. Liver Cancer. 2018;7(1):90–103. doi:10.1159/000484950
6. Chang KV, Hsu TH, Wu WT, Huang KC, Han DS. Association between sarcopenia and cognitive impairment: a systematic review and meta-analysis. J Am Med Dir Assoc. 2016;17(12):
7. Chang KV, Hsu TH, Wu WT, Huang KC, Han DS. Is sarcopenia associated with depression? A systematic review and meta-analysis of observational studies. Age Ageing. 2017;46(5):738–746. doi:10.1093/ageing/afx094
8. Beaudart C, Zaaria M, Pasleau F, Reginster JY, Bruyere O. Health outcomes of sarcopenia: a systematic review and meta-analysis. PLoS One. 2017;12(1):e0169548. doi:10.1371/journal.pone.0169548
9. Lim S, Kim JH, Yoon JW, et al. Sarcopenic obesity: prevalence and association with metabolic syndrome in the Korean Longitudinal Study on Health and Aging (KLoSHA). Diabetes Care. 2010;33(7):1652–1654. doi:10.2337/dc10-0107
10. Wu H, Liu M, Chi VTQ, et al. Handgrip strength is inversely associated with metabolic syndrome and its separate components in middle aged and older adults: a large-scale population-based study. Metabolism. 2019;93:61–67. doi:10.1016/j.metabol.2019.01.011
11. Yi DW, Khang AR, Lee HW, Son SM, Kang YH. Relative handgrip strength as a marker of metabolic syndrome: the Korea National Health and Nutrition Examination Survey (KNHANES) VI (2014–2015). Diabetes Metab Syndr Obes. 2018;11:227–240. doi:10.2147/DMSO.S166875
12. Byeon JY, Lee MK, Yu MS, et al. Lower relative handgrip strength is significantly associated with a higher prevalence of the metabolic syndrome in adults. Metab Syndr Relat Disord. 2019;17:280–288. doi:10.1089/met.2018.0111
13. Lawman HG, Troiano RP, Perna FM, Wang CY, Fryar CD, Ogden CL. Associations of relative handgrip strength and cardiovascular disease biomarkers in U.S. adults, 2011–2012. Am J Prev Med. 2016;50(6):677–683. doi:10.1016/j.amepre.2015.10.022
14. Chang KV, Wu WT, Han DS, Ozcakar L. Static and dynamic shoulder imaging to predict initial effectiveness and recurrence after ultrasound-guided subacromial corticosteroid injections. Arch Phys Med Rehabil. 2017;98(10):1984–1994. doi:10.1016/j.apmr.2017.01.022
15. Chang KV, Wu WT, Huang KC, Jan WH, Han DS. Limb muscle quality and quantity in elderly adults with dynapenia but not sarcopenia: an ultrasound imaging study. Exp Gerontol. 2018;108:54–61. doi:10.1016/j.exger.2018.03.019
16. Wu WT, Chang KV, Mezian K, Nanka O, Lin CP, Ozcakar L. Basis of shoulder nerve entrapment syndrome: an ultrasonographic study exploring factors influencing cross-sectional area of the suprascapular nerve. Front Neurol. 2018;9:902.
17. Yamada M, Kimura Y, Ishiyama D, et al. Differential characteristics of skeletal muscle in community-dwelling older adults. J Am Med Dir Assoc. 2017;18(9):
18. Kamel HK. Sarcopenia and aging. Nutr Rev. 2003;61(5 Pt 1):157–167. doi:10.1301/nr.2003.may.157-167
19. Expert Panel on Detection E, Treatment of High Blood Cholesterol in A. Executive summary of the third report of the National Cholesterol Education Program (NCEP) expert panel on detection, evaluation, and treatment of high blood cholesterol in adults (Adult Treatment Panel III). JAMA. 2001;285(19):2486–2497. doi:10.1001/jama.285.19.2486
20. Chang KV, Hung CY, Li CM, et al. Reduced flexibility associated with metabolic syndrome in community-dwelling elders. PLoS One. 2015;10(1):e0117167. doi:10.1371/journal.pone.0117167
21. Yang WS, Yang YC, Chen CL, et al. Adiponectin SNP276 is associated with obesity, the metabolic syndrome, and diabetes in the elderly. Am J Clin Nutr. 2007;86(2):509–513. doi:10.1093/ajcn/86.2.509
22. Han DS, Chang KV, Li CM, et al. Skeletal muscle mass adjusted by height correlated better with muscular functions than that adjusted by body weight in defining sarcopenia. Sci Rep. 2016;6:19457. doi:10.1038/srep19457
23. Wilson CM, Kostsuca SR, Boura JA. Utilization of a 5-meter walk test in evaluating self-selected gait speed during preoperative screening of patients scheduled for cardiac surgery. Cardiopulm Phys Ther J. 2013;24(3):36–43.
24. Abu-Zidan FM, Hefny AF, Corr P. Clinical ultrasound physics. J Emerg Trauma Shock. 2011;4(4):501–503. doi:10.4103/0974-2700.86646
25. Mayans D, Cartwright MS, Walker FO. Neuromuscular ultrasonography: quantifying muscle and nerve measurements. Phys Med Rehabil Clin N Am. 2012;23(1):133–148, xii. doi:10.1016/j.pmr.2011.11.009
26. Koppenhaver SL, Hebert JJ, Fritz JM, Parent EC, Teyhen DS, Magel JS. Reliability of rehabilitative ultrasound imaging of the transversus abdominis and lumbar multifidus muscles. Arch Phys Med Rehabil. 2009;90(1):87–94. doi:10.1016/j.apmr.2008.06.022
27. Kang SY, Lim GE, Kim YK, et al. Association between sarcopenic obesity and metabolic syndrome in postmenopausal women: a cross-sectional study based on the Korean National Health and Nutritional Examination Surveys from 2008 to 2011. J Bone Metab. 2017;24(1):9–14. doi:10.11005/jbm.2017.24.1.9
28. Ou YC, Chuang HH, Li WC, Tzeng IS, Chen JY. Gender difference in the association between lower muscle mass and metabolic syndrome independent of insulin resistance in a middle-aged and elderly Taiwanese population. Arch Gerontol Geriatr. 2017;72:12–18. doi:10.1016/j.archger.2017.04.006
29. Ramirez-Velez R, Carrillo HA, Correa-Bautista JE, et al. Fat-to-muscle ratio: a new anthropometric indicator as a screening tool for metabolic syndrome in young colombian people. Nutrients. 2018;10(8):1027.
30. Ismail C, Zabal J, Hernandez HJ, et al. Diagnostic ultrasound estimates of muscle mass and muscle quality discriminate between women with and without sarcopenia. Front Physiol. 2015;6:302. doi:10.3389/fphys.2015.00098
31. Choi ES, Cho SH, Kim JH. Relationship between rectus abdominis muscle thickness and metabolic syndrome in middle-aged men. PLoS One. 2017;12(9):e0185040. doi:10.1371/journal.pone.0185040
32. Despres JP, Lemieux I. Abdominal obesity and metabolic syndrome. Nature. 2006;444(7121):881–887. doi:10.1038/nature05488
33. Bang E, Tanabe K, Yokoyama N, Chijiki S, Kuno S. Relationship between thigh intermuscular adipose tissue accumulation and number of metabolic syndrome risk factors in middle-aged and older Japanese adults. Exp Gerontol. 2016;79:26–30. doi:10.1016/j.exger.2016.03.010
34. Abdul-Ghani MA, DeFronzo RA. Pathogenesis of insulin resistance in skeletal muscle. J Biomed Biotechnol. 2010;2010:476279. doi:10.1155/2010/476279
 © 2019 The Author(s). This work is published and licensed by Dove Medical Press Limited. The full terms of this license are available at https://www.dovepress.com/terms.php and incorporate the Creative Commons Attribution - Non Commercial (unported, v3.0) License.
By accessing the work you hereby accept the Terms. Non-commercial uses of the work are permitted without any further permission from Dove Medical Press Limited, provided the work is properly attributed. For permission for commercial use of this work, please see paragraphs 4.2 and 5 of our Terms.
© 2019 The Author(s). This work is published and licensed by Dove Medical Press Limited. The full terms of this license are available at https://www.dovepress.com/terms.php and incorporate the Creative Commons Attribution - Non Commercial (unported, v3.0) License.
By accessing the work you hereby accept the Terms. Non-commercial uses of the work are permitted without any further permission from Dove Medical Press Limited, provided the work is properly attributed. For permission for commercial use of this work, please see paragraphs 4.2 and 5 of our Terms.