")
Back to Archived Journals » Research and Reports in Endocrine Disorders » Volume 6
Association between the biochemical profiles in blood and bone mineral density in Chinese Han population: findings from a cross-sectional study
Authors Chen HX, Wu LB, Meng ZJ
Received 29 October 2015
Accepted for publication 5 May 2016
Published 3 November 2016 Volume 2016:6 Pages 59—64
DOI https://doi.org/10.2147/RRED.S99437
Checked for plagiarism Yes
Review by Single anonymous peer review
Peer reviewer comments 2
Editor who approved publication: Professor Mingzhao Xing
Hong-Xia Chen,1,2,* Li-Bing Wu,3,* Zhong-Ji Meng1
1Institute of Biomedicine, Taihe Hospital, Hubei University of Medicine, Shiyan, Hubei Province, People’s Republic of China; 2Department of Environmental, Agricultural, & Occupational Health, College of Public Health, University of Nebraska Medical Center, Omaha, NE, USA; 3Department of Nuclear Medicine, Taihe Hospital, Hubei University of Medicine, Shiyan, Hubei Province, People’s Republic of China
*These authors contributed equally to this work.
Abstract: This study investigated the possible correlation between blood biochemical profiles and bone mineral density (BMD) in the Chinese Han population. We conducted a cross-sectional analysis using participants randomly selected from the Health Screening Center of Taihe Hospital, Hubei University of Medicine, which included a total of 285 individuals, varied in ages from 31 years to 63 years. The height, weight, and body mass index (BMI) of each subject were measured, as well as fasting blood glucose (FBG), triglycerides, total cholesterol, blood uric acid (UA), blood urea nitrogen, and blood creatinine. We evaluated BMD at the wrist (grams per centimeter square) using a dual-energy X-ray absorptiometry scan. The mean ages of female and male groups were 45.32±8.24 years and 46.76±9.01 years, respectively. The mean age of the study population was 46.14±8.79 years, which is similar to the general population. The mean BMI values were 22.08±2.38 kg/m2 and 24.50±2.67 kg/m2 in the female and male population, respectively, representing a statistically significant difference (P<0.05). No significant differences in levels of FBG total cholesterol, or triglycerides were seen among the male and female population. Multiple linear regression analysis was performed using BMD as outcome variables and BMI, blood UA, FBG, total cholesterol, triglycerides, urea nitrogen, and blood creatinine as covariates, and the regression equation was established as Y=0.00017X1+0.001066X2+0.010017X3+0.168251. Positive correlation was identified between BMD and FBG and BMI and blood UA, suggesting that lipid metabolism imbalance might have neither positive nor negative effect on BMD. There might be an association between UA and BMD (P<0.05). In conclusion, these findings suggested that weak positive correlations existed between BMI and FBG and blood UA and BMD in this middle-aged Chinese Han population.
Keywords: bone mass density, body mass index, blood uric acid, Chinese Han population
Introduction
The prevalence of diabetes is steadily rising, affecting ~114 million individuals in the People’s Republic of China, accounting for the world’s biggest diabetes epidemic, and it continues to get worse.1 Previous studies have reported that there is a positive correlation between bone mineral density (BMD) and glycated hemoglobin, even after controlling for body weight, indicating that elevated bone mass could be a consequence of poor glycemic control.2,3 The mechanisms underlying these associations are unclear. Obesity is associated with insulin resistance and hyperinsulinemia,4 which might contribute to associated increments in bone mass.5
Emerging evidence points to a critical role for the skeleton in several homeostatic processes, including energy balance. Mature bone cells secrete factors that influence insulin sensitivity, and fat cells synthesize cytokines that regulate osteoblast differentiation; thus, these two pathways are closely linked.6 There has also been a growing awareness that bone remodeling requires an energy source and is intimately linked to other homeostatic pathways. Changes in glucose and fat metabolism severely impact upon skeletal health. Risk factors related to low BMD in Asian adults are not clearly understood. Some research findings showed that lower blood uric acid (UA) levels were notable risk factors of BMD loss.7,8 Whether higher blood UA has protective effects on bone health is uncertain.9 More comprehensive studies are required to understand the paradox between bone loss and blood biochemical profiles. To our knowledge, no previous study has examined the association of blood biochemical profiles related to glucose and fat metabolism and oxidative status with bone mass in general populations and explored whether any association then explains (mediates) the association of fat mass and oxidant status with bone mass in middle-aged adults. To determine the risk factors of osteoporosis, we examined the relationships between BMD and those variables that may influence bone mass in the healthy middle-aged Chinese Han population.
Subjects and methods
Study population
A total of 285 participants were randomly selected from subjects who visited the Health Promotion Center at Taihe Hospital, Shiyan, People’s Republic of China, for a medical checkup in the 12-month period from 2013 to 2014. Those with diabetes mellitus, hyperthyroidism, pituitary disease, hypogonadism, chronic liver disease, or chronic renal disease; those receiving medication likely to affect bone metabolism, such as steroids, diuretics, and calcium supplements; and those with a past history of osteoporotic fracture were excluded. The study protocol was approved by the Institutional Review Board of Taihe Hospital, and written informed consent was obtained from all participants.
Anthropometric assessment
The height and weight of all participants were measured using a balance scale (Detecto, Webb City, MO, USA) on their very first visit, and the body mass index (BMI) was calculated by dividing the body weight (kilogram) by the height (meter square). Personal data were collected using questionnaires and by individual interviews, and medical and smoking histories were recorded by the participants themselves. A smoker was defined as a current smoker irrespective of the amount, and a drinker was defined as one drinking more than once a week irrespective of the type of drink.10 Participants were stratified in this manner to closely emulate the BMI cutoffs set for Asian population.11 The Asian cutoffs are as follows: 1) underweight if BMI <17.50 kg/m2, 2) normal weight if 17.50 kg/m2 < BMI ≤22.99 kg/m2, and 3) overweight if 23.00 kg/m2 < BMI ≤27.99kg/m2.
Assessment of fasting glucose, blood UA, and lipids
Fasting blood glucose, UA, urea nitrogen, creatinine, triglycerides (TG), and total cholesterol (TC) were measured using venous blood samples taken after an overnight fast. Blood samples were immediately spun and frozen at -80°C. Measurements were assayed shortly (3–9 months) after samples were taken with no previous freeze-thaw cycles. Blood UA was measured by an automatic biochemical analyzer (Mercodia, Uppsala, Sweden) using the method of peroxidase and plasma glucose (glucose oxidase method), and plasma lipids (TC analyzed by CHOD-PAP method and TG analyzed by GPO-PAP method) were measured by an automated enzymatic assay. Urea nitrogen and blood creatinine were determined by urease–glutamate dehydrogenase and picric acid methods, respectively, which were detected using the automatic biochemical analyzer. Intra-assay and inter-assay coefficients of variation were 1.0% and 1.3%, respectively, for UA; 1.6% and 0.9%, respectively, for fasting blood glucose (FBG);, 2.7% and 2.6%, respectively, for TC, and 4.4% and 3.3%, respectively, for TG.
BMD assessment
During participants’ first visit, BMD of the wrist was measured by dual-energy X-ray absorptiometry (QDR-4500A; Hologic, Bedford, MA, USA) with the coefficient of variation of 1.0%. Osteoporosis (OP) was defined as a T score <-2.5 in either the lumbar spine or the femoral neck according to the World Health Organization criteria. Due to the limitation of the instrument, we only measured the BMD values of the participants’ wrists. The T score for the wrist was calculated according to the standardized BMD records of Chinese healthy adults, which are normally distributed. Intraassay and interassay coefficients of variation of BMD were 2.3% and 2.7%. BMD results were classified into three groups according to World Health Organization criteria12 (normal BMD, T score ≥-1; osteopenia, -2.5< T score <-1; and osteoporosis, T score ≤-2.5).
Statistical analysis
The SPSS program (Version 10.0) for Windows (SPSS Inc., Chicago, IL, USA) was used for statistical analyses. Values for results are given as mean ± SD. Correlation analyses were performed using the Pearson correlation test. Comparison of mean values between groups was performed using the analysis of variance test and post hoc analysis. For categorical data, the test was used for the difference of distribution between groups. Multiple regression analyses were used to quantify the predictors of wrist BMD. Variables that showed significance on univariate analysis were included as independent variables in the regression model, and the final regression model was selected by step-wise selection. Variables with a significance value of <0.05 were included, and variables with a significance value of >0.1 were excluded in the final model.
Results
Basic demographic characteristics of subjects
Characteristics of the subjects are presented in Table 1. The majority of subjects were male and the male:female ratio was 1.7:1. The mean and standard deviation values of BMI and BMD were 23.6±2.8 kg/m2 and 0.5±0.1 g/cm2, respectively. Levels of blood UA, FBG, TC, TG, blood urea nitrogen, and blood creatinine were 331±83 μmol/L, 5.9±1.3 mmol/L, 5.0±1.0 IU/L, 1.6±1.2 mmol/L, 4.1±1.0 μmol/L, and 79.9±14.5 μmol/L, respectively. For age-matched subjects not included in this analysis, participants in the current study, on average, had higher BMI, higher blood FBG, and higher blood TG concentrations at the age of 46.1±8.8 years. The subjects enrolled in this study were more likely to develop type 2 diabetes and were more likely to have a sedentary lifestyle (professional characteristic [dynamic/sedentary] 0.6). Furthermore, the majority of the participants have a history of drinking, but fewer have a history of smoking. In this study, the definition of “often” is classified when the frequency of the action exceeds three times in 1 week; when the frequency is <2, named “occasionally”; when people have moderate physical activity more than three times in 1 week, named “dynamic, otherwise, named “sedentary lifestyle”.
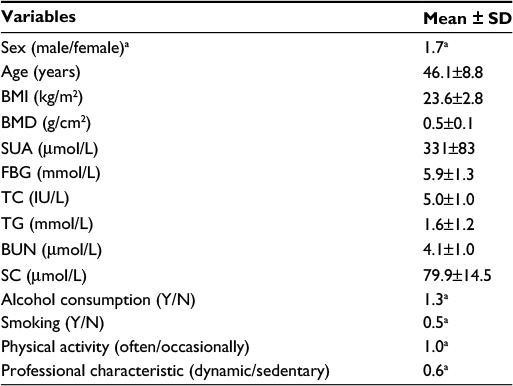 | Table 1 Basic demographic characteristics of subjects enrolled in the study (n=285) Note: aCategorical data, expressed as ratio. Abbreviations: BMD, bone mineral density; BMI, body mass index; BUN, blood urea nitrogen; FBG, fasting blood glucose; N, no; SC, blood creatinine; SUA, blood uric acid; TC, total cholesterol; TG, triglycerides; Y, yes. |
Comparison of the anthropometry measurements and blood biochemical profiles
Table 2 shows the comparison of the anthropometry measurements and blood biochemical profiles between male and female groups. There was no significant difference in terms of age, FBG, TG, TC, and urea nitrogen levels between male and female groups (P>0.05); on the other hand, notably significant differences in the BMD values, blood creatinine, and blood UA levels were observed between the groups (P<0.05). Obviously, there were big differences in drinking, smoking habits, and profession compositions between male and female groups (P<0.05), whereas no difference was observed in terms of physical activity (P>0.05).
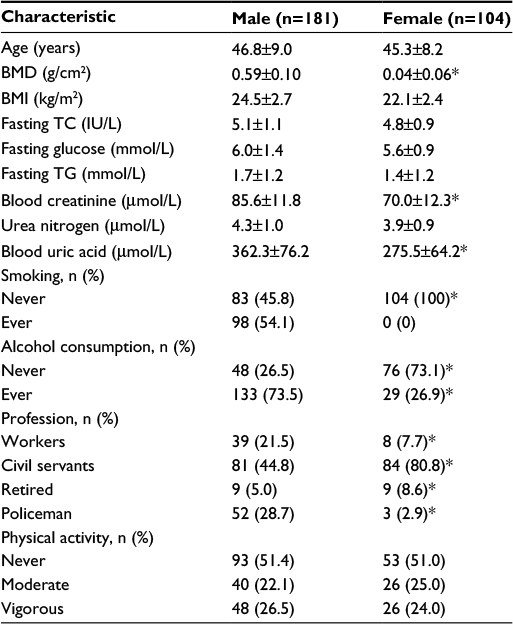 | Table 2 Comparison of the anthropometry measurements and blood biochemical profiles between male and female groups (n=285) Note: *Compared with male groups, P<0.05. Data presented as mean±SD or n (%). Abbreviations: BMD, bone mineral density; BMI, body mass index; TC, total cholesterol; TG, triglycerides. |
Correlation between BMD and blood biochemical profiles
The values of BMD represent normal distribution. Using multiple linear regression analyzed by BMI, blood UA, blood glucose, TC, TG, urea nitrogen, and blood creatinine, the regression equation was established as
Y=0.00017X1+0.001066X2+0.010017X3+0.168251 (1)
by step-wise regression analysis (included three factors: BMI, blood creatinine, and UA). In the equation, blood UA is expressed as X1, blood creatinine is expressed as X2, BMI is expressed as X3, and R2 value is 0.232. The equation is meaningful (F=25.339, P<0.0001), and each factor is also significant. Results are shown in Tables 3–5.
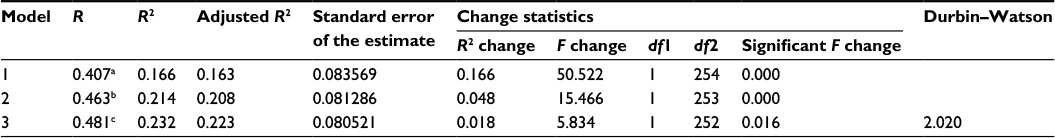 | Table 3 Correlation between BMD and biochemical profiles in the blood of subjects Notes: aPredictors: (constant) and BMI. bPredictors: (constant), BMI, and blood creatinine (40–120 μmol/L). cPredictors: (constant), BMI, blood creatinine (40–120 μmol/L), and blood uric acid (208–428 μmol/L). Abbreviations: BMD, bone mineral density; BMI, body mass index; df, degree of freedom. |
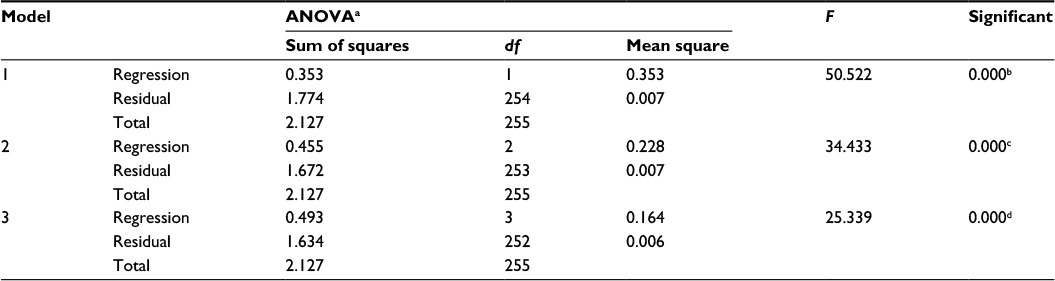 | Table 4 Analysis of variance between BMD, BMI, blood uric acid and blood creatinine Notes: aDependent variable: BMD. bPredictors: (constant) and BMI. cPredictors: (constant), BMI, and blood creatinine (40–120 μmol/L). dPredictors: (constant), BMI, blood creatinine (40–120 μmol/L), and blood uric acid (208–428 μmol/L). Abbreviations: ANOVA, analysis of variance; BMD, bone mineral density; BMI, body mass index; df, degree of freedom. |
 | Table 5 Multivariable linear regression analysis between BMD and blood profiles Note: aDependent variable: BMD. Abbreviation: BMD, bone mineral density; BMI, body mass index. |
Discussion
The present study was designed to assess the association between blood BMD and biochemical parameters including UA, fasting lipids, fasting glucose, urea nitrogen, and creatinine. In the previous study, the results showed that inflammation (hsCRP) was highest in those patients with lowest BMD, which revealed an association between bone metabolism and systemic inflammation, which is the main characteristic of obesity,5 whereas, in the clinic settings, the key issues are that obesity is protective against OP and underweight is a major preventable risk factor for fractures.13 It is well known that higher BMI and higher FBG levels are high-risk factors for developing type 2 diabetes, which have close correlation with systemic inflammation. In this study, we found that BMI and FBG within the normal range have positive association with bone mineral density, which indicates the relevance between bone metabolism and systemic inflammation in the middle-aged Han population in the People’s Republic of China.
In the current study, 33.7% of individuals who were classified as underweight (underweight if BMI <17.5 kg/m2) also had low wrist BMD (data not shown). As far as we know, weight was a significant predictor of wrist BMD, which is consistent with previous studies.14,15
The association between lipid and bone metabolism has become an increasing focus of interest all over the world in recent years, and accumulating evidence has shown that atherosclerosis and OP, a disorder of bone metabolism, frequently coexist. A previous study showed that diabetes-specific parameters did not predict BMD.16 Plasma lipid parameters in this study, including TC and TG, have no positive or negative correlation with BMD, which confirms that the lipid metabolism imbalance might have no impact on bone metabolism in this study. On the contrary, laboratory-based and clinical trials have shown that increasing adipocytes are accompanied by a decrease in BMD and bone mass.17 These inconsistencies might be due to the different parameters that we chose to evaluate lipid metabolism.
Recently, oxidative stress or low circulating levels of antioxidants were proposed to be interrelated with reduced BMD and caused OP in animals and in vitro studies.18,19 In humans, UA is the final oxidation product of purine catabolism. The blood UA level is based on the balance between the absorption, production, and excretion of purine. UA is similarly produced in the liver, adipose tissue, and muscle and is primarily excreted through the urinary tract. Several factors, including a high-fructose diet and the use of xenobiotics and alcohol, contribute to hyperuricemia. UA is a kind of endogenous, water-soluble antioxidant and a by-product of purine metabolism and a major natural antioxidant in plasma that reduces oxidative stress and protects against free radicals. In this study, we found that higher blood levels of UA are associated with higher BMDs in this Chinese population. There is a well-recognized epidemiological link between higher levels of UA and decreased risk of bone loss,7,9 which confirms the findings in this study that higher UA levels decrease the risk of BMD loss and might prevent OP in susceptible population aged >30 years. Many biochemistry studies provide evidence that UA might increase the risk for hepatic fat accumulation and hepatic glucose production.6 Some human studies20 have shown that high UA levels regulate oxidative stress, inflammation, and enzymes associated with glucose and lipid metabolism, suggesting a mechanism for the impairment of metabolic homeostasis. Further studies are necessary to confirm the observed relationship in this study.
OP is an important health problem and a major predisposing factor for fracture. As a population ages, the prevalence of OP gets higher, and the social burden increases. There is an urgent need for strong action now to stop millions of Chinese males and females dying in their most productive years from diseases that can be prevented simply by changing common unhealthy lifestyle habits, such as smoking, excessive alcohol consumption, unhealthy diet, and not enough physical activity. Investigating the factors that influence the occurrence of OP is of paramount importance. Some of them were modifiable factors, such as smoking, alcohol consumption, low calcium intake, and sedentary lifestyle. A previous study21 has shown that sedentary lifestyle is one of the major risk factors that might induce development of fractures or BMD loss, which was confirmed in this study. This cross-sectional study was conducted on urban residents, who may have abundant calcium intake at the baseline. It is well known that the abundant intake of calcium has a protective effect on the bone loss, which can overcome bone loss induced by insufficient intake of dietary calcium, due to regional differences. Taken together, our data supported the hypothesis that higher blood UA has a protective effect on bone health.
Strengths and limitations
Strengths
We used data from a well-characterized general population study with fasting levels of glucose and lipids and BMD. Our cross-sectional findings of the association of BMI, blood UA, and blood creatinine with BMD in this study are consistent with the causal findings from trials.22,23 To our knowledge, no study to date has examined these associations prospectively, but we intend to further explore our findings in prospective cohort studies, and clinical randomization control studies are warranted.
Limitation
Our analyses are cross-sectional and, therefore, cannot establish the casual relationship between covariates and BMD. Measurement of BMD at the lumbar spine and femoral neck will contribute to a better evaluation of bone loss. In addition, there are many other factors that should be assessed, such as dietary intake, vitamin D supplementation, and other nutritional supplements, which might have some impact on the values of BMD.
Acknowledgment
This work was supported by the Research Grant from Shiyan Taihe Hospital, Hubei University of Medicine grant (no 2014PY04).
Disclosure
The authors report no conflicts of interest in this work.
References
Tian Y, Jiang C, Wang M, et al. BMI, leisure-time physical activity, and physical fitness in adults in China: results from a series of national surveys, 2000-14. Lancet Diabetes Endocrinol. 2016;4(6):487–497. | ||
Oei L, Zillikens MC, Dehghan A, et al. High bone mineral density and fracture risk in type 2 diabetes as skeletal complications of inadequate glucose control: the Rotterdam Study. Diabetes Care. 2013;36(6):1619–1628. | ||
Ma L, Oei L, Jiang L, et al. Association between bone mineral density and type 2 diabetes mellitus: a meta-analysis of observational studies. Eur J Epidemiol. 2012;27(5):319–332. | ||
Lawlor DA, Benfield L, Logue J, et al. Association between general and central adiposity in childhood, and change in these, with cardiovascular risk factors in adolescence: prospective cohort study. BMJ. 2010;341:c6224. | ||
Reid IR. Relationships between fat and bone. Osteoporos Int. 2008;19(5):595–606. | ||
Kawai M, Devlin MJ, Rosen CJ. Fat targets for skeletal health. Nat Rev Rheumatol. 2009;5(7):365–372. | ||
Kim S, Jung J, Jung JH, Kim SK, Kim RB, Hahm JR. Risk factors of bone mass loss at the lumbar spine: a longitudinal study in healthy Korean pre- and perimenopausal women older than 40 years. PLoS One. 2015;10(8):e0136283. | ||
Lytvyn Y, Perkins BA, Cherney DZ. Uric acid as a biomarker and a therapeutic target in diabetes. Can J Diabetes. 2015;39(3):239–246. | ||
Chen L, Peng Y, Fang F, Chen J, Pan L, You L. Correlation of blood uric acid with bone mineral density and fragility fracture in patients with primary osteoporosis: a single-center retrospective study of 253 cases. Int J Clin Exp Med. 2015;8(4):6291–6294. | ||
McMurry KY. Setting dietary guidelines: the US process. J Am Diet Assoc. 2003;103(12 suppl 2):S10–S16. | ||
Misra A, Chowbey P, Makkar BM, et al; Concensus Group. Consensus statement for diagnosis of obesity, abdominal obesity and the metabolic syndrome for Asian Indians and recommendations for physical activity, medical and surgical management. J Assoc Physicians India. 2009;57:163–170. | ||
World Health Organization [webpage on the Internet]. BMI classification. 2008. Available from: http://apps.who.int/bmi/index.jsp?introPage=intro_3.html. Accessed May 27, 2016. | ||
Reid IR. Fat and bone. Arch Biochem Biophys. 2010;503(1):20–27. | ||
Rollins D, Imrhan V, Czajka-Narins DM, Nichols DL. Lower bone mass detected at femoral neck and lumbar spine in lower-weight versus normal-weight small-boned women. J Am Diet Assoc. 2003;103(6):742–744. | ||
Wang MC, Bachrach LK, Van Loan M, Hudes M, Flegal KM, Crawford PB. The relative contributions of lean tissue mass and fat mass to bone density in young women. Bone. 2005;37(4):474–481. | ||
Leidig-Bruckner G, Grobholz S, Bruckner T, Scheidt-Nave C, Nawroth P, Schneider JG. Prevalence and determinants of osteoporosis in patients with type 1 and type 2 diabetes mellitus. BMC Endocr Disord. 2014;14:33. | ||
Tian L, Yu X. Lipid metabolism disorders and bone dysfunction – interrelated and mutually regulated. Mol Med Rep. 2015;12(1):783–794. | ||
Sharma T, Islam N, Ahmad J, Akhtar N, Beg M. Correlation between bone mineral density and oxidative stress in postmenopausal women. Indian J Endocrinol Metab. 2015;19(4):491–497. | ||
Lee YJ, Hong JY, Kim SC, Joo JK, Na YJ, Lee KS. The association between oxidative stress and bone mineral density according to menopausal status of Korean women. Obstet Gynecol Sci. 2015;58(1):46–52. | ||
Shanbhogue VV, Mitchell DM, Rosen CJ, Bouxsein ML. Type 2 diabetes and the skeleton: new insights into sweet bones. Lancet Diabetes Endocrinol. 2016;4(2):159–173. | ||
Chen Z, Maricic M, Bassford TL, et al. Fracture risk among breast cancer survivors: results from the Women’s Health Initiative Observational Study. Arch Intern Med. 2005;165(5):552–558. | ||
Duggan SN, Purcell C, Kilbane M, et al. An association between abnormal bone turnover, systemic inflammation, and osteoporosis in patients with chronic pancreatitis: a case-matched study. Am J Gastroenterol. 2015;110(2):336–345. | ||
Levy-Marchal C, Arslanian S, Cutfield W, et al; ESPE-LWPES-ISPAD-APPES-APEG-SLEP-JSPE, Insulin Resistance in Children Consensus Conference Group. Insulin resistance in children: consensus, perspective, and future directions. J Clin Endocrinol Metab. 2010;95(12):5189–5198. |
 © 2016 The Author(s). This work is published and licensed by Dove Medical Press Limited. The full terms of this license are available at https://www.dovepress.com/terms.php and incorporate the Creative Commons Attribution - Non Commercial (unported, v3.0) License.
By accessing the work you hereby accept the Terms. Non-commercial uses of the work are permitted without any further permission from Dove Medical Press Limited, provided the work is properly attributed. For permission for commercial use of this work, please see paragraphs 4.2 and 5 of our Terms.
© 2016 The Author(s). This work is published and licensed by Dove Medical Press Limited. The full terms of this license are available at https://www.dovepress.com/terms.php and incorporate the Creative Commons Attribution - Non Commercial (unported, v3.0) License.
By accessing the work you hereby accept the Terms. Non-commercial uses of the work are permitted without any further permission from Dove Medical Press Limited, provided the work is properly attributed. For permission for commercial use of this work, please see paragraphs 4.2 and 5 of our Terms.