")
Back to Journals » Diabetes, Metabolic Syndrome and Obesity » Volume 17
APAF1 Silencing Ameliorates Diabetic Retinopathy by Suppressing Inflammation, Oxidative Stress, and Caspase-3/GSDME-Dependent Pyroptosis
Authors Ding Y, Chen L, Xu J, Feng Y, Liu Q
Received 22 November 2023
Accepted for publication 22 March 2024
Published 10 April 2024 Volume 2024:17 Pages 1635—1649
DOI https://doi.org/10.2147/DMSO.S449049
Checked for plagiarism Yes
Review by Single anonymous peer review
Peer reviewer comments 3
Editor who approved publication: Dr Konstantinos Tziomalos
Yuanyuan Ding,* Linjiang Chen,* Jing Xu, Yuhan Feng, Qiong Liu
Department of Ophthalmology, Nanfang Hospital, Southern Medical University, Guangzhou, Guangdong Province, People’s Republic of China
*These authors contributed equally to this work
Correspondence: Qiong Liu, Department of Ophthalmology, Nanfang Hospital, Southern Medical University, No. 1838, North Guangzhou Avenue, Baiyun District, Guangzhou, Guangdong Province, 510515, People’s Republic of China, Tel +86-13922442109, Email [email protected]
Objective: Diabetic retinopathy (DR) can cause permanent blindness with unstated pathogenesis. We aim to find novel biomarkers and explore the mechanism of apoptotic protease activating factor 1 (APAF1) in DR.
Methods: Differential expression genes (DEGs) were screened based on GSE60436 dataset to find hub genes involved in pyroptosis after comprehensive bioinformatics analysis. DR mice model was constructed by streptozotocin injection. The pathological structure of retina was observed using hematoxylin-eosin staining. The enzyme-linked immunosorbent assay was applied to assess inflammatory factors, vascular endothelial growth factor (VEGF), and oxidative stress. The mRNA and protein expression levels were detected using quantitative real-time polymerase-chain reaction and Western blot. Cell counting kit and flow cytometry were employed to detect proliferation and apoptosis in high glucose-induced ARPE-19 cells.
Results: Total 71 pyroptosis-related DEGs were screened. BIRC2, CXCL8, APAF1, PPARG, TP53, and CYCS were identified as hub genes of DR. APAF1 was selected as a potential regulator of DR, which was up-regulated in DR mice. APAF1 silencing alleviated retinopathy and inhibited pyroptosis in DR mice with decreased levels of inflammatory factors, VEGF, and oxidative stress. Moreover, APAF1 silencing promoted proliferation while inhibiting apoptosis and caspase-3/GSDME-dependent pyroptosis with a decrease in TNF-α, IL-1β, IL-18, and lactate dehydrogenase in high glucose-induced ARPE-19 cells. Additionally, caspase-3 activator reversed the promotion effect on proliferation and inhibitory effect on apoptosis and pyroptosis after APAF1 silencing in high glucose-induced ARPE-19 cells.
Conclusion: APAF1 is a novel biomarker for DR and APAF1 silencing inhibits the development of DR by suppressing caspase-3/GSDME-dependent pyroptosis.
Keywords: diabetic retinopathy, APAF1, caspase-3, GSDME, pyroptosis
Introduction
The onset of diabetic retinopathy (DR) typically takes approximately 10 years after the diagnosis of diabetes for clinical manifestations to emerge, with an incidence rate ranging from 24.7% to 35.7%.1 Microvascular complications of diabetes frequently occur in patients with DR, which is rapidly increasing globally.2 DR consists of non-proliferative DR and proliferative DR, according to whether neovascularization occurs in retina.3 DR can cause loss of peripheral cells, endothelial cell damage, and thickening of the basement membrane, which can lead to a breakdown of the blood-retinal barrier, blood vessel leakage, and insufficient oxygen supply to the retina, eventually inducing permanent blindness.4–6 Current treatments for DR include anti-vascular drugs, laser photocoagulation, and vitrectomy.7–9 Unfortunately, the efficacy of the current treatments is still significantly unsatisfactory.10 Additionally, despite significant advances in retinal imaging in recent years, mild DR is a subtle symptom, which poses challenges for early diagnosis and subsequent intervention.11 Therefore, there is an urgent need to find new diagnostic and therapeutic targets for DR.
In addition to being essential to body growth, cell death preserves homeostasis and wards against disease.12 Pyroptosis is a type of lytic programmed cell death, which is distinguished by enlargement of the cell followed by the discharge of proinflammatory factors like interleukin (IL)-1β and IL-18.13 Pyroptosis depends on caspase-1 and its receptor, NOD-like receptor thermal protein domain associated protein 3 (NLRP3), which recognizes and activates the inactive caspase-1 to induce cell lysis, death, and the release of intracellular material through an incomplete cell membrane, causing an inflammatory response.14 According to recent research, inflammation is a major factor in the etiology of DR. For instance, caspase-1 and NLRP3 in peripheral blood mononuclear cells of DR patients are increased than those of normal controls, and the concentrations of NLRP3, caspase-1, and the pro-inflammatory factor IL-1β/18 are significantly elevated in the vitreous body.15 Studies have shown that chronic hyperglycemia induces Gasdermin (GSDM) D-mediated pyroptosis, which exerts a nonnegligible effect on the development of DR.16 Nevertheless, the specific regulatory mechanism of pyroptosis in DR needs to be further researched.
Apoptotic protease activating factor 1 (APAF1) is the core component of apoptotic body, and major conformational changes occur during mitochondrial apoptosis, which encodes a protein that is critical for caspase cascade activation in the intracellular pathway of programmed cell death.17,18 Cytochrome c is released from the mitochondria and forms a complex with APAF1 oligomers to cause the proteolytic activation of executive caspases, inducing apoptosis.19 Studies have shown that the activation of APAF1 and caspase can cause the cleavage of GSDME, thus triggering pyroptosis.20 During postnatal development, the expression levels of key apoptosis regulators, APAF1 and caspase 3 are down-regulated in the retina.21 Therefore, the role of APAF1 in pyroptosis may be a potential therapeutic target of DR.
In present study, we aim to search for the promising biomarkers of DR based on bioinformatics analysis. As a candidate gene of interest, we explored the specific role of APAF1 in DR progression. Furthermore, we clarified the potential mechanism of APAF1 regulating pyroptosis in DR at cells and animal levels. This investigation hopes to determine a theoretical basis and potential target for DR treatment.
Materials and Methods
Dataset Screening and Differential Expression Genes (DEGs) Analysis
The gene expression profiles we analyzed were downloaded from the Gene Expression Omnibus database (https://www.ncbi.nlm.nih.gov/geo/). Datasets related to “Diabetic retinopathy” were retrieved from the database, and a microarray dataset GSE60436 meeting the analysis requirements was identified after screening. Using GEO2R (www.ncbi.nlm.nih.gov/geo/geo2r), DEGs were screened out according to a significance threshold with BH <0.05 (BH: P value corrected by Benjamini–Hochberg multiple test) and |logFC|≥1.5 (DR vs Control). Heat map and volcano map were generated to visualize the DEGs, and box plot was plotted to standardize and correct samples in the dataset. Afterward, pyroptosis-related dataset retrieved from GeneCards database (https://www.genecards.org/) was selected for intersection to obtain pyroptosis-related DEGs of DR.
Function and Pathway Enrichment Analysis
The Database for Annotation, Visualization, and Integrated Discovery (DAVID) database was employed to perform Gene Ontology (GO) and Kyoto Encyclopedia of Genes and Genomes (KEGG) analysis. Subsequently, the GO and KEGG enrichment results were analyzed using R package clusterProfiler, and P <0.05 was regarded as the significance threshold to filter the most significantly enriched results to create enrichment dot plots.
Construction of Protein–Protein Interaction (PPI) Network and Hub Gene Analysis
DEGs analysis was conducted using the Search Tool for the Retrieval of Interacting Genes (https://www.string-db.org/) online database to forecast the interactions between proteins encoded by genes that played important roles in the pathogenesis of DR. A confidence interaction score of 0.4 was used for significance criteria. The PPI network was then displayed using the Cytoscape program (www.cytoscape.org/), and MCODE (Molecular Complex Detection) was utilized to identify important modules from the PPI network of DEGs. To determine the degree of each protein node and screen the hub gene according to the degree of connectivity, the Cytoscape plugin CytoHubba Version 0.1 was employed. Expression ridge map was drawn using R package. Principal component analysis (PCA) was performed using the hub gene expression as a variable in the original sample data. After R package ggplot2 processing, two principal component variables, PC1 and PC2 were obtained. GO enrichment chord diagrams were generated using the expression of hub gene.
Construction of APAF1 Lentiviral Expression Vector and Lentiviral Packaging
APAF1-shRNA and control lentivirus vectors were constructed by GeneChem Biotechnology Co. Ltd (Shanghai, China). The plasmids were separately subjected to high‐purity endotoxin‐free extraction and transfected in 293T cells (Invitrogen, Carlsbad, CA, USA). Cells were then incubated with Dulbecco’s modified Eagle’s medium (DMEM) 6 h after transfection. The cell supernatant containing the recombinant plasmid was collected by centrifugation after 24 h and 48 h of culture, and the virus supernatant was concentrated by ultracentrifugation. The recombinant plasmid was preserved at −80°C. Subsequently, the 293T cells were seeded into a 24‐well culture plate and added with 1 mL of DMEM for infection in 5% CO2 at 37°C. After 48 h of the infection with virus diluent, the dilution gradient of green fluorescent protein cells was noted at a ratio of 10%, and the number of fluorescent cells infected by this gradient dilution in each well was counted to calculate virus titer.
Construction of DR Mouse Model and Animal Treatment
All the mice experiments adhered to the principles of the Declaration of Helsinki and the statement for the Use of Animals in Ophthalmic and Vision Research. All pertinent institutional and governmental requirements for the ethical use of animals were followed, and the ethics committee (Nanfang Hospital, Southern Medical University) approved the techniques for animal care and usage. BALB/c male mice (n=24; 6–8 weeks; SPF Biotechnology Co., Ltd., Beijing, China) were acclimated to the experimental scenarios (constant temperature of 20±2°C, humidity of 55±5%, light/dark period of 12 h) before model construction. Mice were randomly divided into control group, DR group, Lv-sh NC group, and Lv-sh APAF1 group, with 6 mice in each group. After feeding for 1 week, mice were fasted for 6 h before model construction. Mice in the model group were intraperitoneally injected with 2% streptozotocin (a dose of 55 mg/kg body weight) dissolved in 10 mM citrate buffer (pH=4.5) on five consecutive days to induce DR.22,23 At the same time, mice in the control group were intraperitoneally injected with the same volume of citrate buffer. After 72 h of the final injection, the glucose level of tail vein blood in the mice was detected using OneTouch Ultra glucometer (LifeScan Inc., Milpitas, CA, USA). Mice with a stable glycemia >19 mmol/L, polyuria, emaciation, and glycosuria were considered to be diabetic mice. The control and APAF1-shRNA lentivirus particles (1 μL, 1.5×10⁶ transducing units/mL) were injected into the vitreous cavity of mice in Lv-sh NC group and Lv-sh APAF1 group, respectively at 2 weeks after the modeling. The same volume of normal saline was injected into the vitreous cavity of the mice in control group and the DR group. Two months after injection of streptozotocin, mice were anesthetized by inhaling 1–1.5% isoflurane mixed with oxygen for 4–5 min and subsequently euthanized by cervical dislocation for further experiment.
Tissue and Serum Collection
The retina of mice in each group was extracted as previously described.24 Briefly, the cheek skin of mice was tightened to make the eyeball protrusion out of the orbit. Then the cornea was sliced with a blade, and the lens was detached from the incised corneal fissure, resulting in acute retinal detachment. After that, the optic nerve and ocular artery were severed, and the eyeball was extracted and placed in a petri dish under a stereo mirror. A complete retina was obtained by cutting the edge of the retina with micro scissors. Some retina tissues were fixed with 10% paraformaldehyde, and remaining samples were preserved at −80°C for subsequent assays. Mice blood was collected by removing eyeball. Blood was centrifuged at 3000 r/min for 10 min at 4°C to extract serum.
Hematoxylin-Eosin (HE) Staining
The specimen was fixed in paraformaldehyde. After dehydration and hyalinization, the specimen was embedded in paraffin to prepare the sections. The paraffin sections were dewaxed, and immersed in hematoxylin (Sigma, Saint Louis, USA), and alcoholic eosin (Sigma) staining solution. The HE staining images were observed using an optical microscope.
Enzyme-Linked Immunosorbent Assay (ELISA)
The concentrations of tumor necrosis factor α (TNF-α), IL-1β, IL-1β, IL-18, lactate dehydrogenase (LDH), vascular endothelial growth factor (VEGF), superoxide dismutase (SOD), and malondialdehyde (MDA) were detected using ELISA kits (Eusebio, Shanghai, China), following the instructions of manufacturer. The optical density was noted at 450 nm, and then the concentration was determined according to the standard curve.
Quantitative real-time polymerase-chain reaction (qRT-PCR)
After being extracted with TRIZOL regent, the RNA was diluted with ultra-pure water with enzyme-free. An ultraviolet spectrophotometer was used to measure the concentrations of RNA. For further analysis, samples with an OD260/OD280 ratio of between 1.9 and 2.0 were chosen for analysis. The Hiscript II QRT Supermix for qPCR reverse transcription kit (VazymE, Nanjing, China) was utilized to synthesize the cDNA by reverse transcription in the PCR amplification apparatus, and the reaction procedures were as follows: 25°C for 5 min; 42°C for 30 min; 85°C for 5 s. SYBR Premix Ex Taq (#RR420A; Takara, Otsu, Shiga, Japan) was applied for RT-qPCR using ABI7500 quantitative PCR instrument (Applied Biosystems, Foster City, CA, USA). The 2−ΔΔCt method was used to examine the obtained Ct values. The GAPDH expression level was used to standardize the mRNA levels. The sequence of primers was shown in Table S1.
Cell Culture and Treatment
Human retinal pigment epithelium cell line (ARPE-19; iCell-h020; iCell Bioscience Inc, Shanghai, China) were incubated in DMEM/F12 medium (Thermo fisher scientific, Waltham, MA, USA) containing 10% fetal bovine serum (Invitrogen) and 1% Penicillin/Streptomycin Solution (Invitrogen) in a 37°C incubator with 5% CO2. ARPE-19 cells were divided into control group, high glucose (HG) group, sh-NC group, sh-APAF1 group, and sh-APAF1+Raptinal (caspase-3 activator; Selleck Chemicals LLC, Houston, USA) group. ARPE-19 cells were cultured in HG (Sigma; 25mM) for 48 h to simulate DR in vitro, and ARPE-19 cells in control group were cultured in a medium containing normal glucose (5.5 mM) as a control. Lipofectamine 3000 Reagent (Thermo fisher scientific) was applied to perform cell transfection in sh-NC group, sh-APAF1group, and sh-APAF1+Raptinal group, following the instruction. Additionally, the cells in Raptinal group and sh-APAF1+ Raptinal group were treated with Raptinal (5 μM) for 24 h.
Cell Counting Kit-8 (CCK-8) Assay
Cell viability was measured using CCK-8 kit (Biosharp, Beijing, China) following the instructions of manufacturer. Briefly, ARPE-19 cells (1×10⁴/well) were seeded in a 96-well plate and cultured in an incubator for 24 h. Cells were cultured with CCK-8 reagent for 2 h, and the optical density at 450 nm was then measured under a microplate reader.
Flow Cytometry
The apoptosis rates in ARPE-19 cells were detected using flow cytometry analysis with an Annexin V-FITC/PI Apoptosis kit (Share Bio, Shanghai, China). For Annexin V/PI staining, cells were resuspended with Annexin V labeled FITC(5 µL) and incubated for 5 min. Subsequently, proprium iodide solution (10 µL) containing RNase and 400 µL of phosphate buffered saline were added and completely mixed. Apoptosis of cells was detected and analyzed by a flow cytometry.
Western Blot
Tissue proteins were obtained using RIPA lysis buffer (Biosharp). Protein concentrations were quantified by the Pierce Bicinchoninic Acid Protein Assay kit (Thermo Fisher Scientific). The proteins were transferred to the polyvinylidene fluoride membrane after being separated with a 10% sodium dodecyl sulfate-polyacrylamide gel electrophoresis gel and sealed in 5% skim milk and then incubated with primary antibody at 4°C overnight. All the primary antibodies we used were as follows: anti-APAF1 (1:2000; Abcam, Cambridge, UK), anti-clv-caspase-3 (1:2000; Abcam), anti-pro-caspase-3 (1:2000; Abcam), anti-N-GSDME (1:2000; Abcam), and anti- GAPDH (1:1000, Abcam). The membranes were then incubated with horseradish peroxidase-labeled goat anti-rabbit IgG antibody (1:5000; Abcam) for 1 h. The bands were examined using Tanon 5200 Automatic chemiluminescence image analysis system (Shanghai, China). Enhanced chemiluminescence solution was applied for color development to observe images.
Statistical Analysis
All data analysis was performed by GraphPad Prism 7.0 software and expressed in the form of mean ± standard deviation. t-tests and One-Way ANOVA were employed for comparisons between two or more groups, respectively. Following the ANOVA analysis, the Tukey’s multiple comparisons test was conducted, and P <0.05 showed statistically significant differences.
Results
DEGs Analysis
In this study, GSE60436 gene expression profile dataset was selected. There were 3 normal retinal samples (Control) and 3 proliferative DR samples (DR) in GSE60436 dataset. Total 2924 DEGs were determined in GSE60436 dataset, among which 1439 DEGs were up-regulated and 1485 DEGs were down-regulated. Cluster analysis of DEGs in the dataset was performed to obtain the DEGs volcano map (Figure 1A). After normalization and removal of batch effects, the data correction results of 6 samples in the GSE60436 dataset were presented in box plot (Figure 1B). The top 25 DEGs with the most significant differential expression were exhibited in heat map (Table S2) (Figure 1C). According to the heat map, the samples were clustered well with high confidence. Venn diagram suggested that total 71 pyroptosis-related DEGs of DR were determined (Figure 1D).
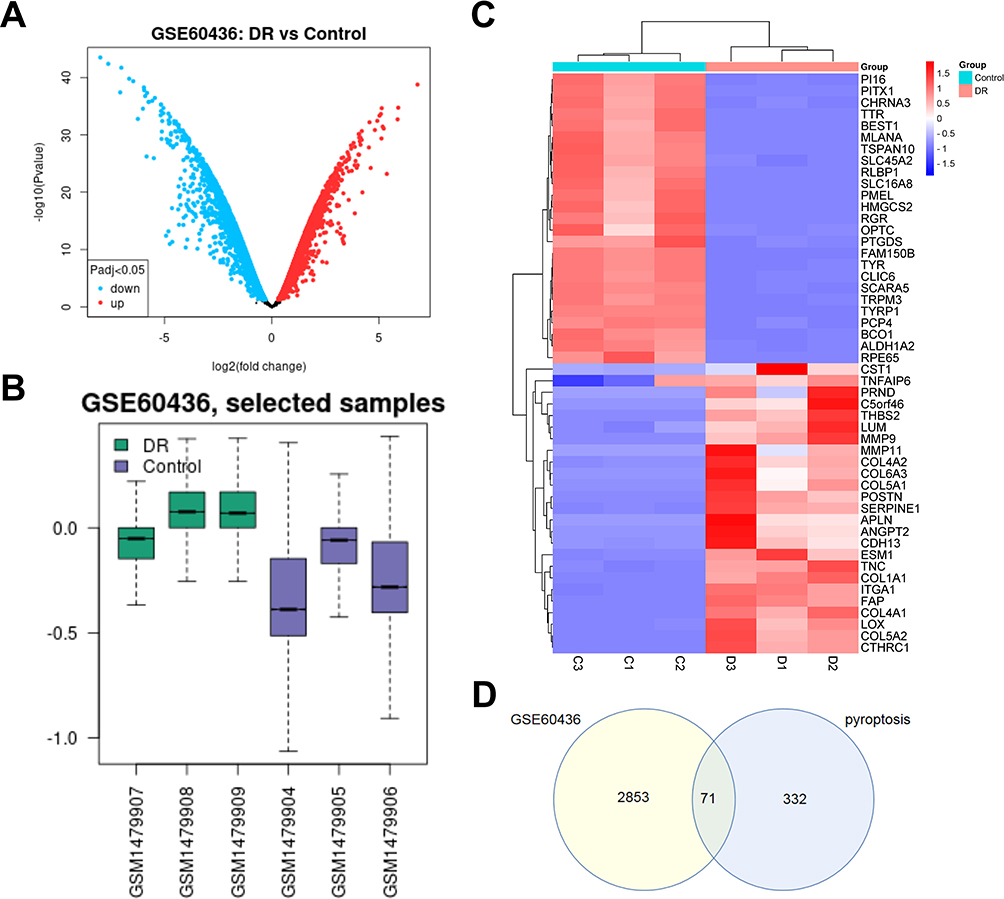 |
Figure 1 Differentially expressed genes (DEGs) identification. (A) Volcano plots of DEGs in GSE60436; the abscissa is log2FoldChange, and the ordinate is -log10. Red dots represent up-regulated DEGs, and blue dots represent down-regulated DEGs. (B) Box plots of the data normalization results for the dataset samples. (C) Heat map of DEGs. (D) Venn diagram of DEGs. The number in each circle represents the number of DEGs in the dataset, and the overlapping part of the circle represents the common DEGs between GSE60436 and pyroptosis-related gene dataset. |
GO and KEGG Analysis
The enrichment results were mainly divided into 3 categories: molecular function (MF), biological process (BP), and cellular component (CC). The top 6 significantly enriched GO terms of each category were displayed in the GO enrichment bubble chart (Figure S1A). The DEGs in MF were in “identical protein binding”, “protein binding”, “protease binding”, “peptidase activity”, “cysteine-type endopeptidase activity involved in apoptotic signaling pathway”, “serine-type endopeptidase activity”, etc. The DEGs in BP were significantly enriched in “pyroptosis”, “inflammatory”, “immune response”, “apoptotic process”, “positive regulation of interleukin-1”, and “beta production response to hypoxia”, etc. The DEGs in CC were mainly enriched in “extra cellular region”, “extra cellular space”, “macromolecular complex”, “membrane raft”, “NLRP3 inflammasome complex”, and “plasma membrane”, etc. We selected the top 10 significantly enriched pathways with the minimum p-value, as shown in the KEGG enrichment bubble chart (Figure S1B).
PPI Network Construction and Hub Gene Analysis
PPI network based on DEGs was established using Search Tool for the Retrieval of Interacting Genes database (Figure S2). The PPI network model was visualized and 6 highly interconnected clusters were identified in the PPI network of DEGs as potential functional molecular complexes in DR. Hub genes (BIRC2, CXCL8, APAF1, PPARG, CYCS, TP53) were screened out from module 1 (Figure 2A). The expression data of hub gene in the original sample of GSE60436 was screened out, and the expression ridge map was drawn to show the expression of hub genes in GSE60436 dataset (Figure 2B). PCA analysis showed that the total variance explained rate of PC1 and PC2 was 95.4%, suggesting that the hub genes could distinguish between the DR samples from control samples. The scatter plot (PC1 and PC2 as the horizontal and vertical coordinates) suggested that the samples of DR and normal control had a good separation, further confirming the validity of PC1 and PC2, which could be used as the basis for distinguishing the samples of the control group and the model group (Figure 2C). In addition, the GO enrichment chord diagram showed the relationship between proteins and pathways and indicated the alteration of functional pathways (Figure 2D).
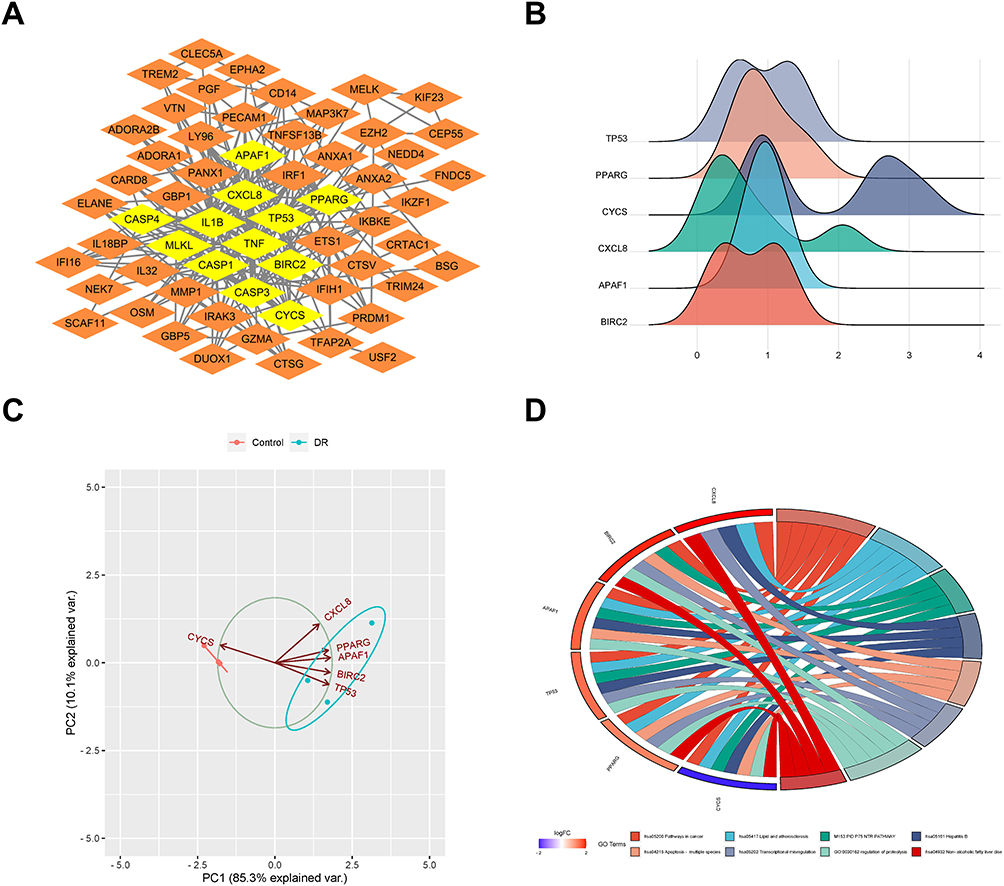 |
Figure 2 Hub gene analysis. (A) Hub genes identified from protein–protein interaction network. (B) Gene ridge plot. The x-axis represents gene expression levels, and the shape of the ridges represents the distribution of data within each group, with the height indicating the number of samples corresponding to the gene expression level. (C) Principal component analysis plot. The coordinates PC1 and PC2 represent the first and second principal components (ie, latent variables explaining the differences). Points represent samples, and different colors represent different groups. (D) Gene Ontology (GO) pathway diagram, consisting of three parts: genes, LogFold Change (representing the fold change of genes for sorting and color-coding gene blocks), and GO terms. Different connections between genes indicate their involvement in specific GO terms. |
The Expression of Hub Genes in DR Model
As shown in HE images, cells in retinal tissue of the control mice were arranged neatly and loosely, and no inflammatory cell infiltration was observed (Figure 3A). The inflammatory cells in retinal tissue of DR mice significantly increased, while the normal cells significantly reduced, and the nuclei were concentrated and solidified. Compared to the control group, the levels of TNF-α, IL-1 β, and IL-18 in mice of DR group significantly increased (Figure 3B). The concentrations of VEGF and MDA in model group were significantly increased, while the SOD levels were decreased, compared to the control group (Figure 3C).
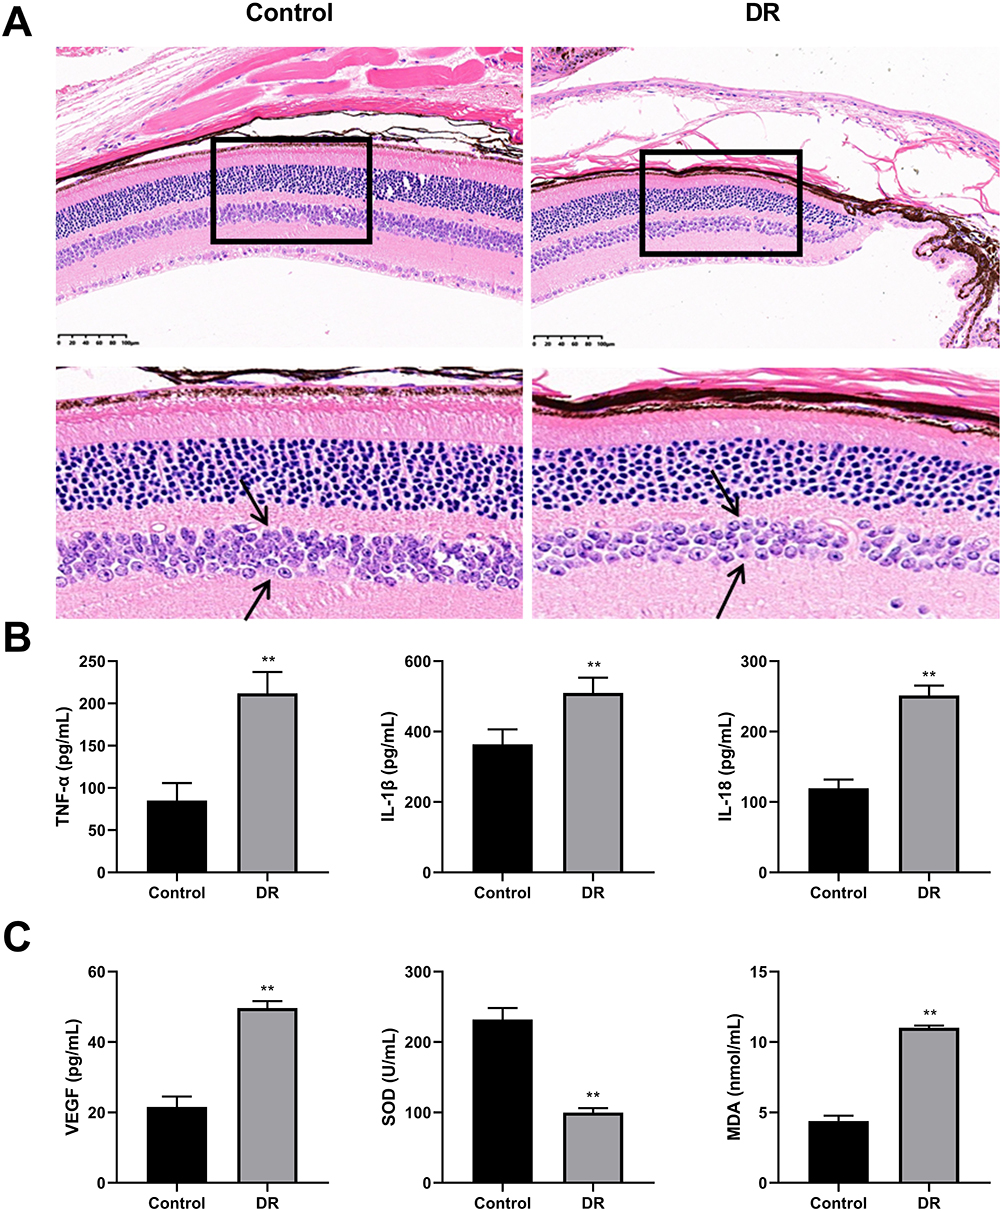 |
Figure 3 Assessment of diabetic retinopathy (DR) model (N=6). (A) Representative images of hematoxylin and eosin (HE) staining (Amplification: 200×, Scale: 100 μm). The arrows point to the inner nuclear layer cells. The number of inner nuclear layer cells in the model group sparser than that in control group. (B) The concentrations of tumor necrosis factor α (TNF-α), interleukin-1β (IL-1β), and interleukin-18 (IL-18) were detected using enzyme-linked immunosorbent assay (ELISA). (C) The concentrations of vascular endothelial growth factor (VEGF), superoxide dismutase (SOD), and malondialdehyde (MDA) were detected using ELISA. **P<0.01 vs control group. |
Compared to the control group, the mRNA expression levels of BIRC2, CXCL8, APAF1, PPARG, and TP53 in the DR group were apparently up-regulated, whereas the mRNA expression level of CYCS was significantly down-regulated (Figure 4).
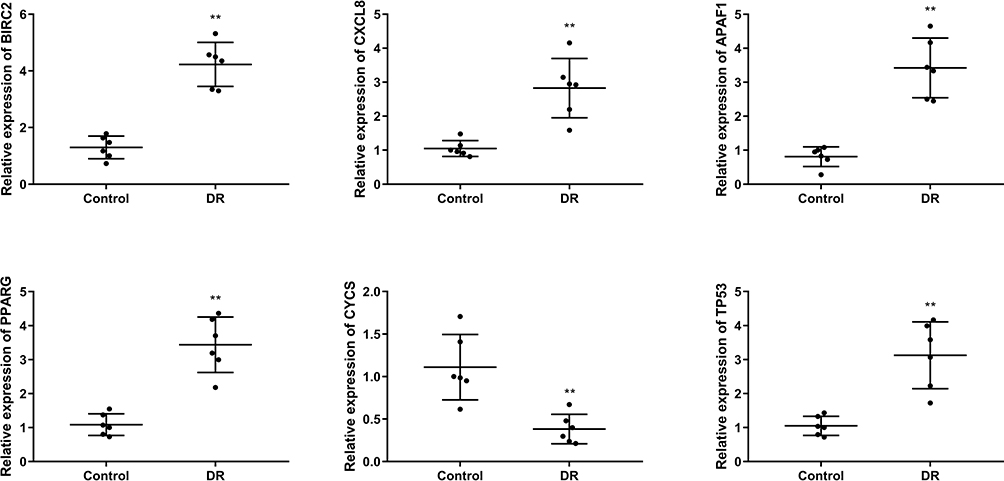 |
Figure 4 The mRNA expression levels of BIRC2, CXCL8, APAF1, PPARG, TP53, CYCS in tissues were detected by quantitative real-time polymerase chain reaction (qRT-PCR). (N=6), **P<0.01 vs control group. |
APAF1 Silencing Inhibits Caspase-3/GSDME-Dependent Pyroptosis and Alleviates Retinopathy in Diabetes Mice
The Western blot results suggested that compared to the control group, mice in the DR group showed significantly higher expression levels of APAF1, clv-caspase-3, and N-GSDME. There was no significant difference in the expression levels of APAF1, clv-caspase-3, and N-GSDME in the Lv-sh NC group, compared to the DR group, while the expression of APAF1, clv-caspase-3, and N-GSDME in the Lv-sh APAF1 group was significantly decreased (Figure 5A). HE staining suggested that compared with the DR group, the mice in Lv-shAPAF1 group had orderly arrangement of cells in retinal tissue and a decrease of inflammatory cells (Figure 5B). Compared with the Lv-sh NC group, the concentrations of TNF-α, IL-1 β, and IL-18 in Lv-shAPAF1 group were significantly reduced (Figure 5C). Additionally, the concentrations of VEGF and MDA were apparently lower in Lv-sh APAF1 group than those of Lv-sh NC group, while the SOD activity in Lv-sh APAF1 group was significantly enhanced, compared with the Lv-sh NC group (Figure 5D).
 |
Figure 5 The effect of APAF1 on DR mice. (A) Western blot detected the expression of APAF1, pro-caspase-3, clv-caspase-3, and N-GSDME in DR mice. (B) Representative images of HE staining (Amplification: 200×, Scale: 100 μm). (C) The concentrations of TNF-α, IL-1β, IL-18 were detected using ELISA. (D) The concentrations of VEGF, SOD, and MDA were detected using ELISA. **P<0.01, vs control group; ##P<0.01 vs Lv-sh NC group. |
APAF1 Silencing Promotes Proliferation and Inhibits Apoptosis in HG-Induced ARPE-19 Cells
Compared to the control group, the mRNA expression level of APAF1 in the HG group significant up-regulated (Figure 6A). The expression levels of sh-APAF1-1, sh-APAF1-2, and sh-APAF1-3 were significantly decreased, compared to the HG group. Compared to the control group, the cell viability of the HG group was considerably inhibited (Figure 6B). Relative to the sh-NC group, the cell viability in sh-APAF1 group was significantly promoted. Furthermore, compared with the control group, cell apoptosis in the HG group was significantly promoted, while the cell apoptosis in the sh-APAF1 group was significantly inhibited, compared with the sh-NC group (Figure 6C).
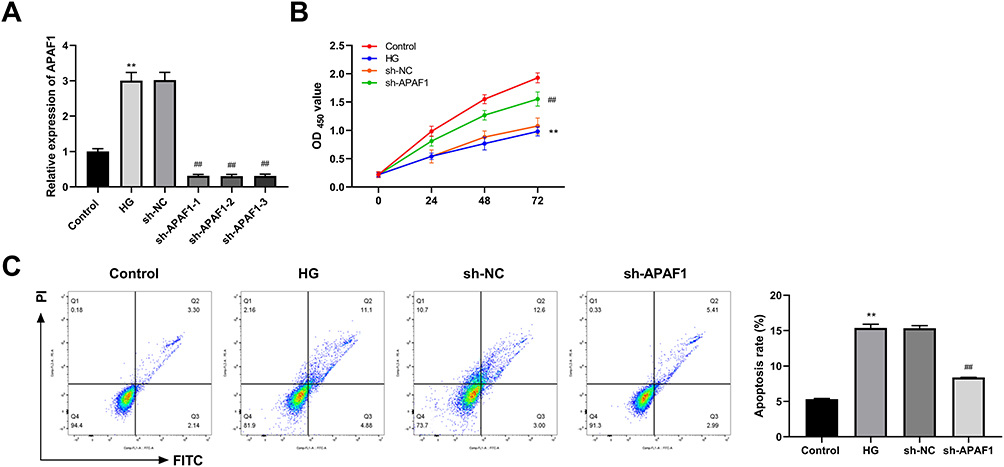 |
Figure 6 APAF1 silencing promotes proliferation and inhibits apoptosis in high glucose (HG) ARPE-19 cells. (A) The mRNA expression of APAF1 was detected by qRT-PCR. (B) Cell counting kit-8 (CCK-8) was used to detect cell viability. (C) Flow cytometry was used to detect apoptosis rate. **P<0.01, vs control group; ##P<0.01 vs Lv-sh NC group. |
APAF1 Silencing Inhibits Caspase-3/GSDME-Dependent Pyroptosis in HG-Induced ARPE-19 Cells
Relative to the control group, the expression levels of APAF1, clv-caspase-3, and N-GSDME in HG group were significantly increased. The expression levels of APAF1, clv-caspase-3, and N-GSDME in sh-APAF1 group were considerably lower than those in sh-NC group (Figure 7A). The concentrations of TNF-α, IL-1β, IL-18, and LDH in HG group were apparently higher than those in control group. Compared to sh-NC group, the concentrations of TNF-α, IL-1β, IL-18, and LDH in sh-APAF1 group were significantly reduced (Figure 7B and C).
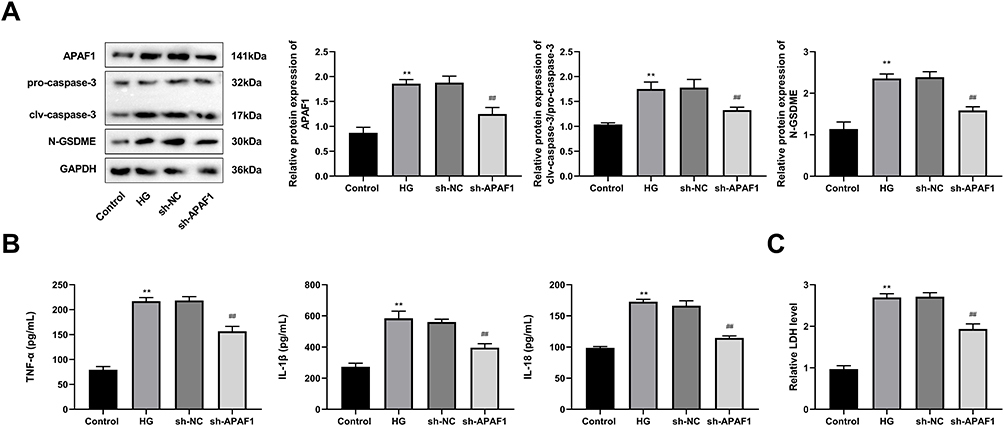 |
Figure 7 APAF1 silencing inhibits caspase-3/GSDME-dependent pyroptosis in HG-induced ARPE-19 cells. (A) Western blot detected the protein expression of pro-caspase-3, clv-caspase-3, and N-GSDME. (B) The levels of TNF-α, IL-1β, IL-18 were detected by ELISA. (C) ELISA kit detected the concentration of lactate dehydrogenase. **P<0.01, vs control group; ##P<0.01 vs sh-NC group. |
APAF1 Silencing Promotes Proliferation and Inhibits Apoptosis in HG-Induced ARPE-19 Cells via Suppressing Caspase-3/GSDME-Dependent Pyroptosis
Relative to the HG group, the treatment of Raptinal caused an increase in the expression of clv-caspase-3 and N-GSDME, while the expression levels of clv-caspase-3, and N-GSDME were significantly decreased in the sh-APAF1 group. Compared with the sh-APAF1 group, the expression of clv-caspase-3 and N-GSDME in sh-APAF1+Raptinal group significantly increased (Figure 8A). The viability of cells in the Raptinal group was significantly inhibited, while the viability in the sh-APAF1 group was significantly promoted, compared to the HG group. Compared with the sh-APAF1 group, cell viability in the sh-APAF1+Raptinal group showed a significant decrease (Figure 8B). The flow cytometry results showed that compared to the HG group, the Raptinal promoted cell apoptosis, while the apoptosis in sh-APAF1 group was significantly inhibited. And the apoptosis rate in the sh-APAF1+Raptinal group was significantly higher than that in the sh-APAF1 group (Figure 8C). The ELISA results showed that the concentrations of TNF-α, IL-1 β, IL-18, and LDH were significantly higher in the Raptinal group, while the concentrations of TNF-α, IL-1 β, IL-18, and LDH in sh-APAF1 group significantly decreased, compared with the HG group. Relative to the sh-APAF1 group, the concentrations of TNF- α, IL-1 β, IL-18, and LDH in sh-APAF1+Raptinal group were significantly elevated (Figure 8D–E).
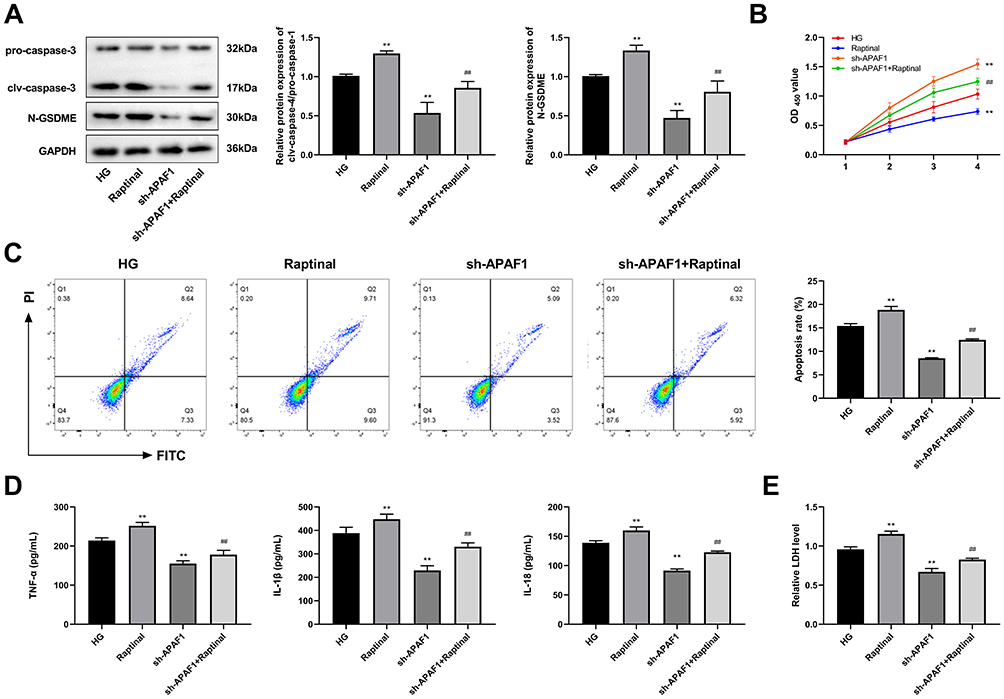 |
Figure 8 Raptinal reverses the effect of APAF1 silencing on HG-induced ARPE-19 cells. (A) Western blot detected the protein expression of pro-caspase-3, clv-caspase-3, and N-GSDME. (B) CCK-8 was used to assess cell viability. (C) Flow cytometry was used to detect apoptosis. (D) The levels of TNF-α, IL-1β, IL-18 were detected by ELISA. (E) ELISA kit detected the concentration of lactate dehydrogenase. **P<0.01, vs HG group; ##P<0.01 vs sh-APAF1 group. |
Discussion
Currently, DR is regarded as a chronic inflammatory disease, whose pathogenesis is closely related to pyroptosis.25 Here, we identified BIRC2, CXCL8, APAF1, PPARG, TP53, and CYCS as the hub genes of DR, which were significantly differentially expressed in DR mice, compared to the normal mice. APAF1 was selected as a key gene of our study. APAF1 was up-regulated in the DR model. Additionally, in vitro model, we found that silencing of APAF1 promoted the proliferation while inhibiting apoptosis in HG-induced cells. Notably, silencing of APAF1 suppressed caspase-3/GSDME-dependent pyroptosis. And Caspase-3 activator could reverse the promotion effect of APAF1 silencing on proliferation and inhibitory effect on apoptosis and pyroptosis in HG-induced ARPE-19 cells.
Bioinformatics analysis has been widely applied to explore key pathogenic factors and potential therapeutic targets in DR and other diabetic complication.26–28 In the present research, we identified 6 pyroptosis-related genes as the hub genes of DR based on the GSE60436 dataset, which were significantly differentially expressed in DR mice. After bioinformatics analysis and construction of TNF-α protein interaction network, BIRC2 is found to be a new biomarker involved in the pathogenesis of type 2 diabetes mellitus mediated by tumor necrosis factor.29 By comparing humoral adipokines between 37 patients with DR and 29 patients without DR, the expression level of CXCL8 in the DR group is significantly higher than that in the non-DM group.30 APAF1 is highly expressed in the retina of DR mice, which is determined by immunofluorescence.31 By using gene-specific PCR and direct sequencing to examine polymorphisms in all pairs of samples from 211 type 2 diabetic, 205 obese, and 254 control individuals, it has been reported that the PPARG’s novel polymorphism A-2819G is linked to type 2 diabetes and proliferative retinopathy in diabetic women.32 Based on microarray expression profile GSE60436 dataset and autophagy-related DEGs in fibrovascular membrane and normal retina, TP53 is identified as a hub gene that is significantly up-regulated in vitro hyperglycemia models.33 Based on molecular signature database and GO database, CYCS is one of the focused genes associated with pyroptosis in diabetic nephropathy.34 Taken together, BIRC2, CXCL8, APAF1, PPARG, TP53, and CYCS are the promising hub genes, which exert an important role in DR.
APAF1 has been reported in various diabetes-related diseases. For example, diosgenin inhibits mitochondrial apoptosis via down-regulating the expression of APAF1, thus alleviating diabetic nephropathy.35 Piperine can suppress the expression of APAF1 in brain tissue and improve the memory of diabetic rats.36 Additionally, in DR mice, Xiao Bopi inhibits angiogenesis and apoptosis via down-regulating the expression of APAF1.31 We discovered that APAF1 was up-regulated in the DR model and APAF1 silencing improved retinopathy in diabetic mice. Additionally, silencing of APAF1 promoted the proliferation while inhibiting apoptosis in HG-induced cells. In brief, silencing APAF1 is a potential therapeutic target for DR.
GSDME can activate APAF1 by permeating mitochondria and releasing cytochrome c, and offer positive feedback on caspase-3 activation and GSDME cleavage, thus mechanistically associating the activation of inflammasome-mediated pyroptosis with apoptosis.37 The abnormal accumulation of retina is related to caspase-3/GSDME-mediated pyroptosis of retinal pigment epithelium cells.38,39 In serum albumin-induced DR, inhibition of caspase-1 can suppress pyroptosis by decreasing GSDMD and inhibiting the release of IL-1β, IL-18, and LDH.40 Moreover, down-regulation of lipid carrier protein 2 significantly inhibits caspase-1-mediated cell migration, invasion, angiogenesis, and pyroptosis, thus suppressing the progression of DR.41 Additionally, the expression levels of caspase-1 and NLRP3 in ARPE-19 cells are decreased after knockdown of circular RNA ZNF532, thereby inhibiting pyroptosis.42 The expression levels of APAF1, caspase, and GSDME are decreased after Schisandrin B pretreatment of hepatocytes, and the non-classical pyroptosis induced by APAF1 inflammasome is inhibited.43 In our research, silencing of APAF1 suppressed caspase-3/GSDME-dependent pyroptosis in DR mice. Raptinal reversed the promotion effect on proliferation and inhibitory effect on apoptosis and pyroptosis of APAF1 silencing in HG-induced ARPE-19 cells. Studies have reported that APAF1 activation recruits and activates caspase-4/11, and activated Caspase-4/11 in APAF1 pyroptosis cleaves caspase-3, which further activates GSDME to initiate pyroptosis.44 All in all, silencing of APAF1 alleviates DR via inhibiting caspase-3/GSDME-mediated pyroptosis.
This study still has some limitations. Firstly, the regulatory mechanisms of APAF1 involving the caspase-3/GSDME-dependent pyroptosis are not explored in depth. Additionally, due to the limited samples and experimental equipment, the present study lacked the detection of phenotype in DR. Finally, more experiments are needed to explore the role of APAF1 rescue and overexpression in DR based on in vitro and in vivo experiments. We will improve the laboratory equipment and conditions to complete more experiments and refine our research in the future.
Conclusion
Taken together, we determined that APAF1 was a promising gene signature for diagnosis and treatment of DR. APAF1 silencing could alleviate retinopathy in DR mice. Furthermore, APAF1 silencing promoted proliferation, while inhibiting apoptosis with a decrease in TNF-α, IL-1β, IL-18, and LDH in HG-induced ARPE-19 cells via suppressing caspase-3/GSDME-dependent pyroptosis. APAF1 silencing can alleviate DR via inhibiting caspase-3/GSDME-dependent pyroptosis. Our findings provided a new insight into pathogenesis of DR, which can help us understand the underlying mechanism associated with DR and offer initial evidence for more effective molecular therapeutic targets.
Data Sharing Statement
All data in the manuscript are available through the responsible corresponding author.
Ethical Approval and Consent to Participate
All methods are reported in accordance with ARRIVE guidelines for the reporting of animal experiments. The animal experiments conformed to the Guide for the Care and Use of Laboratory Animals. Animal study has been approved by the Animal Ethics Committee of Nanfang Hospital, Southern Medical University.
According to the study protocol, human data in the study is downloaded from the GEO DataSets (GSE60436) (https://www.ncbi.nlm.nih.gov/), which is not related to the use of human clinical data from our hospital. Since the above databases are public resources and all registered users can view and use the data in the databases, the ethical approval of human-related biomedical research by our hospital’s Ethics Committee is not required in this study.
Author Contributions
All authors made a significant contribution to the work reported, whether that is in the conception, study design, execution, acquisition of data, analysis and interpretation, or in all these areas; took part in drafting, revising or critically reviewing the article; gave final approval of the version to be published; have agreed on the journal to which the article has been submitted; and agree to be accountable for all aspects of the work.
Funding
This research was supported by the President Foundation of Nanfang Hospital, Southern Medical University (2021B024).
Disclosure
The authors declare that they have no conflicts of interest to disclose in this work.
References
1. Ouyang J, Zhou L, Wang Q. Spotlight on iron and ferroptosis: research progress in diabetic retinopathy. Front Endocrinol. 2023;14:1234824. doi:10.3389/fendo.2023.1234824
2. Teo ZL, Tham YC, Yu M, et al. Global prevalence of diabetic retinopathy and projection of burden through 2045: systematic review and meta-analysis. Ophthalmology. 2021;128(11):1580–1591. doi:10.1016/j.ophtha.2021.04.027
3. Cheung N, Mitchell P, Wong TY. Diabetic retinopathy. Lancet. 2010;376(9735):124–136. doi:10.1016/S0140-6736(09)62124-3
4. Das A. Diabetic retinopathy: battling the global epidemic. Invest Ophthalmol Vis Sci. 2016;57(15):6669–6682. doi:10.1167/iovs.16-21031
5. Roy S, Kim D. Retinal capillary basement membrane thickening: role in the pathogenesis of diabetic retinopathy. Prog Retin Eye Res. 2021;82:100903. doi:10.1016/j.preteyeres.2020.100903
6. Spencer BG, Estevez JJ, Liu E, Craig JE, Finnie JW. Pericytes, inflammation, and diabetic retinopathy. Inflammopharmacology. 2020;28(3):697–709. doi:10.1007/s10787-019-00647-9
7. Berrocal MH, Acaba LA, Chenworth ML. Surgical innovations in the treatment of diabetic macular edema and diabetic retinopathy. Curr Diab Rep. 2019;19(10):106. doi:10.1007/s11892-019-1210-x
8. Everett LA, Paulus YM. Laser therapy in the treatment of diabetic retinopathy and diabetic macular edema. Curr Diab Rep. 2021;21(9):35. doi:10.1007/s11892-021-01403-6
9. Berrocal MH, Acaba-Berrocal L. Early pars plana vitrectomy for proliferative diabetic retinopathy: update and review of current literature. Curr Opin Ophthalmol. 2021;32(3):203–208. doi:10.1097/ICU.0000000000000760
10. Duh EJ, Sun JK, Stitt AW. Diabetic retinopathy: current understanding, mechanisms, and treatment strategies. JCI Insight. 2017;2(14). doi:10.1172/jci.insight.93751
11. He S, Sun L, Chen J, Ouyang Y. Recent advances and perspectives in relation to the metabolomics-based study of diabetic retinopathy. Metabolites. 2023;13(9):1007. doi:10.3390/metabo13091007
12. Yang J, Hu S, Bian Y, et al. Targeting cell death: pyroptosis, ferroptosis, apoptosis and necroptosis in osteoarthritis. Front Cell Develop Biol. 2021;9:789948. doi:10.3389/fcell.2021.789948
13. Shi J, Gao W, Shao F. Pyroptosis: gasdermin-mediated programmed necrotic cell death. Trends Biochem Sci. 2017;42(4):245–254. doi:10.1016/j.tibs.2016.10.004
14. Sharma BR, Kanneganti TD. NLRP3 inflammasome in cancer and metabolic diseases. Nat Immunol. 2021;22(5):550–559. doi:10.1038/s41590-021-00886-5
15. Loukovaara S, Piippo N, Kinnunen K, Hytti M, Kaarniranta K, Kauppinen A. NLRP3 inflammasome activation is associated with proliferative diabetic retinopathy. Acta Ophthalmol. 2017;95(8):803–808. doi:10.1111/aos.13427
16. Gan J, Huang M, Lan G, Liu L, Xu F. High glucose induces the loss of retinal pericytes partly via NLRP3-caspase-1-GSDMD-mediated pyroptosis. Biomed Res Int. 2020;2020:4510628. doi:10.1155/2020/4510628
17. Judson H, van Roy N, Strain L, et al. Structure and mutation analysis of the gene encoding DNA fragmentation factor 40 (caspase-activated nuclease), a candidate neuroblastoma tumour suppressor gene. Hum Genet. 2000;106(4):406–413. doi:10.1007/s004390000257
18. Orzáez M, Sancho M, Marchán S, et al. Apaf-1 inhibitors protect from unwanted cell death in in vivo models of kidney ischemia and chemotherapy induced ototoxicity. PLoS One. 2014;9(10):e110979. doi:10.1371/journal.pone.0110979
19. Cecconi F. Apaf1 and the apoptotic machinery. Cell Death Differ. 1999;6(11):1087–1098. doi:10.1038/sj.cdd.4400602
20. Gałuszka-Bulaga A, Tkacz K, Węglarczyk K, Siedlar M, Baran J. Air pollution induces pyroptosis of human monocytes through activation of inflammasomes and caspase-3-dependent pathways. J Inflamm. 2023;20(1):26. doi:10.1186/s12950-023-00353-y
21. Donovan M, Cotter TG. Caspase-independent photoreceptor apoptosis in vivo and differential expression of apoptotic protease activating factor-1 and caspase-3 during retinal development. Cell Death Differ. 2002;9(11):1220–1231. doi:10.1038/sj.cdd.4401105
22. Tesch GH, Allen TJ. Rodent models of streptozotocin-induced diabetic nephropathy. Nephrology. 2007;12(3):261–266. doi:10.1111/j.1440-1797.2007.00796.x
23. Gao BB, Phipps JA, Bursell D, Clermont AC, Feener EP. Angiotensin AT1 receptor antagonism ameliorates murine retinal proteome changes induced by diabetes. J Proteome Res. 2009;8(12):5541–5549. doi:10.1021/pr9006415
24. Sondereker KB, Stabio ME, Jamil JR, Tarchick MJ, Renna JM. Where you cut matters: a dissection and analysis guide for the spatial orientation of the mouse retina from ocular landmarks. J Vis Exp. 2018;(138). doi:10.3791/57861
25. Wang Y, Gao W, Shi X, et al. Chemotherapy drugs induce pyroptosis through caspase-3 cleavage of a gasdermin. Nature. 2017;547(7661):99–103. doi:10.1038/nature22393
26. Miao A, Lu J, Wang Y, et al. Identification of the aberrantly methylated differentially expressed genes in proliferative diabetic retinopathy. Exp Eye Res. 2020;199:108141. doi:10.1016/j.exer.2020.108141
27. Huang J, Zhou Q. Identification of the relationship between hub genes and immune cell infiltration in vascular endothelial cells of proliferative diabetic retinopathy using bioinformatics methods. Dis Markers. 2022;2022:7231046. doi:10.1155/2022/7231046
28. Cao NJ, Liu HN, Dong F, Wang W, Sun W, Wang G. Integrative analysis of competitive endogenous RNA network reveals the regulatory role of non-coding RNAs in high-glucose-induced human retinal endothelial cells. PeerJ. 2020;8:e9452. doi:10.7717/peerj.9452
29. Jamil K, Jayaraman A, Ahmad J, Joshi S, Yerra SK. TNF-alpha −308G/A and −238G/A polymorphisms and its protein network associated with type 2 diabetes mellitus. Saudi J Biol Sci. 2017;24(6):1195–1203. doi:10.1016/j.sjbs.2016.05.012
30. Lee YJ, Kim JJ, Kim J, Cho DW, Won JY. The correlation between waist circumference and the pro-inflammatory adipokines in diabetic retinopathy of type 2 diabetes patients. Int J Mol Sci. 2023;24(3):2036
31. Ai X, Yu P, Luo L, et al. Berberis dictyophylla F. inhibits angiogenesis and apoptosis of diabetic retinopathy via suppressing HIF-1α/VEGF/DLL-4/Notch-1 pathway. J Ethnopharmacol. 2022;296:115453. doi:10.1016/j.jep.2022.115453
32. Costa V, Casamassimi A, Esposito K, et al. Characterization of a novel polymorphism in PPARG regulatory region associated with type 2 diabetes and diabetic retinopathy in Italy. J Biomed Biotechnol. 2009;2009:126917. doi:10.1155/2009/126917
33. Peng H, Han W, Ma B, et al. Autophagy and senescence of rat retinal precursor cells under high glucose. Front Endocrinol. 2022;13:1047642. doi:10.3389/fendo.2022.1047642
34. Li C, Ma J, Mali N, et al. Relevance of the pyroptosis-related inflammasome drug targets in the Chuanxiong to improve diabetic nephropathy. Mol Med. 2022;28(1):136. doi:10.1186/s10020-022-00567-5
35. Zhong Y, Wang L, Jin R, et al. Diosgenin Inhibits ROS generation by modulating NOX4 and mitochondrial respiratory chain and suppresses apoptosis in diabetic nephropathy. Nutrients. 2023;15(9):2164. doi:10.3390/nu15092164
36. Kumar S, Chowdhury S, Razdan A, et al. Downregulation of candidate gene expression and neuroprotection by piperine in streptozotocin-induced hyperglycemia and memory impairment in rats. Front Pharmacol. 2020;11:595471. doi:10.3389/fphar.2020.595471
37. Rogers C, Alnemri ES. Gasdermins: novel mitochondrial pore-forming proteins. Mol Cell Oncol. 2019;6(5):e1621501. doi:10.1080/23723556.2019.1621501
38. Liao Y, Zhang H, He D, et al. Retinal pigment epithelium cell death is associated with NLRP3 inflammasome activation by all-trans retinal. Invest Ophthalmol Vis Sci. 2019;60(8):3034–3045. doi:10.1167/iovs.18-26360
39. Cai B, Liao C, He D, et al. Gasdermin E mediates photoreceptor damage by all-trans-retinal in the mouse retina. J Biol Chem. 2022;298(2):101553. doi:10.1016/j.jbc.2021.101553
40. Yu X, Ma X, Lin W, Xu Q, Zhou H, Kuang H. Long noncoding RNA MIAT regulates primary human retinal pericyte pyroptosis by modulating miR-342-3p targeting of CASP1 in diabetic retinopathy. Exp Eye Res. 2021;202:108300. doi:10.1016/j.exer.2020.108300
41. Su X, Zhou P, Qi Y. Down-regulation of LCN2 attenuates retinal vascular dysfunction and caspase-1-mediated pyroptosis in diabetes mellitus. Ann Transl Med. 2022;10(12):695. doi:10.21037/atm-22-2655
42. Liang GH, Luo YN, Wei RZ, et al. CircZNF532 knockdown protects retinal pigment epithelial cells against high glucose-induced apoptosis and pyroptosis by regulating the miR-20b-5p/STAT3 axis. J Diabetes Investig. 2022;13(5):781–795. doi:10.1111/jdi.13722
43. Liang H, Yang X, Li H, et al. Schisandrol B protects against cholestatic liver injury by inhibiting pyroptosis through pregnane X receptor. Biochem Pharmacol. 2022;204:115222. doi:10.1016/j.bcp.2022.115222
44. Xu W, Che Y, Zhang Q, et al. Apaf-1 pyroptosome senses mitochondrial permeability transition. Cell Metab. 2021;33(2):424–436.e410. doi:10.1016/j.cmet.2020.11.018
 © 2024 The Author(s). This work is published and licensed by Dove Medical Press Limited. The full terms of this license are available at https://www.dovepress.com/terms.php and incorporate the Creative Commons Attribution - Non Commercial (unported, v3.0) License.
By accessing the work you hereby accept the Terms. Non-commercial uses of the work are permitted without any further permission from Dove Medical Press Limited, provided the work is properly attributed. For permission for commercial use of this work, please see paragraphs 4.2 and 5 of our Terms.
© 2024 The Author(s). This work is published and licensed by Dove Medical Press Limited. The full terms of this license are available at https://www.dovepress.com/terms.php and incorporate the Creative Commons Attribution - Non Commercial (unported, v3.0) License.
By accessing the work you hereby accept the Terms. Non-commercial uses of the work are permitted without any further permission from Dove Medical Press Limited, provided the work is properly attributed. For permission for commercial use of this work, please see paragraphs 4.2 and 5 of our Terms.