")
Back to Journals » Diabetes, Metabolic Syndrome and Obesity » Volume 14
A Non-Linear Association of High-Density Lipoprotein Cholesterol with All-Cause and Cause-Specific Mortality in Diabetic Patients
Authors Yan Y , Chen J, Huang Y
Received 26 March 2021
Accepted for publication 31 May 2021
Published 22 June 2021 Volume 2021:14 Pages 2851—2862
DOI https://doi.org/10.2147/DMSO.S313006
Checked for plagiarism Yes
Review by Single anonymous peer review
Peer reviewer comments 2
Editor who approved publication: Professor Ming-Hui Zou
Yu-qin Yan,1,* Jun Chen,1,* Yu-qing Huang2
1Department of Cardiology, People’s Hospital of Shenzhen Baoan District, Shenzhen, 518100, People’s Republic of China; 2Department of Cardiology, Guangdong Provincial People’s Hospital, Guangdong Academy of Medical Sciences, Guangzhou, 510080, People’s Republic of China
*These authors contributed equally to this work
Correspondence: Yu-qing Huang
Department of Cardiology, Guangdong Provincial People’s Hospital, Guangdong Academy of Medical Sciences, No. 106, Zhongshan Second Road, Yuexiu District, Guangzhou, 510080, People’s Republic of China
Tel/Fax +86-20-83827812
Email [email protected]
Background: The association between high-density lipoprotein cholesterol (HDL-C) and the risk of death among people with diabetes remains to be verified.
Methods: This was a nationwide, population-based cohort study in United States. A total of 6549 diabetes patients were included from the National Health and Nutrition Examination Surveys (NHANES). HDL-C concentration was divided into quintiles, and the lowest risk group (Q4: 1.32 to 1.53 mmol/L) was used as reference. Multivariate Cox proportional hazards models and restrictive cubic curves were performed to estimate hazard ratios (HRs) with 95% confidence interval (CI) for all-cause and cause-specific mortality.
Results: During a median follow-up of 82.36 ± 50.11 months, 1546 (23.61%) cases of all-cause, 389 (5.94%) cardiovascular and 262 (4.00%) cancer mortality have occurred, respectively. After adjusting for potential covariates, a U-shaped association was found between HDL-C and all-cause mortality (minimum mortality risk at 1.37 mmol/L); the risk for all-cause mortality was significantly higher in the groups with HDL-C concentration < 0.96 mmol/L (HR: 1.30; 95% CI: 1.09, 1.56; P=0.0046) and with HDL-C concentration ≥ 1.55 mmol/L (HR: 1.20; 95% CI: 1.00, 1.44; P=0.0481) than participants with HDL-C concentrations ranging from 1.32 to 1.53mmol/L. Nonlinear associations of HDL-C levels with both cardiovascular and cancer mortality were also observed.
Conclusion: A non-linear association was observed association of HDL-C with all-cause, cardiovascular and cancer mortality among diabetic patients.
Keywords: high-density lipoprotein cholesterol, diabetes, mortality, all-cause mortality, cause-specific mortality, dose-dependent
Introduction
Over the past few decades, a large number of cohort or clinical studies have demonstrated inverse association of high-density lipoprotein cholesterol (HDL-C) with cardiovascular events and mortality.1–4 For this reason, many clinical guidelines recommended HDL-C as a protective factor that was beneficial for the prevention and treatment of cardiovascular events.5,6 However, in recent years, studies have found that HDL-C concentration might not have dose–response benefit on cardiovascular health. For example, Stephen et al found that higher HDL-C levels did not associate with a reduced mortality risk in patients with reduced kidney function.7 In the general population, a J-shaped or U-shaped association was observed between HDL-C and mortality.8–10 In high-risk patients with type 2 diabetes, it was found that HDL-C at baseline was unexpectedly related to a higher risk for cardiovascular events and all-cause mortality.11 In addition, a meta-analysis of randomized controlled trials of 117,411 patients concluded that increasing HDL-C concentration does not reduce the risk of coronary disease events.12 In brief, the relationship between HDL-C and mortality was not entirely consistent and available data was limited among diabetic patients. The present study was therefore conducted to explore the association of HDL-C with all-cause and cause-specific mortality in diabetes patients and further determined the optimal threshold for the relationship between HDL-C and mortality.
Materials and Methods
Study Population
In the present study, all participants were included from the 1999–2014 National Health and Nutrition Examination Surveys (NHANES). Detailed information about the NHANES has been published elsewhere.13,14 Briefly, the NHANES survey was a multistage, stratified sampling design on nationally representative civilian non-institutionalized US population.13,14 We enrolled participants who were aged ≥18 years and with data on HDL-C measurement. Subjects who were missing data follow-up and without diagnosis of diabetes at baseline were excluded. After applying the inclusion criteria, our final sample size contained 6549 participants (Figure 1). All participants have provided informed consent before study. The survey was approved by the National Center for Health Statistics/Centers for Disease Control and Prevention ethics review board and with the Helsinki Declaration of 1975, as revised in 2008.
 |
Figure 1 Research flow chart. |
Lipids Measurement
Fasting samples were obtained from peripheral venous blood and stored under appropriate frozen conditions until they were shipped to Johns Hopkins University (Hitachi 717 and Hitachi 912, Roche Diagnostics, 9115 Hague Road, Indianapolis, IN 46,250) or Minnesota University (Roche Modular P, Roche Diagnostics, 9115 Hague Road, Indianapolis, IN 46,250) Lipoprotein Analytical Lab for testing. Blood lipid measurement including triglycerides (TG), total cholesterol (TC), HDL-C and low-density lipoprotein cholesterol (LDL-C). TC and TG were measured enzymatically, HDL-C was measured by using a heparin-manganese precipitation method or a direct immunoassay technique. LDL-C (where all values are expressed in mg/dL) was calculated according to the Friedewald calculation: LDL-C = TC–HDL-C – TG/5 when TG was less than or equal to 400 mg/dL.15 In addition, fasting blood glucose (FBG), glycohemoglobin (HbA1C), C-reactive protein and creatinine were also tested by using standard methods. The NHANES quality control and quality assurance protocols have met the 1988 Clinical Laboratory Improvement Act requirements.
Covariate Collection
Standard examinations and questionnaire were administered by trained health technicians, interviewers, and physicians. Participants have provided information on demographic (age, gender and race), socioeconomic (educational attainment and marriage), lifestyle and behavior factors (smoking) and health-related questions (hypertension, diabetes, cardiovascular disease, cerebrovascular disease and cancer), and have attended physical examinations (including body weight, height and blood pressure). Information on current medication such as antihypertensive, anti-diabetes, antiplatelet and lipid-lowering medications were collected. Body mass index (BMI, kg/m2) was calculated by using weight (kg)/height2 (m2). Estimated glomerular filtration rate (eGFR) was calculated using Modification of Diet in Renal Disease formula. Subjects who had one or more of the following criteria were defined as hypertension: (1) self-reported hypertension previously diagnosed by a physician, (2) taking antihypertensive drugs, (3) systolic and/or diastolic blood pressure (SBP/DBP) ≥140/90mmHg.16 Diabetes was defined as having a history of diabetes, or taking anti-diabetes medications, or FBG ≥7.0 mmol/l (126 mg/dl), or HbA1C ≥6.5%.17
Outcome Ascertainment
Study endpoints for the present study were all-cause, cardiovascular and cancer mortality. Mortality status of the NHANES was obtained from data from the National Death Index through December 31, 2014. We classified causes of mortality based on the codes of ICD-10 (international statistical classification of diseases, 10th revision). For instance, codes I00-I09, I11, I13, and I20-I51 for cardiovascular mortality, codes I60-I69 for death from cerebrovascular diseases, and codes C00-C97 for cancer mortality.18
Statistical Analyses
Continuous variables are presented as mean ± standard deviation and categorical variables are presented as percentage where appropriate. Subgroup differences were analyzed by one-way ANOVA or Chi-square tests depending on the types of variables. HDL-C were grouped into quintiles (Q1: ≤0.96 mmol/L (37.00 mg/dL), Q2: 0.97–1.11 mmol/L (38.00–43.00 mg/dL), Q3: 1.12–1.31 mmol/L (44.00–50.00 mg/dL), Q4: 1.32–1.53 mmol/L (51.00–59.00 mg/dL), Q5: ≥1.54 mmol/L (60.00 mg/dL), and we used the group with the lowest risk (Q4) as the reference group according to previous studies.9,10,19,20 The Cox proportional hazards model was used for exploring the association of HDL-C with all-cause, cardiovascular and cancer mortality. To further explore the relationship between HDL-C and mortality, multivariate adjusted restrictive cubic curves and generalized additive model were performed. The results were expressed as hazard ratios (HRs) and 95% confidence intervals (CI). Model I only included HDL-C, Model II was adjusted for age, gender and BMI. Model III was further adjusted for race, education level, smoking, SBP, eGFR, HbA1C, TC, comorbidities and medicines used. If a nonlinear relationship was detected, a two-piecewise Cox proportional hazards model on both sides of the inflection point, and log likelihood ratio test were performed. Survival analysis was performed using standardized Kaplan–Meier curves and Log rank test. In addition, the subgroup analysis including age (<65 or ≥65 years), gender (male or female), race (White or non-White), hypoglycemic agents (yes or no) and taking lipid-lowering drugs (yes or no). All statistical analyses were performed using R version 3.3.2 (R Foundation for Statistical Computing, Vienna, Austria), and P < 0.05 was considered as statistically significant.
Results
Baseline Characteristics
There were 6549 diabetic patients being included, and among them, 3372 (51.49%) were men. The mean concentration of HDL-C was 1.24 mmol/L. The baseline characteristics according to HDL-C level are summarized in Table 1. There were significant subgroup differences in age, gender, education level, BMI, HbA1C, TG, TC, taking lipid-lowering drugs (all P <0.05), but race, smoking, SBP, DBP, eGFR, FBG, LDL-C, hypertension, CVD, cancer, taking antihypertensive drugs, hypoglycemic agents and antiplatelet drugs have no significant differences (all P > 0.05).
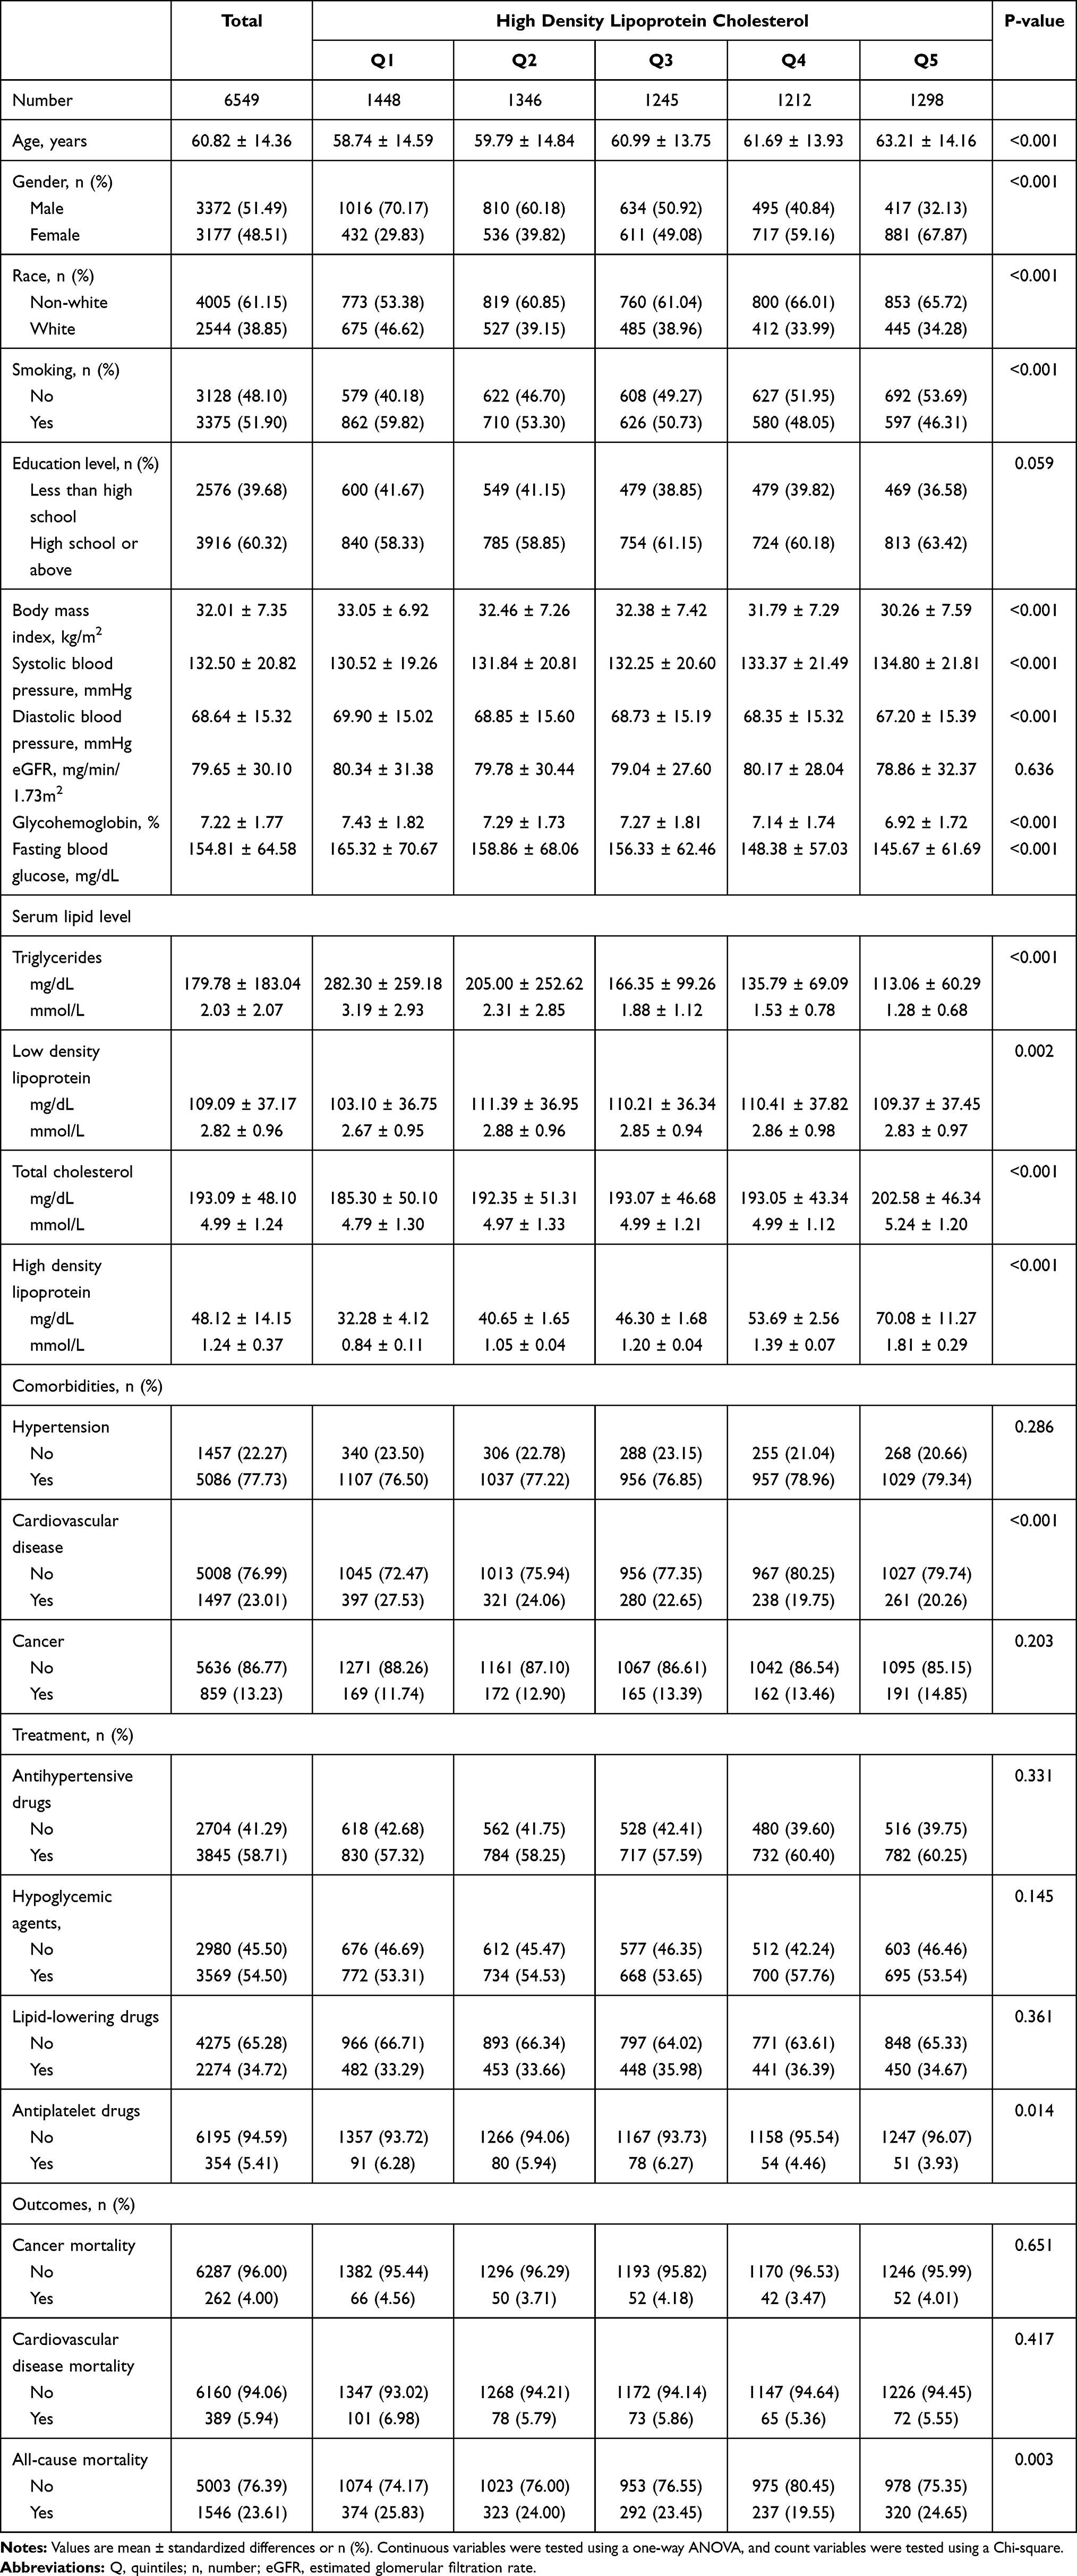 |
Table 1 Baseline Characteristics According to High-Density Lipoprotein Cholesterol Levels |
In addition, during a median follow-up of 82.36 ± 50.11 months, 1546 (23.61%) cases of all-cause, 389 (5.94%) cardiovascular and 262 (4.00%) cancer mortality have occurred, respectively. From Q1 to Q5 group according to HDL-C level, there was a significant difference in the incidence of all-cause mortality, but there was no significant differences in the incidence of cardiovascular and cancer mortality (Table 1). The survival curve analysis of HDL-C and all-cause (Figure 2A), cardiovascular (Figure 2B) and cancer (Figure 2C) mortality is presented in Figure 2.
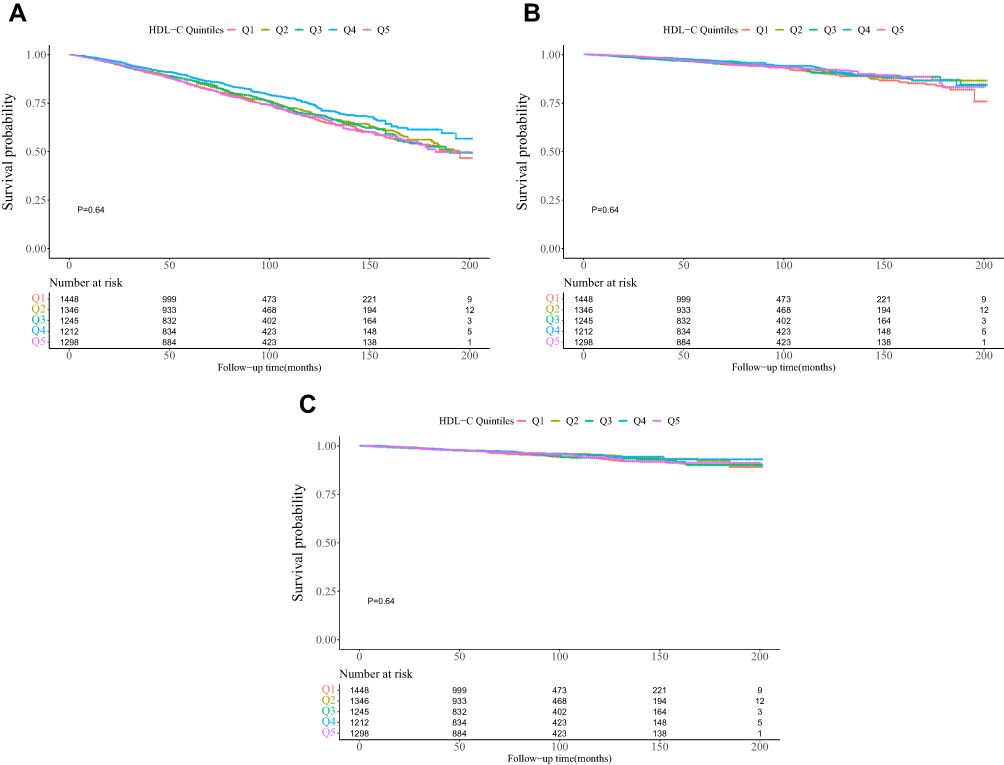 |
Figure 2 Kaplan-Meier survival curves for all-cause (A), cardiovascular (B), and cancer (C) mortality by high density lipoprotein cholesterol groups. |
Relationship Between HDL-C and Mortality
HDL-C concentration and mortality risk is summarized in Table 2. After adjustment for the covariates, and using Q4 (1.32 to 1.53 mmol/L) as a reference, the fully adjusted HRs of groups with the highest (≥1.54 mmol/L) and lowest (≤0.96 mmol/L) HDL-C level were 1.30 (95% CI: 1.09, 1.56; P=0.0046) and 1.20 (95% CI: 1.00, 1.44; P=0.0481), respectively, for all-cause mortality (P for trend =0.113). However, there was no statistical significance for the association of HDL-C with cardiovascular and cancer mortality. Compared to the reference group (Q4), the fully adjusted HRs for cardiovascular mortality among the highest and lowest were 1.22 (95% CI: 0.86, 1.74; P=0.2686) and 1.01 (95% CI: 0.70, 1.46; P=0.9640) (P for trend =0.327), respectively. Similarly, the fully adjusted HRs for cancer mortality among the highest and lowest were 1.15 (95% CI: 0.76, 1.75; P=0.5021) and 1.05 (95% CI: 0.69, 1.61; P=0.8227) (P for trend =0.722), respectively.
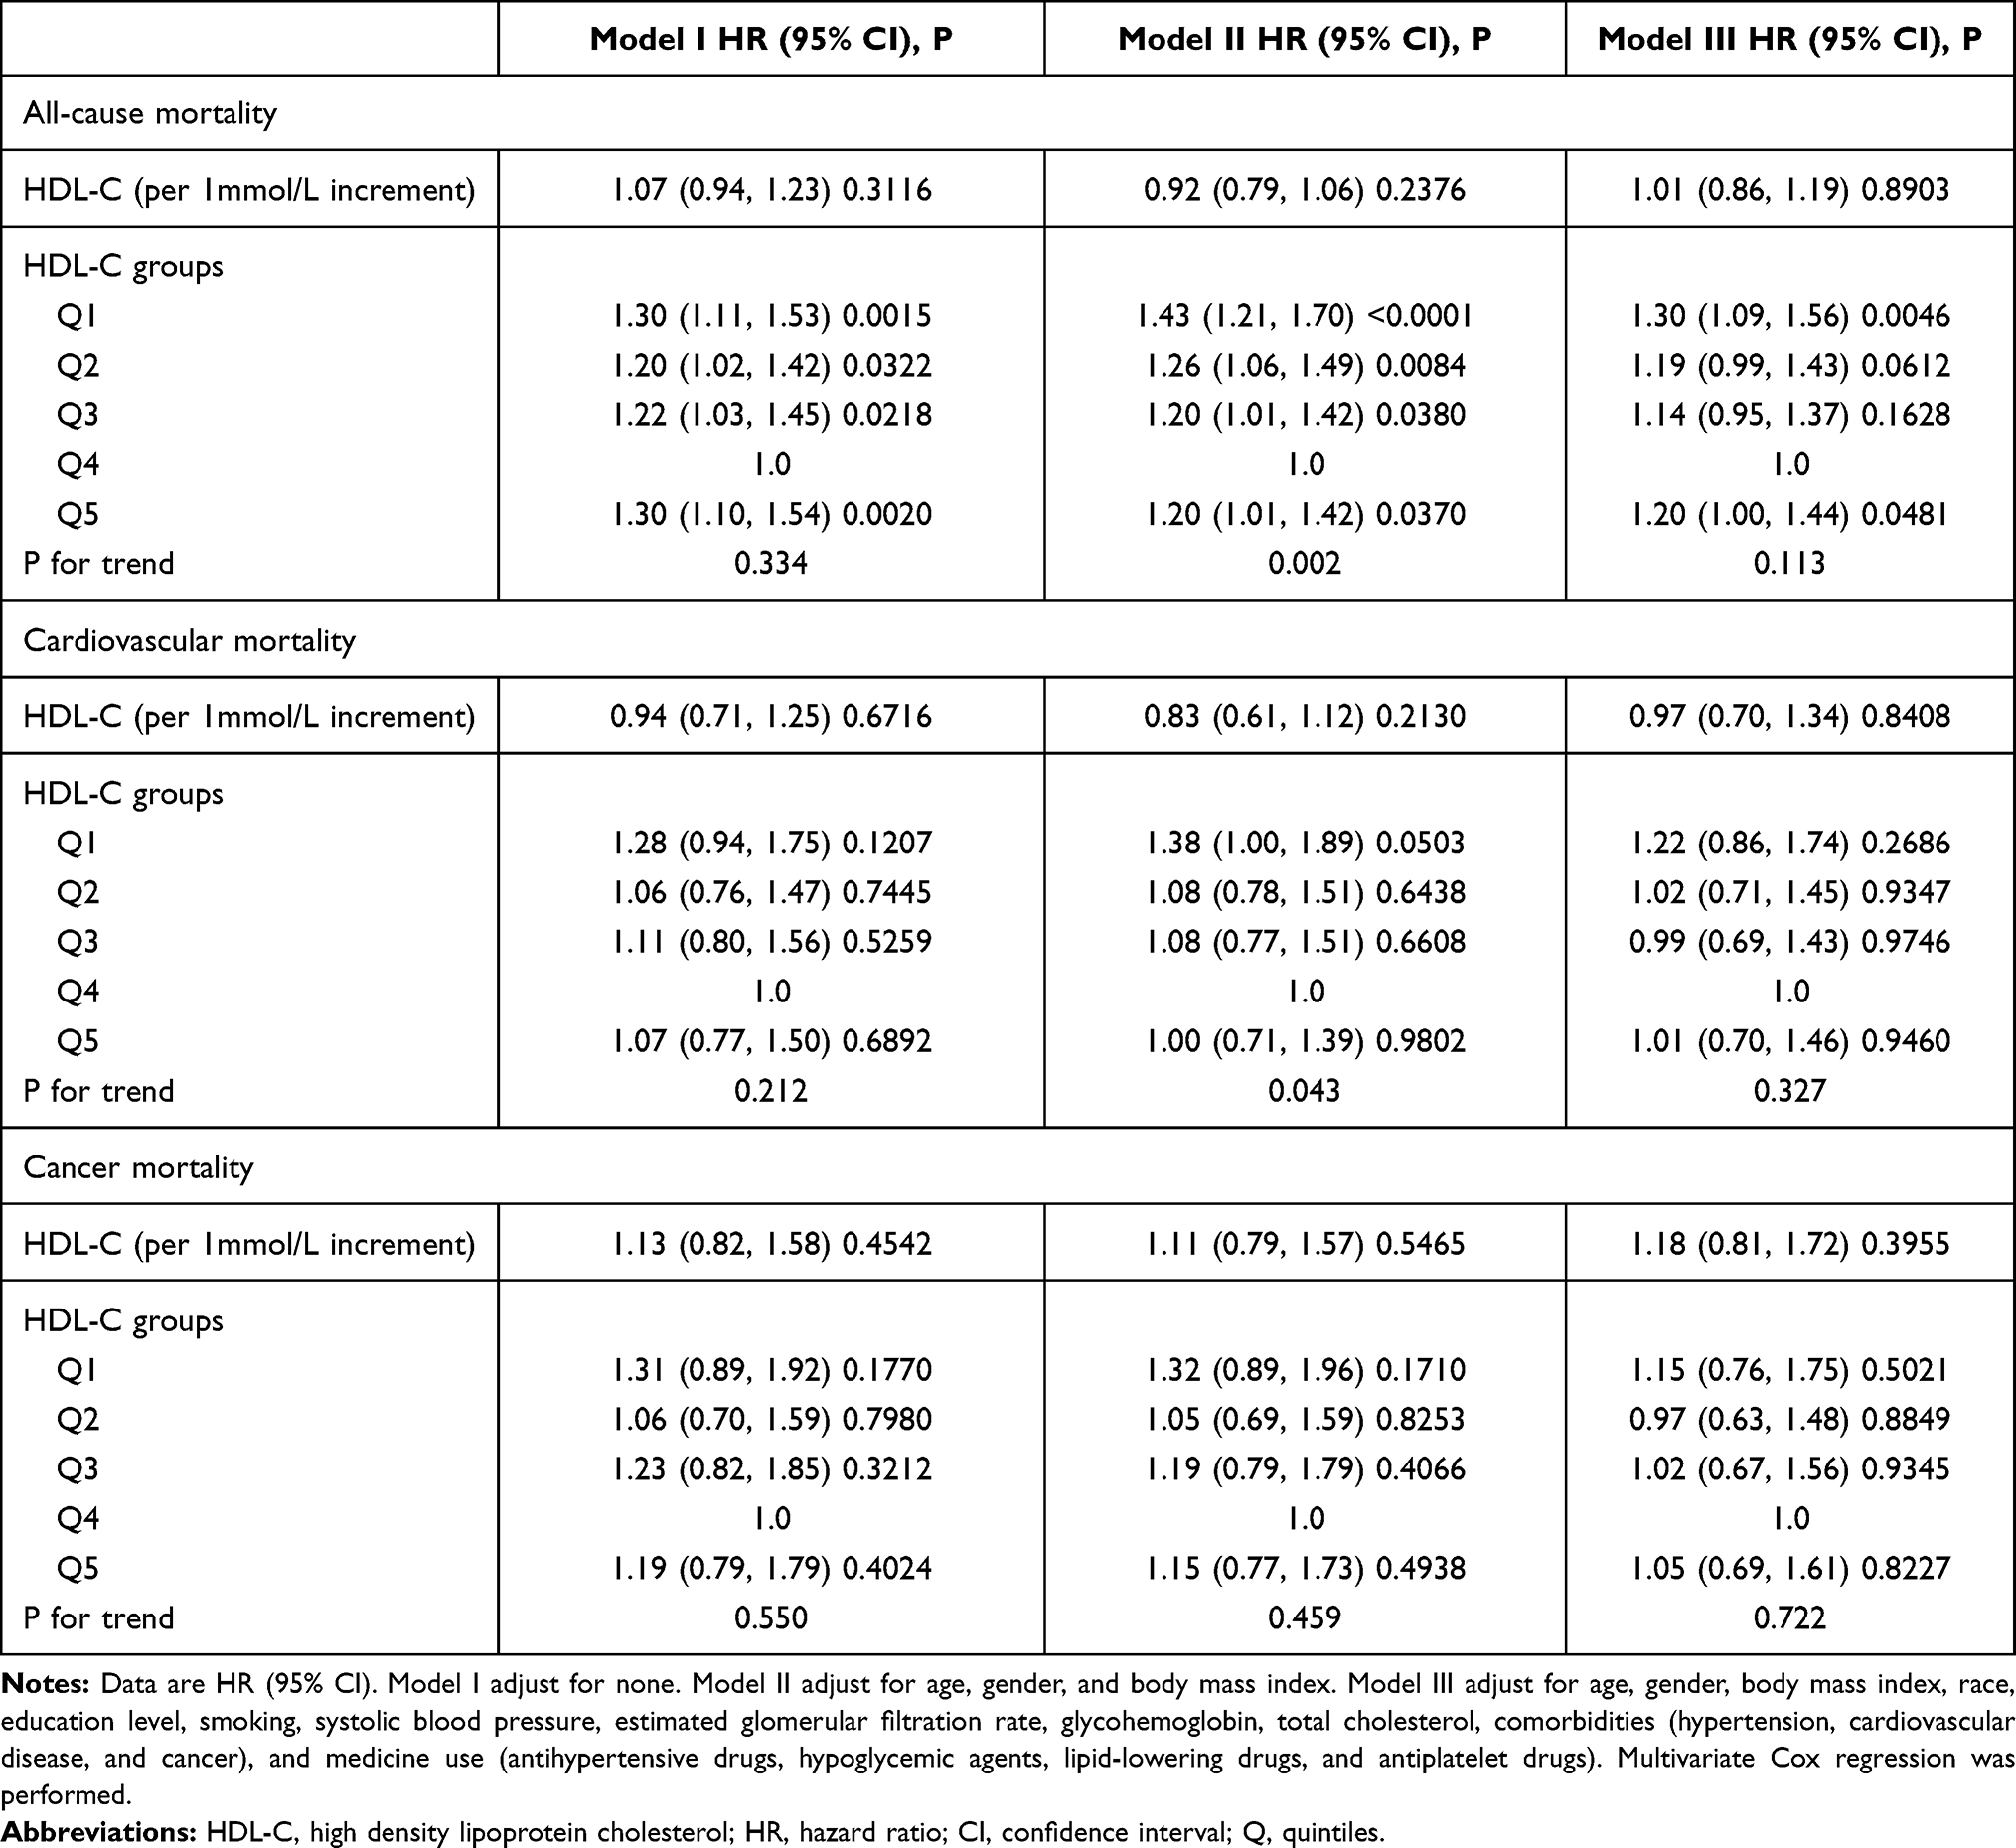 |
Table 2 Multivariate Cox Regression Analysis of HDL-C Levels with Cause-Specific Mortality |
A Non-Linear Relationship Between HDL-C and Mortality
The nonlinear association of HDL-C and mortality were examined by using multivariate Cox proportional hazards models with a generalized additive model (GAM) and penalized spline methods. The multivariate adjusted restrictive cubic curve showed that the relationship between HDL-C and all-cause mortality (Figure 3A) was in U-shaped, but similar non-linear relationship was not found for cardiovascular (Figure 3B) and cancer (Figure 3C) mortality. In addition, a two-piecewise Cox proportional hazards model was conducted to explore the minimum value of HDL-C and mortality risk. As shown in Table 3, a nonlinear relationship between HDL-C and all-cause mortality was found (P for log likelihood ratio test<0.001), but we did not found significant difference in cardiovascular (P for log likelihood ratio test=0.218) and cancer (P for log likelihood ratio test=0.009) mortality. The optimal cut-off point of HDL-C for all-cause, cardiovascular and cancer were 1.36 mmol/L (53 mg/dL), 1.28 mmol/L (49 mg/dL) and 1.89 mmol/L (73 mg/dL), respectively. When HDL-C was ≥1.36 mmol/L, 1.28 mmol/L and 1.89 mmol/L, increased HDL-C was significantly associated with an increased risk for all-cause (HR = 1.50, 95% CI: 1.16, 1.94; P = 0.0018), cardiovascular (HR = 1.23, 95% CI: 0.76, 2.01; P =0.4036) and cancer (HR = 3.83, 95% CI: 1.76, 8.34; P = 0.0007) mortality. However, when HDL-C was <1.36 mmol/L, 1.28 mmol/L and 1.89 mmol/L, HDL-C was inversely associated with the risk for all-cause (HR = 0.62, 95% CI: 0.38, 1.03; P = 0.066), cardiovascular (HR = 0.66, 95% CI: 0.33, 1.31; P =0.2319) and cancer (HR =0.83, 95% CI: 0.53, 1.30; P = 0.4159) mortality, respectively.
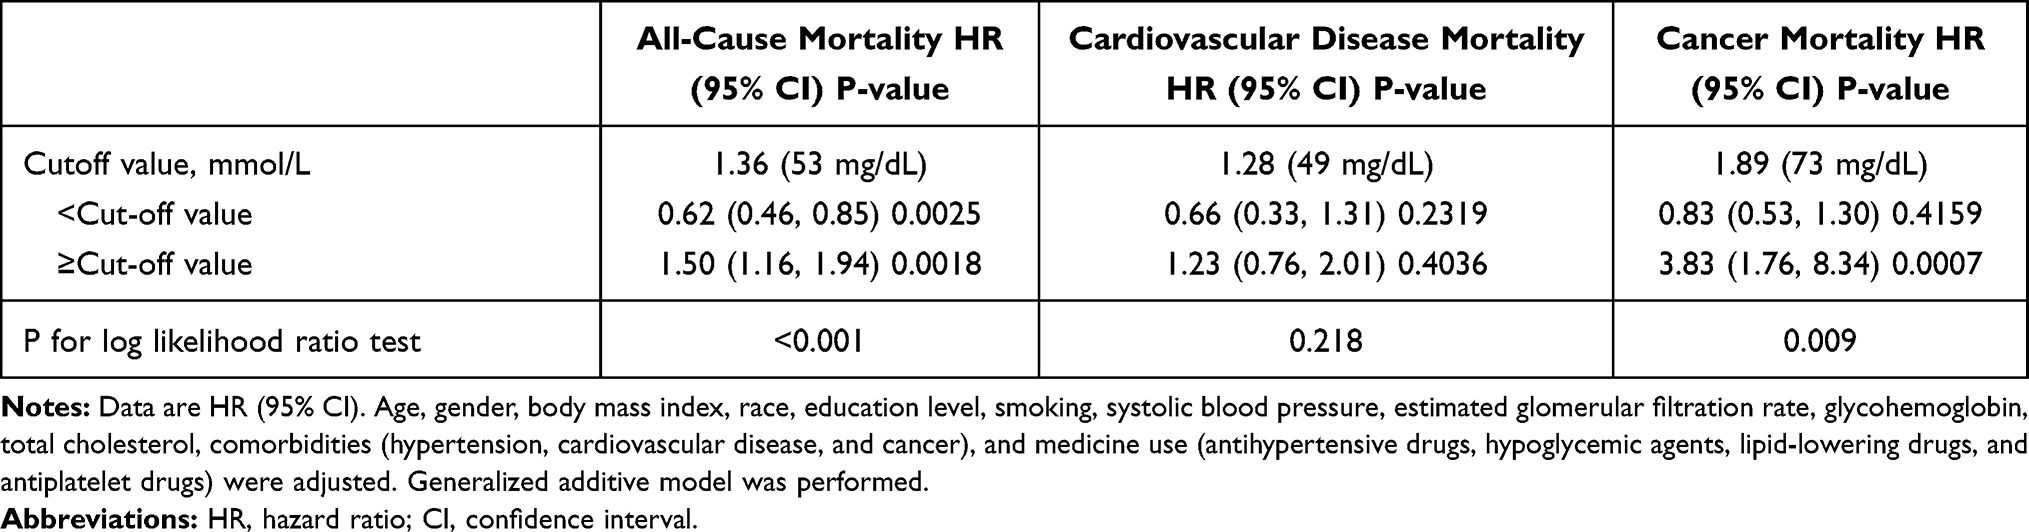 |
Table 3 The Results of Two-Piecewise Linear Regression Model Between High-Density Lipoprotein Cholesterol and Cause-Specific Mortality |
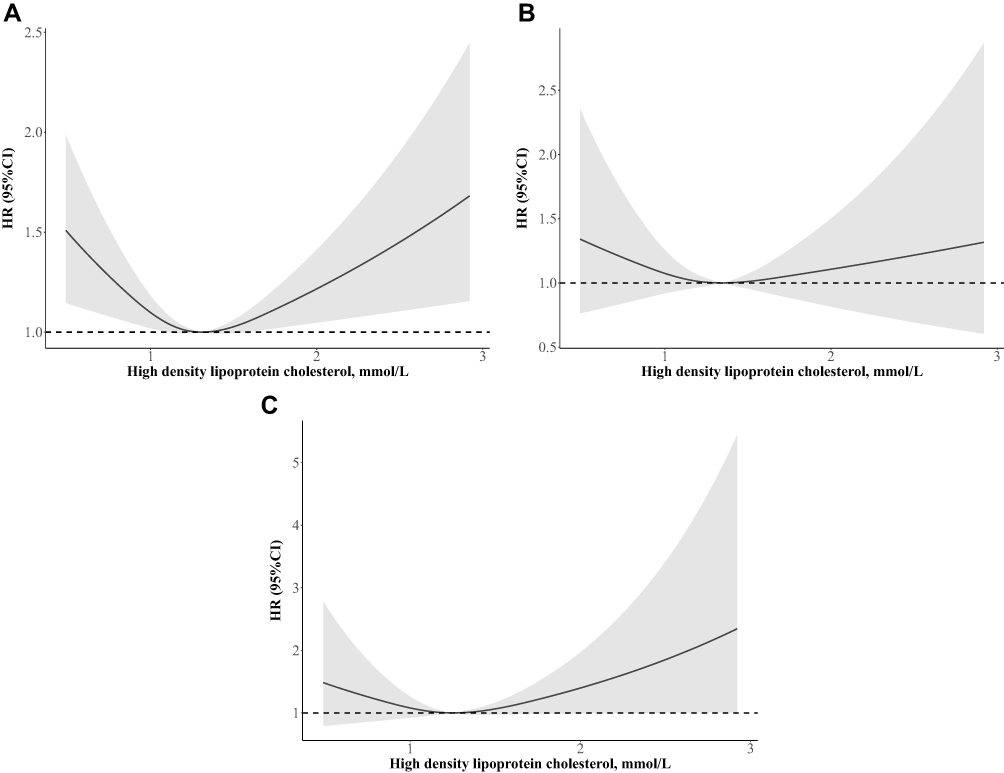 |
Figure 3 Adjusted spline curves analyze for the association of high density lipoprotein cholesterol with all-cause (A), cardiovascular (B), and cancer (C) mortality. Age, gender, body mass index, race, education level, smoking, systolic blood pressure, estimated glomerular filtration rate, glycohemoglobin, total cholesterol, comorbidities (hypertension, cardiovascular disease, and cancer), and medicine use (antihypertensive drugs, hypoglycemic agents, lipid-lowering drugs, and antiplatelet drugs) were adjusted. |
Subgroup Analyses
The stratified analyses are shown in Table 4. When HDL-C ≤1.36 mmol/L, reduced HDL-C was significantly decreased the risk of all-cause mortality in subjects with aged ≥65 years (HR=0.59, 95% CI: 0.41, 0.84; P=0.0036), female population (HR=0.46, 95% CI: 0.28, 0.76; P=0.0021), non-White population (HR=0.61, 95% CI: 0.39, 0.95; P=0.0286), without taking lipid-lowering drugs (HR=0.61, 95% CI: 0.40, 0.95; P=0.0283) and taking hypoglycemic agents (HR=0.59, 95% CI: 0.39, 0.90; P=0.0140); when HDL-C ≥1.36 mmol/L, increased HDL-C was significantly increased the risk of all-cause mortality in subjects with aged ≥65 years (HR =1.59, 95% CI: 1.19, 2.12; P=0.0018), male population (HR =2.08, 95% CI: 1.39, 3.12; P =0.004), non-White population (HR=1.50, 95% CI: 1.07, 2.10; P=0.0174), without taking lipid-lowering drugs (HR=1.57, 95% CI: 1.19, 2.07; P=0.0013) and without taking hypoglycemic agents (HR=1.55, 95% CI: 1.10, 2.18; P=0.0120), respectively. Similar results were found when HDL-C was ≥1.89 mmol/L, increased HDL-C was significantly increased the risk of cancer mortality in subjects with aged ≥65 years, male and non-White population, without taking lipid-lowering drugs and hypoglycemic agents.
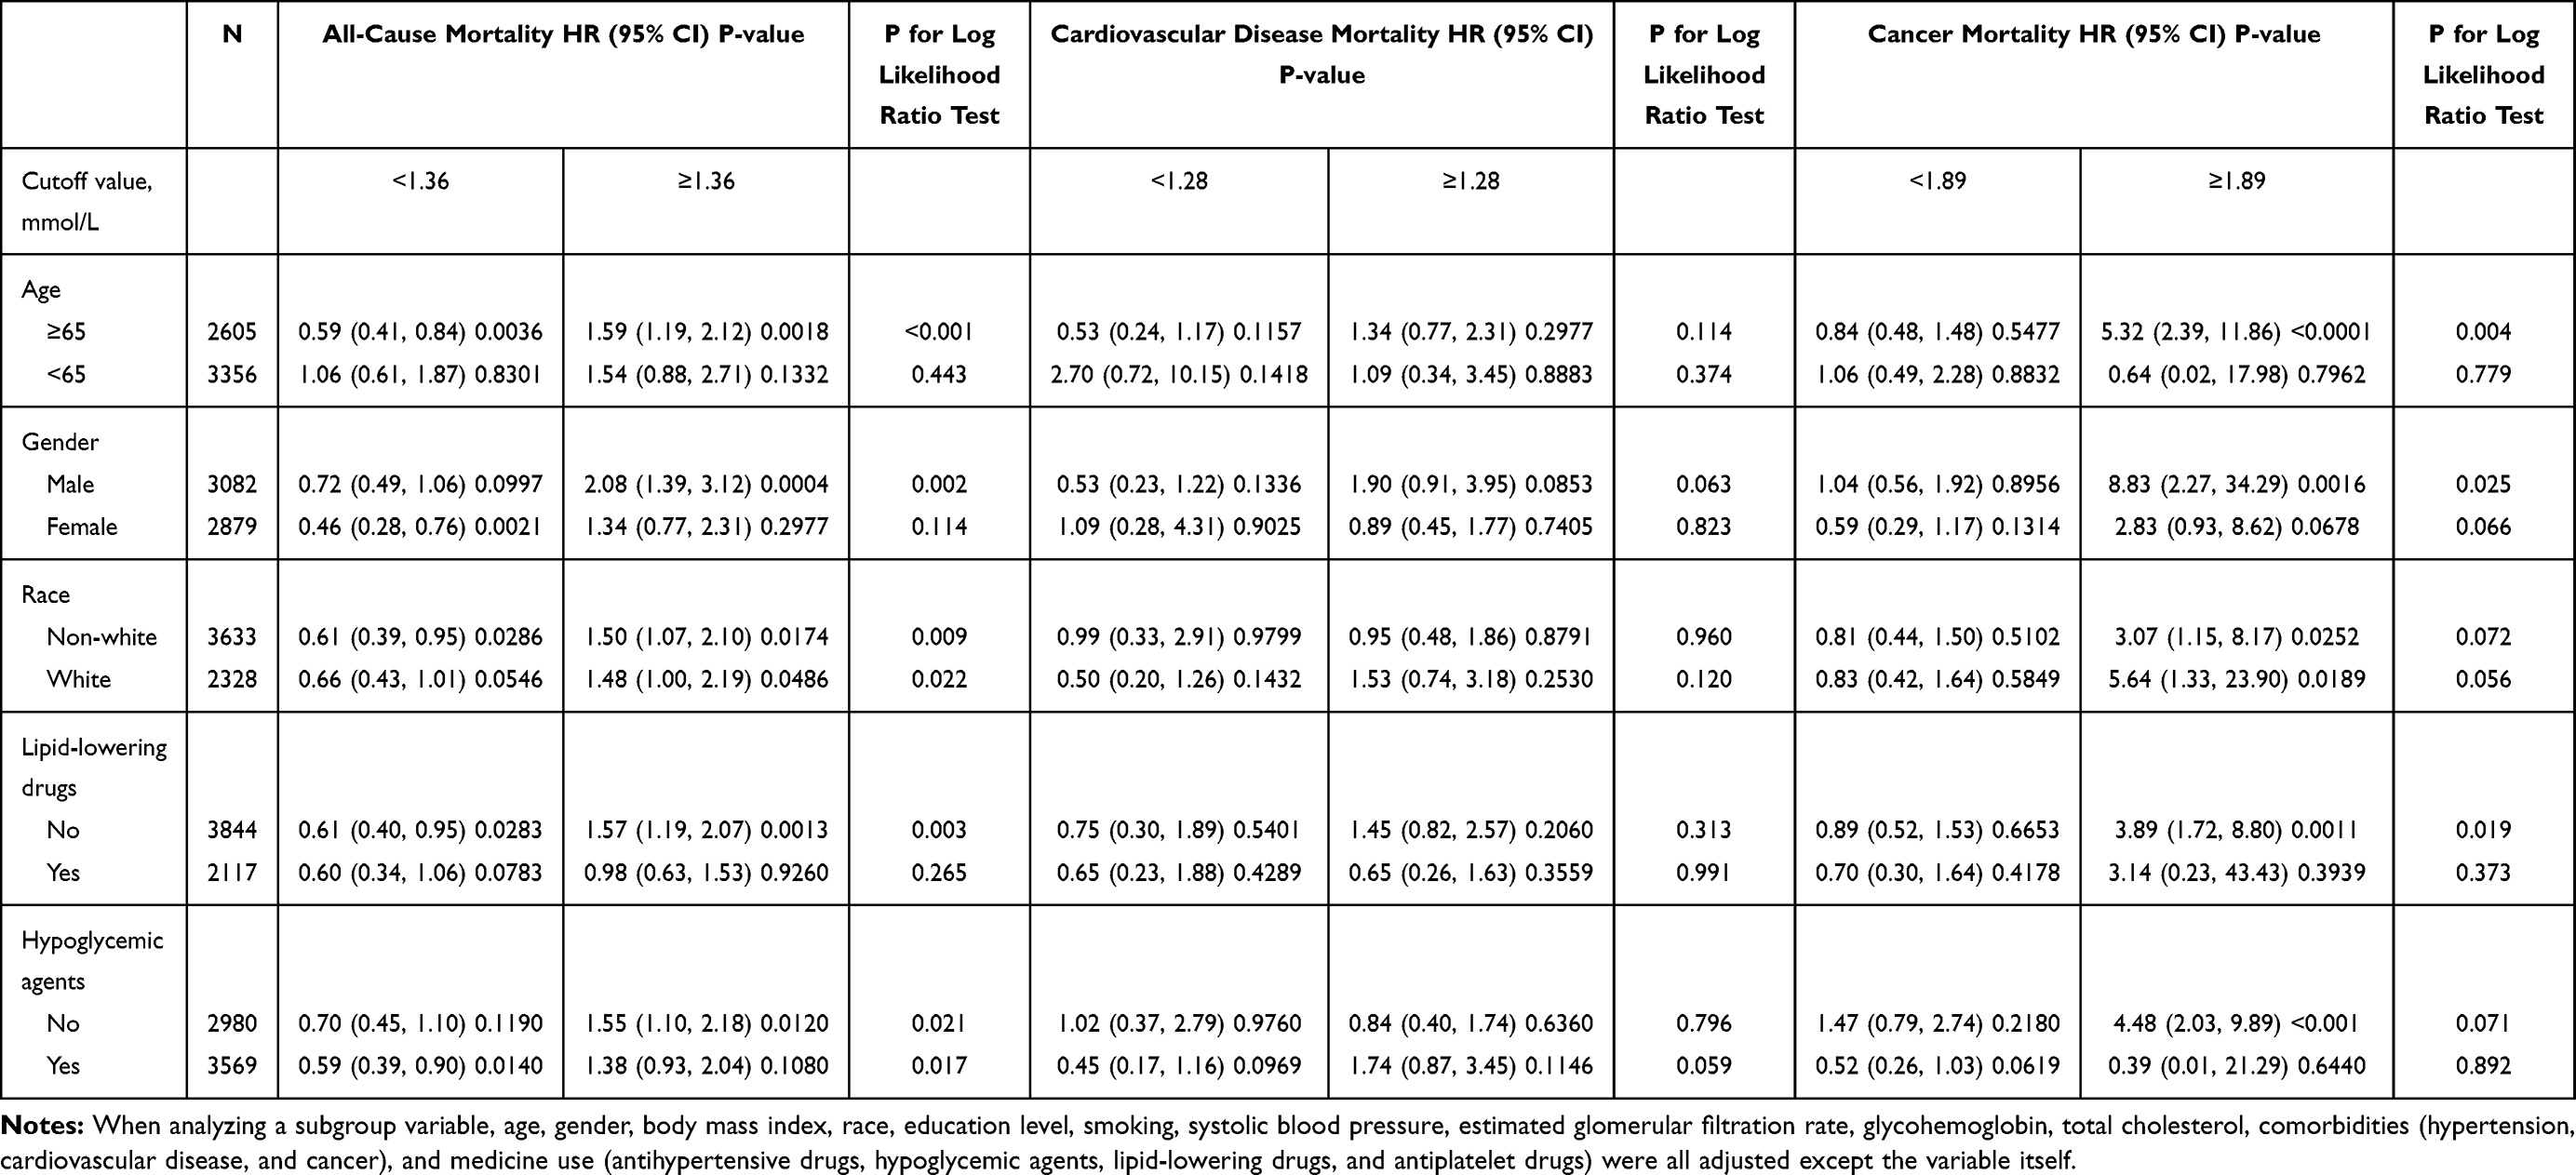 |
Table 4 Subgroups Analysis |
Discussion
In this population-based cohort study, we found that both low and high HDL-C levels were significantly associated with increased risk of all-cause mortality among diabetic patients, and relationship was U-shaped in nature. We observed that the HDL-C level was linked with the lowest risk of all-cause, cardiovascular and cancer mortality at 1.36 mmol/L, 1.28 mmol/L and 1.89 mmol/L, respectively, and that the optimal HDL-C concentration range was between 1.32 and 1.53 mmol/L (51 and 59 mg/dL) for a lower risk of all-cause death.
Our results were similar to previous studies. Over the past decade, there were extensive studies to find U-shaped relationship between HDL-C levels and mortality.9,10,19,20 In addition, we also found there were nonlinear associations of HDL-C with cardiovascular and cancer mortality. Our results were consistent with a pooled analysis of 37 prospective cohort studies to show that HDL-C associated with mortality from cardiovascular and cancer in a nonlinear manner.8 In our study, although both higher and lower HDL-C were associated with an increased risk of cardiovascular and cancer mortality compared to the lowest risk group (HDL-C: 1.32–1.53 mmol/L), the association was not statistically significant. The null association being found for cardiovascular and cancer mortality was different from some recent data.21,22 Indeed, a previous study demonstrated that higher HDL-C was related to increased risk of all-cause mortality only in high-risk patients with type 2 diabetes and for those with very low LDL-C levels.11 Therefore, the non-linear association observed in our study needs to be validated by more studies with a larger sample size.
Subgroup analysis showed that the relationship between HDL-C and death was heterogeneous according to gender, age, race, and lipid-lowering drugs. We speculated that the main reason may be attributed by the small sample size. Li et al10 found that higher HDL-C levels with an increased risk for all-cause mortality only in younger participants (<65 years old). Mazidi et al23 revealed that there were racial differences between HDL-C and death. Another study demonstrated that lower HDL-C (<1.03 mmol/L) was associated with risk of higher all-cause, cardiovascular and cancer mortality in men and women, but higher HDL-C (>1.55 mmol/L) was associated with a lower risk of all-cause, cardiovascular and cancer mortality in women but not in men.22 In addition, meta-analyses indicated HDL-C-elevating drugs such as niacin and cholesteryl ester transfer protein inhibitors did not influence the occurrence of mortality.12,24 Therefore, whether higher HDL-C was beneficial still needed more researches.
The mechanisms between HDL-C levels and the risk of mortality are still not completely clear. Genetic variance may be a reason, and several genetic variants such as ABCA1 and CETP, which have been found to relate to HDL-C levels and have adverse effects on health outcomes.25,26 Mendelian randomisation studies demonstrated that some genetic mechanisms that raised plasma HDL-C did not relate to a lower risk of cardiovascular diseases.27,28 Besides, HDL-C is closely related to apoA1 metabolism. It has been shown that an increased HDL-C/Apo A-I ratio may be a shared risk factor for cardiovascular, cancer and all-cause mortality.29 Indeed, diabetes was characterized not only by low HDL-C levels but also by defective HDL function, and functional HDL deficiency is intimately associated with alterations in intravascular HDL metabolism and structure.30 Finally, the composition and particle size of HDL-C may also play a role.
The long period of follow-up and rigorous procedure for sampling and data collection in the NHANES study have made the study findings reliable. Nevertheless, this study also has several limitations. First, the relatively small sample size was an important disadvantage. Second, it was an observational study rather than an intervention study; therefore, the quality of evidence might not be the highest. Third, the absence of many covariates may have a certain impact on the results. Fourth, some risk factors such as physical activity, types of lipid-lowering drugs, menopausal status, duration of diabetes, income and marriage status were missing in this study. Fifth, some covariates were self-reported and might lead to recall bias. Sixth, we cannot obtain details on lipid-lowering drug medication and type of anti-diabetic drugs, also cannot get information about menopausal status. In addition, the collection of HDL-C was only conducted at baseline. Finally, our study only focused on the association between HDL-C and mortality, but did not explore the relationship with cardiovascular events.
Conclusions
In conclusion, our study indicated that the relationship of HDL-C with all-cause, cardiovascular and cancer mortality was non-linear among diabetic patients. Our results suggested that both lower and higher levels were associated with an increased risk of mortality. The optimal HDL-C concentration for all-cause mortality was probably between 1.32 and 1.53 mmol/L (51 and 59 mg/dL).
Data Sharing Statement
Data are available in a public, open access repository. Data availability in https://wwwn.cdc.gov/nchs/nhanes/Default.Aspx.
Funding
There is no funding to report.
Disclosure
The authors of this paper reported no conflicts of interest.
References
1. Gordon T, Castelli WP, Hjortland MC, et al. High density lipoprotein as a protective factor against coronary heart disease. The Framingham Study. Am J Med. 1977;62(5):707–714. doi:10.1016/0002-9343(77)90874-9
2. Barter P, Gotto AM, LaRosa JC, et al. HDL cholesterol, very low levels of LDL cholesterol, and cardiovascular events. N Engl J Med. 2007;357(13):1301–1310. doi:10.1056/NEJMoa064278
3. Kaysen GA, Ye X, Raimann JG, et al. Lipid levels are inversely associated with infectious and all-cause mortality: international MONDO study results. J Lipid Res. 2018;59(8):1519–1528. doi:10.1194/jlr.P084277
4. Okamura T, Hayakawa T, Kadowaki T, et al. The inverse relationship between serum high-density lipoprotein cholesterol level and all-cause mortality in a 9.6-year follow-up study in the Japanese general population. Atherosclerosis. 2006;184(1):143–150. doi:10.1016/j.atherosclerosis.2005.03.042
5. Kinoshita M, Yokote K, Arai H, et al. Japan Atherosclerosis Society (JAS) guidelines for prevention of atherosclerotic cardiovascular diseases 2017. J Atheroscler Thromb. 2018;25(9):846–984. doi:10.5551/jat.GL2017
6. Arnett DK, Blumenthal RS, Albert MA, et al. 2019 ACC/AHA guideline on the primary prevention of cardiovascular disease: a report of the American College of Cardiology/American Heart Association Task Force on Clinical Practice Guidelines. Circulation. 2019;140(11):e596–e646. doi:10.1161/CIR.0000000000000678
7. Zewinger S, Speer T, Kleber ME, et al. HDL cholesterol is not associated with lower mortality in patients with kidney dysfunction. J Am Soc Nephrol. 2014;25(5):1073–1082. doi:10.1681/ASN.2013050482
8. Zhong G-C, Huang S-Q, Peng Y, et al. HDL-C is associated with mortality from all causes, cardiovascular disease and cancer in a J-shaped dose-response fashion: a pooled analysis of 37 prospective cohort studies. Eur J Prev Cardiol. 2020;27(11):2047487320914756. doi:10.1177/2047487320914756
9. Hamer M, O’Donovan G, Stamatakis E. High-density lipoprotein cholesterol and mortality: too much of a good thing? Arterioscler Thromb Vasc Biol. 2018;38(3):669–672. doi:10.1161/ATVBAHA.117.310587
10. Li X, Guan B, Wang Y, et al. Association between high-density lipoprotein cholesterol and all-cause mortality in the general population of northern China. Sci Rep. 2019;9(1):14426. doi:10.1038/s41598-019-50924-4
11. Sharif S, van der Graaf Y, Nathoe HM, et al. HDL cholesterol as a residual risk factor for vascular events and all-cause mortality in patients with type 2 diabetes. Diabetes Care. 2016;39(8):1424–1430. doi:10.2337/dc16-0155
12. Keene D, Price C, Shun-Shin MJ, et al. Effect on cardiovascular risk of high density lipoprotein targeted drug treatments niacin, fibrates, and CETP inhibitors: meta-analysis of randomised controlled trials including 117,411 patients. BMJ. 2014;349(jul18 2):g4379. doi:10.1136/bmj.g4379
13. Ford ES, Giles WH, Dietz WH. Prevalence of the metabolic syndrome among US adults: findings from the third National Health and Nutrition Examination Survey. JAMA. 2002;287(3):356–359. doi:10.1001/jama.287.3.356
14. Palmer MK, Toth PP. Trends in lipids, obesity, metabolic syndrome, and diabetes mellitus in the United States: an NHANES analysis (2003–2004 to 2013–2014). Obesity. 2019;27(2):309–314. doi:10.1002/oby.22370
15. Friedewald WT, Levy RI, Fredrickson DS. Estimation of the concentration of low-density lipoprotein cholesterol in plasma, without use of the preparative ultracentrifuge. Clin Chem. 1972;18(6):499–502. doi:10.1093/clinchem/18.6.499
16. James PA, Oparil S, Carter BL, et al. 2014 evidence-based guideline for the management of high blood pressure in adults: report from the panel members appointed to the Eighth Joint National Committee (JNC 8). JAMA. 2014;311(5):507–520. doi:10.1001/jama.2013.284427
17. Association AD. Classification and diagnosis of diabetes: standards of medical care in diabetes-2018. Diabetes Care. 2018;41(Suppl 1):S13–S27. doi:10.2337/dc18-S002
18. Chen C, Ye Y, Zhang Y, et al. Weight change across adulthood in relation to all cause and cause specific mortality: prospective cohort study. BMJ. 2019;367:l5584. doi:10.1136/bmj.l5584
19. Oh IH, Hur JK, Ryoo JH, et al. Very high high-density lipoprotein cholesterol is associated with increased all-cause mortality in South Koreans. Atherosclerosis. 2019;283:43–51. doi:10.1016/j.atherosclerosis.2019.01.035
20. Bowe B, Xie Y, Xian H, et al. High density lipoprotein cholesterol and the risk of all-cause mortality among U.S. veterans. Clin J Am Soc Nephrol. 2016;11(10):1784–1793. doi:10.2215/CJN.00730116
21. Madsen CM, Varbo A, Nordestgaard BG. Extreme high high-density lipoprotein cholesterol is paradoxically associated with high mortality in men and women: two prospective cohort studies. Eur Heart J. 2017;38(32):2478–2486. doi:10.1093/eurheartj/ehx163
22. Navaneethan SD, Schold JD, Walther CP, et al. High-density lipoprotein cholesterol and causes of death in chronic kidney disease. J Clin Lipidol. 2018;12(4):1061–1071.e7. doi:10.1016/j.jacl.2018.03.085
23. Mazidi M, Mikhailidis DP, Banach M. Associations between risk of overall mortality, cause-specific mortality and level of inflammatory factors with extremely low and high high-density lipoprotein cholesterol levels among American adults. Int J Cardiol. 2019;276:242–247. doi:10.1016/j.ijcard.2018.11.095
24. Verdoia M, Schaffer A, Suryapranata H, et al. Effects of HDL-modifiers on cardiovascular outcomes: a meta-analysis of randomized trials. Nutr Metab Cardiovasc Dis. 2015;25(1):9–23. doi:10.1016/j.numecd.2014.09.003
25. Frikke-Schmidt R. Genetic variation in the ABCA1 gene, HDL cholesterol, and risk of ischemic heart disease in the general population. Atherosclerosis. 2010;208(2):305–316. doi:10.1016/j.atherosclerosis.2009.06.005
26. Genga KR, Trinder M, Kong HJ, et al. CETP genetic variant rs1800777 (allele A) is associated with abnormally low HDL-C levels and increased risk of AKI during sepsis. Sci Rep. 2018;8(1):16764. doi:10.1038/s41598-018-35261-2
27. Voight BF, Peloso GM, Orho-Melander M, et al. Plasma HDL cholesterol and risk of myocardial infarction: a Mendelian randomisation study. Lancet. 2012;380(9841):572–580. doi:10.1016/S0140-6736(12)60312-2
28. Holmes MV, Ala-Korpela M, Smith GD. Mendelian randomization in cardiometabolic disease: challenges in evaluating causality. Nat Rev Cardiol. 2017;14(10):577–590. doi:10.1038/nrcardio.2017.78
29. Sung K-C, Ryu S, Wild SH, et al. An increased high-density lipoprotein cholesterol/apolipoprotein A-I ratio is associated with increased cardiovascular and all-cause mortality. Heart. 2015;101(7):553–558. doi:10.1136/heartjnl-2014-306784
30. Kontush A, Chapman MJ. Functionally defective high-density lipoprotein: a new therapeutic target at the crossroads of dyslipidemia, inflammation, and atherosclerosis. Pharmacol Rev. 2006;58(3):342–374. doi:10.1124/pr.58.3.1
 © 2021 The Author(s). This work is published and licensed by Dove Medical Press Limited. The full terms of this license are available at https://www.dovepress.com/terms.php and incorporate the Creative Commons Attribution - Non Commercial (unported, v3.0) License.
By accessing the work you hereby accept the Terms. Non-commercial uses of the work are permitted without any further permission from Dove Medical Press Limited, provided the work is properly attributed. For permission for commercial use of this work, please see paragraphs 4.2 and 5 of our Terms.
© 2021 The Author(s). This work is published and licensed by Dove Medical Press Limited. The full terms of this license are available at https://www.dovepress.com/terms.php and incorporate the Creative Commons Attribution - Non Commercial (unported, v3.0) License.
By accessing the work you hereby accept the Terms. Non-commercial uses of the work are permitted without any further permission from Dove Medical Press Limited, provided the work is properly attributed. For permission for commercial use of this work, please see paragraphs 4.2 and 5 of our Terms.