")
Back to Journals » Neuropsychiatric Disease and Treatment » Volume 20
18F-FDG-PET/CT for Localizing the Epileptogenic Focus in Patients with Different Types of Focal Cortical Dysplasia
Authors Wang F, Hong ST, Zhang Y, Xing Z, Lin YX
Received 4 October 2023
Accepted for publication 28 December 2023
Published 3 February 2024 Volume 2024:20 Pages 211—220
DOI https://doi.org/10.2147/NDT.S442459
Checked for plagiarism Yes
Review by Single anonymous peer review
Peer reviewer comments 2
Editor who approved publication: Dr Roger Pinder
Feng Wang,1,* Shu-Ting Hong,1,* Ying Zhang,2 Zhen Xing,3 Yuan-Xiang Lin1
1Neurosurgery Department, the First Affiliated Hospital of Fujian Medical University, Fuzhou, Fujian, People’s Republic of China; 2Nuclear Medicine Department, the First Affiliated Hospital of Fujian Medical University, Fuzhou, Fujian, People’s Republic of China; 3Radiology Department, the First Affiliated Hospital of Fujian Medical University, Fuzhou, Fujian, People’s Republic of China
*These authors contributed equally to this work
Correspondence: Yuan-Xiang Lin, Neurosurgery Department, the First Affiliated Hospital of Fujian Medical University, Fuzhou, Fujian, People’s Republic of China, Tel +8613906918894, Fax +86-591-83569369, Email [email protected]
Purpose: To determine the diagnostic and localization value of 18F-fluorodeoxyglucose-positron emission tomography (PET)/computed tomography (CT) in patients with focal cortical dysplasia (FCD) who underwent epilepsy surgery.
Methods: One hundred and eight patients with pathologically proven FCD who underwent surgery for refractory epilepsy were retrospectively analyzed. All patients underwent magnetic resonance imaging (MRI), 18F-FDG-PET/CT, and video electroencephalography. An MRI diagnosis of FCD was defined as MRI+. A PET/CT diagnosis of FCD was defined as PET/CT+.
Results: MRI and PET/CT detected FCD in 20.37% and 93.52% of patients, respectively. The difference was significant. Twenty-one patients were MRI+/PET+, 80 were MRI-/PET+, six were MRI-/PET-, and one was MRI+/PET-. The MRI positivity rate was lowest in patients with FCD type IIIa (5.6%, P < 0.05). Prevalence of MRI-/PET+ was highest in patients with FCD type IIIa (88.89%, P < 0.05).
Conclusion: PET/CT is superior to MRI in detecting FCD. FCD type IIIa was more likely than other types to show MRI-/PET+. This suggests that PET/CT has particular diagnostic value for FCD type IIIa patients with negative MRI findings.
Keywords: focal cortical dysplasia, epilepsy, 18F-FDG-PET/CT, pathological types
Introduction
Focal cortical dysplasia (FCD) is caused by dysfunction of neuronal migration or cell proliferation in the cerebral cortex1,2 and is a common cause of drug-resistant epilepsy. FCD is the most common histopathological diagnosis in children undergoing epilepsy surgery and the third most common in adults.3,4
The 2011 International League Against Epilepsy (ILAE) classification of FCD divides FCD into three types. FCD type I is characterized by abnormal cortical layering caused by abnormal radial migration and maturation of neurons (type Ia) or abnormal tangential composition of the six-layered neocortex (type Ib); when both processes are present, the classification is type Ic. FCD type II is characterized by disrupted cortical lamination and specific cytological abnormalities, which differentiate type IIa (dysmorphic neurons without balloon cells) from type IIb (dysmorphic neurons with balloon cells). FCD type III refers to cortical lamination abnormalities associated with a principal lesion. These lesions include hippocampal sclerosis (type IIIa), low-grade developmental brain tumor (type IIIb), vascular malformation (type IIIc), and other lesions acquired during early life (type IIId).5
Surgical resection is the most effective treatment for refractory epilepsy caused by FCD.6 However, a detailed preoperative evaluation is required, including medical history, symptomatology, video electroencephalography (EEG), and magnetic resonance imaging (MRI). Six cortical zones must be considered in the presurgical evaluation, including epileptogenic zone, seizure onset zone, irritative zone, epileptogenic lesion, ictal symptomatic zone, and functional area.7,8 The functional area should also be evaluated. Precise and complete resection of the epileptogenic and seizure onset zones and the epileptogenic lesion is associated with successful surgical outcomes.9–11 Complete resection of the epileptogenic zone has been associated with freedom from seizures.12,13 Evaluation of the functional zone to prevent postoperative dysfunction is important when planning surgery. Localizing the extent of the epileptogenic zone in patients with FCD mainly depends on the neuroelectrophysiological examination and MRI of the brain. The typical manifestations of FCD on MRI include changes in cortical thickness, blurring of the gray-white matter junction, increased signal intensity (mainly on T2-weighted sequences), and the transmantle sign.14,15 Unfortunately, these features are variable and may be difficult to distinguish, especially in FCD type IIIa.16 Differentiating FCD subtype on MRI can be difficult, which is clinically important because of their association with surgical outcome. In addition, some researchers believe that simple structural examination has a substantial false-positive rate because of the similarity of the cortical structure of the insula and hippocampus with FCD histopathologic traits.17 Surgical outcome is associated with precise resection of the epileptogenic zone associated with FCD.18 Based on this, we have been using 18F-fluorodeoxyglucose (FDG)-positron emission tomography (PET)/computed tomography (CT) and MRI to evaluate epilepsy patients before surgery in order to find epileptogenic zones and epileptic lesions that cannot be recognized on structural imaging. We assume that PET/CT has a superior ability to identify FCD and epileptogenic zone compared to MRI. Therefore, in this study, we examined the proficiency of PET/CT to identify FCD subtype before surgery. We also defined localization values of PET/CT for delineating the epileptogenic zone associated with different FCD subtypes.
Methods
Patients
This study included patients who underwent resective epilepsy surgery in our hospital between October 2009 and March 2022 and met the following criteria: (1) failure to achieve seizure freedom despite treatment with two or more antiepileptic drugs (single or combined); (2) MRI and PET/CT were performed before surgery; and (3) pathological diagnosis of FCD.
Pre-Surgical Evaluation
A detailed pre-surgical evaluation was performed for all patients, including medical history, symptomatology, neurological examination, MRI, 18F-FDG-PET/CT, amplitude-integrated EEG, and video EEG. If non-invasive testing was unable to clearly define the epileptogenic zone and/or lesion, subdural electrode implantation and stereoelectroencephalography monitoring were performed to plan resection surgery. The number of cases undergoing subdural electrode implantation and stereoelectroencephalography monitoring is 17 and 12, respectively.
MRI
MRI was performed on a 3.0 T system (Verio or Skyra; Siemens, Erlangen, Germany). The conventional MRI protocols included T1-weighted (TR/TE = 250/2.48 ms), T2-weighted (TR/TE = 4000/125 ms), fluid-attenuated inversion recovery (TR/TE = 9000/94 ms; TI = 2500 ms), and contrast-enhanced T1-weighted imaging. An intravenous bolus of gadobenate dimeglumine (0.1 mmol/kg) was injected at a rate of 5 mL/s followed by 20 mL saline injected at the same rate. All images were obtained with the same field of view (220 × 220 mm), matrix size (256 × 256), slice thickness (1 mm), and intersection gap (1 mm). Diffusion-weighted imaging was performed using a spin-echo echo-planar sequence with diffusion gradients encoded in the three orthogonal directions (b-values = 0 and 1000 s/mm²). The scanning parameters were as follows: TR/TE = 8200/102 ms, number of excitations = 2.0, section thickness/gap = 1/1 mm, and field of view = 220 × 220 mm. An apparent diffusion coefficient (ADC) map was generated automatically by the post-processing workstation. FCD was diagnosed based on increased cortical thickness, blurring of the gray-white matter junction, increased signal intensity on T2-weighted/fluid attenuated inversion recovery imaging, and presence of the transmantle sign. An MRI diagnosis of FCD was defined as MRI+. The results were read and determined by two professional radiologists and re-confirmed.
PET/CT
PET/CT was performed using an integrated scanner (Biograph mCT 64; Siemens Healthcare) with head holder. Patients fasted for at least 6 hours. Scans were performed once blood glucose level was below 200 mg/dL. Intravenous 18F-FDG (3.7 MBq/kg) was administered under standardized conditions. A 10-minute three-dimensional brain emission scan was performed 30 minutes after the injection. Patients underwent low-dose CT (120 kV, 150 mAs) for attenuation correction. PET images were reconstructed using three-dimensional filtered back projection and a Gaussian filter to provide 45 contiguous axial slices with 5 mm spacing and a 400 × 400 matric. The images were read and assessed visually by two nuclear medicine specialists who were blinded to MRI and EEG findings. Glucose metabolic patterns (hypometabolism, hypermetabolism, or normal metabolism) in 16 major brain regions (8 in each hemisphere, corresponding to the lateral and medial surfaces of the frontal, temporal, parietal, and occipital lobes) were evaluated and reported separately by each reader. Abnormal metabolism was defined as PET/CT+. All results were re-confirmed.
Surgery
Surgery was performed by a single surgeon using cortical EEG. Some operations were guided by a neurosurgical navigation system and/or somatosensory evoked and motor evoked potential monitoring. The types of surgery performed included tailored resection of epileptic foci, standard anterior temporal lobectomy, selective amygdalohippocampectomy, and multiple subpial transections. Head CT was performed within 24 hours of the operation.
Pathology
The histopathological diagnosis was determined according to the 2011 ILAE FCD classification system5 after examination of a surgical specimen. Routine paraffin sections and immunohistochemical staining were performed.
Materials
Clinical data including sex, age at seizure onset (ASO), duration of epilepsy, age at surgery, MRI and PET/CT findings, surgical resection range, pathological type, and follow-up results were recorded. Seizure outcome after surgery was evaluated using the Engel classification. Good outcome was defined as Engle class I or II. Seizure outcome follow-up was conducted via examination or phone interview.
Statistical Analysis
Continuous data with a normal distribution are expressed as means with standard deviation and were compared using the t test. Continuous data with a skewed distribution are expressed as medians with interquartile range and were compared using the rank sum test. Categorical data are expressed as numbers with percentage and were compared using the chi-square or Fisher’s exact test as appropriate. Bonferroni was adopted for multiple corrections. Statistical analyses were performed using SPSS software version 23.0 (IBM Corp., Armonk, NY, USA). Drawing was performed using Prism version 9.0 (GraphPad Software, La Jolla, CA, USA). P <0.05 was considered significant.
Results
Patient Characteristics
One hundred and eight patients were included for analysis (49 women and 59 men). FCD type was I in 24 patients (22.2%), II in 27 (39.44%), IIIa in 36 (39.44%), IIIb in 10 (39.44%), and IIIc in 43 (60.56%). Patient characteristics are summarized in Table 1.
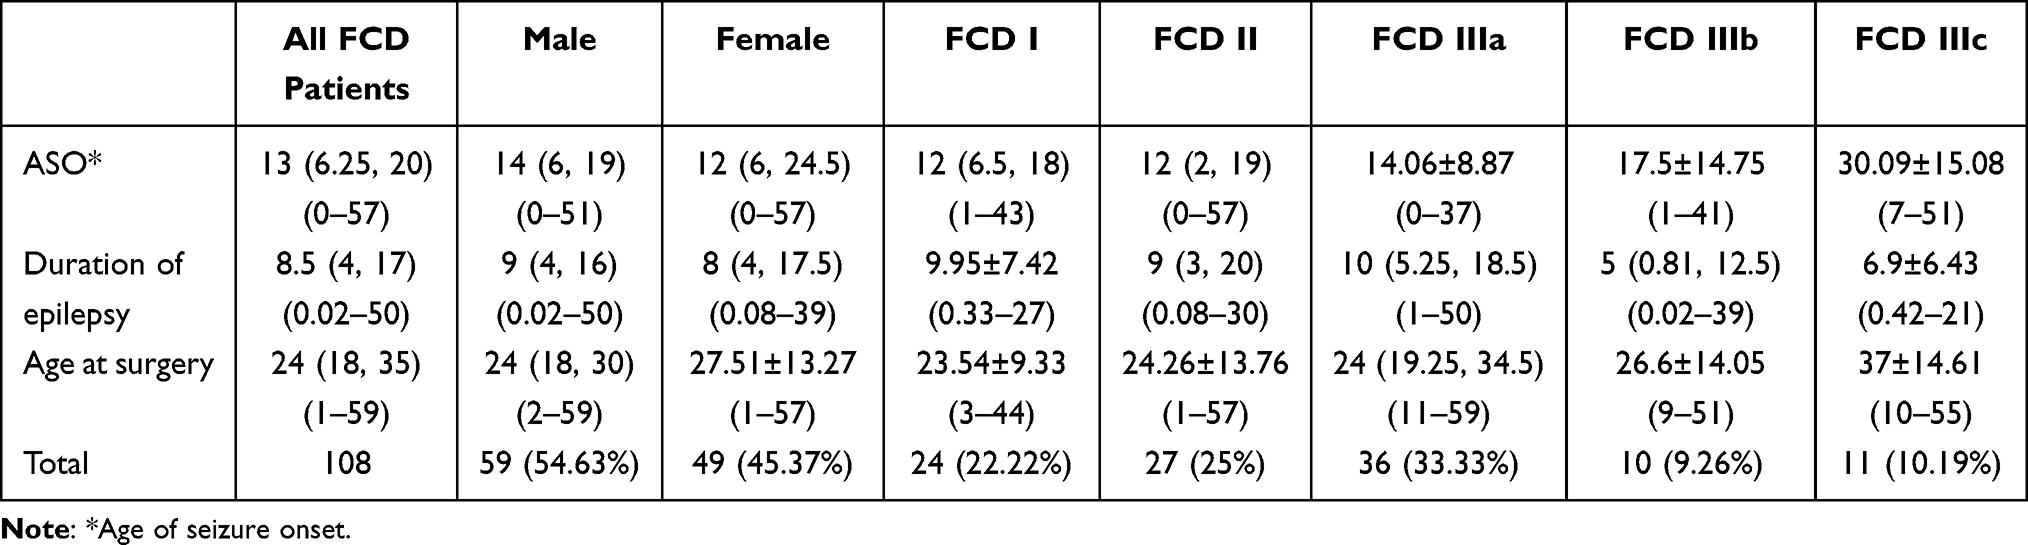 |
Table 1 Patient Characteristics |
MRI and PET/CT Results
Twenty-two patients (20.4%) were MRI+ and 86 (79.6%) were MRI-. In the FCD type I group, eight patients (33.3%) were MRI+ and 16 (66.7%) were MRI-. In the FCD type II group, five patients (18.5%) were MRI+ and 22 (81.5%) were MRI-. In the FCD type IIIa group, two patients (5.6%) were MRI+ and 34 (94.4%) were MRI-. In the FCD type IIIb group, six patients (60%) were MRI+ and four (40%) were MRI-. In the FCD type IIIc group, one patient (9.1%) was MRI+ and 10 (90.9%) were MRI- (Figure 1). The MRI+ and MRI- groups did not significantly differ in terms of ASO, duration of epilepsy, or age at operation. MRI positivity significantly differed among the different FCD types (P < 0.001): the positivity rate was lowest in the FCD type IIIa group (Table 2).
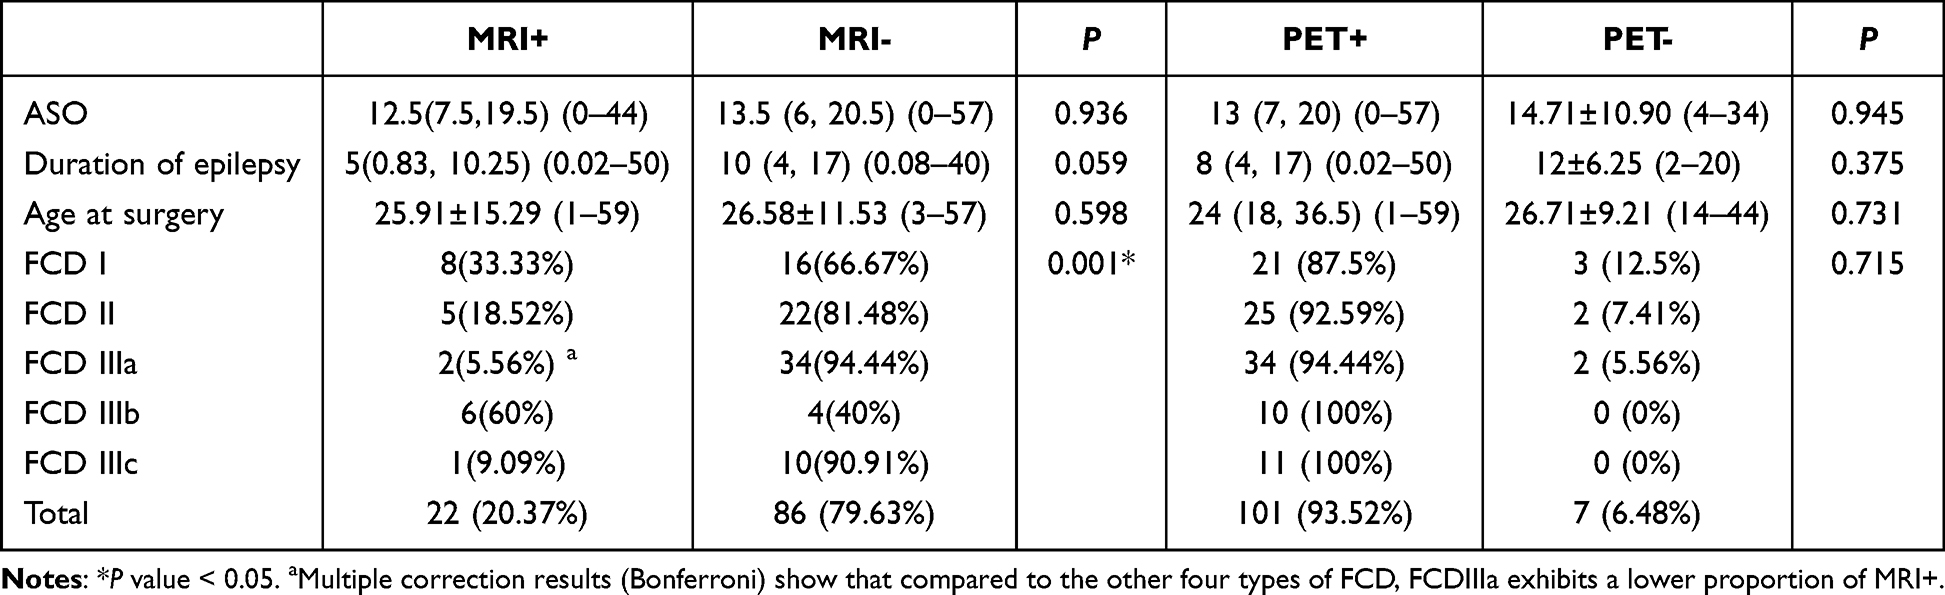 |
Table 2 Comparison of MRI+, MRI-, PET/CT+, and PET/CT- Patients |
 |
Figure 1 MRI results of different pathological types of FCD. |
One hundred one patients (93.5%) were PET/CT+. In the FCD type I group, 21 patients (87.5%) were PET/CT+ and 3 (12.5%) were PET/CT-. In the FCD type II group, 25 patients (92.6%) were PET/CT+ and two (7.4%) were PET/CT-. In the FCD type IIIa group, 34 patients (94.4%) were PET/CT+ and two (5.6%) were PET/CT-. All patients in the FCD type IIIb and IIIc groups were PET/CT+ (Figure 2). The PET/CT+ and PET/CT- groups did not significantly differ in terms of ASO, duration of epilepsy, or age at operation. PET/CT positivity did not significantly differ among the different FCD types (Table 2).
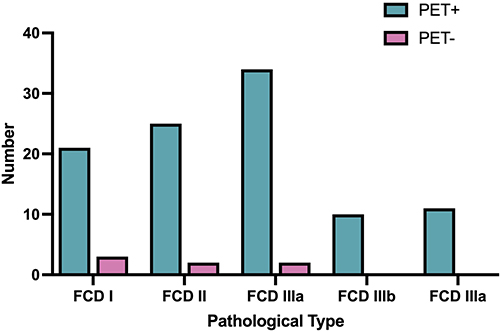 |
Figure 2 PET/CT results of different pathological types of FCD. |
When combining MRI and PET/CT data, 21 patients overall (19.4%) were MRI+ and PET/CT+, one (0.9%) was MRI+ and PET/CT-, 80 (74.1%) were MRI- and PET/CT+, and six (5.6%) were MRI- and PET/CT-. In the FCD type I group, seven patients (29.2%) were MRI+ and PET/CT+, one (4.2%) was MRI+ and PET/CT-, 14 (58.3%) were MRI- and PET/CT+, and two (8.3%) were MRI- and PET/CT-. In the FCD type II group, five patients (18.5%) were MRI+ and PET/CT+, none were MRI+ and PET/CT-, 20 (74.1%) were MRI- and PET/CT+, and two (7.4%) were MRI- and PET/CT-. In the FCD type IIIa group, two patients (5.6%) were MRI+ and PET/CT+, none were MRI+ and PET/CT-, 32 (88.9%) were MRI- and PET/CT+, and two (5.6%) were MRI- and PET/CT-. In the FCD type IIIb group, six patients (60.0%) were MRI+ and PET/CT+, 40 (40.0%) were MRI- and PET/CT+, none were MRI+ and PET/CT-, and none were MRI- and PET/CT-. In the FCD type IIIc group, one patient (9.1%) was MRI+ and PET/CT+, 10 (90.9%) were MRI- and PET/CT+, none were MRI+ and PETCT-, and none were MRI- and PET/CT- (Figure 3). ASO, duration of epilepsy, and age at operation did not significantly differ among the MRI+ and PET/CT+, MRI+ and PET/CT-, MRI- and PET/CT+, and MRI- and PET/CT- groups. The MRI and PET/CT results combined significantly differed among the different FCD types (P = 0.012). Compared with other pathological types, FCD type IIIa patients exhibit a higher proportion of MRI-/PET+ (Table 3).
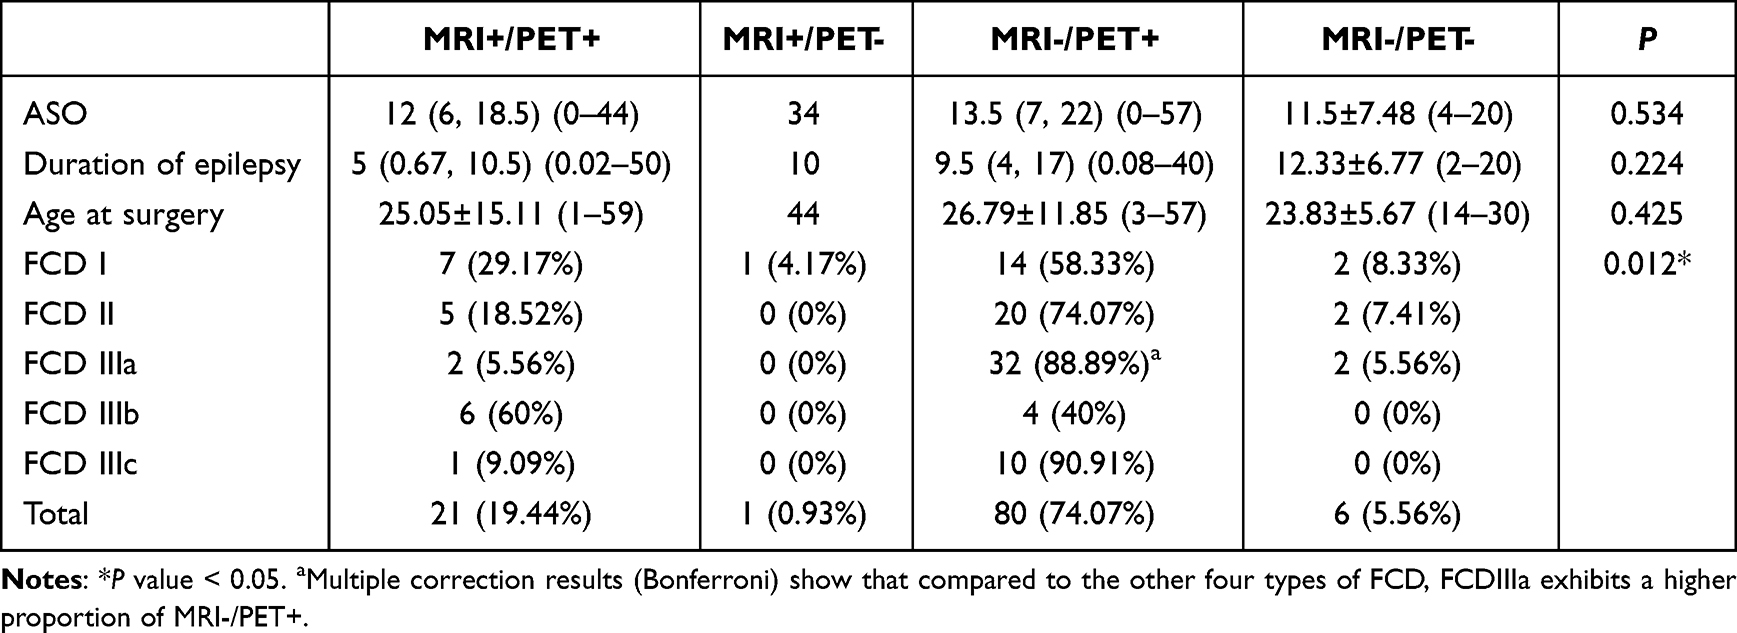 |
Table 3 Comparison of MRI+/PET+, MRI+/PET-, MRI-/PET+, MRI-/PET- Patients |
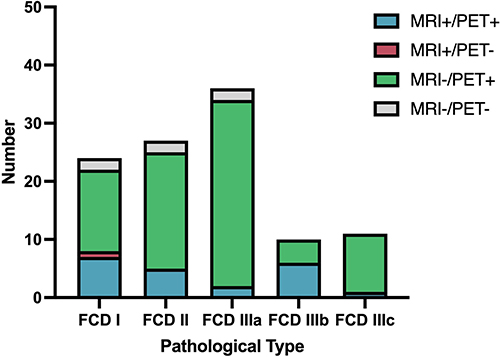 |
Figure 3 The combined results of MRI and PET/CT of different pathological types of FCD. |
Surgical Outcomes
No patient was lost to follow-up. Four died of unknown cause. Incidence of good outcome was higher in the PET/CT+ group than the PET/CT- group (77.32% vs 71.43%; Table 4). After grouping patients according to the size relationship between the areas of PET/CT abnormality and surgical resection, all groups had a good outcome (Table 5). The outcome differences were not significant (P = 0.91), indicating that differences between PET/CT abnormalities and surgical resection areas were not associated with outcome. Most patients achieved seizure freedom or experienced a reduction in seizure frequency after surgery.
 |
Table 4 Surgery Outcomes |
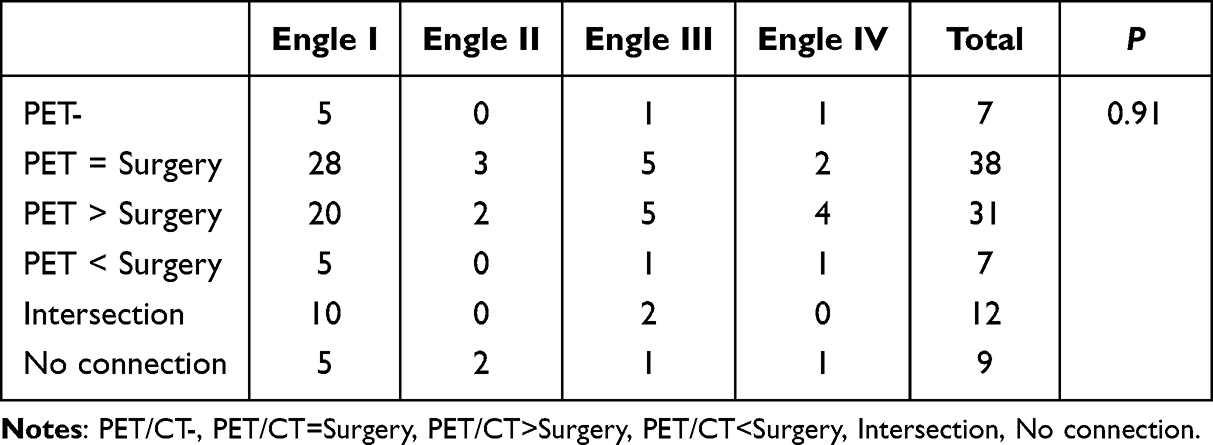 |
Table 5 Comparison of Six Groups Based on Outcomes |
Discussion
In 1957, Crome described “ulegyria” or scarring of the brain gyri characterized by loss of neurons and gliosis.19 Later, the term FCD was introduced to describe the neocortical structural disorder, dysmorphic neurons, and balloon cells in patients with focal epilepsy.20 The relationship between FCD and refractory epilepsy has been well established.21 According to recent studies, MRI can detect FCD in 20% to 100% of cases.22 Our study found that PET/CT is significantly better at detecting FCD than MRI.
MRI and FCD
The sensitivity of MRI for FCD may be as low as 20%.22 In our study, MRI was positive in only 20.37% of patients with FCD, which is similar. The MRI positivity rate was lowest in patients with FCD type IIIa (5.6%), possibly because features of FCD type IIIa are less obvious on MRI.16 This may also suggest that we should pay more attention to the cortex around the hippocampus in epileptic patients with hippocampal sclerosis. The rate of seizure freedom is lower after selective amygdalohippocampectomy than after standard anterior temporal lobectomy.23 This may also be related to the lower rate of MRI positivity for FCD type IIIa, that is, MRI only found hippocampal sclerosis, but did not recognize cortical dysplasia, which led to incomplete epileptic lesion resection and unsatisfactory surgical outcome. MRI parameters affect the ability to detect FCD. Several studies have shown that optimizing parameters can improve detection,14,24 such as increasing magnetic field strength. In addition, FCD may be present in multiple lobes, which may be responsible for the high negative rate.25,26
PET/CT and FCD
PET/CT can add important information for diagnosing FCD, especially for patients with subtle lesions.27 In addition, it is helpful for planning surgical strategy.28,29 FCD epileptic foci frequently demonstrate hypometabolism on interictal PET/CT and hypermetabolism during seizures.30 In our study, PET/CT was positive in 93.52% of FCD patients, which was significantly higher than the MRI+ rate (20.37%). Similar results have also been reported in previous studies.31–33 Jayalakshmi et al reported that the sensitivity of PET/CT (76.6%) was higher than that of MRI (72.3%) in patients with FCD type I or II.34 We believe that the higher PET/CT-positive rate may be due to the fact that metabolic abnormalities not only occur in the epileptogenic lesion but also in the seizure onset, irritative, symptomatic, and functional deficit zones. In contrast, MRI can only identify the lesion. FCD may only be an epileptogenic lesion. Furthermore, Desarnaud et al reported that PET/CT provides additional value predominantly in patients with negative or doubtful findings on MRI. They also noted that interobserver agreement correlated with hypometabolism grade: it was good in patients with mild to severe hypometabolism (82–95%) but moderate in those with subtle/doubtful hypometabolism (45%).35 Guerrini et al also noticed a difference in the grade of hypometabolism on PET/CT: maximal hypometabolic areas corresponded to FCD and the epileptogenic zone, whereas less-intense hypometabolic regions indicated the epileptogenic network and spread of the ictal discharge.36 This further suggests that PET/CT should not only focus on identification of epileptogenic lesions but also on changes in whole-brain metabolism caused by seizures, which will be beneficial to understanding the epilepsy transmission network.
Although PET/CT can add helpful information, the results often differ from those of MRI. Yokota et al reported that FCD in the temporal lobe had larger hypometabolic areas on PET/CT compared with abnormal areas on MRI; in contrast, no FCD lesions in the frontal lobe showed larger hypometabolic areas than the corresponding MRI abnormal areas. Furthermore, all FCD lesions with smaller hypometabolic areas than MRI abnormal areas were localized only in the frontal lobe,32 which may be because temporal lobe epilepsy propagates more readily and the temporal lobe cortex has lower metabolic activity than other lobes.37 The frontal lobe localization of FCD may reflect restricted propagation involving only the neighboring zone.38 Most areas of FCD in the frontal lobe are located at the bottom of deep sulci and are connected to the superficial normal-appearing cortex.39 Whether this phenomenon is also related to different pathological types of FCD and surgical outcome is unknown and warrants further study.
PET/CT can detect low metabolism in FCD epileptic lesions as well as changes that occur distant to a focal brain lesion. Biersack et al first reported three cases of crossed cerebellar diaschisis (CCD) in epilepsy patients in 1987.40 CCD is a phenomenon characterized by a decrease in metabolism and blood flow in the cerebellar hemisphere contralateral to a supratentorial lesion. Hou et al reported that the low metabolic region in patients with CCD may involve multiple lobes and is related to worse surgical outcome.41 In our study, CCD also appeared, but the relationship between CCD and surgical outcome was not analyzed. There was also no significant difference in PET/CT results between the different FCD types in our study, which may have been related to our small sample size.
PET/CT parameters may also be related to the identification of FCD. Optimizing PET/CT parameters such as tracers and biological markers may improve the detection rate. Several researchers have used PET/CT to investigate metabotropic glutamate receptor type 5 (mGluR5) availability in patients with focal epilepsy caused by FCD. In these studies, PET/CT showed that mGluR5 availability was reduced in FCD, which would facilitate preoperative diagnosis of MRI-negative FCD.42,43 PET/CT-related deep learning may also accurately identify FCD before surgery.44 Quantitative PET with morphometric analysis of MRI after image processing performs better in extratemporal lobe epilepsy with negative MRI than temporal lobe epilepsy with negative MRI. For temporal lobe epilepsy with negative MRI, it performs better in neocortical temporal lobe epilepsy than classical mesial temporal lobe epilepsy.11
Combined MRI and PET/CT and FCD
Compared with MRI or PET/CT alone, their combination can improve preoperative detection of FCD. FCD type IIIa patients were more likely to show MRI- and PET/CT+ than those with other types of FCD. This suggests that PET/CT has a high complementary diagnostic value for these patients with negative MRI findings. Previous studies have come to similar conclusions. Jayalakshmi et al proposed that PET/CT may help localize the epileptogenic zone in FCD patients with refractory epilepsy who have subtle or negative MRI findings.34
Surgical Outcomes
Electrocorticography was used during surgery to monitor the epileptic discharge area and determine the area of surgical resection. The good outcome rate was higher in the PET/CT+ group than the PET/CT- group, which suggests that abnormal metabolism may be a predictive factor for better surgical efficacy. Furthermore, most patients achieved seizure freedom or a reduction in seizure frequency after surgery regardless of FCD type, which suggests that PET/CT has little significance in guiding surgical resection. The area of metabolic abnormality on PET/CT may be an indicator of the epileptogenic network and spread of the ictal discharge. Resection of important nodes, such as the epileptogenic zone, may achieve epileptic seizure control. Therefore, the role of PET/CT in determining surgical resection is relatively small. However, it does have a role in diagnosis, especially in patients with FCD type IIIa.
Limitation
Patients were classified according to the 2011 ILAE FCD classification system; those classified with mild malformation of cortical development using the newer 2022 system were not included. In addition, we did not analyze potential predictors of imaging findings or surgical outcomes. As it is a retrospective study, the imaging data sets from two scanners over a 13-year period which may induce potentially noisy data, and also inconsistencies in clinical documentation are possible. Furthermore, our patient sample size was small.
Conclusions
PET/CT is superior to MRI in detecting FCD. FCD type IIIa was more likely than other types to show MRI-/PET+. This suggests that PET/CT has particular diagnostic value for FCD type IIIa patients with negative MRI findings. PET/CT results did not significantly differ among the various types of FCD.
Ethical Standards
The ethics committee of the First Affiliated Hospital of Fujian Medical University has approved this study.
Informed Consent
Considering that the data was reviewed retrospectively, patient consent was not needed. Every author would comply with the Declaration of Helsinki and keep patient data confidential.
Acknowledgment
We thank our colleagues in the Department of Pathology at the First Affiliated Hospital of Fujian Medical University of China for providing histopathological diagnoses.
Funding
This study was supported by the Joint Funds for the Innovation of Science and Technology, Fujian Province, China (No. 2019Y9121 and 2019Y9123).
Disclosure
The authors have no competing interests.
References
1. Becker AJ, Beck H. New developments in understanding focal cortical malformations. Curr Opin Neurol. 2018;31(2):151–155. doi:10.1097/WCO.0000000000000531
2. Jayalakshmi S, Vooturi S, Vadapalli R, Madigubba S, Panigrahi M. Predictors of surgical outcome in focal cortical dysplasia and its subtypes. J Neurosurg. 2021;136(2):512–522. doi:10.3171/2020.12.JNS203385
3. Blumcke I, Spreafico R, Haaker G, et al. Histopathological Findings in Brain Tissue Obtained during Epilepsy Surgery. N Engl J Med. 2017;377(17):1648–1656. doi:10.1056/NEJMoa1703784
4. Lamberink HJ, Otte WM, Blümcke I, Braun KPJ. Seizure outcome and use of antiepileptic drugs after epilepsy surgery according to histopathological diagnosis: a retrospective multicentre cohort study. Lancet Neurol. 2020;19(9):748–757. doi:10.1016/S1474-4422(20)30220-9
5. Blumcke I, Thom M, Aronica E, et al. The clinicopathologic spectrum of focal cortical dysplasias: a consensus classification proposed by an ad hoc Task Force of the ILAE Diagnostic Methods Commission. Epilepsia. 2011;52(1):158–174. doi:10.1111/j.1528-1167.2010.02777.x
6. Wagstyl K, Whitaker K, Raznahan A, et al. Atlas of lesion locations and postsurgical seizure freedom in focal cortical dysplasia: a MELD study. Epilepsia. 2022;63(1):61–74. doi:10.1111/epi.17130
7. Rosenow F, Lüders H. Presurgical evaluation of epilepsy. Brain. 2001;124(Pt 9):1683–1700. doi:10.1093/brain/124.9.1683
8. Schramm J, Clusmann H. The surgery of epilepsy. Neurosurgery. 2008;62 Suppl 2:463–481. doi:10.1227/01.neu.0000316250.69898.23
9. Rowland NC, Englot DJ, Cage TA, Sughrue ME, Barbaro NM, Chang EF. A meta-analysis of predictors of seizure freedom in the surgical management of focal cortical dysplasia. J Neurosurg. 2012;116(5):1035–1041. doi:10.3171/2012.1.JNS111105
10. Hidalgo ET, Weiner HL. Surgery for epileptogenic cerebral dysplasia in children. Dev Med Child Neurol. 2017;59(3):270–275. doi:10.1111/dmcn.13292
11. Lin Y, Fang YD, Wu G, et al. Quantitative positron emission tomography-guided magnetic resonance imaging postprocessing in magnetic resonance imaging-negative epilepsies. Epilepsia. 2018;59(8):1583–1594. doi:10.1111/epi.14474
12. Lin YX, Lin K, Kang DZ, Lin ZY, Chen FY. Surgical outcome and prognostic factors in focal cortical dysplasia with intractable epilepsy. Zhonghua Yi Xue Za Zhi. 2012;92(25):1763–1766.
13. Yao P, Xu M, Yu L, Kang D, Lin Y. Surgical outcomes of focal cortical dysplasia patients with “difficult to locate” intractable epilepsy and their influencing factors. Int J Med. 2021;20.
14. Wang I, Oh S, Blumcke I, et al. Value of 7T MRI and post-processing in patients with nonlesional 3T MRI undergoing epilepsy presurgical evaluation. Epilepsia. 2020;61(11):2509–2520. doi:10.1111/epi.16682
15. Barkovich AJ, Kuzniecky RI, Bollen AW, Grant PE. Focal transmantle dysplasia: a specific malformation of cortical development. Neurology. 1997;49(4):1148–1152. doi:10.1212/WNL.49.4.1148
16. Mo J, Zhang J, Hu W, et al. Neuroimaging gradient alterations and epileptogenic prediction in focal cortical dysplasia IIIa. J Neural Eng. 2022;19(2):025001. doi:10.1088/1741-2552/ac6628
17. Gill RS, Lee HM, Caldairou B, et al. Multicenter Validation of a Deep Learning Detection Algorithm for Focal Cortical Dysplasia. Neurology. 2021;97(16):e1571–82. doi:10.1212/WNL.0000000000012698
18. David BA-O, Kröll-Seger J, Schuch F, et al. External validation of automated focal cortical dysplasia detection using morphometric analysis. Epilepsia. 2021;62(4):1005–1021. doi:10.1111/epi.16853
19. Crome L. Infantile cerebral gliosis with giant nerve cells. J Neurol Neurosurg Psychiatry. 1957;20(2):117–124. doi:10.1136/jnnp.20.2.117
20. Taylor DC, Falconer MA, Bruton CJ, Corsellis JAN. Focal dysplasia of the cerebral cortex in epilepsy. J Neurol Neurosurg Psychiatry. 1971;34(4):369–387. doi:10.1136/jnnp.34.4.369
21. Palmini A, Gambardella A, Fau - Andermann F, et al. Intrinsic epileptogenicity of human dysplastic cortex as suggested by corticography and surgical results. Ann Neurol. 1995;37(4):476–487. doi:10.1002/ana.410370410
22. Najm I, Lal D, Alonso Vanegas M, et al. The ILAE consensus classification of focal cortical dysplasia: an update proposed by an ad hoc task force of the ILAE diagnostic methods commission. Epilepsia. 2022;63(8):1899–1919. doi:10.1111/epi.17301
23. Josephson CB, Dykeman J, Fiest KM. Systematic review and meta-analysis of standard vs selective temporal lobe epilepsy surgery. Neurology. 2013;80(18):1669–1676. doi:10.1212/WNL.0b013e3182904f82
24. Thapaliya K, Urriola J, Barth M, Reutens DC, Bollmann S, Vegh V. 7T GRE-MRI signal compartments are sensitive to dysplastic tissue in focal epilepsy. Magn Reson Imaging. 2019;61:1–8. doi:10.1016/j.mri.2019.05.011
25. Kapar O, Gurkan ZM, Dolgun M, Sencer A, Gurses C, Bilgic B. Focal cortical dysplasia pathology: diagnostic difficulty, classification, and utility for pathogenesis. Neurosurg Focus. 2022;53(4):E6. doi:10.3171/2022.7.FOCUS21731
26. Isler C, Kucukyuruk B, Ozkara C, et al. Comparison of clinical features and surgical outcome in focal cortical dysplasia type 1 and type 2. Epilepsy Res. 2017;136:130–136. doi:10.1016/j.eplepsyres.2017.08.008
27. Cendes F, Theodore WH, Brinkmann BH, Sulc V, Cascino GD. Neuroimaging of epilepsy. Handb Clin Neurol. 2016;136:985–1014. doi:10.1016/B978-0-444-53486-6.00051-X
28. Rathore C, Dickson JC, Teotónio R, Ell P, Duncan JS. The utility of 18F-fluorodeoxyglucose PET (FDG PET) in epilepsy surgery. Epilepsy Res. 2014;108(8):1306–1314. doi:10.1016/j.eplepsyres.2014.06.012
29. Rubinger L, Chan C, D’Arco F, et al. Change in presurgical diagnostic imaging evaluation affects subsequent pediatric epilepsy surgery outcome. Epilepsia. 2016;57(1):32–40. doi:10.1111/epi.13229
30. Stanescu L, Ishak GE, Khanna PC, Biyyam DR, Shaw DW, Parisi MT. FDG PET of the brain in pediatric patients: imaging spectrum with MR imaging correlation. Radiographics. 2013;33(5):1279–1303. doi:10.1148/rg.335125152
31. Chassoux F, Rodrigo S, Fau - Semah F, et al. FDG-PET improves surgical outcome in negative MRI Taylor-type focal cortical dysplasias. Neurology. 2010;75(24):2168–2175. doi:10.1212/WNL.0b013e31820203a9
32. Yokota H, Uetani H, Tatekawa H, et al. Focal cortical dysplasia imaging discrepancies between MRI and FDG-PET: unique association with temporal lobe location. Seizure. 2020;81:180–185. doi:10.1016/j.seizure.2020.08.017
33. Abdul Aziz AF, Mohamed AR, Murugesu S, Siti Zarina AH, Lee BN. (18)F-FDG PET/CT for the pre-surgical localization of epileptogenic focus among paediatric patients with drug resistant epilepsy in Malaysia: perspective of a nuclear medicine physician. Med J Malaysia. 2021;76(4):502–509.
34. Jayalakshmi S, Nanda SK, Vooturi S, et al. Focal Cortical Dysplasia and Refractory Epilepsy: role of Multimodality Imaging and Outcome of Surgery. AJNR Am J Neuroradiol. 2019;40(5):892–898. doi:10.3174/ajnr.A6041
35. Desarnaud S, Mellerio C, Semah F, et al. (18)F-FDG PET in drug-resistant epilepsy due to focal cortical dysplasia type 2: additional value of electroclinical data and coregistration with MRI. Eur J Nucl Med Mol Imaging. 2018;45(8):1449–1460. doi:10.1007/s00259-018-3994-3
36. Guerrini R, Duchowny M, Jayakar P, et al. Diagnostic methods and treatment options for focal cortical dysplasia. Epilepsia. 2015;56(11):1669–1686. doi:10.1111/epi.13200
37. Pourhassan Shamchi S, Khosravi M, Fau - Taghvaei R, et al. Normal patterns of regional brain (18)F-FDG uptake in normal aging. Hell J Nucl Med. 2018;21(3):175–180. doi:10.1967/s002449910902
38. Jenssen S, Roberts CM, Gracely EJ, Dlugos DJ, Sperling MR. Focal seizure propagation in the intracranial EEG. Epilepsy Res. 2011;93(1):25–32. doi:10.1016/j.eplepsyres.2010.10.008
39. Besson P, Andermann F, Dubeau F, Bernasconi A. Small focal cortical dysplasia lesions are located at the bottom of a deep sulcus. Brain. 2008;131(Pt 12):3246–3255. doi:10.1093/brain/awn224
40. Biersack HJ, Linke D, Fau - Brassel F, et al. Technetium-99m HM-PAO brain SPECT in epileptic patients before and during unilateral hemispheric anesthesia (Wada test): report of three cases. J Nucl Med. 1987;28(11):1763–1767.
41. Hou Y, Guo K, Fan X, et al. Crossed cerebellar diaschisis: risk factors and prognostic value in focal cortical dysplasia by (18)F-FDG PET/CT. Ann Nucl Med. 2021;35(6):719–727. doi:10.1007/s12149-021-01613-8
42. DuBois JM, Rousset OG, Guiot MC, et al. Metabotropic Glutamate Receptor Type 5 (mGluR5) Cortical Abnormalities in Focal Cortical Dysplasia Identified In Vivo With [11C]ABP688 Positron-Emission Tomography (PET) Imaging. Cereb Cortex. 2016;26(11):4170–4179. doi:10.1093/cercor/bhw249
43. DuBois JM, Mathotaarachchi S, Rousset OG, et al. Large-scale mGluR5 network abnormalities linked to epilepsy duration in focal cortical dysplasia. Neuroimage Clin. 2021;29:102552. doi:10.1016/j.nicl.2020.102552
44. Zhang Q, Liao Y, Wang X, et al. A deep learning framework for (18)F-FDG PET imaging diagnosis in pediatric patients with temporal lobe epilepsy. Eur J Nucl Med Mol Imaging. 2021;48(8):2476–2485. doi:10.1007/s00259-020-05108-y
 © 2024 The Author(s). This work is published and licensed by Dove Medical Press Limited. The full terms of this license are available at https://www.dovepress.com/terms.php and incorporate the Creative Commons Attribution - Non Commercial (unported, v3.0) License.
By accessing the work you hereby accept the Terms. Non-commercial uses of the work are permitted without any further permission from Dove Medical Press Limited, provided the work is properly attributed. For permission for commercial use of this work, please see paragraphs 4.2 and 5 of our Terms.
© 2024 The Author(s). This work is published and licensed by Dove Medical Press Limited. The full terms of this license are available at https://www.dovepress.com/terms.php and incorporate the Creative Commons Attribution - Non Commercial (unported, v3.0) License.
By accessing the work you hereby accept the Terms. Non-commercial uses of the work are permitted without any further permission from Dove Medical Press Limited, provided the work is properly attributed. For permission for commercial use of this work, please see paragraphs 4.2 and 5 of our Terms.