")
Back to Journals » Journal of Inflammation Research » Volume 17
Zooming in and Out of Programmed Cell Death in Osteoarthritis: A Scientometric and Visualized Analysis
Authors Cao S , Wei Y, Yue Y, Xiong A , Zeng H
Received 3 February 2024
Accepted for publication 9 April 2024
Published 23 April 2024 Volume 2024:17 Pages 2479—2498
DOI https://doi.org/10.2147/JIR.S462722
Checked for plagiarism Yes
Review by Single anonymous peer review
Peer reviewer comments 2
Editor who approved publication: Professor Ning Quan
Siyang Cao,1– 3,* Yihao Wei,1– 3,* Yaohang Yue,1– 3,* Ao Xiong,1– 3 Hui Zeng1– 3
1National & Local Joint Engineering Research Centre of Orthopaedic Biomaterials, Peking University Shenzhen Hospital, Shenzhen, Guangdong, People’s Republic of China; 2Shenzhen Key Laboratory of Orthopaedic Diseases and Biomaterials Research, Peking University Shenzhen Hospital, Shenzhen, Guangdong, People’s Republic of China; 3Department of Bone & Joint Surgery, Peking University Shenzhen Hospital, Shenzhen, Guangdong, People’s Republic of China
*These authors contributed equally to this work
Correspondence: Ao Xiong; Hui Zeng, Peking University Shenzhen Hospital, No. 1120 Lianhua Road, Futian District, Shenzhen, Guangdong Province, People’s Republic of China, Tel/Fax +86 755 8392 3333, Email [email protected]; [email protected]
Abstract: During the past decade, mounting evidence has increasingly linked programmed cell death (PCD) to the progression and development of osteoarthritis (OA). There is a significant need for a thorough scientometric analysis that recapitulates the relationship between PCD and OA. This study aimed to collect articles and reviews focusing on PCD in OA, extracting data from January 1st, 2013, to October 31st, 2023, using the Web of Science. Various tools, including VOSviewer, CiteSpace, Pajek, Scimago Graphica, and the R package, were employed for scientometric and visualization analyses. Notably, China, the USA, and South Korea emerged as major contributors, collectively responsible for more than 85% of published papers and significantly influencing research in this field. Among different institutions, Shanghai Jiao Tong University, Xi’an Jiao Tong University, and Zhejiang University exhibited the highest productivity. Prolific authors included Wang Wei, Wang Jing, and Zhang Li. Osteoarthritis and Cartilage had the most publications in this area. Keywords related to PCD in OA prominently highlighted ‘chondrocytes’, ‘inflammation’, and ‘oxidative stress’, recognized as pivotal mechanisms contributing to PCD within OA. This study presents the first comprehensive scientometric analysis, offering a broad perspective on the knowledge framework and evolving patterns concerning PCD in relation to OA over the last decade. Such insights can aid researchers in comprehensively understanding this field and provide valuable directions for future explorations.
Keywords: global scientific frontiers, programmed cell death, osteoarthritis, scientometrics, visualization analysis
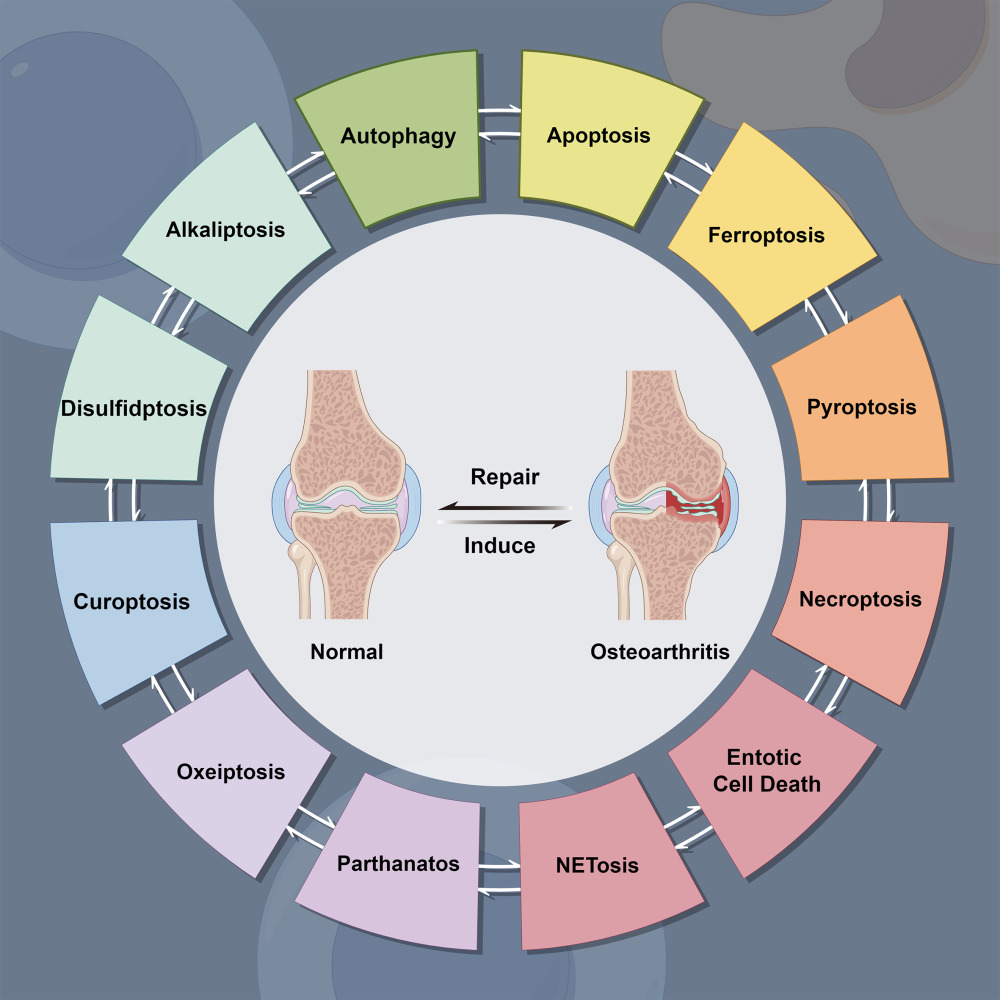
Graphical Abstract:
Introduction
Osteoarthritis (OA), the most prevalent form of arthritis,1 affects approximately 7% of the global population.2 As the aging population grows and obesity rates increase, the incidence of OA is projected to rise.3 This presents significant and unavoidable challenges to global healthcare systems and the public health infrastructure of individual nations.4 Due to our limited understanding of the molecular mechanisms underlying the onset and progression of OA, current treatments primarily focus on long-term pain relief, restoring functionality, and enabling early resumption of daily activities.5 In advanced cases, consideration is given to arthroplasty.6 Elucidating the molecular mechanisms of OA is crucial for significantly improving therapeutic effectiveness.
Previously, OA was attributed to excessive mechanical stress leading to articular cartilage destruction. However, recent studies have unveiled a more complex process involving inflammation, metabolic factors, and cell death.7 OA affects all joint areas, causing cell death and degradation of the extracellular matrix (ECM).8,9 During the development of OA, inflammatory mediators such as reactive oxygen species, interleukins, and matrix metalloproteinases (MMPs) are closely associated with cell death, involving mitochondrial, death receptor, and other signaling pathways.10 New discoveries have provided fresh perspectives on the mechanisms of regulated cell death and their in vivo significance for OA pathology, indicating a potential significant impact of regulated cell death on OA pathology.11 Consequently, understanding the pathogenic process of OA by elucidating various mechanisms of cell death is essential for researchers.12
Cell death, a common occurrence in normal tissues, represents the irreversible cessation of essential life processes and plays a pivotal role in maintaining tissue function and structure. It encompasses both accidental cell death (ACD) and programmed cell death (PCD).13–15 ACD occurs due to significant mechanical, physical, or chemical damage in extreme environments, while PCD denotes a regulated form of cell demise governed by specific signaling pathways and well-defined operational mechanisms, which occurs under physiological senescence conditions.7,16 Hence, PCD is intricately linked to the onset and progression of OA within genuine age-related clinical scenarios.17,18 PCD broadly categorizes into two primary types: apoptotic and non-apoptotic.15,16 Non-apoptotic forms of PCD, such as autophagy,19 ferroptosis,20 necroptosis,21 pyroptosis,22 cuproptosis,23 and a more recently identified type known as disulfidptosis, discovered in 2023,24 have been identified. Recent research has explored the association between PCD and OA, proposing that PCD could serve as a significant risk factor for OA.10,25–27 Different types of PCD play distinct roles in OA. Some, like apoptosis,10 pyroptosis,27 cuproptosis,28 ferroptosis,29 and necroptosis,30 can either trigger or exacerbate OA. Conversely, autophagy has shown potential in mitigating OA progression, thereby protecting cartilage.31 The development of new approaches to selectively regulate PCD pathways has brought great hope to prevent and treat human diseases (such as OA) that avoid cell (such as chondrocytes) loss.16,32,33 Therefore, emphasizing PCD and unraveling its fundamental regulatory mechanisms could pave the way for more effective strategies in treating OA.
Despite numerous reviews delving into PCD’s role in OA,4,10,12,25,27,34,35 there remains a gap in visualized analyses and comprehensive summaries delineating developmental trends, primary contributors, and core research priorities. This research aims to function as a valuable asset for both experienced individuals and those new to the field, facilitating in-depth assessments within their respective fields, exploration of emerging areas, and the development of well-informed strategies for future research, all supported by visual aids. To our knowledge, this aspect, which significantly augments research efficiency, has not been previously explored in scientometric investigations.
Materials and Methods
Retrieval Strategy & Data Collection
Widely recognized for its standardized and high-caliber academic publication data, the Web of Science Core Collection (WoSCC) stands out as a renowned resource for scientometric analysis, offering a comprehensive tool for tracking the evolution of scientific frontiers.36–39 The WoSCC not only provides scientometric software with general statistics,39 but has also demonstrated superior accuracy in document type labeling compared to other databases.40 In the present investigation, an extensive online search was carried out within the WoSCC, with a particular emphasis on original research and reviews associated with “PCD-OA”. The search spanned from January 1st, 2013, to October 31st, 2023. To ensure both sensitivity and precision in our search strategy, we utilized a combination of Medical Subject Heading terms and free words. The methodology underwent rigorous iterative testing and refinement, involving three authors (SYC, YHW, and YHY) to ensure comprehensive coverage. For additional details, refer to the Supplementary Table 1.
Criteria for Inclusion and Exclusion
The selection process was guided by clear and predefined criteria. Inclusions comprised research pertinent to PCD in OA, encompassing both original articles and reviews published in English. Conversely, exclusions comprised dissertations, letters, commentaries, editorials, conference abstracts, and studies published under similar or different titles across various journals. Finalizing the inclusion and exclusion criteria involved thorough discussions among team members and peer groups.
Visualization and Statistical Analysis
The dataset retrieved from WoSCC underwent analysis using multiple software tools and databases, including WPS Office 12.1.0 (Kingsoft Office, China), VOSviewer 1.6.18 (Leiden University, Netherlands), CiteSpace version 6.2.R5 (Chaomei Chen, China), Pajek version 5.16 (University of Ljubljana, Slovenia), Scimago Graphica version 1.0.35 (https://www.graphica.app/, USA), the STRING database (http://string-db.org/), and Cytoscape software (version 3.8.2). The analysis also involved various R packages such as chorddiag, complexHeatmap, circlize, enrichplot, ggplot2, and Clusterprofiler within R Studio version 4.2.0.
Conducting co-occurrence analysis involved utilizing VOSviewer and Pajek to reveal patterns among countries, institutions, authors, journals, research fields, keywords, and diseases. For analyzing the temporal evolution of keyword intensity, Scimago Graphica was employed. Keyword heatmaps were generated using the complexHeatmap and circlize R packages. CiteSpace was employed to facilitate visual analysis, generating maps for countries, institutions, authors, journals, co-cited literature, and keywords. Furthermore, the chorddiag R package was utilized to visualize the publishing landscape. In performing gene ontology (GO) and Kyoto Encyclopedia of Genes and Genomes (KEGG) pathway enrichment analyses, the ggplot2, enrichplot, and clusterprofiler packages were deployed. The Protein-Protein Interaction (PPI) network was assessed through the STRING database and visualized using Cytoscape software.
Results and Discussion
Output Trends Over the Years
Figure 1A illustrates the process of data retrieval and collection. The research trajectory of a study is reflected in the volume of publications over a defined period.41 From 2013 to 2023, we compiled 3,579 relevant pieces of literature (3,160 original articles and 419 reviews) focusing on PCD research in OA. This resulted in an average of 357.9 publications annually. The scholarly output in this field has consistently increased over the last decade, with annual relevant publications exceeding 500 starting in 2021 and reaching a peak of 614 in 2022. This surge signifies a growth of more than fivefold compared to the 2012 count, expanding each year by 20.98%. The sustained increase in publications over the last decade signifies robust research vigor in exploring the relationship between PCD and OA, underscoring the field’s importance and its potential impact on our understanding of OA pathogenesis and treatment. To present a comprehensive yearly distribution, an exponential equation, y = 94.773e0.1791x (R2 = 0.9453, where x represents the year and y denotes the annual publication quantity), was employed, yielding a well-fitted curve (Figure 1B). As per this curve, a continual increase in annual publications is projected, indicating a growing interest and commitment to understanding the role of PCD in OA. The scientific community anticipates significant advancements in comprehending the molecular mechanisms involving PCD in OA, potentially leading to novel therapeutic interventions.
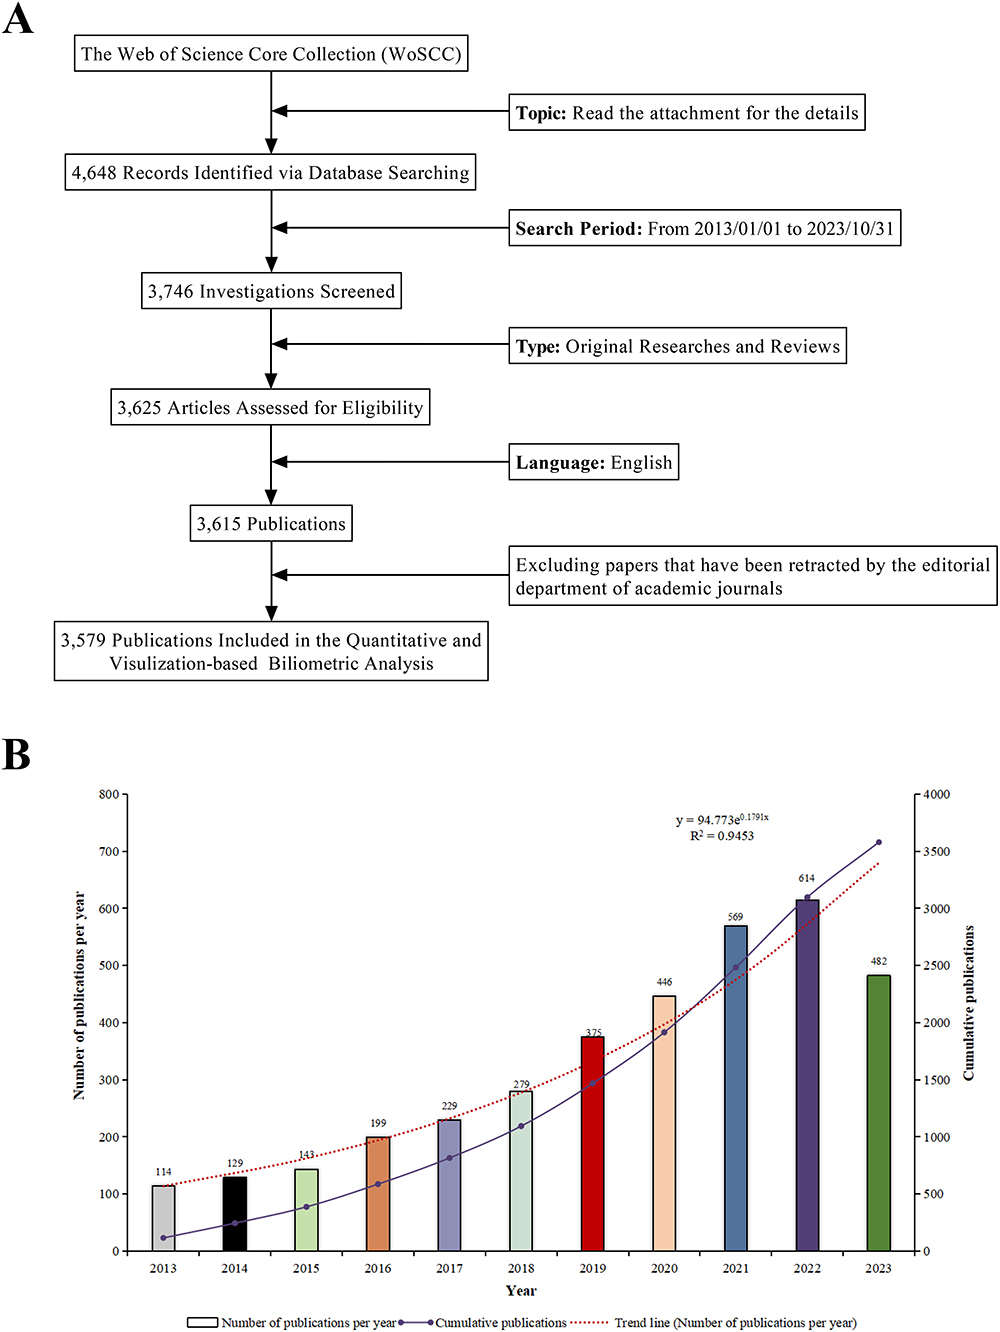 |
Figure 1 (A) Flow Diagram of Literature Search and Selection. (B) Research Publications on “Programmed Cell Death-Osteoarthritis” from 2013 to 2023. |
Countries/Regions’ Research and Their Connections
The exploration of PCD in OA involves contributions from 74 countries/regions. To scrutinize the collaboration in PCD in OA, national collaboration diagrams were generated, utilizing a minimum publication threshold of ten documents per region (Figure 2A and B). The geographical representation utilizes separate spheres to depict individual nations or regions, with sphere color denoting the clustering relationship among study areas. These regions are subsequently classified into four separate clusters according to their collaboration levels. Within this representation, the thickness of connecting lines between spheres indicates the degree of collaboration, while the size of each sphere correlates with the number of published documents originating from that nation. The chord diagram enhances the analysis by presenting different countries or regions through outer curve segments. In this context, the length of a segment reflects the volume of publications from that particular location. Furthermore, the thickness of connections between countries indicates the intensity of collaboration.
 |
Figure 2 (A) Co-occurrence Network and Cooperation Geo-heatmap. Each sphere represents a country, and the line’s thickness connecting the spheres signifies the strength of cooperation between nations. Additionally, the size of each sphere corresponds to the number of publications from that particular country. (B) Chord Maps for Country/Region Partnerships. Each outer curve represents a country, with line thickness directly correlating to the strength of collaboration between countries. (C) Document Numbers related to “Programmed Cell Death-Osteoarthritis” Highlighted in Top 10 Countries (red areas indicate document surges). |
Figure 2A presents a global productivity map, highlighting predominant publication concentrations across Asian, North American, and European countries. Leading this productivity is China, emerging as the primary contributor with 2,547 publications, constituting 71.17% of the total. The USA and South Korea follow closely, contributing 10.81% (n = 387) and 4.02% (n = 144) respectively. Surpassing other country pairs in collaboration frequency (link strength = 112), China and the USA demonstrate significant academic engagement (Figure 2B). Publication volume often signifies a region’s prominence in a field.42 China and the USA, with their substantial contributions to PCD in OA publications, underscore their academic standing and impact in this domain. Their joint efforts are positioned to propel theoretical innovation and tackle technical challenges within this field.43
Examining citation bursts proves to be a valuable approach to pinpointing items undergoing significant increases in citations within a designated timeframe, providing valuable insights into the dynamics and trajectory of a particular field. This scrutiny of rapidly accumulating citations aids in recognizing emerging trends that capture the focus of researchers. Figure 2C presents the citation bursts among the leading 10 countries, with the burst magnitude depicted by the red line for each country. Particularly noteworthy is the significant surge in publications experienced by the USA (strength = 15.72) between 2013 and 2017, closely followed by Japan (strength = 14.33). These bursts in publications during specific periods highlight the dynamic nature of the field and provide valuable cues for future research directions.
The in-depth examination of research and collaboration patterns among countries/regions in the context of “PCD-OA” offers a valuable information repository for both researchers and industry practitioners. This data not only facilitates the guidance of collaborative efforts but also aids in the identification of influential contributors. Moreover, it serves as a crucial foundation for strategic decision-making in research and development initiatives associated with PCD in OA.
Institutional Performance Insights
In the preceding decade, a total of 2,979 institutions have played a significant role in research pertaining to PCD within the framework of OA. Particularly noteworthy is the leadership of Shanghai Jiao Tong University in this pursuit, boasting 118 publications (3.29%). It is closely trailed by the Chinese Academy of Sciences (110, 3.07%) and Sichuan University (108, 3.01%). To visually represent collaboration among these research institutions, a collaboration map was generated, applying a minimum threshold of 25 publications per institution (Figure 3A). In this visualization, each sphere-text combination symbolizes an institution, and connecting lines denote instances of collaboration. The thickness of these lines reflects the strength of collaboration, while the size of each circle corresponds to the institution’s publication count. This comprehensive information not only offers insights into collaboration dynamics but also serves as a valuable reference for identifying collaboration opportunities and establishing potential research partnerships.
 |
Figure 3 (A) Institutional Co-occurrence Analysis Map. The combination of spheres and text represents an entity, symbolizing an institution; connecting lines between circles represent collaborative occurrences among institutions; the thickness of the lines indicates the strength of collaboration between institutions; the size of circles is positively correlated with the number of publications from the institutions. (B) Citation Bursts in Top 10 Institutions (red bars represent burst periods for institutions). |
Our analysis brought to light an active collaboration between Zhejiang University, particularly with Wenzhou Medical University. This highlights a regional collaborative network that holds potential implications for local research initiatives and industry collaborations. Such insights can serve as valuable guidance for industry practitioners seeking to establish connections with key research institutions, whether for joint ventures, clinical trials, or technology transfer. To complement this collaborative perspective, we utilized CiteSpace (Figure 3B) to identify institutions experiencing notable citation bursts. From 2013 to 2018, the Scripps Research Institute led the pack, followed closely by Rush University and the University of California San Diego within the same timeframe. Interestingly, this surge has not persisted over the last five years. Delving into the reasons behind these trends is crucial for both researchers and industry practitioners. Factors such as shifts in research focus, emerging competitors, or changes in funding dynamics could provide valuable insights into understanding and adapting to the evolving landscape.
Authors’ Analysis
During our analysis of authorship information, a cumulative count of 16,443 contributors was identified for publications addressing PCD in the context of OA. Notably, 19 authors exhibited prolific involvement, each credited with at least 10 papers. This insight sheds light on key contributors in the “PCD-OA” domain and presents an opportunity for researchers to leverage their expertise and insights. Collaboration and mentorship possibilities could emerge from understanding the significant contributions of these authors. For the visual depiction of co-authorship networks, VOSviewer software was utilized, establishing a minimum threshold of ten documents per author. The resulting visualization employs varying circle sizes to indicate the quantity of documents authored by each individual, while distinct colors represent separate clusters. The strength of collaboration is illustrated by the thickness of connecting lines between circles. Among the 90 authors meeting this threshold, Guo Fengjing and Sun Kai stood out for exhibiting the closest collaborative ties (Figure 4A). Additionally, Wang Wei, Wang Jing, and Zhang Li emerged as the foremost contributors, emphasizing their significant role in the “PCD-OA” domain.
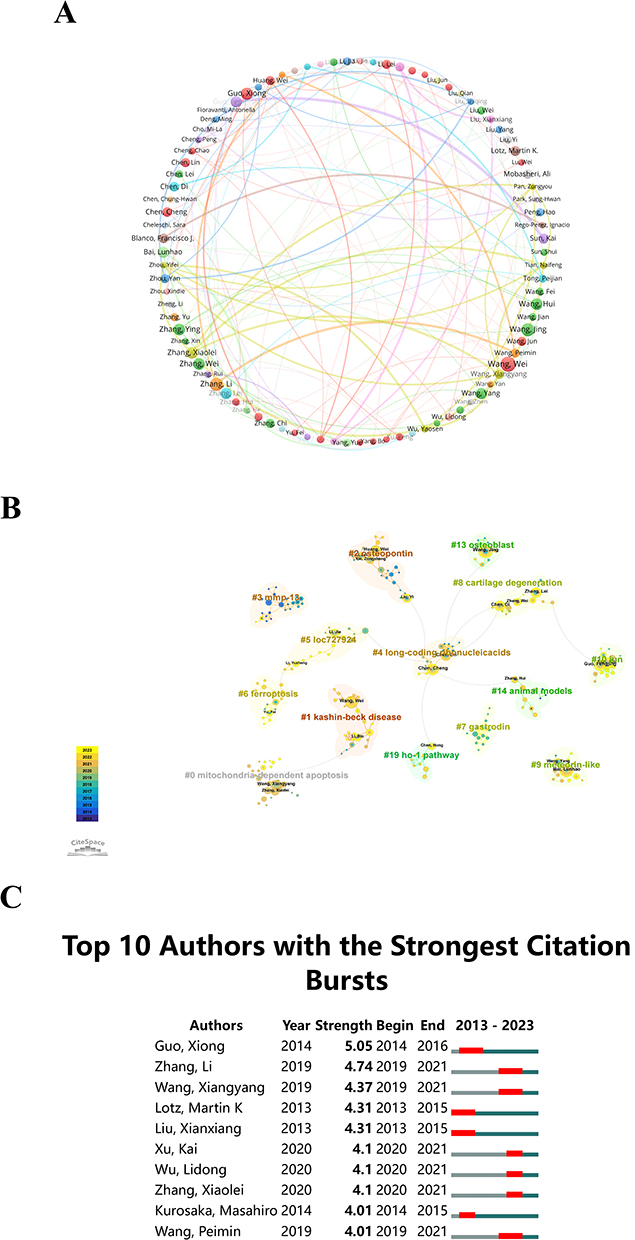 |
Figure 4 (A) Co-occurrence Map of Authors. Circles and text labels form a node, with different colors representing distinct clusters. (B) Cluster Analysis Chart of Authors. The superimposition of circle sizes, ie, the sum of the sizes corresponding to the tree rings, is directly proportional to the author’s publications; purple indicates earlier publication times, yellow represents later publication times, and overlaid colors signify publications by the author in the respective years. Connecting lines between circles represent co-authorship among authors. (C) Top 10 Authors with Strongest Citation Bursts in Publications Related to “Programmed Cell Death-Osteoarthritis”. |
The author cluster analysis chart depicted 218 nodes and 236 lines (Figure 4B). CiteSpace offers Modularity (Q value) and Mean Silhouette (S value) as measures derived from the network structure and clustering clarity. Q values exceeding 0.3 generally indicate substantial clustering structure, while S values surpassing 0.5 suggest reasonable clustering. The cluster module value (Q) recorded 0.8429, and the average silhouette value (S) was 0.9403. Hence, it is evident that the clustering structure of authors is notably significant and reasonably convincing. These authors were categorized into 14 clusters labeled as follows: #0 mitochondria-dependent apoptosis, #1 Kashin-Beck disease, #2 osteopontin, #3 Matrix Metalloproteinase 13, #4 long coding ribonucleic acids, #5 loc727924, #6 ferroptosis, #7 gastrodin, #8 cartilage generation, #9 meteorin-like, #10 jun, #13 osteoblast, #14 animal models, and #19 Heme Oxygenase-1 pathway. The categorization of authors into 14 clusters based on research themes allows researchers to align their work with specific clusters, fostering a more focused and thematic research approach. This categorization is equally valuable for companies or organizations seeking to initiate focused collaborations or identify experts in particular research domains.
Crucial indicators, known as citation bursts, unveil an author’s frequency of citations within a specific field over a designated period. Figure 4C showcases the top 10 authors with the highest citations related to PCD in OA. Guo Xiong takes the lead with a citation burst strength of 5.05, closely trailed by Zhang Li. Prominent authors, including Wang Xiangyang, Xu Kai, Wu Lidong, Zhang Xiaolei, and Wang Peimin, have notably increased their publication output in the past four years, signaling their dedicated focus on research in this area. These highly cited authors not only provide valuable insights into the “PCD-OA” field but also, to some extent, can serve as benchmarks guiding future research directions.
This section offers a wealth of information for both researchers and industry practitioners. It equips them to navigate the complex landscape of “PCD-OA” research, identify key contributors, explore collaboration opportunities, and stay informed about influential trends in the field.
Journals and Their Associated Fields Analysis
Visualizing journal publication data revealed articles on PCD in OA across 732 journals. Employing a minimum threshold of 15 documents per journal, we generated a thermodynamic chart illustrating the distribution of these documents across journals. The chart’s color intensity corresponded to the quantity of published journal documents (Figure 5A). To depict journal publications, clustering maps were crafted with a minimum publication threshold of 8 documents per journal (Figure 5B). Unique color regions denoted specific clustering details, and circle size directly correlated with the number of documents published by each journal. “Osteoarthritis and Cartilage” emerged as the leading journal, having published the highest number of documents (n = 114), closely followed by “International Journal of Molecular Sciences” (n = 95) and “International Immunopharmacology” (n = 89). Additionally, we compiled a list highlighting the top 20 journals with the highest citation rates for PCD-related publications in OA (Figure 5C). This information is crucial for researchers, aiding them in recognizing key platforms for disseminating their work and staying updated on the latest research trends.
 |
Figure 5 (A) Density Visualization Map of Journal Citations. The color intensity correlates directly with the volume of publications. (B) Journal Clustering Visualization Map. Circles and labels together form a node; the size of the circle is positively correlated with the journal’s publication volume, and colors represent different clusters. (C) Top 20 Journals with Strongest Citation Bursts in Publications related to Programmed Cell Death (PCD) in Osteoarthritis (OA). (D) Dual-map Overlay of Journals Related to PCD in OA. Every point in the graph signifies a journal, while the curves bridging the graph’s left and right parts represent citation connections. These trajectories offer insights into interdisciplinary relationships within the field and vividly showcase the inception and progression of citations. (E) Analysis of Research Subject Areas. Various colored spheres symbolize distinct converging fields. |
The dual maps effectively illustrate the interconnectedness of journals across disciplines, tracing the evolution of citations and shifts in scientific research hubs.44 These maps feature labels that highlight the various study areas covered by the journals. Positioned on the left are journals citing others, while those being cited are on the right. Colored lines visually trace reference paths, emanating from the citation map and reaching their endpoint. The width of these connecting pathways strongly correlates with the frequency of z-score-scaled citations.39 Additionally, the exploration of “PCD-OA” encompasses four main categories: molecular biology, immunology, genetics, and clinical medicine, as illustrated in Figure 5D. Understanding the interconnectedness of journals and the categories they cover is crucial for industry practitioners. It enables them to identify strategic collaborations and partnerships by recognizing the primary categories of research, including molecular biology, immunology, genetics, and clinical medicine, and aligning their interests with specific domains.
Visual analysis using VOSviewer software categorized 3,579 articles into five major fields, as displayed in Figure 5E. Each field is represented by differently colored spheres, signifying distinct domains. The analysis highlights a substantial amount of related research centered on the “Biology and Medicine” field. Within this domain, a considerable portion of articles delves into subdivisions such as “Cell Biology”, “Medicine (research & experimental)”, and “Pharmacology & Pharmacy”. This information provides industry practitioners with insights into the dominant research focus areas, guiding investment decisions, product development, and strategic planning in alignment with prevailing trends in “PCD-OA” research.
Furthermore, the comprehensive examination of journals and their respective domains provides researchers and practitioners with a holistic perspective on the publication landscape, influential journals, citation rates, and interdisciplinary collaborations within the realm of “PCD-OA” research. These findings can benefit both researchers and industry practitioners, enhancing their engagement, visibility, and impact in this dynamic field.
Co-Cited References and Construction of PPI Network
The reference cluster analysis atlas presents 218 nodes and 236 lines (Figure 6A). CiteSpace provides metrics such as module value (Modularity, Q value) and average silhouette (Mean Silhouette, S value) to evaluate network structure and clustering clarity. Generally, Q > 0.3 indicates significant clustering, while S > 0.5 suggests reasonable clustering. In this analysis, Q = 0.8429 and S = 0.9403, indicating significant and convincing clustering structures. This highlights the robustness of the citation clustering. These references were grouped into 16 clusters: #0 stem cells, #1 ferroptosis, #2 autophagy, #3 therapeutics, #4 long noncoding RNA, #5 microRNA, #6 mitophagy, #7 proliferation, #8 mechanical strain, #9 Nampt, #10 senescence, #11 IL-1 beta, #12 exosomes, #13 PI3K/AKT/mTOR signaling, #14 bone disease, #15 meteorin-like. It provides researchers with a comprehensive overview of the interconnectedness of various themes within the “PCD-OA” domain. This aids in identifying key areas of focus and potential interdisciplinary collaborations.
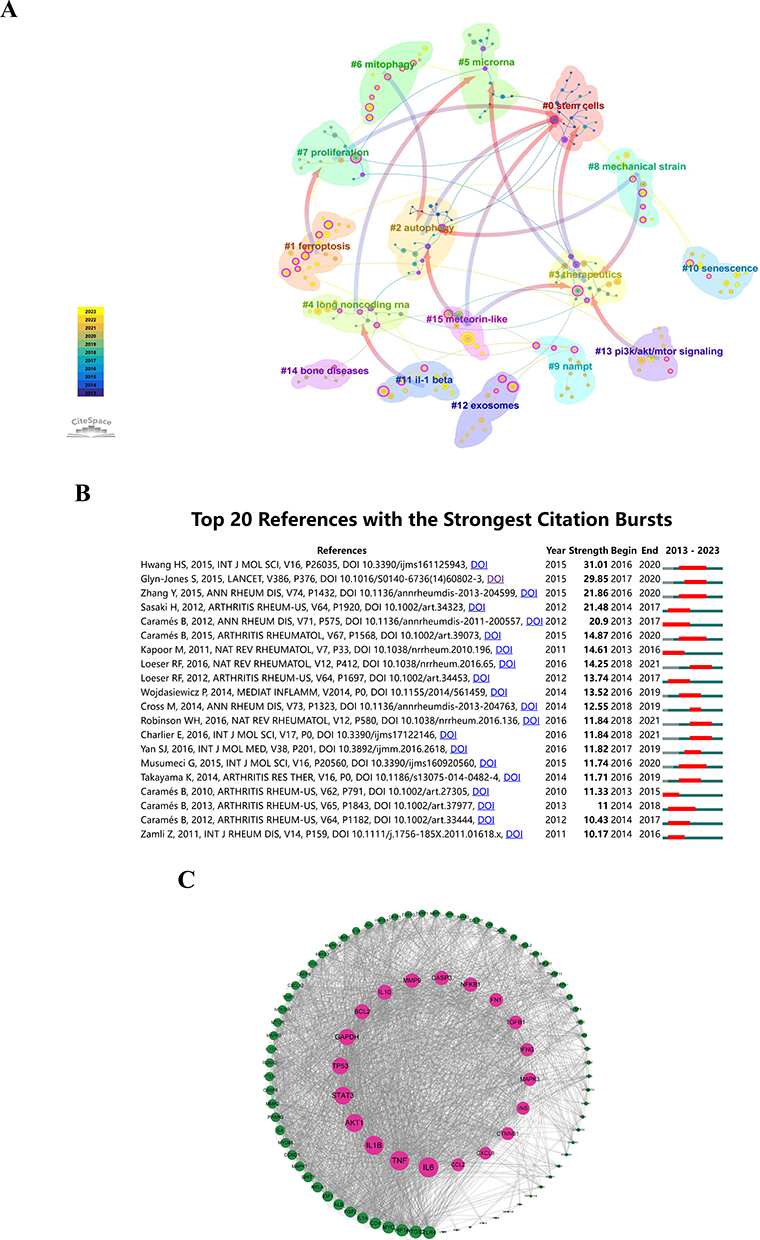 |
Figure 6 (A) Co-Citation Network of Literature. Overlaying the sizes of circles, ie, adding the sizes of circles corresponding to each annual ring, is proportional to the total citation count. Purple represents earlier citation times, yellow represents later citation times, and the overlaid colors indicate that the paper has been cited in corresponding years. The connecting lines between circles represent co-citation relationships, with nodes marked in magenta considered as key nodes with centrality greater than 0.1. (B) Top 20 References Showing Strongest Citation Bursts. (C) Protein-Protein Interaction Network Construction. |
CiteSpace’s examination of citation bursts proficiently detects studies that have attracted noteworthy attention. As illustrated in Figure 6B, the significant impact of the top 20 references in the “PCD-OA” domain is emphasized through their substantial citation bursts. The surge in citations for this field initiated in 2013, and numerous co-citation references persistently receive extensive citations in the following years, underscoring the enduring relevance of PCD in OA research. Among these references, 30% (6/20) of the citation bursts occurred in 2016, claiming the top spot, followed by 2014 (5/20, 25%) and 2018 (4/20, 20%) in second and third positions, respectively. The article with the most significant burst (strength = 31.01) was titled “Chondrocyte Apoptosis in the Pathogenesis of Osteoarthritis”, a review published in the International Journal of Molecular Sciences.45 It was followed by Glyn-Jones et al,46 and Zhang et al.47 Researchers can explore these references for in-depth insights and potentially leverage them as foundational knowledge for their own work. This is particularly relevant for industry practitioners, as understanding the pivotal studies can inform industry strategies, especially in areas related to drug development and therapeutic interventions.
In the construction of the PPI network using the STRING plugin in Cytoscape (Figure 6C), 100 nodes, 1,182 edges, and an average node degree of 23.6 were involved. Core proteins within the PPI network were identified by ranking the degree value using Cytoscape. The top 5 proteins identified—interleukin 6 (IL6), tumor necrosis factor (TNF), interleukin 1 beta (IL1B), AKT serine/threonine kinase 1 (AKT1), and signal transducer and activator of transcription 3 (STAT3)—are acknowledged as pivotal within the context of “PCD-OA”. The three most expressed proinflammatory cytokines in OA joints, namely IL-6, TNF, and IL1B, are actively synthesized by chondrocytes, synoviocytes, macrophages, and osteoblasts. They play a pivotal role in the development of OA by modulating oxidative stress and the turnover of cartilage ECM, making them critical targets for therapeutic intervention.48 Nevertheless, the elimination of IL1B or its converting enzyme, which are commonly associated with OA pathogenesis, accelerated the progression of experimental OA in the mouse model. This implies that complete elimination of IL1B or its converting enzyme exacerbates OA development.49,50 The findings demonstrate that proinflammatory cytokines, implicated in OA pathogenesis, also contribute to chondrocyte homeostasis and the maintenance of joint health. Achieving a delicate balance of these inflammatory mediators is crucial for normal joint function, underscoring the incomplete understanding of this area.48 More extensive investigation is anticipated.
Endochondral ossification, vital not only for physiological skeletal development but also for pathological conditions like osteophyte formation in OA advancement, is mediated by phosphoinositide-dependent serine/threonine protein kinase (AKT). This kinase serves as a robust mediator of both systemic and local factors, such as insulin, bone morphogenetic proteins, and Wnt proteins, all of which play critical roles in the endochondral ossification pathway.51,52 AKT1 is a member of the AKT family, which exhibits similar expression patterns across various tissues.53 Prior studies have suggested that AKT1, a versatile kinase involved in transmitting diverse upstream signals to a wide range of substrates, facilitates cartilage calcification by suppressing the accumulation of inorganic pyrophosphate (PPi) in chondrocytes. This regulatory mechanism thereby governs both endochondral ossification in skeletal development and osteophyte formation in OA.54 While directly targeting this molecule for the development of new therapies targeting OA might pose challenges given its widespread expression and multifaceted functions, delving deeper into the molecular network associated with the AKT1/PPi axis promises to elucidate the intricate mechanism governing the endochondral ossification process.
Activated by inflammatory cytokines or growth factors, STAT3, a cytoplasmic transcription factor, translocates to the nucleus, where it modulates DNA transcription.55 Due to its pivotal role in various biological processes including proliferation, differentiation, anti-apoptosis, inflammatory response, and angiogenesis, STAT3 has garnered significant attention in research circles, emerging as a focal point of investigation.56,57 A growing body of literature suggests that STAT3 regulates various pathways involved in OA, encompassing inflammatory responses, cartilage degradation, and macrophage polarization.58–60 Nevertheless, the involvement of STAT3 in OA regulation remains inadequately elucidated, indicating a considerable journey from laboratory research to clinical application.
The insights derived from the PPI network, highlighting core proteins crucial in the context of “PCD-OA”, offer valuable information for practitioners involved in developing pharmaceutical interventions. This understanding of key proteins in molecular pathways can guide the development of targeted therapies. Researchers can explore these proteins for potential therapeutic targets and mechanistic investigations.
Analysis of Keywords
Keywords within academic papers serve as essential indicators, reflecting the current knowledge base and guiding advancements within a scholarly field. Figure 7A illustrates the yearly popularity of keywords (number of citations in the year divided by total citations in the year) from 2013 to 2023. “Chondrogenesis” and “fibroblast-like synoviocytes” have displayed relatively diminished annual popularity in recent years. Conversely, “bioinformatics analysis” and “ferroptosis” have shown increased annual popularity, indicating emerging areas of interest. Researchers can adapt their projects to align with emerging areas of interest, such as “bioinformatics analysis” and “ferroptosis”, ensuring that their work remains relevant and impactful. Keyword bursts indicate significant increases in citations during specific periods.61 Figure 7B presents the top 10 emerging keywords, suggesting that research focus between 2013 and 2014 centered on “nitric oxide”, “MMPs”, and “hyaluronic acid”. Present hotspots mainly include “extracellular vesicles”, “long non-coding RNA”, and “circular RNA”, serves as a guide for researchers to explore new research avenues. This information aids in identifying emerging trends that have gained prominence, presenting opportunities for innovative investigations.
 |
Figure 7 (A) Annual Heatmap Covering 2013 to 2023. The annual heat value of each keyword is obtained by dividing the number of citations in that year by the total number of citations in that year. (B) Top 10 Keywords Demonstrating Most Prominent Citation Bursts in CiteSpace. (C) Visualization of Keyword Clustering. Spheres and labels constitute a node, where the size of the sphere is positively correlated with the frequency of keyword occurrence. The thickness of the lines connecting spheres is positively correlated with the strength of the relationships between keywords. Nodes of different colors form different clusters, with each color representing a distinct research direction. Using a clustering algorithm based on keyword co-occurrence, the similarity between keywords is calculated, and keywords with high similarity are assigned to the same cluster. (D) Graph Illustrating Heat Trend of Keywords. The curve’s fluctuation illustrates the trend of ranking changes. The hollow circle represents the time period from January 1st, 2013, to October 31st, 2023, indicating when the keyword first entered the top 50, while the solid circle represents the endpoint when the keyword appeared consistently in the top 50. |
To visually represent these trends, we constructed a comprehensive map (Figure 7C) through co-occurrence cluster analysis of keywords. In this map, nodes are depicted as circles, varying in size based on each keyword’s frequency. The strength of relationships among keywords is depicted by the connections between these nodes. Furthermore, these nodes are categorized into distinct color-coded clusters, representing different research directions. Five clusters in total were recognized. Notably, the benefits of co-occurrence cluster analysis extend beyond researchers to include collaborative opportunities for industry practitioners. By identifying clusters and relationships among keywords, industry professionals can explore partnerships with research institutions and contribute to advancements in the field. Moving on to the analysis of keywords from articles published between 2013 and 2023, a trend chart (Figure 7D) was generated to illustrate keyword heat trends over the last decade, accompanied by ranking trend curves. For example, “pyroptosis” entered the top 50 for the first time between 2020 and 2021 and has consistently gained popularity since then. In contrast, “ferroptosis” has maintained enduring high popularity without decline. The graph incorporates open circles to signify periods when a keyword emerged over nearly a decade of research, while filled circles indicate when a keyword faded from prominence. Researchers can leverage this information to understand the persistence of certain keywords, anticipate shifts, and strategically plan their research trajectories.
Overall, the analysis of keywords provides a roadmap for researchers and industry practitioners to navigate the dynamic landscape of “PCD-OA”. It not only facilitates strategic decision-making and fosters collaboration but also ensures that both research and industry practices stay at the forefront of innovation in the field.
Key Genes and Signaling Pathways
Exploring crucial genes and pathways is instrumental in gaining a rapid understanding of key gene targets associated with “PCD-OA”. In this regard, a visual map (Figure 8A) was generated through co-occurrence cluster analysis, focusing specifically on genes appearing at least 50 times within “PCD-OA”. Labeled nodes, varying in size based on the frequency of gene occurrence, represent key genes. The strength of connections between these nodes is depicted by the thickness of connecting lines. Different node colors signify diverse gene clusters, spanning various domains. This approach aids in prioritizing and targeting specific genes for in-depth studies and functional analyses. Notably, industry practitioners in pharmaceuticals and biotechnology can leverage the identified crucial genes as potential targets for therapeutic development, offering opportunities to design drugs that may modulate or target these specific genes to alleviate OA symptoms. Simultaneously, researchers can gain insights into the interconnectedness of genes, potentially uncovering regulatory networks or collaborative functions contributing to OA progression.
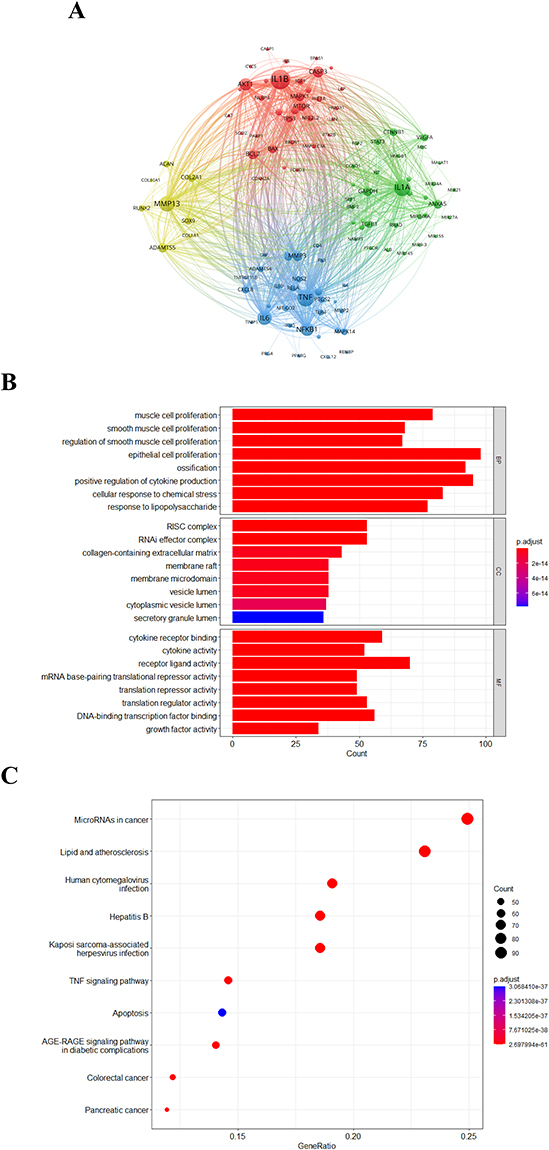 |
Figure 8 (A) VOSviewer Visualization of Critical Gene Clustering. Spheres and labels constitute a node, where the size of the sphere is positively correlated with the frequency of gene occurrence. The thickness of the lines connecting spheres is positively correlated with the strength of relationships between genes. Nodes of different colors form different clusters, where each color represents gene clustering in different domains, representing a specific biological or medical field of gene groups. (B) Analysis of Gene Ontology (GO) Pathway Enrichment. In the bubble chart of GO enrichment analysis, each bubble represents a GO Term, where the size of the bubble reflects the number of genes included in this function, and the color indicates the degree of enrichment for this function. The X-axis represents the GeneRatio value, which is the proportion of the number of genes associated with the GO Term in the background gene set (the entire genome of the human species under study). A higher GeneRatio value on the X-axis indicates a greater number of genes associated with that GO Term, and it may be more significant. The Y-axis represents the terms or categories of GO Terms, where each node corresponds to a specific biological process, molecular function, or cellular component. If the GeneRatio of a certain GO Term is significantly higher than the expected value, it indicates that this GO Term may have important biological functions in the experiment. (C) Bubble Plots Depicting Kyoto Encyclopedia of Genes and Genomes (KEGG) Enrichment Analysis. KEGG pathway enrichment analysis selected the top 10 signaling pathways and plotted a bar chart. The X-axis represents the number of significantly enriched genes in each pathway, and the Y-axis represents different signaling pathways. The longer the bar, the more genes in that category; red indicates significantly enriched pathways after enrichment, while blue represents less significant pathways. |
Moreover, we performed enrichment analyses using GO and KEGG on genes related to “PCD-OA”, particularly emphasizing the 455 genes mentioned more than 11 times in the article (Figure 8B and C). The GO pathway enrichment analysis is presented in a histogram format, revealing the top 20 signaling pathways. Each pathway is depicted on the X-axis, with the gene count significantly enriched, and the Y-axis represents distinct signaling pathways. The height of each histogram column indicates both the gene count within the pathway and its level of enrichment significance. Enriched biological processes (BP), molecular functions (MF), and cellular components (CC) are displayed in Figure 8B. Biological processes include “muscle cell proliferation” and “smooth muscle cell proliferation”, while cellular components show enrichment in “RISC complex” and “RNAi effector complex”. Molecular functions exhibit enrichment in “cytokine receptor binding” and “cytokine activity”. This information proves valuable for elucidating the underlying mechanisms of PCD in OA, aiding researchers in formulating hypotheses and designing targeted experiments.
Moving to the KEGG enrichment analysis, depicted in a bubble chart, each bubble represents a specific KEGG term. The size of each bubble corresponds to the number of genes associated with that particular function, while the color indicates the level of enrichment. On the X-axis, the GeneRatio value indicates the proportion of genes associated with the KEGG term within the total gene set. A higher GeneRatio value implies a larger number of genes linked to the KEGG term, suggesting potentially greater significance. On the Y-axis, various KEGG terms are categorized into distinct biological processes, molecular functions, or cellular components. Figure 8C illustrates that this subject primarily aligns with signaling pathways such as “MicroRNAs in cancer” and “Lipid and atherosclerosis”. Notably, OA, an age-related ailment, commonly affects middle-aged and elderly individuals. This demographic group is also prone to other conditions such as cancer, cardiovascular diseases, and cerebrovascular disorders like atherosclerosis. Therefore, further research is needed to investigate the interaction between PCD and the aforementioned signaling pathways in the context of an aging global population, aiming to identify potential targets for synergistic combination therapy. The detailed information provided by the enrichment analyses allows industry practitioners to make informed decisions regarding the development of therapeutic interventions. Understanding the specific biological processes and pathways enriched in OA contributes to a more targeted and effective approach in drug development.
Strengths & Limitations
The use of scientometric tools enriches the depiction of research trends and focal points across various dimensions, diverging from previous approaches that solely relied on meta-analyses or narrative reviews.7,62 In this inaugural scientometric exploration, the study maps and characterizes the knowledge landscapes associated with “PCD-OA” over the past decade. It stands as a comprehensive and impartial reference for future advancements, notwithstanding inherent limitations.
However, this study encounters several limitations. Firstly, the exclusive extraction of publications from WoSCC due to software limitations unavoidably introduces selection bias. Secondly, elements such as the time of publication, research domain, periodical, and authorship may markedly impact the citation count of a paper, potentially distorting the assessment of its influence. Thirdly, the vast number of papers rendered a thorough review and detailed analysis of subfields impractical, leading to the equal consideration of high and low-quality publications, which could impact the study’s credibility. Fourthly, inherent biases in natural language processing, noted in previous scientometric investigations, remain a concern.62–67 Fifthly, the incorporation of exclusively English documents may introduce a bias in publication. Lastly, limitations in literature retrieval might exclude newly published literature and crucial keywords, impacting the completeness of the statistical analysis.
Conclusion
In this investigation, scientometric analysis explores the domain of PCD associated with OA, concentrating particularly on international collaboration, publication patterns, and pivotal research areas. These findings provide valuable insights for the scientific community, enabling a deeper understanding of emerging concepts and critical domains that will shape the future of PCD research in OA. Staying abreast of these trends and leveraging existing knowledge remains crucial for researchers to drive advancements in this field. Moving forward, the development of OA treatments should strategically target various forms of PCD and explore the intricate signaling pathways regulating its progression. Promisingly, molecules capable of inhibiting PCD show potential as therapeutic agents for OA. Despite the inherent challenges, a comprehensive approach encompassing both experimental and clinical research can harness PCD as a promising target for developing therapeutic drugs against OA.
Acknowledgments
We extend our special thanks to all the researchers who have made invaluable contributions to this field. Our sincere appreciation goes to Home for Researchers (https://www.home-for-researchers.com) for their assistance with language editing, and we are grateful to all the funding organizations supporting this work. Figdraw (https://www.figdraw.com/static/index.html#/) was utilized for the production of the graphic abstract.
Funding
Grants for this study were provided by various sources, including the National Natural Science Foundation of China (No. 82172432, 82102568, 82001319), the National & Local Joint Engineering Research Centre of Orthopaedic Biomaterials (No. XMHT20190204007), the Guangdong Basic and Applied Basic Research Foundation (No. 2021A1515012586, 2021A1515220054, 2022B1515120046, 2022A1515220038, 2022A1515220111, 2021A1515220037, 2022A1515220165), the Shenzhen High-Level Hospital Construction Fund, the Shenzhen Key Laboratory of Orthopaedic Diseases and Biomaterials Research (No. ZDSYS20220606100602005), the Shenzhen Key Medical Discipline Construction Fund (No. SZXK023), the Sanming Project of Medicine in Shenzhen (No. SZSM202211038), the Research and Development Projects of Shenzhen (No. JCYJ20210324110214040, JCYJ20220531094214032, JCYJ20190809152409606, JCYJ20210324105806016, JCYJ20220531094406015), the Shenzhen Sustainable Development Project (No. KCXFZ20201221173411031), and the Scientific Research Foundation of Peking University Shenzhen Hospital (No. KYQD2021099).
Disclosure
The authors report no conflicts of interest in this work.
References
1. Hunter D, Bierma-Zeinstra S. Osteoarthritis. Lancet. 2019;393(10182):1745–1759. doi:10.1016/s0140-6736(19)30417-9
2. Hunter D, March L, Chew M. Osteoarthritis in 2020 and beyond: a Lancet Commission. Lancet. 2020;396(10264):1711–1712. doi:10.1016/s0140-6736(20)32230-3
3. O’Neill T, McCabe P, McBeth J. Update on the epidemiology, risk factors and disease outcomes of osteoarthritis. Best Pract Res. 2018;32(2):312–326. doi:10.1016/j.berh.2018.10.007
4. Cao S, Wei Y, Xu H, et al. Crosstalk between ferroptosis and chondrocytes in osteoarthritis: a systematic review of in vivo and in vitro studies. Front Immunol. 2023;14:1202436. doi:10.3389/fimmu.2023.1202436
5. Yuan C, Pan Z, Zhao K, et al. Classification of four distinct osteoarthritis subtypes with a knee joint tissue transcriptome atlas. Bone Res. 2020;8(1):38. doi:10.1038/s41413-020-00109-x
6. Fischenich KM, Wahlquist JA, Wilmoth RL, Cai L, Neu CP, Ferguson VL. Human articular cartilage is orthotropic where microstructure, micromechanics, and chemistry vary with depth and split-line orientation. Osteoarthritis Cartilage. 2020;28(10):1362–1372. doi:10.1016/j.joca.2020.06.007
7. Chen B, Wang L, Xie D, Wang Y. Exploration and breakthrough in the mode of chondrocyte death - A potential new mechanism for osteoarthritis. Biomed Pharmacother. 2024;170:115990. doi:10.1016/j.biopha.2023.115990
8. Ratneswaran A, Rockel JS, Kapoor M. Understanding osteoarthritis pathogenesis: a multiomics system-based approach. Curr Opin Rheumatol. 2020;32(1):80–91. doi:10.1097/bor.0000000000000680
9. Vincent TL. Mechanoflammation in osteoarthritis pathogenesis. Semin Arthritis Rheum. 2019;49(3s):S36–s38. doi:10.1016/j.semarthrit.2019.09.018
10. Yang J, Hu S, Bian Y, et al. Targeting cell death: pyroptosis, ferroptosis, apoptosis and necroptosis in osteoarthritis. Front Cell Dev Biol. 2021;9:789948. doi:10.3389/fcell.2021.789948
11. Tong L, Yu H, Huang X, et al. Current understanding of osteoarthritis pathogenesis and relevant new approaches. Bone Res. 2022;10(1):60. doi:10.1038/s41413-022-00226-9
12. Musumeci G, Castrogiovanni P, Trovato FM, et al. Biomarkers of chondrocyte apoptosis and autophagy in osteoarthritis. Int J Mol Sci. 2015;16(9):20560–20575. doi:10.3390/ijms160920560
13. Galluzzi. L, Vitale. I, Aaronson SA, et al. Molecular mechanisms of cell death: recommendations of the nomenclature committee on cell death 2018. Cell Death Differ. 2018;25(3):486–541. doi:10.1038/s41418-017-0012-4
14. Nagata S, Tanaka M. Programmed cell death and the immune system. Nat Rev Immunol. 2017;17(5):333–340. doi:10.1038/nri.2016.153
15. Strzyz P. Cell death: pulling the apoptotic trigger for necrosis. Nat Rev Mol Cell Biol. 2017;18(2):72. doi:10.1038/nrm.2017.1
16. Tang D, Kang R, Berghe TV, Vandenabeele P, Kroemer G. The molecular machinery of regulated cell death. Cell Res. 2019;29(5):347–364. doi:10.1038/s41422-019-0164-5
17. Rim YA, Nam Y, Ju JH. The role of chondrocyte hypertrophy and senescence in osteoarthritis initiation and progression. Int J Mol Sci. 2020;21(7):2358. doi:10.3390/ijms21072358
18. Rellmann Y, Eidhof E, Dreier R. Review: ER stress-induced cell death in osteoarthritic cartilage. Cell Signal. 2021;78:109880. doi:10.1016/j.cellsig.2020.109880
19. Klionsky DJ, Emr SD. Autophagy as a regulated pathway of cellular degradation. Science. 2000;290(5497):1717–1721. doi:10.1126/science.290.5497.1717
20. Dixon S, Lemberg K, Lamprecht M, et al. Ferroptosis: an iron-dependent form of nonapoptotic cell death. Cell. 2012;149(5):1060–1072. doi:10.1016/j.cell.2012.03.042
21. Weinlich R, Oberst A, Beere HM, Green DR. Necroptosis in development, inflammation and disease. Nat Rev Mol Cell Biol. 2017;18(2):127–136. doi:10.1038/nrm.2016.149
22. Shi J, Zhao Y, Wang K, et al. Cleavage of GSDMD by inflammatory caspases determines pyroptotic cell death. Nature. 2015;526:660–5. doi:10.1038/nature15514
23. Tsvetkov P, Coy S, Petrova B, et al. Copper induces cell death by targeting lipoylated TCA cycle proteins. Science. 2022;375(6586):1254–1261. doi:10.1126/science.abf0529
24. Liu X, Nie L, Zhang Y, et al. Actin cytoskeleton vulnerability to disulfide stress mediates disulfidptosis. Nat Cell Biol. 2023;25(3):404–414. doi:10.1038/s41556-023-01091-2
25. Liu S, Pan Y, Li T, et al. The role of regulated programmed cell death in osteoarthritis: from pathogenesis to therapy. Int J Mol Sci. 2023;24(6).doi:10.3390/ijms24065364
26. Gao L, Hua W, Tian L, et al. Molecular mechanism of ferroptosis in orthopedic diseases. Cells. 2022;11(19):2979. doi:10.3390/cells11192979
27. Zhou J, Qiu J, Song Y, et al. Pyroptosis and degenerative diseases of the elderly. Cell Death Dis. 2023;14(2):94. doi:10.1038/s41419-023-05634-1
28. Chang B, Hu Z, Chen L, Jin Z, Yang Y. Development and validation of cuproptosis-related genes in synovitis during osteoarthritis progress. Front Immunol. 2023;14:1090596. doi:10.3389/fimmu.2023.1090596
29. Ru Q, Li Y, Xie W, et al. Fighting age-related orthopedic diseases: focusing on ferroptosis. Bone Res. 2023;11(1):12. doi:10.1038/s41413-023-00247-y
30. Sun K, Guo Z, Zhang J, et al. Inhibition of TRADD ameliorates chondrocyte necroptosis and osteoarthritis by blocking RIPK1-TAK1 pathway and restoring autophagy. Cell Death Discov. 2023;9(1):109. doi:10.1038/s41420-023-01406-0
31. Arias C, Salazar LA. Autophagy and polyphenols in osteoarthritis: a focus on epigenetic regulation. Int J Mol Sci. 2021;23(1):421. doi:10.3390/ijms23010421
32. Fuchs Y, Steller H. Programmed cell death in animal development and disease. Cell. 2011;147(4):742–758. doi:10.1016/j.cell.2011.10.033
33. Zhu R, Wang Y, Ouyang Z, et al. Targeting regulated chondrocyte death in osteoarthritis therapy. Biochem Pharmacol. 2023;215:115707. doi:10.1016/j.bcp.2023.115707
34. Komori T. Cell death in chondrocytes, osteoblasts, and osteocytes. Int J Mol Sci. 2016;17(12):2045. doi:10.3390/ijms17122045
35. An S, Hu H, Li Y, Hu Y. Pyroptosis plays a role in osteoarthritis. Aging Dis. 2020;11(5):1146–1157. doi:10.14336/ad.2019.1127
36. Zhang XL, Zheng Y, Xia ML, et al. Knowledge domain and emerging trends in vinegar research: A bibliometric review of the literature from WoSCC. Foods. 2020;9(2):166. doi:10.3390/foods9020166
37. Boudry C, Baudouin C, Mouriaux F. International publication trends in dry eye disease research: a bibliometric analysis. Ocular Surf. 2018;16(1):173–179. doi:10.1016/j.jtos.2017.10.002
38. Ling LX, Ouyang Y, Hu Y. Research trends on nanomaterials in gastric cancer: a bibliometric analysis from 2004 to 2023. J Nanobiotechnology. 2023;21(1):248. doi:10.1186/s12951-023-02033-8
39. Pei Z, Chen S, Ding L, et al. Current perspectives and trend of nanomedicine in cancer: a review and bibliometric analysis. J Control Release. 2022;352:211–241. doi:10.1016/j.jconrel.2022.10.023
40. Yeung AWK. Comparison between Scopus, Web of Science, PubMed and publishers for mislabelled review papers. Current Science. 2019;116:1909–1914. doi:10.18520/cs/v116/i11/1909-1914
41. Koo M. Systemic lupus erythematosus research: A bibliometric analysis over a 50-year period. Int J Environ Res Public Health. 2021;18:7095. doi:10.3390/ijerph18137095
42. Joshi MA. Bibliometric indicators for evaluating the quality of scientifc publications. J Contemp Dent Pract. 2014;15:258–262. doi:10.5005/jp-journals-10024-1525
43. Dara M, Sulis G, Centis R, et al. Cross-border collaboration for improved tuberculosis prevention and care: policies, tools and experiences. Int J Tuberc Lung Dis. 2017;21:727–736. doi:10.5588/ijtld.16.0940
44. Yuan R, Tan Y, Sun P-H, Qin B, Liang Z. Emerging trends and research foci of berberine on tumor from 2002 to 2021: a bibliometric article of the literature from WoSCC. Front Pharmacol. 2023;14:1122890. doi:10.3389/fphar.2023.1122890
45. Hwang HS, Kim HA. Chondrocyte apoptosis in the pathogenesis of osteoarthritis. Int J Mol Sci. 2015;16(11):26035–26054. doi:10.3390/ijms161125943
46. Glyn-Jones S, Palmer AJ, Agricola R, et al. Osteoarthritis. Lancet. 2015;386:376–87. doi:10.1016/s0140-6736(14)60802-3
47. Zhang Y, Vasheghani F, Li YH, et al. Cartilage-specific deletion of mTOR upregulates autophagy and protects mice from osteoarthritis. Ann Rheumatic Dis. 2015;74(7):1432–1440. doi:10.3389/fcell.2021.789948
48. Ansari MY, Ahmad N, Haqqi TM. Oxidative stress and inflammation in osteoarthritis pathogenesis: Role of polyphenols. Biomed Pharmacother. 2020;129:110452. doi:10.1016/j.biopha.2020.110452
49. Clements KM, Price JS, Chambers MG, Visco DM, Poole AR, Mason RM. Gene deletion of either interleukin-1beta, interleukin-1beta-converting enzyme, inducible nitric oxide synthase, or stromelysin 1 accelerates the development of knee osteoarthritis in mice after surgical transection of the medial collateral ligament and partial medial meniscectomy. Arthritis Rheum. 2003;48(12):3452–3463. doi:10.1002/art.11355
50. Nasi S, Ea HK, So A, Busso N. Revisiting the Role of Interleukin-1 Pathway in Osteoarthritis: Interleukin-1α and -1β, and NLRP3 Inflammasome Are Not Involved in the Pathological Features of the Murine Menisectomy Model of Osteoarthritis. Front Pharmacol. 2017;8:282. doi:10.3389/fphar.2017.00282
51. Ghosh-Choudhury N, Abboud SL, Nishimura R, Celeste A, Mahimainathan L, Choudhury GG. Requirement of BMP-2-induced phosphatidylinositol 3-kinase and Akt serine/threonine kinase in osteoblast differentiation and Smad-dependent BMP-2 gene transcription. J Biol Chem. 2002;277(36):33361–33368. doi:10.1074/jbc.M205053200
52. Almeida M, Han L, Bellido T, Manolagas SC, Kousteni S. Wnt proteins prevent apoptosis of both uncommitted osteoblast progenitors and differentiated osteoblasts by beta-catenin-dependent and -independent signaling cascades involving Src/ERK and phosphatidylinositol 3-kinase/AKT. J Biol Chem. 2005;280(50):41342–41351. doi:10.1074/jbc.M502168200
53. Dummler B, Hemmings BA. Physiological roles of PKB/Akt isoforms in development and disease. Biochem Soc Trans. 2007;35(Pt 2):231–235. doi:10.1042/bst0350231
54. Fukai A, Kawamura N, Saito T, et al. Akt1 in murine chondrocytes controls cartilage calcification during endochondral ossification under physiologic and pathologic conditions. Arthritis Rheum. 2010;62(3):826–836. doi:10.1002/art.27296
55. Yu H, Pardoll D, Jove R. STATs in cancer inflammation and immunity: a leading role for STAT3. Nat Rev Cancer. 2009;9(11):798–809. doi:10.1038/nrc2734
56. Cheng WX, Huang H, Chen JH, et al. Genistein inhibits angiogenesis developed during rheumatoid arthritis through the IL-6/JAK2/STAT3/VEGF signalling pathway. J Orthop Translat. 2020;22:92–100. doi:10.1016/j.jot.2019.07.007
57. Tian ZC, Wang JQ, Ge H. Apatinib ameliorates doxorubicin-induced migration and cancer stemness of osteosarcoma cells by inhibiting Sox2 via STAT3 signalling. J Orthop Translat. 2020;22:132–141. doi:10.1016/j.jot.2019.07.003
58. Li J, Yin Z, Huang B, Xu K, Su J. Stat3 signaling pathway: A future therapeutic target for bone-related diseases. Front Pharmacol. 2022;13:897539. doi:10.3389/fphar.2022.897539
59. Latourte A, Cherifi C, Maillet J, et al. Systemic inhibition of IL-6/Stat3 signalling protects against experimental osteoarthritis. Ann Rheum Dis. 2017;76(4):748–755. doi:10.1136/annrheumdis-2016-209757
60. Tian Z, Zeng F, Zhao C, Dong S. Angelicin alleviates post-trauma osteoarthritis progression by regulating macrophage polarization via STAT3 signaling pathway. Front Pharmacol. 2021;12:669213. doi:10.3389/fphar.2021.669213
61. Chen C. Science mapping: a systematic review of the literature. J Data Inf Sci. 2017;2(2):1–40. doi:10.1515/jdis-2017-0006
62. Zhang J, Song L, Jia J, et al. Knowledge mapping of necroptosis from 2012 to 2021: a bibliometric analysis. Front Immunol. 2022;13:917155. doi:10.3389/fimmu.2022.917155
63. Yan W-T, Lu S, Yang Y-D, et al. Research trends, hot spots and prospects for necroptosis in the field of neuroscience. Neural Regen Res. 2021;16:1628–1637. doi:10.4103/1673-5374.303032
64. Zhang Q, Dehaini D, Zhang Y, et al. Neutrophil membrane-coated nanoparticles inhibit synovial inflammation and alleviate joint damage in inflammatory arthritis. Nat Nanotechnol. 2018;13:1182–1190. doi:10.1038/s41565-018-0254-4
65. Cao S, Wei Y, Yao Z, et al. A bibliometric and visualized analysis of nanoparticles in musculoskeletal diseases (from 2013 to 2023). Comput Biol Med. 2024;169:107867. doi:10.1016/j.compbiomed.2023.107867
66. Cao S, Wei Y, Yue Y, Liu P, Zeng H. Global research landscape on the crosstalk between ferroptosis and musculoskeletal diseases: a bibliometric and visualized analysis. Heliyon. 2023;9(12):e23113. doi:10.1016/j.heliyon.2023.e23113
67. Cao S, Wei Y, Yue Y, et al. Targeting ferroptosis unveils a new era for traditional Chinese medicine: a scientific metrology study. Front Pharmacol. 2024;15:1366852. doi:10.3389/fphar.2024.1366852
 © 2024 The Author(s). This work is published and licensed by Dove Medical Press Limited. The full terms of this license are available at https://www.dovepress.com/terms.php and incorporate the Creative Commons Attribution - Non Commercial (unported, v3.0) License.
By accessing the work you hereby accept the Terms. Non-commercial uses of the work are permitted without any further permission from Dove Medical Press Limited, provided the work is properly attributed. For permission for commercial use of this work, please see paragraphs 4.2 and 5 of our Terms.
© 2024 The Author(s). This work is published and licensed by Dove Medical Press Limited. The full terms of this license are available at https://www.dovepress.com/terms.php and incorporate the Creative Commons Attribution - Non Commercial (unported, v3.0) License.
By accessing the work you hereby accept the Terms. Non-commercial uses of the work are permitted without any further permission from Dove Medical Press Limited, provided the work is properly attributed. For permission for commercial use of this work, please see paragraphs 4.2 and 5 of our Terms.